Workshop on the use of automatic measuring systems on glaciers
Workshop on the use of automatic measuring systems on glaciers
Workshop on the use of automatic measuring systems on glaciers

Create successful ePaper yourself
Turn your PDF publications into a flip-book with our unique Google optimized e-Paper software.
<str<strong>on</strong>g>Workshop</str<strong>on</strong>g> <strong>on</strong> <strong>the</strong> <strong>use</strong> <strong>of</strong><br />
<strong>automatic</strong> <strong>measuring</strong> <strong>systems</strong><br />
<strong>on</strong> <strong>glaciers</strong><br />
Extended abstracts<br />
and recommendati<strong>on</strong>s<br />
IASC <str<strong>on</strong>g>Workshop</str<strong>on</strong>g>, 23-26 March 2011,<br />
P<strong>on</strong>tresina (Switzerland)<br />
Institute for Marine and Atmospheric Research,<br />
Utrecht University, <strong>the</strong> Ne<strong>the</strong>rlands
<str<strong>on</strong>g>Workshop</str<strong>on</strong>g> <strong>on</strong> <strong>the</strong> <strong>use</strong> <strong>of</strong><br />
<strong>automatic</strong> <strong>measuring</strong> <strong>systems</strong><br />
<strong>on</strong> <strong>glaciers</strong><br />
Extended abstracts and recommendati<strong>on</strong>s<br />
IASC <str<strong>on</strong>g>Workshop</str<strong>on</strong>g>, 23-26 March 2011,<br />
P<strong>on</strong>tresina (Switzerland)<br />
Organised by C.H. Tijm-Reijmer and J. Oerlemans<br />
Institute for Marine and Atmospheric Research<br />
Utrecht, Utrecht University, <strong>the</strong> Ne<strong>the</strong>rlands
ISBN: 978-90-39356555
C<strong>on</strong>tents<br />
Preface . . . . . . . . . . . . . . . . . . . . . . . . . . . . . . . . . . . . . . . . 3<br />
Program . . . . . . . . . . . . . . . . . . . . . . . . . . . . . . . . . . . . . . . 5<br />
Posters . . . . . . . . . . . . . . . . . . . . . . . . . . . . . . . . . . . . . . . . 8<br />
Participants . . . . . . . . . . . . . . . . . . . . . . . . . . . . . . . . . . . . 9<br />
<str<strong>on</strong>g>Workshop</str<strong>on</strong>g> summary and recommendati<strong>on</strong>s . . . . . . . . . . . . . . 11<br />
C.H. Reijmer<br />
Abstracts . . . . . . . . . . . . . . . . . . . . . . . . . . . . . . . . . . . . . . . . . . . . 16<br />
Automated m<strong>on</strong>itoring <strong>of</strong> hydrochemistry above and below <strong>glaciers</strong> 17<br />
L. Bagshaw, J. Wadham, S. Burrow, M. Mowlem, M. Tranter, A. Fountain,<br />
C. Butler<br />
Design and performance <strong>of</strong> <strong>the</strong> GEUS AWS . . . . . . . . . . . . . . . 22<br />
M. Citterio<br />
Installing a high-altitude wea<strong>the</strong>r stati<strong>on</strong> network in <strong>the</strong> high Argentinean<br />
Andes . . . . . . . . . . . . . . . . . . . . . . . . . . . . . . . . 27<br />
S.A. Crespo<br />
AWS measurements <strong>on</strong> <strong>glaciers</strong> in <strong>the</strong> Italian Alps . . . . . . . . . . . 31<br />
G. Diolaiuti, A. Senese, C. Mihalcea, G.P. Verza, B. Mosc<strong>on</strong>i and C. Smiraglia<br />
WMO’s Global Cryosphere Watch (GCW) and incorporati<strong>on</strong> <strong>of</strong> insitu<br />
Glacier Observati<strong>on</strong>s . . . . . . . . . . . . . . . . . . . . . . . . . . . 36<br />
B. Goodis<strong>on</strong><br />
AWS measurements at <strong>the</strong> Belgian Antarctic stati<strong>on</strong> Princess Elisabeth,<br />
in Dr<strong>on</strong>ning Maud Land, for precipitati<strong>on</strong> and surface mass<br />
balance studies . . . . . . . . . . . . . . . . . . . . . . . . . . . . . . . . . 40<br />
I.V. Gorodetskaya, N.P.M. van Lipzig, W. Boot, C. Reijmer, M.R. van den<br />
Broeke<br />
High-elevati<strong>on</strong> wea<strong>the</strong>r stati<strong>on</strong>s <strong>on</strong> <strong>glaciers</strong> in <strong>the</strong> Tropics - 2011<br />
update . . . . . . . . . . . . . . . . . . . . . . . . . . . . . . . . . . . . . . . 45<br />
D.R. Hardy<br />
Glacier Mass Balance Pods in Wireless Sensor Networks . . . . . . . 49<br />
J. Hulth and J. Strömbom<br />
A versatile tower platform for glacier instrumentati<strong>on</strong>: GPS and<br />
Eddy Covariance Measurements . . . . . . . . . . . . . . . . . . . . . . 52<br />
A.H. Jarosch, F.S. Anslow, J. Shea<br />
New AWS activities in Antarctica started by <strong>the</strong> Alfred Wegener<br />
Institute . . . . . . . . . . . . . . . . . . . . . . . . . . . . . . . . . . . . . . 56<br />
B. Loose<br />
1
Eddy covariance measurements <strong>on</strong> semi-arid Andean <strong>glaciers</strong>: power,<br />
memory and penitentes . . . . . . . . . . . . . . . . . . . . . . . . . . 59<br />
S. MacD<strong>on</strong>ell<br />
Glaciological field studies at Zhadang Glacier (5500-6095 m), Tibetan<br />
Plateau . . . . . . . . . . . . . . . . . . . . . . . . . . . . . . . . . . 62<br />
F. Maussi<strong>on</strong>, Y. Wei, E. Huintjes, T. Piecz<strong>on</strong>ka, D. Scherer, T. Yao, S. Kang,<br />
T. Bolch, M. Buchroithner and C. Schneider<br />
Determining glacier velocity with single frequency GPS receivers . 69<br />
C.H. Reijmer, R.S.W. van de Wal and W. Boot<br />
Recent technical developments at <strong>the</strong> IMAU: a new generati<strong>on</strong> <strong>of</strong><br />
AWS and wireless subglacial measurements . . . . . . . . . . . . . . 73<br />
P. Smeets, W. Boot, M. van den Broeke, R. van de Wal<br />
Using <strong>automatic</strong> wea<strong>the</strong>r stati<strong>on</strong> data to quantify snowmelt . . . . 80<br />
M.R. van den Broeke, P. Smeets, C. Reijmer, W. Boot<br />
GLACIOCLIM: a glacio-meteorological network to study <strong>the</strong> ablati<strong>on</strong><br />
processes over <strong>glaciers</strong> and snow covers . . . . . . . . . . . . . . 84<br />
P. Wagn<strong>on</strong>, M. Litt, J.E. Sicart and Y. Lejeune<br />
Ice-mounted masts as platforms for micro-meteorological measurements<br />
<strong>on</strong> <strong>glaciers</strong> . . . . . . . . . . . . . . . . . . . . . . . . . . . . . 88<br />
M. Winkler, R. Prinz, L. Nichols<strong>on</strong>, N. Cullen, C. Kinnard<br />
Notes <strong>on</strong> AWS Measurements <strong>on</strong> <strong>the</strong> Kahiltna Glacier, Central Alaska<br />
Range, and a Simple Floating Temperature Stand Design . . . . . . 92<br />
J. Young, A. Arendt and J. Hulth<br />
2
Preface<br />
About 7 years ago Hans Oerlemans and I organized <strong>the</strong> ’Automatic Wea<strong>the</strong>r<br />
Stati<strong>on</strong>s (AWS) <strong>on</strong> <strong>glaciers</strong>’ workshop. At that time <strong>the</strong> number <strong>of</strong> AWS deployed<br />
<strong>on</strong> <strong>glaciers</strong> had increased str<strong>on</strong>gly and <strong>the</strong> glaciological community<br />
realised <strong>the</strong>ir importance for validati<strong>on</strong> <strong>of</strong> models and satellite products.<br />
The extreme circumstances in which <strong>the</strong> AWS had to work were <strong>on</strong> <strong>the</strong><br />
cutting edge <strong>of</strong> what was (and still is) technically possible.<br />
Since <strong>the</strong>n technology has advanced and glaciologists are still seeking<br />
<strong>the</strong> boundaries <strong>of</strong> <strong>the</strong> possibilities. The Internati<strong>on</strong>al Polar Year (IPY) 2007<br />
gave polar research a push forward, resulting in a fur<strong>the</strong>r increase in <strong>the</strong><br />
number and <strong>the</strong> variety <strong>of</strong> in-situ observati<strong>on</strong>s <strong>on</strong> <strong>glaciers</strong>. This illustrates<br />
that <strong>the</strong>re still is a need for more extensive and complete observati<strong>on</strong>al<br />
data sets, not <strong>on</strong>ly from standard meteorological quantities, but also from<br />
quantities related to e.g. snow characteristics and ice dynamics. Fur<strong>the</strong>rmore,<br />
in spite <strong>of</strong> our increased experience, <strong>the</strong> problems we face are still<br />
<strong>the</strong> same (e.g. power supply, communicati<strong>on</strong>, accessibility and equipment<br />
endurance), which is partly due to <strong>the</strong> fact that with advancing technology,<br />
<strong>the</strong> instrumentati<strong>on</strong> deployed <strong>on</strong> <strong>glaciers</strong> became more complex.<br />
In recent years people inquired when <strong>the</strong> next workshop will be organised.<br />
Now, two years after <strong>the</strong> IPY, it seemed a good moment to do so.<br />
With support from IASC we were able to organise a workshop foc<strong>use</strong>d <strong>on</strong><br />
in-situ observati<strong>on</strong>s <strong>on</strong> <strong>glaciers</strong>. And so it happend that from 23 to 26<br />
March 2011, 40 people ga<strong>the</strong>red in <strong>the</strong> beautiful Swiss village P<strong>on</strong>tresina<br />
to share experiences and learn from each o<strong>the</strong>r. The meeting, c<strong>on</strong>sisting<br />
<strong>of</strong> short presentati<strong>on</strong>s, many discussi<strong>on</strong>s in c<strong>of</strong>fee breaks and over dinner,<br />
and <strong>of</strong> course an excursi<strong>on</strong> to <strong>the</strong> Morteratschgletscher, was generally<br />
found enjoyable, <strong>use</strong>ful and inspiring.<br />
Given <strong>the</strong> succes <strong>of</strong> <strong>the</strong> abstract book <strong>of</strong> <strong>the</strong> previous meeting, we decided<br />
that this meeting should also be summarised in a document. I hope<br />
that this collecti<strong>on</strong> <strong>of</strong> extended abstracts and recommendati<strong>on</strong>s will be<br />
<strong>use</strong>ful to all <strong>of</strong> you, and especially to newcomers in <strong>the</strong> field. I also hope<br />
that it will remind <strong>the</strong> participants <strong>of</strong> <strong>the</strong> w<strong>on</strong>derful days in P<strong>on</strong>tresina.<br />
Finally, I want to thank my co-c<strong>on</strong>venor Hans Oerlemans for help and<br />
advise in organizing <strong>the</strong> workshop.<br />
C.H. Tijm-Reijmer<br />
C<strong>on</strong>venor<br />
3
Program<br />
Wednesday 23 March<br />
14:00 - 14:15 Welcome Carleen Reijmer<br />
14:15 - 14:35 WMO Guidelines for Automati<strong>on</strong> <strong>of</strong> Surface Observati<strong>on</strong>s<br />
Miroslav Ondras<br />
14:35 - 14:55 The Importance <strong>of</strong> in-situ Glacier Observati<strong>on</strong>s in <strong>the</strong><br />
Global Cryosphere Watch (GCW) Barry Goodis<strong>on</strong><br />
14:55 - 15:25 Technology for aut<strong>on</strong>omous m<strong>on</strong>itoring and investigati<strong>on</strong>s<br />
<strong>of</strong> polar envir<strong>on</strong>ments Alberto Behar<br />
15:25 - 15:55 C<strong>of</strong>fee break<br />
15:55 - 16:15 New AWS - activities in Antarctica started by <strong>the</strong><br />
Alfred-Wegener-Institute Bernd Loose<br />
16:15 - 16:35 AWS measurements at <strong>the</strong> Belgian Antarctic stati<strong>on</strong><br />
Princess Elisabeth, Dr<strong>on</strong>ning Maud Land Irina<br />
Gorodetrkaya, N. van Lipzig, M. van den Broeke, W. Boot,<br />
C. Reijmer and A. Mangold<br />
16:35 - 16:55 Quantifying melt energy from IMAU AWS in Antarctica and<br />
Greenland Michiel van den Broeke, W. Boot, C. Reijmer, P.<br />
Smeets, P. Kuipers Munneke, R. van de Wal and J.<br />
Oerlemans<br />
16:55 - 17:15 High-elevati<strong>on</strong> wea<strong>the</strong>r stati<strong>on</strong>s <strong>on</strong> <strong>glaciers</strong> in <strong>the</strong> Tropics,<br />
c<strong>on</strong>tinued Douglas Hardy<br />
17:15 - 17:35 On hose clamps and electric tape – eight years <strong>of</strong><br />
maintaining a low-budget AWS network <strong>on</strong> McCall Glacier,<br />
arctic Alaska M. Nolan, Douglas Hardy<br />
17:35 - 18:00 POSTER SESSION<br />
Thursday 24 March<br />
08:30 - 08:45 Automatic Wea<strong>the</strong>r Stati<strong>on</strong>s in <strong>the</strong> Cordillera Blanca<br />
(Peruvian Andes) Martin Großha<strong>use</strong>r and S. Galos<br />
08:30 - 08:45 Innsbruck Tropical Glaciology Group East African AWSs R.<br />
Prinz, L. Nichols<strong>on</strong>, Michael Winkler, N. Cullen, G. Kaser<br />
and T. Mölg<br />
09:00 - 09:20 24 wea<strong>the</strong>r stati<strong>on</strong>s <strong>on</strong> Greenland, 25 things to go<br />
haywire Dirk van As, S. Nielsen, A. Ahlstrøm, S.B.<br />
Andersen, M.L. Andersen, M. Citterio, R.S. Fausto and F.M.<br />
Nick<br />
5
09:20 - 09:40 Internals and performance <strong>of</strong> <strong>the</strong> GEUS <strong>automatic</strong><br />
wea<strong>the</strong>r stati<strong>on</strong>s Michele Citterio<br />
09:40 - 10:00 Aut<strong>on</strong>omous AWS and GPS observati<strong>on</strong>s at Helheim<br />
Glacier, East Greenland Morten L. Andersen, M. Nettles, P.<br />
Elósegui, J.L. Davis, G.S. Hamilt<strong>on</strong>, E. Malikowski, I.<br />
G<strong>on</strong>zalez, M. Okal and B. Johns<br />
10:00 - 10:30 Introducti<strong>on</strong> to <strong>the</strong> excursi<strong>on</strong> to <strong>the</strong> Vadret da Morteratsch<br />
Hans Oerlemans<br />
12:00 - 16:30 EXCURSION<br />
Friday 25 March<br />
08:30 - 09:00 Recent developments at <strong>the</strong> IMAU: a new AWS generati<strong>on</strong><br />
& wireless subglacial measurements Paul Smeets, W.<br />
Boot, M. van den Broeke and R. van de Wal<br />
09:00 - 09:20 Glaciological field studies at Zhadang Glacier, Tibet<br />
Fabien Maussi<strong>on</strong><br />
09:20 - 09:40 Glacioclim, a glacio-meteorological network to study<br />
ablati<strong>on</strong> processes over <strong>glaciers</strong> and snow covers Patric<br />
Wagn<strong>on</strong>, J.E. Sicart, Yves Lejeune<br />
09:40 - 10:00 Installing a network <strong>of</strong> high altitude wea<strong>the</strong>r stati<strong>on</strong>s in<br />
<strong>the</strong> argentinean Andes Sebastian Andres Crespo<br />
10:00 - 10:20 Automatic measurements <strong>of</strong> <strong>glaciers</strong> in <strong>the</strong> Arid Andes <strong>of</strong><br />
Chile Lindsey Nichols<strong>on</strong>, C. Kinnard, A. Cordero, A.<br />
Rabatel, H. Castebrunet, V. Favier, S. MacD<strong>on</strong>ell, R.<br />
Garrido, J. Marín, R. P<strong>on</strong>ce, J.L. Castro and J. Araos<br />
10:20 - 10:50 C<strong>of</strong>fee break<br />
10:50 - 11:10 Eddy covariance measurements <strong>on</strong> semi-arid Andean<br />
<strong>glaciers</strong>: power, memory and penitentes Shelley<br />
MacD<strong>on</strong>ell<br />
11:10 - 11:30 A versatile tower platform for glacier instrumentati<strong>on</strong>:<br />
e.g. GPS and Eddy Covariance Measurements Alex H.<br />
Jarosch, F.S. Anslow, J.M. Shea<br />
11:30 - 11:50 Using single frequency GPS receivers to determine glacier<br />
velocities Carleen Reijmer and W. Boot<br />
11:50 - 12:10 IceMole: An Aut<strong>on</strong>omous Probe for Research in Ice<br />
Engelbert Plescher<br />
12:10 - 12:30 Using geomatic techniques for glacier m<strong>on</strong>itoring in <strong>the</strong><br />
Pyrenees Ibai Rico Lozano, E. Serrano, M.J. G<strong>on</strong>zález<br />
Amuchastegui, J.J. de San José and J. Matias<br />
6
12:30 - 14:00 Lunch<br />
14:00 - 14:20 Observing glacier processes with time-lapse photography<br />
Hans Oerlemans<br />
14:20 - 14:40 M<strong>on</strong>itoring hydrochemistry above and below <strong>glaciers</strong> (in<br />
Greenland and <strong>the</strong> Antarctic) Liz Bagshaw, J. Wadham, S.<br />
Burrow, M. Mowlem, M. Tranter and A. Fountain<br />
14:40 - 15:00 Effects <strong>of</strong> soot, algae, and mineral dust <strong>on</strong> <strong>the</strong> albedo <strong>of</strong><br />
<strong>the</strong> Plaine Morte Glacier, Switzerland Margit Schwikowski,<br />
E. Bühlmann, P.-A. Herren<br />
15:00 - 15:20 AWS measurements <strong>on</strong> <strong>the</strong> Kahiltna Glacier, Central<br />
Alaska Range, USA Joanna Young, A. Arendt, R. Hock, R.<br />
Motyka, S. Herreid, J. Hulth<br />
15:20 - 15:50 Automated ablati<strong>on</strong> measurements using a pressure<br />
transducer Robert S. Fausto<br />
15:50 - 16:00 C<strong>on</strong>clusi<strong>on</strong>s Carleen Reijmer<br />
Photo: The Morteratsch glacier in 2004 (top) and 2011 (bottom).<br />
7
Posters<br />
• IMAU Automatic Wea<strong>the</strong>r Stati<strong>on</strong>s Wim Boot<br />
• IMAU European Automatic Wea<strong>the</strong>r Stati<strong>on</strong>s Wim Boot<br />
• iWS-5: A new 2012 generati<strong>on</strong> <strong>of</strong> low temperature, rapid deployment<br />
wea<strong>the</strong>r stati<strong>on</strong>s Wim Boot<br />
• AWS measurements <strong>on</strong> <strong>glaciers</strong> in <strong>the</strong> Italian Alps G. Diolaiuti,<br />
Ant<strong>on</strong>ella Senese, C. Mihalcea, G.P. Verza, M. Mosc<strong>on</strong>i and C. Smiraglia<br />
• The ’ablati<strong>on</strong> stakes’ <strong>of</strong> <strong>the</strong> 21st century: Glacier Mass Balance Pods in<br />
a Wireless Sensor Network John Hulth and J. Strömbom<br />
• AWS measurements <strong>on</strong> debris-covered <strong>glaciers</strong> in <strong>the</strong> Karakoram<br />
Claudia E. Mihalcea, E. Vuillermoz, G. Diolaiuti, G. Verza, C. Mayer, A.<br />
Lambrecht and C. Smiraglia<br />
• Cryospheric m<strong>on</strong>itoring S<strong>on</strong>nblick-Pasterze, Austria: Instruments and<br />
mehtods Gernot Weyss, W. Schöner, B. Hynek, R. Böhm, D. Binder, S.<br />
Reisenh<strong>of</strong>er, M. Olefs and R. Unger<br />
Photo: The R<strong>on</strong>do c<strong>on</strong>venti<strong>on</strong> centre in P<strong>on</strong>tresina, Switzerland.<br />
8
Participants<br />
1. Morten Langer Andersen (morten.langer@gmail.com)<br />
2. Liz Bagshaw* (liz.bagshaw@bristol.ac.uk)<br />
3. Alberto Behar (alberto.e.behar@jpl.nasa.gov)<br />
4. Gerit Birnbaum (Gerit.Birnbaum@awi.de)<br />
5. Wim Boot (W.Boot@uu.nl)<br />
6. Eva Bühlmann<br />
7. Michele Citterio (mcit@geus.dk)<br />
8. Sebastian Andres Crespo (screspo@mendoza-c<strong>on</strong>icet.gob.ar)<br />
9. Robert Fausto (rsf@geus.dk)<br />
10. Stephan Galos (Stephan.Galos@student.uibk.ac.at)<br />
11. Barry Goodis<strong>on</strong> (barrygo@rogers.com)<br />
12. Irina Gorodetrkaya* (Irina.Gorodetskaya@ees.kuleuven.be)<br />
13. MartinGroßha<strong>use</strong>r (mgroszha<strong>use</strong>r@gmail.com)<br />
14. Doug Hardy (dhardy@geo.umass.edu)<br />
15. Pierre-Alain Herren<br />
16. John Hulth* (john.hulth@umb.no)<br />
17. Alexander Jarosch (Alexander.Jarosch@uibk.ac.at)<br />
18. Michael Kuhn (Michael.Kuhn@uibk.ac.at)<br />
19. Yves Lejeune (yves.lejeune@meteo.fr)<br />
20. Jan Lenaerts* (J.Lenaerts@uu.nl)<br />
21. Bernd Loose (bernd.loose@awi.de)<br />
22. Shelley MacD<strong>on</strong>ell (shelley.macd<strong>on</strong>ell@gmail.com)<br />
23. Tom Mat<strong>the</strong>ws* (T.K.R.Mat<strong>the</strong>ws@lboro.ac.uk)<br />
24. Fabien Maussi<strong>on</strong> (fabien.maussi<strong>on</strong>@tu-berlin.de)<br />
25. Claudia Mihalcea (claudia.mihalcea@unimi.it)<br />
26. Lindsey Nichols<strong>on</strong> (linznix@gmail.com)<br />
27. Faezeh Nick (Faezeh.Nick@ulb.ac.be)<br />
28. Søren Nielsen (sn@geus.dk)<br />
29. Matt Nolan (web@drmattnolan.org)<br />
30. Hans Oerlemans (J.Oerlemans@uu.nl)<br />
31. Miroslav Ondras (MOndras@wmo.int)<br />
32. Engelbert Plescher (plescher@fh-aachen.de)<br />
33. Rainer Prinz (Rainer.Prinz@uibk.ac.at)<br />
34. Ibai Rico Lozano* (ibaiurki@yahoo.es)<br />
35. Margit Schwikowski (margit.schwikowski@psi.ch)<br />
36. Ant<strong>on</strong>ella Senese (ant<strong>on</strong>ella.senese@unimi.it)<br />
37. Jean Emmanuel Sicart (jean-emmanuel.sicart@ird.fr)<br />
38. Paul Smeets (C.J.P.P.Smeets@uu.nl)<br />
39. Carleen Tijm-Reijmer (C.H.tijm-Reijmer@uu.nl)<br />
40. Dirk van As (dva@geus.dk)<br />
9
41. Michiel van den Broeke (m.r.vandenbroeke@uu.nl)<br />
42. Patric Wagn<strong>on</strong> (wagn<strong>on</strong>@lgge.obs.ujf-grenoble.fr)<br />
43. Gernot Weyss (G.Weyss@zamg.ac.at)<br />
44. Michael Winkler (Michael.Winkler@uibk.ac.at)<br />
45. Joanna Young* (joanna.young@gi.alaska.edu)<br />
(Young scientists receiving support are marked *).<br />
Photo: The participants <strong>on</strong> <strong>the</strong> Morteratsch glacier.<br />
10
<str<strong>on</strong>g>Workshop</str<strong>on</strong>g> summary and recommendati<strong>on</strong>s<br />
Carleen H. Reijmer<br />
Utrecht University, Institute for Marine and Atmospheric research Utrecht, The Ne<strong>the</strong>rlands.<br />
Introducti<strong>on</strong><br />
Automated <strong>systems</strong> that measure <strong>the</strong> energy and mass budget, and dynamics<br />
<strong>of</strong> <strong>glaciers</strong> have been deployed for some decades now. Designing<br />
and operating <strong>the</strong>se <strong>systems</strong> involves <strong>the</strong> challenge <strong>of</strong> obtaining c<strong>on</strong>tinuous<br />
and reliable data from unattended sites in extreme envir<strong>on</strong>ments.<br />
To discuss <strong>the</strong>se challenges and share experiences, <strong>the</strong> IASC workshop<br />
<strong>on</strong> <strong>the</strong> <strong>use</strong> <strong>of</strong> <strong>automatic</strong> <strong>measuring</strong> <strong>systems</strong> <strong>on</strong> <strong>glaciers</strong> took place in<br />
March 2011 in P<strong>on</strong>tresina, Switzerland. This workshop succeeded <strong>the</strong> Automatic<br />
Wea<strong>the</strong>r Stati<strong>on</strong>s (AWS) <strong>on</strong> <strong>glaciers</strong> workshop held in 2004, <strong>of</strong><br />
which results were published in Reijmer (2004). The present workshop<br />
again brought toge<strong>the</strong>r an internati<strong>on</strong>al group <strong>of</strong> researchers, and this<br />
document summarizes some <strong>of</strong> <strong>the</strong> discussi<strong>on</strong>s, identifies remaining challenges<br />
and provides some recommendati<strong>on</strong>s.<br />
Focus and discussed topics<br />
The 2004 workshop foc<strong>use</strong>d <strong>on</strong> <strong>the</strong> deployment <strong>of</strong> AWS <strong>on</strong> <strong>glaciers</strong>. Although<br />
AWS still represent a core activity in glaciological field observati<strong>on</strong>s,<br />
<strong>the</strong> extensi<strong>on</strong> towards ice dynamics (velocity, deformati<strong>on</strong>) in combinati<strong>on</strong><br />
with technical progress has opened up numerous new study areas.<br />
The topic <strong>of</strong> <strong>the</strong> 2011 meeting, as reported in this volume, was<br />
<strong>the</strong>refore a more general <strong>on</strong>e, namely automated <strong>measuring</strong> <strong>systems</strong> <strong>on</strong><br />
<strong>glaciers</strong>.<br />
A variety <strong>of</strong> topics was discussed in <strong>the</strong> meeting, ranging from comparing<br />
different types <strong>of</strong> instrumentati<strong>on</strong> for <strong>the</strong> same goal, geographical<br />
and logistical challenges, power and communicati<strong>on</strong> issues. About two<br />
thirds <strong>of</strong> <strong>the</strong> presentati<strong>on</strong>s dealt with wea<strong>the</strong>r stati<strong>on</strong>s and mass balance<br />
observati<strong>on</strong>s, <strong>the</strong> o<strong>the</strong>r presentati<strong>on</strong> topics ranged from glacier velocity<br />
observati<strong>on</strong>s using GPS, <strong>the</strong> (im)possibilities <strong>of</strong> to time lapse photography,<br />
how to measure sub- and englacial properties, and chemical and biological<br />
observati<strong>on</strong>s.<br />
An overview <strong>of</strong> discussed topics and recommendati<strong>on</strong>s is given below.<br />
Pers. comm. refers to ei<strong>the</strong>r a presentati<strong>on</strong> or discussi<strong>on</strong> at <strong>the</strong> meeting.<br />
Automatic Wea<strong>the</strong>r Stati<strong>on</strong>s<br />
Several wea<strong>the</strong>r stati<strong>on</strong> mast designs are currently in <strong>use</strong>, see e.g. Diolaiuti<br />
et al. (p. 31), Gorodetskaya et al. (p. 40), Hardy (p. 45) and Young<br />
11
et al. (p. 92). The ’floating’ system is well accepted <strong>on</strong> melting <strong>glaciers</strong>,<br />
but is not very <strong>use</strong>ful <strong>on</strong> <strong>glaciers</strong> with very rough terrain, e.g. glacier<br />
surfaces covered by penitentes (MacD<strong>on</strong>ell (p. 59)), or with large accumulati<strong>on</strong><br />
rates. The floating <strong>systems</strong> have ei<strong>the</strong>r 3 or 4 legs, and some<br />
have wooden plates to prevent freezing in. A disadvantage <strong>of</strong> <strong>the</strong> wooden<br />
plates is that <strong>the</strong> stati<strong>on</strong> may start sliding <strong>on</strong> undulated ice surfaces (Van<br />
As, pers. comm.). Freezing <strong>of</strong> <strong>the</strong> legs may stabilize <strong>the</strong> stati<strong>on</strong> from<br />
sliding, but it also changes <strong>the</strong> instrument height somewhat. A special<br />
design is <strong>the</strong> Innsbruck system which <strong>use</strong>s cardan-like joints to keep <strong>the</strong><br />
instruments horiz<strong>on</strong>tal (Prinz et al., pers. comm.). Designs with <strong>on</strong>e or<br />
more extendable poles drilled in <strong>the</strong> ice may be suitable for accumulati<strong>on</strong><br />
areas, but can ca<strong>use</strong> stability problems in ablati<strong>on</strong> areas. During <strong>the</strong><br />
meeting two modular <strong>systems</strong> <strong>of</strong> this type were presented (Jarosch et al.,<br />
p. 52, and Winkler et al., p. 88).<br />
New developments in AWS datalogger design were presented by Citterio<br />
(p. 22) and Smeets et al. (p. 73). Both were incited by <strong>the</strong> recent<br />
change from Campbell CR10X to Campbell CR1000 data loggers. Both<br />
new developments emphasize <strong>the</strong> importance <strong>of</strong> low power demand and<br />
reliable communicati<strong>on</strong>. Sensor choice is an important part <strong>of</strong> <strong>the</strong> AWS<br />
design. Several authors list and discuss <strong>the</strong>ir choices (e.g. Maussi<strong>on</strong> et<br />
al., p. 62 and Loose, p. 56). Besides <strong>the</strong> standard meteorological parameters<br />
such as temperature, humidity, wind and pressure, for glacier surfaces<br />
it is generally accepted that <strong>the</strong> four radiati<strong>on</strong> comp<strong>on</strong>ents must be<br />
measured as well. The type/manufacturers may vary depending <strong>on</strong> experience,<br />
(power) demands and not in <strong>the</strong> least funding. Power supply and<br />
instrument choice is closely linked when e.g. choosing <strong>the</strong> air temperature<br />
sensor in combinati<strong>on</strong> with a radiati<strong>on</strong> screen. Although it is recognized<br />
that c<strong>on</strong>tinuous ventilati<strong>on</strong> is best, several authors discuss different ventilati<strong>on</strong><br />
strategies (Hardy, p. 45, and Maussi<strong>on</strong> et al., p. 62). Illustrating<br />
limitati<strong>on</strong>s set by funding, an extreme case was presented by Nolan and<br />
Hardy (pers. comm.). They showed how discarded stakes, tape and hose<br />
clamps can start a new life as a wea<strong>the</strong>r stati<strong>on</strong> mast.<br />
For an extensive list <strong>of</strong> recommendati<strong>on</strong>s regarding AWS observati<strong>on</strong>s,<br />
<strong>the</strong> reader is referred to Box et al. (2004); <strong>the</strong>ir c<strong>on</strong>clusi<strong>on</strong>s are still valid<br />
and can be applied <strong>on</strong> o<strong>the</strong>r automated <strong>systems</strong> as well. In this volume,<br />
several authors present <strong>the</strong> less<strong>on</strong>s <strong>the</strong>y learned and <strong>the</strong>ir own recommendati<strong>on</strong>s,<br />
see e.g. Hardy (p. 45) who presents his list that complements<br />
Box et al. (2004).<br />
Mass balance<br />
There are several different designs to measure mass balance. Traditi<strong>on</strong>ally,<br />
stakes and s<strong>on</strong>ic height rangers are <strong>use</strong>d. New ways to measure<br />
ablati<strong>on</strong> include <strong>systems</strong> using a mass <strong>on</strong> a wire (Hulth et al., p. 49), and<br />
<strong>measuring</strong> pressure differences in fluid filled hoses (Fausto, pers. comm.).<br />
Both <strong>systems</strong> have <strong>the</strong> advantage not to sink in <strong>the</strong> ice as stakes may<br />
do, and can be combined with a s<strong>on</strong>ic altimeter to measure accumulati<strong>on</strong>.<br />
12
Both <strong>systems</strong> can also be operated unattended for several years in high<br />
ablati<strong>on</strong> areas. At present <strong>the</strong> wire system is in a test phase and shows<br />
great promise. The Geological Survey <strong>of</strong> Denmark and Greenland (GEUS)<br />
manages to successfully operate a system with fluid filled hoses. For all<br />
<strong>the</strong>se <strong>systems</strong>, knowledge <strong>of</strong> <strong>the</strong> density is still necessary to determine<br />
<strong>the</strong> mass <strong>of</strong> melted/accumulated ice/snow.<br />
Power supply<br />
Power supply presents a recurring challenge and arguably is <strong>the</strong> most important<br />
issue besides stati<strong>on</strong> design and instrumentati<strong>on</strong>. Batteries, solar<br />
panels and wind generators can all be problematic when moisture enters<br />
<strong>the</strong> system, during polar nights without solar radiati<strong>on</strong>, or when snow covers<br />
solar panels and during extreme wind events. Questi<strong>on</strong>s raised were<br />
’what are <strong>the</strong> best batteries to <strong>use</strong>’ and ’how to regulate charging <strong>of</strong> <strong>the</strong><br />
batteries by solar or wind energy’. Of course <strong>the</strong> type <strong>of</strong> power supply<br />
is very much defined by <strong>the</strong> stati<strong>on</strong> design and <strong>the</strong> instruments it has to<br />
power. For example, <strong>the</strong> E-tracers and GPSs described by Bagshaw et al.<br />
(p. 17) and Reijmer et al. (p. 69), resp., work <strong>on</strong> a single lithium battery,<br />
while Citterio (p. 22) describes a complex system <strong>of</strong> batteries and solar<br />
panels to operate an AWS. Finding <strong>the</strong> best power setup is not easy as<br />
shown by MacD<strong>on</strong>ell et al. (p. 59) who tested different combinati<strong>on</strong>s <strong>of</strong><br />
batteries and solar panels in order to run <strong>the</strong>ir stati<strong>on</strong> for l<strong>on</strong>ger periods.<br />
Communicati<strong>on</strong><br />
Different communicati<strong>on</strong> techniques are <strong>use</strong>d, particularly <strong>the</strong> Argos (see<br />
e.g. Gorodetskaya et al., p. 40, Reijmer et al., p. 69, and Smeets et al.,<br />
p. 73) and Iridium satellite <strong>systems</strong> (see e.g. Citterio, p. 22, and Hulth<br />
et al., p. 49), but also Inmarsat satellite system, GSM, radio communicati<strong>on</strong><br />
and Bluetooth. All have advantages and disadvantages related to<br />
power demands, costs involved, distance over which can be communicated,<br />
amount <strong>of</strong> data that can be transferred, <strong>on</strong>e or two way communicati<strong>on</strong><br />
possibilities, and future prospects <strong>of</strong> <strong>the</strong> system. For example, <strong>the</strong><br />
Argos system is very reliable but is expensive and limited in <strong>the</strong> amount<br />
<strong>of</strong> data to be transferred, and <strong>on</strong>ly data retrieval is possible. Iridium, Inmarsat<br />
and <strong>the</strong> GSM system have two way communicati<strong>on</strong> possibilities but<br />
are more power demanding, with <strong>the</strong> latter two having limited communicati<strong>on</strong><br />
ranges. Radio communicati<strong>on</strong> is <strong>on</strong>ly <strong>use</strong>d for short line <strong>of</strong> sight<br />
distances while Bluetooth is <strong>use</strong>d in <strong>the</strong> new IMAU development (Smeets<br />
et al., p. 73) for in-stati<strong>on</strong> and stati<strong>on</strong>-to-laptop communicati<strong>on</strong>. In general<br />
new <strong>measuring</strong> <strong>systems</strong> are mostly using <strong>the</strong> Iridium satellite system<br />
(Behar, pers. comm.).<br />
Subsurface observati<strong>on</strong>s<br />
Subsurface observati<strong>on</strong>s are a new development in glaciological research.<br />
The challenge is to design a system that can withstand <strong>the</strong> high pressure<br />
from a large water or ice column, and retrieve <strong>the</strong> data ei<strong>the</strong>r by<br />
13
wireless communicati<strong>on</strong> or by retrieving <strong>the</strong> system itself. Bagshaw et al.<br />
(p. 17) present a small system, <strong>the</strong> E-tracer, that flows through <strong>the</strong> subglacial<br />
drainage system. The E-tracer has to be retrieved after it leaves<br />
<strong>the</strong> drainage system <strong>of</strong> <strong>the</strong> glacier. 20% <strong>of</strong> <strong>the</strong> deployed sensors are retrieved<br />
and a multitude <strong>of</strong> sensors must be put into <strong>the</strong> system. Smeets<br />
et al. (p. 73) present a system to be put into a hole where it will freeze<br />
and send its data wireless to <strong>the</strong> surface. Both <strong>systems</strong> are still in <strong>the</strong><br />
developmental stage but show promise in retrieving c<strong>on</strong>tinuous data sets<br />
from inside and/or beneath ice masses.<br />
Geographical c<strong>on</strong>siderati<strong>on</strong>s<br />
The geographical areas discussed in <strong>the</strong> meeting cover <strong>the</strong> whole globe:<br />
from Greenland to Antarctica, and Alaska to <strong>the</strong> Andes, <strong>the</strong> Alps and Tibet.<br />
The variety <strong>of</strong> locati<strong>on</strong>s showed that different settings result in different<br />
problems, not <strong>on</strong>ly technical. Issues related to locati<strong>on</strong> are mainly<br />
meteorological (snowfall and melt amount, surface roughness e.g. penitentes,<br />
high altitude, low temperatures, wind regime) or logistical such<br />
as accessibility <strong>of</strong> <strong>the</strong> measurement site <strong>on</strong> foot, by snow mobile, car or<br />
helicopter. But part <strong>of</strong> <strong>the</strong> geographical c<strong>on</strong>siderati<strong>on</strong>s are social issues,<br />
e.g. acceptance <strong>of</strong> <strong>the</strong> local populati<strong>on</strong> <strong>of</strong> <strong>the</strong> activities. Damaging and<br />
<strong>the</strong>ft <strong>of</strong> equipment occurs, as well as people showing genuine interest and<br />
providing a helping hand (Maussi<strong>on</strong> et al., p. 62).<br />
Data<br />
The goal <strong>of</strong> all <strong>the</strong>se efforts is to obtain uninterrupted and l<strong>on</strong>g datasets.<br />
With <strong>the</strong> many years <strong>of</strong> experience we now have, <strong>the</strong>re are several datasets<br />
for different parameters and parts <strong>of</strong> <strong>the</strong> globe. Especially during <strong>the</strong> IPY,<br />
effort has been put in creating web interfaces, internet databases and networks<br />
in order to aid in <strong>the</strong> data availability. This also raised <strong>the</strong> issue <strong>of</strong><br />
standardizati<strong>on</strong>. Especially in <strong>the</strong> field <strong>of</strong> operating Automatic Wea<strong>the</strong>r<br />
Stati<strong>on</strong>s <strong>the</strong>re is a need for standardizati<strong>on</strong>, i.e. to define <strong>the</strong> ’ideal’<br />
wea<strong>the</strong>r stati<strong>on</strong>. This includes making available informati<strong>on</strong> about performance<br />
<strong>of</strong> different brand instruments under extreme c<strong>on</strong>diti<strong>on</strong>s, comparis<strong>on</strong><br />
<strong>of</strong> power and communicati<strong>on</strong> <strong>systems</strong>, as well as data treatment<br />
such as presented by Gorodetskaya et al. (p. 40) and Van den Broeke et<br />
al. (p. 80). With <strong>the</strong> increased amount and type <strong>of</strong> observati<strong>on</strong>s, came<br />
<strong>the</strong> wish to coordinate observati<strong>on</strong>s in networks, such as presented by<br />
Wagn<strong>on</strong> et al. (p. 84) and Crespo (p. 27), and super-sites. WMO is very<br />
much interested in <strong>the</strong>se issues (Ondras, pers. comm., and Goodis<strong>on</strong>,<br />
p. 36).<br />
C<strong>on</strong>clusi<strong>on</strong>s<br />
The discussi<strong>on</strong>s about <strong>the</strong> issues summarized above did not result in <strong>on</strong>e<br />
simple answer, but in this booklet. It became clear that <strong>the</strong> choices made<br />
14
and presented by researchers and research groups depend mainly <strong>on</strong> geographical<br />
and meteorological setting in combinati<strong>on</strong> with available funds.<br />
Recommendati<strong>on</strong>s <strong>of</strong> individual researchers can be found in <strong>the</strong>ir abstracts.<br />
In this workshop it was shown that important developments in different<br />
kinds <strong>of</strong> equipment <strong>use</strong>d <strong>on</strong> <strong>glaciers</strong> have taken place. Especially noteworthy<br />
is <strong>the</strong> development in performing subglacial measurements, although<br />
still limited to wireless pressure and temperature measurements. On <strong>the</strong><br />
o<strong>the</strong>r hand some issues remain unsolved. E.g. to this date <strong>the</strong>re is no<br />
system available to <strong>automatic</strong>ally measure snow density <strong>on</strong> <strong>glaciers</strong>.<br />
With <strong>the</strong> increased number and variety <strong>of</strong> observati<strong>on</strong>s <strong>on</strong> <strong>glaciers</strong>, <strong>the</strong><br />
need for exchange <strong>of</strong> technical knowledge becomes more important. In<br />
order for groups that just start in <strong>the</strong> field <strong>of</strong> glacial research not to make<br />
<strong>the</strong> same mistakes that o<strong>the</strong>rs made, <strong>the</strong> availability <strong>of</strong> technical informati<strong>on</strong><br />
is important. This book <strong>of</strong> extended abstracts and recommendati<strong>on</strong>s<br />
may help to achieve that goal.<br />
References<br />
Box, J., P. Anders<strong>on</strong> and M. R. van den Broeke. 2004. Less<strong>on</strong>s to be learned. In: Reijmer,<br />
C., editor, Automatic wea<strong>the</strong>r stati<strong>on</strong>s <strong>on</strong> <strong>glaciers</strong>, <str<strong>on</strong>g>Workshop</str<strong>on</strong>g> proceedings, pages 9–28.<br />
Institute for Marine and Atmospheric Research Utrecht (IMAU).<br />
Reijmer, C., editor. 2004. Automatic wea<strong>the</strong>r stati<strong>on</strong>s <strong>on</strong> <strong>glaciers</strong>: Less<strong>on</strong>s to be learned and<br />
extended abstracts. Institute for Marine and Atmospheric Research Utrecht (IMAU). pp.<br />
115.<br />
http://www.projects.science.uu.nl/iceclimate/workshop/documents/aws_abstracts.pdf.<br />
15
Abstracts
Automated m<strong>on</strong>itoring <strong>of</strong> hydrochemistry above<br />
and below <strong>glaciers</strong><br />
Liz Bagshaw 1,2 , Jemma Wadham 1 , Steve Burrow 2 , Matt Mowlem 3 , Martyn Tranter 1 ,<br />
Andrew Fountain 4 , Catie Butler 1<br />
1 Bristol Glaciology Centre, School <strong>of</strong> Geographical Sciences, University <strong>of</strong> Bristol, Bristol BS8<br />
1SS UK,<br />
Email: Liz.Bagshaw@bristol.ac.uk<br />
2 Queens School <strong>of</strong> Engineering, University <strong>of</strong> Bristol, University Walk, Bristol BS8 1TR UK,<br />
3 Nati<strong>on</strong>al Oceanography Centre, University <strong>of</strong> Southampt<strong>on</strong>, UK,<br />
4 Departments <strong>of</strong> Geology and Geography, Portland State University, USA<br />
Glacier meltwater hydrochemistry is an increasingly important parameter<br />
in glacier m<strong>on</strong>itoring. The hydrochemical signature <strong>of</strong> meltwater can<br />
yield a variety <strong>of</strong> informati<strong>on</strong>, including <strong>the</strong> nature <strong>of</strong> <strong>the</strong> flowpaths <strong>of</strong> water<br />
beneath <strong>the</strong> glacier, how l<strong>on</strong>g <strong>the</strong> water has been in c<strong>on</strong>tact with <strong>the</strong><br />
glacier bed, and if any biological activity has occurred. Historically, this<br />
have been achieved via diurnal sampling <strong>of</strong> <strong>the</strong> main glacier outflow for<br />
discharge, electrical c<strong>on</strong>ductivity (EC) (Collins, 1979; Sharp et al., 1995)<br />
and later, for pH, major ani<strong>on</strong>s and cati<strong>on</strong>s (Wadham et al., 1998; Tranter<br />
et al., 2002) and dissolved oxygen (DO) (Hods<strong>on</strong>, 2006). Glacier surface<br />
melt bodies, including supraglacial lakes, cryolakes and cryoc<strong>on</strong>ite<br />
holes also undergo biogeochemical fluctuati<strong>on</strong>s associated with physical<br />
changes and biological activity, and <strong>the</strong>se have predominantly been m<strong>on</strong>itored<br />
through point sampling (Tranter et al., 2004; Bagshaw et al., 2007),<br />
remotely sensed snapshots (Bartholomew et al., 2011) or field/laboratory<br />
simulati<strong>on</strong> (Anesio et al., 2009).<br />
These sampling methods have significantly increased our understanding<br />
<strong>of</strong> <strong>the</strong> processes that are occurring in glacier surface eco<strong>systems</strong>, and<br />
in subglacial envir<strong>on</strong>ments. However, diurnal or point sampling is liable to<br />
miss key events that occur during <strong>the</strong> melt seas<strong>on</strong>; for example, subglacial<br />
outburst events or short-term supraglacial freeze-thaw cycles, and inferences<br />
about <strong>the</strong> subglacial drainage system are hampered by a lack <strong>of</strong> in<br />
situ measurements. Therefore, <strong>the</strong>re is an increasing need for l<strong>on</strong>ger-term,<br />
c<strong>on</strong>tinuous datasets, and <strong>the</strong> ability to collect data beneath ice masses.<br />
Current m<strong>on</strong>itoring techniques are frequently unsuitable for this purpose;<br />
for example, Clarke electrodes for m<strong>on</strong>itoring DO require c<strong>on</strong>stant stirring<br />
or water moti<strong>on</strong> (Bagshaw et al., 2010) which is not possible in many<br />
surface melt features. New sensors or adaptati<strong>on</strong> <strong>of</strong> existing sensors is<br />
thus required to fully capture melting and freezing processes and <strong>the</strong> subsequent<br />
biogeochemical changes that occur <strong>on</strong> <strong>the</strong> surface and beneath<br />
<strong>glaciers</strong>. This short summary discusses progress to date and outlines future<br />
research towards <strong>the</strong>se aims.<br />
17
Figure 1. Fibre optic sensors for dissolved oxygen installed in a cryoc<strong>on</strong>ite hole <strong>on</strong> <strong>the</strong><br />
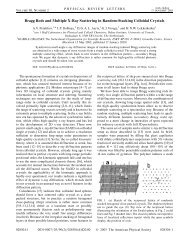
surface <strong>of</strong> Canada Glacier, McMurdo Dry Valleys, Antarctica. The sensor was wrapped in<br />
insulating material and external heat packs were applied to prol<strong>on</strong>g operati<strong>on</strong> in cold<br />
temperatures. The data series from <strong>the</strong> experiment revealed a large DO excursi<strong>on</strong> within<br />
<strong>the</strong> hole associated with freeze-thaw cycling.<br />
On Glaciers: High resoluti<strong>on</strong> m<strong>on</strong>itoring <strong>of</strong> cryoc<strong>on</strong>ite hole processes<br />
Fibre optic sensors for dissolved oxygen (PreSens) were <strong>use</strong>d in c<strong>on</strong>juncti<strong>on</strong><br />
with EC and temperature probes and a Campbell CR10X datalogger <strong>on</strong><br />
<strong>the</strong> surface <strong>of</strong> Canada Glacier, McMurdo Dry Valleys, Antarctica to m<strong>on</strong>itor<br />
freeze-thaw events in a cryoc<strong>on</strong>ite hole during <strong>the</strong> ablati<strong>on</strong> seas<strong>on</strong><br />
(Bagshaw et al., 2011). Figure 1 shows <strong>the</strong> sensor setup in <strong>the</strong> Austral<br />
summer <strong>of</strong> 2008/9, and <strong>the</strong> resulting dataset. The sensors were deployed<br />
for 4 weeks, but did not operate c<strong>on</strong>tinuously in <strong>the</strong> cold. With <strong>the</strong> applicati<strong>on</strong><br />
<strong>of</strong> external heat packs, a near c<strong>on</strong>tinuous dataset was recorded<br />
in <strong>the</strong> later part <strong>of</strong> <strong>the</strong> deployment, including an interesting DO excursi<strong>on</strong><br />
associated with a freeze-thaw event (Fig. 1). The rapid increase in DO is<br />
thought to be a result <strong>of</strong> freeze-squeezing <strong>of</strong> <strong>the</strong> air-filled headspace within<br />
<strong>the</strong> cryoc<strong>on</strong>ite hole. As <strong>the</strong> water at <strong>the</strong> edges <strong>of</strong> <strong>the</strong> hole freezes when<br />
air temperatures drop below zero, <strong>the</strong> headspace is reduced in size and<br />
hence gases, including oxygen, are forced into <strong>the</strong> remaining liquid water.<br />
This drives a rapid increase in DO associated with freezing, even though<br />
<strong>the</strong> centre <strong>of</strong> <strong>the</strong> hole remains liquid. The experiment was repeated in <strong>the</strong><br />
same locati<strong>on</strong> <strong>the</strong> following year, with an additi<strong>on</strong>al site <strong>on</strong> <strong>the</strong> Garwood<br />
Glacier in <strong>the</strong> Garwood Valley. A <strong>the</strong>rmostatically-c<strong>on</strong>trolled electric heat<br />
blanket was <strong>use</strong>d to warm <strong>the</strong> sensors during <strong>the</strong> coldest period, which<br />
enabled c<strong>on</strong>tinuous data collecti<strong>on</strong>. Similar freeze-thaw excursi<strong>on</strong>s were<br />
recorded, and <strong>the</strong> same freeze-thaw event was simultaneously captured<br />
by <strong>the</strong> sensors in Taylor and Garwood Valleys.<br />
In additi<strong>on</strong>, <strong>the</strong> sensors were deployed in open, hydrologically c<strong>on</strong>nected<br />
cryoc<strong>on</strong>ite holes 17 km from <strong>the</strong> margin <strong>of</strong> Leverett Glacier, Greenland,<br />
in <strong>the</strong> summer <strong>of</strong> 2010, in c<strong>on</strong>juncti<strong>on</strong> with sensors (Apogee) for<br />
photosyn<strong>the</strong>tically available radiati<strong>on</strong> (PAR) <strong>on</strong> <strong>the</strong> ice surface and at <strong>the</strong><br />
base <strong>of</strong> <strong>the</strong> cryoc<strong>on</strong>ite holes. The lack <strong>of</strong> an ice covering <strong>on</strong> <strong>the</strong> open<br />
cryoc<strong>on</strong>ite holes means that gas exchange between <strong>the</strong> water and <strong>the</strong><br />
atmosphere is unimpeded, but <strong>the</strong> dataset never<strong>the</strong>less shows evidence<br />
<strong>of</strong> biogeochemical changes associated with physical c<strong>on</strong>diti<strong>on</strong>s <strong>on</strong> <strong>the</strong> ice<br />
18
Figure 2. An electr<strong>on</strong>ic tracer (E-Tracer) for subglacial pressure sensing. The sensor<br />
package incorporates a radio chip which emits a signal to allow retrieval <strong>on</strong>ce <strong>the</strong> sensor<br />
has passed through <strong>the</strong> subglacial drainage system. The white potting mixture means that<br />
<strong>the</strong> sensor is neutrally buoyant, and <strong>the</strong> spherical shape allows it to pass through tortuous<br />
drainage c<strong>on</strong>duits. The bright colour aids retrieval from <strong>the</strong> proglacial stream.<br />
surface. The most significant finding was that <strong>the</strong> holes drain rapidly in<br />
c<strong>on</strong>juncti<strong>on</strong> with larger scale drainage events. The timing <strong>of</strong> <strong>the</strong> cryoc<strong>on</strong>ite<br />
hole drainage was coincident with <strong>the</strong> drainage <strong>of</strong> large supraglacial lakes<br />
at 800 - 1000 m a.s.l. (Bartholomew et al., 2011), which prompted a subglacial<br />
outburst event (Butler, unpublished data).<br />
Beneath Glaciers: high resoluti<strong>on</strong> bulk meltwater hydrochemistry<br />
and in situ subglacial measurements<br />
The bulk meltwater chemistry was m<strong>on</strong>itored for such outburst events<br />
from May to August 2010, using a high resoluti<strong>on</strong> sensor array for EC, pH,<br />
DO, turbidity, water temperature and discharge which sampled every 30s<br />
and took an average every 10 minutes. The array was solar powered, and<br />
c<strong>on</strong>trolled by a Campbell CR10X datalogger, backed up by a storage module.<br />
The sensor array was supported by a high frequency meltwater sampling<br />
regime <strong>measuring</strong> major i<strong>on</strong>s, dissolved nutrients and o<strong>the</strong>r parameters<br />
for <strong>the</strong> detecti<strong>on</strong> <strong>of</strong> biological activity (Butler, unpublished data). The<br />
EC record detected several outburst events over <strong>the</strong> seas<strong>on</strong> (Bartholomew<br />
et al., 2011), and <strong>the</strong> biogeochemical data showed <strong>the</strong> likely source <strong>of</strong> <strong>the</strong><br />
water for each event. For example, high levels <strong>of</strong> DO in <strong>the</strong> meltwater<br />
were indicative <strong>of</strong> <strong>the</strong> drainage <strong>of</strong> a supraglacial lake.<br />
Bulk meltwater measurements are valuable for assessing potential water<br />
flowpaths through <strong>the</strong> glacier; however, in situ measurements can provide<br />
a more detailed picture <strong>of</strong> c<strong>on</strong>diti<strong>on</strong>s at <strong>the</strong> glacier bed. To this aim,<br />
<strong>the</strong> University <strong>of</strong> Bristol is developing a range <strong>of</strong> electr<strong>on</strong>ic sensors (E-<br />
Tracers) that travel through <strong>the</strong> subglacial drainage system collecting data,<br />
and are <strong>the</strong>n be retrieved at <strong>the</strong> glacier portal via radio directi<strong>on</strong> finding.<br />
The E-Tracer package comprises a small (50 mm), neutrally buoyant sensor<br />
platform including a microprocessor (PIC), internal datalogger (EEPROM)<br />
and a radio chip (Radiometrix) which emits a radio signal (Fig. 2). They are<br />
powered by a 0.5 AA size lithium battery. The sensor package is adaptable,<br />
19
ut has been tested with a temperature sensor (Leverett Glacier, Greenland,<br />
2009) and a pressure sensor (Leverett Glacier, Greenland, 2010).<br />
The sensors are deployed into a moulin and allowed to flow through <strong>the</strong><br />
subglacial drainage system. Their small size and spherical shape aids<br />
progress through <strong>the</strong> <strong>of</strong>ten tortuous flowpaths, and a proporti<strong>on</strong> emerge<br />
at <strong>the</strong> drainage portal. They are detected via radio directi<strong>on</strong> finding and<br />
retrieved. The stored data is downloaded via serial output to a datalogger.<br />
Approximately 20% <strong>of</strong> <strong>the</strong> deployed sensors were retrieved; sensor loss<br />
was anticipated and was a factor which determined <strong>the</strong> low cost <strong>of</strong> <strong>the</strong><br />
E-Tracers (approximately 25 GBP). Additi<strong>on</strong>al deployments <strong>of</strong> <strong>the</strong> pressure<br />
<strong>measuring</strong> E-Tracer are planned for summer 2011 at <strong>the</strong> Leverett Glacier,<br />
and an enhanced sensor package including EC and an accelerometer is in<br />
development for summer 2012.<br />
C<strong>on</strong>clusi<strong>on</strong>s<br />
High resoluti<strong>on</strong>, automated m<strong>on</strong>itoring techniques have been adapted to<br />
m<strong>on</strong>itor glacier meltwater hydrochemistry <strong>on</strong> <strong>the</strong> surface <strong>of</strong> <strong>glaciers</strong> in<br />
Antarctica and Greenland, and have revealed previously unobserved relati<strong>on</strong>ships<br />
between physical processes and biogeochemical c<strong>on</strong>diti<strong>on</strong>s in<br />
cryoc<strong>on</strong>ite holes. High frequency m<strong>on</strong>itoring <strong>of</strong> glacier meltwater hydrochemistry<br />
via sensor arrays shows links between surface hydrology and<br />
subglacial outburst events. In situ measurements <strong>of</strong> subglacial water pressure<br />
have been collected using innovative E-Tracers, which travel through<br />
<strong>the</strong> drainage system and are retrieved via radio directi<strong>on</strong> finding. C<strong>on</strong>tinued<br />
development <strong>of</strong> similar sensors will enhance understanding <strong>of</strong> <strong>the</strong><br />
processes occurring beneath <strong>the</strong> bed <strong>of</strong> <strong>glaciers</strong>, particularly links between<br />
surface melting and basal hydrology at <strong>the</strong> margins <strong>of</strong> <strong>the</strong> Greenland ice<br />
sheet.<br />
Acknowledgements<br />
This work was supported by NERC grant NE/H023879/1, EPSRC grant EP/D057620/1 and NSF<br />
grant ANT-0423595. Antarctic fieldwork was c<strong>on</strong>ducted with <strong>the</strong> MCMDV LTER site team and<br />
Antarctica New Zealand, whose support is gratefully acknowledged, with logistics provided<br />
by Ray<strong>the</strong><strong>on</strong> Polar Services and PHI Helicopters. Greenland fieldwork was c<strong>on</strong>ducted with<br />
<strong>the</strong> support <strong>of</strong> Kangerlussuaq Internati<strong>on</strong>al Science Support and HeliGreenland.<br />
References<br />
Anesio, A., A. Hods<strong>on</strong>, A. Fritz, R. Psenner and B. Sattler. 2009. High microbial activity <strong>on</strong><br />
<strong>glaciers</strong>: Importance to <strong>the</strong> global carb<strong>on</strong> cycle. Global Change Biology, 15(4), 955–960.<br />
Doi: 10.1111/j.1365-2486.2008.01758.x.<br />
Bagshaw, E., M. Tranter, A. Fountain, K. Welch, H. Basagic and W. Ly<strong>on</strong>s. 2007. Biogeochemical<br />
evoluti<strong>on</strong> <strong>of</strong> cryoc<strong>on</strong>ite holes <strong>on</strong> canada glacier, taylor valley, antarctica. J. Geophys.<br />
Res., 112(G4). Doi: G04s35 10.1029/2007jg000442.<br />
Bagshaw, E., J. Wadham, M. Mowlem, J. Eveness, A. Fountain, M. Tranter and J. Telling.<br />
2010. Determinati<strong>on</strong> <strong>of</strong> dissolved oxygen in <strong>the</strong> cryosphere: A comprehensive laboratory<br />
and field evaluati<strong>on</strong> <strong>of</strong> fibre optic sensors. Envir<strong>on</strong>. Science and Techn. Doi:<br />
10.1021/es102571j.<br />
20
Bagshaw, E., M. Tranter, J. Wadham, A. Fountain and M. Mowlem. 2011. High resoluti<strong>on</strong> m<strong>on</strong>itoring<br />
reveals dissolved oxygen dynamics in an antarctic cryoc<strong>on</strong>ite hole. Hydrol. Process.<br />
Doi: 10.1002/hyp.8049.<br />
Bartholomew, I., P. Nienow, A. Sole, D. Mair, T. Cowt<strong>on</strong>, S. Palmer and J. Wadham. 2011.<br />
Supraglacial forcing <strong>of</strong> subglacial drainage in <strong>the</strong> ablati<strong>on</strong> z<strong>on</strong>e <strong>of</strong> <strong>the</strong> greenland ice sheet.<br />
Geophys. Res. Lett., 38(L08502). Doi: 10.1029/2011GL047063.<br />
Collins, D.. 1979. Hydrochemistry <strong>of</strong> meltwaters draining from and alpine glacier. Arctic and<br />
Alpine Research, 11(3), 307–324.<br />
Hods<strong>on</strong>, A.. 2006. Biogeochemistry <strong>of</strong> snowmelt in an antarctic glacial ecosystem. Water<br />
Resour. Res., 42. Doi: 10.1029/2005WR004311.<br />
Sharp, M., G. Brown, M. Tranter, I. Willis and B. Hubbard. 1995. Comments <strong>on</strong> <strong>the</strong> <strong>use</strong> <strong>of</strong><br />
chemically based mixing models in glacier hydrology. J. Glaciol., 41(138), 241–245.<br />
Tranter, M., M. Sharp, H. Lamb, G. Brown, B. Hubbard and I. Willis. 2002. Geochemical wea<strong>the</strong>ring<br />
at <strong>the</strong> bed <strong>of</strong> haut glacier d’arolla, switzerland - a new model. Hydrol. Process.,<br />
16(5), 959–993.<br />
Tranter, M., A. Fountain, C. Fritsen, W. Ly<strong>on</strong>s, J. Priscu, P. Statham and K. Welch. 2004. Extreme<br />
hydrochemical c<strong>on</strong>diti<strong>on</strong>s in natural microcosms entombed within antarctic ice. Hydrol.<br />
Process., 18(2), 379–387.<br />
Wadham, J., A. Hods<strong>on</strong>, M. Tranter and J. Dowdeswell. 1998. The hydrochemistry <strong>of</strong> meltwaters<br />
draining a poly<strong>the</strong>rmal-based, high arctic glacier, south svalbard: I. <strong>the</strong> ablati<strong>on</strong><br />
seas<strong>on</strong>. Hydrol. Process., 12(12), 1825–1849.<br />
21
Design and performance <strong>of</strong> <strong>the</strong> GEUS AWS<br />
Michele Citterio<br />
Dept. <strong>of</strong> Marine Geology and Glaciology, GEUS - Geological Survey <strong>of</strong> Denmark and Greenland,<br />
Øster Voldgade 10, 1350 Copenhagen, Denmark. mcit@geus.dk, +45 38142113<br />
Design <strong>of</strong> <strong>the</strong> current GEUS AWS started in late 2007, after Campbell Scientific<br />
disc<strong>on</strong>tinued <strong>the</strong> CR10X datalogger <strong>use</strong>d in <strong>the</strong> previous GEUS AWS.<br />
In March 2008 <strong>the</strong> prototype was deployed in NE Greenland as <strong>the</strong> first<br />
unit in <strong>the</strong> field, and to date it has operated c<strong>on</strong>tinuously with <strong>on</strong>ly routine<br />
maintenance for sensor recalibrati<strong>on</strong> and normal redrilling <strong>of</strong> sensors<br />
drilled into <strong>the</strong> ice. As <strong>of</strong> 2011, all <strong>of</strong> <strong>the</strong> ca. 25 AWS operated by GEUS<br />
both for research and commercial purposes al<strong>on</strong>g <strong>the</strong> margin <strong>of</strong> <strong>the</strong> Greenland<br />
ice sheet and <strong>on</strong> surrounding local <strong>glaciers</strong> and ice caps share this<br />
same design, with a few units carrying project-specific sensor suites and<br />
settings. In what follows, <strong>the</strong> main focus is <strong>on</strong> <strong>the</strong> system layout and especially<br />
<strong>the</strong> power supply and satellite telemetry sub<strong>systems</strong>, as <strong>the</strong>se<br />
required specific adaptati<strong>on</strong>s to <strong>the</strong> high latitude envir<strong>on</strong>ment. The unusual<br />
c<strong>on</strong>figurati<strong>on</strong> <strong>of</strong> <strong>the</strong> multiplexer is also addressed briefly. No details<br />
are provided here about <strong>the</strong> tripod and <strong>the</strong> mechanical c<strong>on</strong>structi<strong>on</strong>, and<br />
about <strong>the</strong> processing chain at <strong>the</strong> receiving end in Copenhagen, which include<br />
decoding, near real-time forwarding <strong>of</strong> instantaneous observati<strong>on</strong>s<br />
to <strong>the</strong> WMO network through <strong>the</strong> Danish Meteorological Institute (DMI),<br />
database assimilati<strong>on</strong>, data calibrati<strong>on</strong>, validati<strong>on</strong>, and web serving. The<br />
new GEUS AWS met its design goals and complete units or sub<strong>systems</strong><br />
were delivered to research partners and commercial customers.<br />
Design goals<br />
The main requirements for <strong>the</strong> new AWS were: suitability for uninterrupted<br />
high latitude operati<strong>on</strong>, reduced need for expensive <strong>on</strong>-site maintenance,<br />
support <strong>of</strong> a basic suite <strong>of</strong> sensors comparable to <strong>the</strong> older GEUS stati<strong>on</strong>s,<br />
and robust summer and winter satellite data telemetry at all latitudes and<br />
topographical settings. The new AWS system is built around <strong>the</strong> Campbell<br />
Scientific CR1000 datalogger and <strong>the</strong> s<strong>of</strong>tware, electr<strong>on</strong>ics, wiring and mechanical<br />
elements are standardized to allow plug-in interchangeability <strong>of</strong><br />
sensors and parts from any GEUS stati<strong>on</strong>, including some from <strong>the</strong> older<br />
design. Extended sensor suites from <strong>the</strong> basic c<strong>on</strong>figurati<strong>on</strong> normally require<br />
<strong>on</strong>ly adding plugs <strong>on</strong> <strong>the</strong> logger box and minor changes to <strong>the</strong> logger<br />
program. Reduced sensor suites require no or minor rec<strong>on</strong>figurati<strong>on</strong> <strong>of</strong> <strong>the</strong><br />
s<strong>of</strong>tware in <strong>the</strong> headers <strong>of</strong> <strong>the</strong> logger program. Plugs for omitted sensors<br />
are usually installed and left empty to ease future additi<strong>on</strong>s in <strong>the</strong> field, an<br />
opti<strong>on</strong> that has already been <strong>use</strong>d several times.<br />
22
Figure 1. C<strong>on</strong>ceptual diagram <strong>of</strong> <strong>the</strong> current GEUS AWS for glaciological <strong>use</strong> in Greenland.<br />
Sensors suite and multiplexing<br />
The CR1000 measures all analog sensors ei<strong>the</strong>r directly or through a Campbell<br />
AM16/32 multiplexer in a 2+2 x 16 c<strong>on</strong>figurati<strong>on</strong>, with two lines going<br />
directly to <strong>the</strong> datalogger and <strong>the</strong> remaining two being part <strong>of</strong> two precisi<strong>on</strong><br />
half bridges for <strong>the</strong>rmistor excitati<strong>on</strong> and measurement (Fig. 1). Each<br />
<strong>on</strong>e <strong>of</strong> <strong>the</strong> 16 positi<strong>on</strong>s <strong>of</strong> <strong>the</strong> multiplexer thus supports two <strong>the</strong>rmistors<br />
plus ei<strong>the</strong>r <strong>on</strong>e differential or two single-ended analog measuerements,<br />
for a maximum <strong>of</strong> 32 <strong>the</strong>rmistors plus ei<strong>the</strong>r 32 single ended or 16 differential<br />
measurements in additi<strong>on</strong> to <strong>the</strong> regular input channels <strong>on</strong> <strong>the</strong><br />
CR1000 wiring panel. The basic suite <strong>of</strong> analog sensors is ra<strong>the</strong>r c<strong>on</strong>venti<strong>on</strong>al:<br />
a Campbell CS100 (Setra mod. 278) barometer, an assembly <strong>of</strong> a<br />
Rotr<strong>on</strong>ic forced aspirati<strong>on</strong> radiati<strong>on</strong> shield hosting an MP100H probe with a<br />
Pt100 sensor and HygroClip S3 air temperature and relative humidity sensors,<br />
a Young 05103 wind m<strong>on</strong>itor, a Kipp & Z<strong>on</strong>en CNR 1 net radiometer<br />
wired so that each <strong>on</strong>e <strong>of</strong> <strong>the</strong> four radiometers are measured individually,<br />
a custom GEUS 8-levels <strong>the</strong>rmistor string, a custom GEUS ablati<strong>on</strong> meter<br />
based <strong>on</strong> a Ørum & Jensen NT 1400 pressure transducer at <strong>the</strong> bottom <strong>of</strong> a<br />
fluid column, and an HL-Planar NS-25/E2 two axes tilt meter <strong>on</strong> <strong>the</strong> instruments<br />
boom to measure <strong>the</strong> tilt <strong>of</strong> <strong>the</strong> CNR 1 radiometers. The digital devices<br />
are c<strong>on</strong>nected directly to <strong>the</strong> CR1000 ei<strong>the</strong>r through <strong>the</strong> serial RS232<br />
D9 c<strong>on</strong>nector (Iridium SBD modem with integrated single frequency GPS)<br />
or <strong>the</strong> datalogger digital channels. To accommodate all devices, <strong>the</strong> two<br />
Campbell Scientific SR50A included in <strong>the</strong> standard sensors suite share<br />
23
<strong>the</strong> same physical channel and are rec<strong>on</strong>figured to <strong>use</strong> <strong>the</strong> addressing capability<br />
<strong>of</strong> <strong>the</strong> SDI12 bus. A number <strong>of</strong> additi<strong>on</strong>al sensors have been easily<br />
added at specific stati<strong>on</strong>s, including additi<strong>on</strong>al <strong>the</strong>rmistor strings, a sec<strong>on</strong>d<br />
complete Rotr<strong>on</strong>ic assembly, a Vaisala HMP45C-L air temperature and<br />
RH probe in a passive plate radiati<strong>on</strong> shield, a vibrating wire rain gauge,<br />
an experimental snow pillow, a Garmin GPS16X receiver and a H<strong>on</strong>eywell<br />
HMR3300 3-axes solid state compass. For ease <strong>of</strong> testing <strong>the</strong> logger program<br />
provides a temporary "fast scan" mode repeatedly cycling through<br />
<strong>the</strong> sensors measurement routine and displaying <strong>the</strong> results.<br />
Power<br />
Power is supplied by four 12 V, 28 Ah sealed lead-gel batteries wired in<br />
parallel in a battery box suspended to <strong>the</strong> bottom <strong>of</strong> <strong>the</strong> tripod mast and<br />
acting as a ca. 50 kg ballast. When sunlight is available, <strong>the</strong> batteries<br />
are recharged by a 10 W solar panel c<strong>on</strong>nected to <strong>the</strong> battery box via a<br />
power Schottky diode <strong>on</strong> <strong>the</strong> positive rail and <strong>the</strong> (opti<strong>on</strong>al) current shunt<br />
in <strong>the</strong> logger box <strong>on</strong> <strong>the</strong> ground rail. C<strong>on</strong>trary to <strong>the</strong> old GEUS stati<strong>on</strong>s,<br />
<strong>the</strong> combined 112 Ah nominal battery capacity is not split in "critical" and<br />
"sec<strong>on</strong>dary" functi<strong>on</strong>s. Instead, <strong>the</strong> logger s<strong>of</strong>tware manages power c<strong>on</strong>sumpti<strong>on</strong><br />
according to <strong>the</strong> programmed settings and to battery voltage,<br />
with an <strong>automatic</strong> low power mode (Tab. 1) where n<strong>on</strong>-essential and power<br />
expensive tasks like satellite transmissi<strong>on</strong> are <strong>automatic</strong>ally suspended. A<br />
c<strong>on</strong>figurable voltage hysteresis setting ensures stability <strong>of</strong> transiti<strong>on</strong>s between<br />
power modes. The CR1000 c<strong>on</strong>trols power to most sensors through<br />
its built-in 12 V output, and two additi<strong>on</strong>al power rails with 5 A current ratings<br />
using two MOSFET switches powering <strong>the</strong> aspirated radiati<strong>on</strong> screen<br />
fan (12 V) and <strong>the</strong> GPS and Iridium SBD modem (5 V from a well filtered<br />
DC/DC c<strong>on</strong>verter). GPS fix and satellite transmissi<strong>on</strong> rates can both be<br />
set independently for winter and summertime to compromise between<br />
power availability, data needs and airtime costs. Up to four system currents<br />
are measured through Kelvin-c<strong>on</strong>nected shunt resistors: solar panel<br />
output, battery output (negative when recharging), aspirator fan current,<br />
and satellite modem plus GPS current. This simplifies maintenance in <strong>the</strong><br />
field, remote diagnostics <strong>of</strong> faults, and positive check that <strong>the</strong> aspirati<strong>on</strong><br />
fan was actually running at all programmed times. The comm<strong>on</strong> mode<br />
range <strong>of</strong> <strong>the</strong> CR1000 analog inputs requires low-side sensing <strong>of</strong> <strong>the</strong> current<br />
shunt. Proper design <strong>of</strong> <strong>the</strong> ground system is required to obtain adequate<br />
separati<strong>on</strong> <strong>of</strong> analog and digital grounds and to avoid ground loops especially<br />
close to <strong>the</strong> DC/DC c<strong>on</strong>verter and for high impedance signals. The<br />
system star ground is electrically located at <strong>the</strong> CR1000 ground. The cable<br />
shields entering <strong>the</strong> logger box, <strong>the</strong> internal system ground and <strong>the</strong> logger<br />
box ground lug are electrically tied toge<strong>the</strong>r and to <strong>the</strong> metal structure <strong>of</strong><br />
<strong>the</strong> tripod. This is meant to provide a c<strong>on</strong>trolled and safe electric path to<br />
avoid electrostatic discharges through sensitive devices like semic<strong>on</strong>ductors<br />
and precisi<strong>on</strong> resistors such as <strong>the</strong> transducers in <strong>the</strong> wind m<strong>on</strong>itor. It<br />
does not provide any lightning protecti<strong>on</strong>, as <strong>the</strong> ice surface <strong>the</strong> stati<strong>on</strong> is<br />
standing <strong>on</strong> is not c<strong>on</strong>ductive.<br />
24
Table 1. C<strong>on</strong>servative example <strong>of</strong> power budget for a GEUS AWS in <strong>the</strong> summer, winter and<br />
low-power modes <strong>of</strong> operati<strong>on</strong>. Following field experience, settings have been relaxed<br />
toward higher power c<strong>on</strong>sumpti<strong>on</strong>, with significantly l<strong>on</strong>ger aspirati<strong>on</strong> and GPS <strong>on</strong> times.<br />
Device average<br />
current<br />
(mA)<br />
<strong>on</strong> time<br />
(sec/repetiti<strong>on</strong>)<br />
daily<br />
repetiti<strong>on</strong>s<br />
duty<br />
cycle<br />
(%)<br />
c<strong>on</strong>sumpti<strong>on</strong><br />
(mAh/day)<br />
Aspirator fan 150 45 144 7.50 270 8.21<br />
NAL GPS 120 130 8 1.20 35 1.05<br />
NAL Iridium 150 40 9 0.42 15 0.46<br />
Scan (sensors,<br />
MUX, logger)<br />
50 10 144 1.67 20 0.61<br />
System standby 1 1 86400 100.0 24 0.73<br />
WINTER RATES total m<strong>on</strong>thly c<strong>on</strong>sumpti<strong>on</strong> (Ah/m<strong>on</strong>th) 11.06<br />
Device average<br />
current<br />
(mA)<br />
<strong>on</strong> time<br />
(sec/repetiti<strong>on</strong>)<br />
daily<br />
repetiti<strong>on</strong>s<br />
duty<br />
cycle<br />
(%)<br />
c<strong>on</strong>sumpti<strong>on</strong><br />
(mAh/day)<br />
Aspirator fan 150 45 144 7.50 270 8.21<br />
NAL GPS 120 130 48 7.22 208 6.33<br />
NAL Iridium 150 40 25 1.16 42 1.27<br />
Scan (sensors,<br />
MUX, logger)<br />
50 10 144 1.67 20 0.61<br />
System standby 1 1 86400 100.0 24 0.73<br />
SUMMER RATES total m<strong>on</strong>thly c<strong>on</strong>sumpti<strong>on</strong> (Ah/m<strong>on</strong>th) 17.15<br />
Device average<br />
current<br />
(mA)<br />
<strong>on</strong> time<br />
(sec/repetiti<strong>on</strong>)<br />
daily<br />
repetiti<strong>on</strong>s<br />
duty<br />
cycle<br />
(%)<br />
c<strong>on</strong>sumpti<strong>on</strong><br />
(mAh/day)<br />
Aspirator fan 150 45 0 0.00 0 0.00<br />
NAL GPS 120 130 0 0.00 0 0.00<br />
NAL Iridium 150 40 0 0.00 0 0.00<br />
Scan (sensors,<br />
MUX, logger)<br />
50 10 144 1.67 20 0.61<br />
System standby 1 1 86400 100.0 24 0.73<br />
LOW POWER MODE RATES total m<strong>on</strong>thly c<strong>on</strong>sumpti<strong>on</strong> (Ah/m<strong>on</strong>th) 1.34<br />
Satellite telemetry and data storage<br />
c<strong>on</strong>sumpti<strong>on</strong><br />
(Ah/m<strong>on</strong>th)<br />
c<strong>on</strong>sumpti<strong>on</strong><br />
(Ah/m<strong>on</strong>th)<br />
c<strong>on</strong>sumpti<strong>on</strong><br />
(Ah/m<strong>on</strong>th)<br />
All GEUS AWS store raw sample records from each measurement locally<br />
in a flash card, and most are set to also transmit averaged and/or instantaneous<br />
values at a scheduled slower rate <strong>of</strong> <strong>on</strong>ce every <strong>on</strong>e up to<br />
three or more hours year-round. Instantaneous observati<strong>on</strong>s at synoptic<br />
times can be appended, received in near real-time and forwarded to<br />
<strong>the</strong> WMO network through DMI. Current GEUS AWS <strong>use</strong> modems based<br />
<strong>on</strong> <strong>the</strong> 9601 and 9602 Iridium SBD transceivers. The polar orbits <strong>of</strong> <strong>the</strong><br />
Iridium satellites and <strong>the</strong>ir excellent coverage <strong>of</strong> <strong>the</strong> poles make this soluti<strong>on</strong><br />
vastly superior to <strong>the</strong> older GEUS stati<strong>on</strong>s using <strong>the</strong> Inmarsat AOR-E<br />
and AOR-W geostati<strong>on</strong>ary satellites, which are not visible in north Greenland<br />
and from most sites <strong>on</strong> local <strong>glaciers</strong> and ice caps. The Iridium SBD<br />
modem c<strong>on</strong>sumes significant power, so it is powered <strong>on</strong>ly for short intervals,<br />
quickly giving up waiting for service and <strong>on</strong>ly retrying <strong>on</strong>ce in <strong>the</strong><br />
(uncomm<strong>on</strong>) circumstance <strong>of</strong> a failed transmissi<strong>on</strong>. To avoid data loss <strong>the</strong><br />
25
CR1000 CRBasic program maintains a message queue <strong>of</strong> messages that<br />
failed to transmit, and it sends <strong>the</strong>m at <strong>the</strong> first good occasi<strong>on</strong>. The system<br />
proved extremely robust, with <strong>the</strong> first deployed stati<strong>on</strong> not having<br />
missed a scheduled message over more than 3 years <strong>of</strong> uninterrupted<br />
operati<strong>on</strong>. Diagnostic messages c<strong>on</strong>taining a c<strong>on</strong>figurable record <strong>of</strong> additi<strong>on</strong>al<br />
statistics <strong>of</strong> battery voltage, system currents, reported transmissi<strong>on</strong><br />
failures, length <strong>of</strong> <strong>the</strong> waiting message queue, voltage <strong>of</strong> <strong>the</strong> lithium memory<br />
backup battery and so <strong>on</strong> are transmitted at l<strong>on</strong>ger, weekly to m<strong>on</strong>thly<br />
intervals. The logger program has a "force transmissi<strong>on</strong>" command to assist<br />
in testing and troubleshooting transmissi<strong>on</strong>-related problems. Despite<br />
Iridium SBD airtime being relatively cheap, a large number <strong>of</strong> stati<strong>on</strong>s sum<br />
up to a significant cost. Since 2009 transmissi<strong>on</strong>s from most stati<strong>on</strong>s have<br />
been switched from printable ascii to a custom binary format mimicking<br />
<strong>the</strong> somewhat idiosyncratic 2 bytes base-10 representati<strong>on</strong> <strong>of</strong> <strong>the</strong> Campbell<br />
Scientific FP2 floating point type and <strong>the</strong> more standard four bytes<br />
signed l<strong>on</strong>g integer type. These more compact representati<strong>on</strong>s reduced<br />
<strong>the</strong> size <strong>of</strong> messages by ca. 60% <strong>of</strong> <strong>the</strong>ir ascii equivalents, and <strong>the</strong> total<br />
airtime bill for all stati<strong>on</strong>s by several thousands <strong>of</strong> dollars per year.<br />
26
Installing a high-altitude wea<strong>the</strong>r stati<strong>on</strong> network<br />
in <strong>the</strong> high Argentinean Andes<br />
Sebastián A. Crespo<br />
Instituto Argentino de Nivología, Glaciología y Ciencias Ambientales<br />
Casilla de correo 330, Mendoza, Argentina. Tel.: +54-0261-5244033.<br />
Email: screspo@mendoza-c<strong>on</strong>icet.gov.ar<br />
http://www.glaciares.org.ar<br />
There are many serious gaps regarding <strong>the</strong> m<strong>on</strong>itoring and understanding<br />
<strong>of</strong> <strong>the</strong> climate <strong>of</strong> <strong>the</strong> Andes in sou<strong>the</strong>rn South America. Presently <strong>the</strong>re are<br />
very few operati<strong>on</strong>al high elevati<strong>on</strong> stati<strong>on</strong>s al<strong>on</strong>g this extensive mountain<br />
range, and records covering more than two or three decades are extremely<br />
scarce, outdated, and <strong>of</strong>ten incomplete. The lack <strong>of</strong> meteorological informati<strong>on</strong><br />
from high elevati<strong>on</strong> sites is a major limitati<strong>on</strong> for studying <strong>the</strong> past,<br />
present and future impacts <strong>of</strong> climate changes <strong>on</strong> water resources and<br />
<strong>glaciers</strong> in this regi<strong>on</strong>. The Instituto Argentino de Nivología, Glaciología y<br />
Ciencias Ambientales (IANIGLA) has initiated a project whose main goals<br />
are to install a series <strong>of</strong> permanent high-altitude wea<strong>the</strong>r stati<strong>on</strong>s al<strong>on</strong>g<br />
<strong>the</strong> Andes and to improve our understanding <strong>of</strong> <strong>the</strong> nati<strong>on</strong>’s mountain<br />
Figure 1. Locati<strong>on</strong> <strong>of</strong> <strong>the</strong> stati<strong>on</strong>s that are included in this project.<br />
27
Figure 2. Plaza de Mulas wea<strong>the</strong>r stati<strong>on</strong> near Cerro Ac<strong>on</strong>cagua (6962,m), with Glaciar<br />
Horc<strong>on</strong>es Superior and Cerro Cuerno in <strong>the</strong> background. The stati<strong>on</strong> was installed in<br />
February 2010. Photos: S. Crespo.<br />
climates for local and regi<strong>on</strong>al assessments. The network (Fig. 1) c<strong>on</strong>sists<br />
<strong>of</strong> twelve stati<strong>on</strong>s from Salta province in <strong>the</strong> north (22 ◦ S) down to Tierra<br />
del Fuego province in <strong>the</strong> sou<strong>the</strong>rn tip <strong>of</strong> South America (54 ◦ S) that will<br />
be m<strong>on</strong>itored and maintained in partnership with <strong>the</strong> Nati<strong>on</strong>al Undersecretariat<br />
<strong>of</strong> Water Resources. Each stati<strong>on</strong> will be equipped with sensors <strong>of</strong><br />
wind speed and directi<strong>on</strong>, atmospheric pressure, temperature, humidity,<br />
and snow and total precipitati<strong>on</strong>.<br />
Descripti<strong>on</strong> <strong>of</strong> sites<br />
• Stati<strong>on</strong>s in <strong>the</strong> Nor<strong>the</strong>rn porti<strong>on</strong> <strong>of</strong> <strong>the</strong> Argentinean Andes (Dry Andes,<br />
Figure 1): Three stati<strong>on</strong>s: Los Toldos (22.3 ◦ S, 64.68 ◦ W), Tuctuca<br />
(22.4 ◦ ,S, 65.22 ◦ W) and Ac<strong>on</strong>quija-Río Jaya (26.83 ◦ S, 65.16 ◦ W) will be<br />
installed in <strong>the</strong> near future in <strong>the</strong> Desert Andes. Their elevati<strong>on</strong>s range<br />
from 1850 to 4200 m and will be crucial for understanding climate variati<strong>on</strong>s<br />
al<strong>on</strong>g this diverse and poorly understood mountainous regi<strong>on</strong>.<br />
The fourth wea<strong>the</strong>r stati<strong>on</strong> has already been installed nearby <strong>the</strong> Aguas<br />
Negras Internati<strong>on</strong>al Pass, in <strong>the</strong> Desert Andes <strong>of</strong> <strong>the</strong> San Juan province,<br />
at 4500 m (Lat.: 30 ◦ 11’11.9" S L<strong>on</strong>g.: 69 ◦ 48’02.5" O).<br />
28
Figure 3. The ultras<strong>on</strong>ic water level sensor developed recently by S. Crespo to m<strong>on</strong>itor <strong>the</strong><br />
creek discharges with turbulent flux. The stati<strong>on</strong> was installed <strong>on</strong> February 2011 and is<br />
currently <strong>measuring</strong> <strong>the</strong> hourly streamflow incoming from <strong>the</strong> rock glacier El Salto.<br />
• Stati<strong>on</strong>s in <strong>the</strong> Central Andes (Fig. 1): In this porti<strong>on</strong> <strong>of</strong> <strong>the</strong> Argentinean<br />
Andes <strong>the</strong>re are two main mountain ranges with different climate<br />
regimes: Cordillera Principal and Cordillera Fr<strong>on</strong>tal. In <strong>the</strong> Cordillera<br />
Principal we recently installed <strong>the</strong> "Plaza de Mulas" wea<strong>the</strong>r stati<strong>on</strong><br />
(Fig. 2) at 4370 m <strong>of</strong> elevati<strong>on</strong> in <strong>the</strong> Ac<strong>on</strong>cagua mount Provincial Park,<br />
and a few km to <strong>the</strong> south <strong>of</strong> Cerro Ac<strong>on</strong>cagua, <strong>the</strong> "Las Cuevas" and<br />
"Cristo Redentor" wea<strong>the</strong>r stati<strong>on</strong>s (32 ◦ 48’ S, 70 ◦ 03’ W, 3200 m and 32 ◦<br />
49’ S, 70 ◦ 04’ W, 3850 m, respectively) have already been in <strong>the</strong> area. In<br />
<strong>the</strong> Cordillera Fr<strong>on</strong>tal <strong>the</strong> "Vallecitos" wea<strong>the</strong>r stati<strong>on</strong> is also already installed<br />
toge<strong>the</strong>r with a hydrometric gauge in fr<strong>on</strong>t <strong>of</strong> <strong>the</strong> "El Salto Rock<br />
Glacier" (Fig. 3).<br />
• Stati<strong>on</strong>s in <strong>the</strong> North Patag<strong>on</strong>ian Andes (Fig. 1): There will be two stati<strong>on</strong>s<br />
installed in nor<strong>the</strong>rn Patag<strong>on</strong>ia, <strong>the</strong> "Pampa Linda" (41 ◦ 12 S, 71 ◦<br />
48’ W, 850 m) and "La Almohadilla" (41 ◦ 11 S, 71 ◦ 48’ W, 1400 m), both<br />
nearby "M<strong>on</strong>te Tr<strong>on</strong>ador" (3478 m) in <strong>the</strong> Río Negro province.<br />
• Stati<strong>on</strong>s in <strong>the</strong> South Patag<strong>on</strong>ian Andes (Fig. 1): Four stati<strong>on</strong>s will be<br />
installed in this regi<strong>on</strong>. The "Perito Moreno" wea<strong>the</strong>r stati<strong>on</strong> in <strong>the</strong><br />
Perito Moreno Nati<strong>on</strong>al Park, nearby Nansen Lake (47 ◦ 48’ S, 72 ◦ 13’ W,<br />
970 m).; <strong>the</strong> "Chaltén" wea<strong>the</strong>r stati<strong>on</strong> in <strong>the</strong> Chaltén village (49 ◦ .20’ S,<br />
72 ◦ .50 ’W, 394 m), and ano<strong>the</strong>r stati<strong>on</strong> located <strong>on</strong> <strong>the</strong> eastern margin<br />
29
<strong>of</strong> <strong>the</strong> South Patag<strong>on</strong>ian Icefield near Glaciar Túnel (49 ◦ 23’ S, 73 ◦ 04’ W,<br />
815 m). Fur<strong>the</strong>r south, in <strong>the</strong> Tierra del Fuego province, ano<strong>the</strong>r wea<strong>the</strong>r<br />
stati<strong>on</strong> will be installed at "Paso Garibaldi" (54 ◦ .40’ S, 67 ◦ .50’ W, 285 m).<br />
Acknowledgements<br />
I would like to thank to Dr. Mariano Masiokas and Dr. Ricardo Villalba for <strong>the</strong>ir guidance in my<br />
studies, Dr. Brian Luckman (University <strong>of</strong> Western Ontario, Canada) and <strong>the</strong> Inter-American<br />
Institute for Global Change Research (through <strong>the</strong> project CRN 2047) for <strong>the</strong> support to at-<br />
tend this meeting, and <strong>the</strong> organizers and all <strong>the</strong> people I met in <strong>the</strong> workshop during that<br />
w<strong>on</strong>derful week in P<strong>on</strong>tresina.<br />
30
AWS measurements <strong>on</strong> <strong>glaciers</strong> in <strong>the</strong> Italian<br />
Alps<br />
G. Diolaiuti 1 , A. Senese 1 , C. Mihalcea 1 , G.P. Verza 2 , B. Mosc<strong>on</strong>i 1 and C. Smiraglia 1<br />
1 Earth Sciences Department <strong>of</strong> Milan University (Italy).<br />
Email: guglielmina.diolaiuti@unimi.it, ant<strong>on</strong>ella.senese@unimi.it, claudia.mihalcea@unimi.it<br />
2 Evk2CNR Committee Bergamo (Italy).<br />
Introducti<strong>on</strong><br />
A network <strong>of</strong> <strong>automatic</strong> wea<strong>the</strong>r stati<strong>on</strong>s (AWS) located at high altitude<br />
<strong>on</strong> <strong>the</strong> most representative Italian <strong>glaciers</strong> was developed by researchers<br />
<strong>of</strong> Earth Sciences Department (ESD) <strong>of</strong> University <strong>of</strong> Milan (UNIMI) starting<br />
from 2005. The first AWS was installed in <strong>the</strong> ablati<strong>on</strong> area <strong>of</strong> Forni<br />
Glacier, (Upper Valtellina, Lombardy) <strong>on</strong> 26 th September 2005, followed<br />
by installati<strong>on</strong> in 2007 <strong>of</strong> three o<strong>the</strong>r AWSs: <strong>on</strong> East Dosdè Glacier (Upper<br />
Valtellina, Lombardy), Venerocolo Glacier (Adamello Group, Lombardy)<br />
and Gèant Glacier (M<strong>on</strong>t Blanc Group, Valle d’Aosta). The AWS set up <strong>on</strong><br />
Forni Glacier is similar to <strong>the</strong> Morteratsch glacier AWS managed by University<br />
<strong>of</strong> Utrecht. Also <strong>the</strong> o<strong>the</strong>r AWSs <strong>use</strong>d this set up as a model, since it is<br />
c<strong>on</strong>sidered as <strong>on</strong>e <strong>of</strong> <strong>the</strong> best for melting surfaces in <strong>the</strong> ablati<strong>on</strong> area <strong>of</strong><br />
alpine <strong>glaciers</strong>.<br />
High altitude meteorological c<strong>on</strong>diti<strong>on</strong>s over <strong>glaciers</strong> <strong>of</strong> Western and<br />
Central Italian Alps and c<strong>on</strong>sequences for energy and mass balance <strong>of</strong><br />
<strong>glaciers</strong> are analysed from collected data. In particular, <strong>the</strong> glacier surface<br />
energy fluxes are analysed and <strong>the</strong> surface energy balance and total<br />
melting are calculated. Snow accumulati<strong>on</strong> was also measured to estimate<br />
<strong>the</strong> glacier mass balance. The datasets from <strong>the</strong> 4 AWSs are compared<br />
with data from synoptic stati<strong>on</strong>s situated outside <strong>the</strong> <strong>glaciers</strong> and<br />
with o<strong>the</strong>r supra-glacial AWSs (e.g. AWS <strong>on</strong> Morteratsch glacier). The<br />
analysis and comparis<strong>on</strong>s are made in collaborati<strong>on</strong> with Department <strong>of</strong><br />
Physics <strong>of</strong> UNIMI (Pr<strong>of</strong>. Maugeri), ARPA Lombardia, ARPA Valle d’Aosta and<br />
Valle d’Aosta Regi<strong>on</strong>.<br />
The AWSs<br />
The specificati<strong>on</strong>s <strong>of</strong> <strong>the</strong> sensors at each stati<strong>on</strong> are presented in Tables 1<br />
and 2 (Fig. 1).<br />
The AWS1 Forni (Fig. 1a) is set up <strong>on</strong> <strong>the</strong> ablati<strong>on</strong> t<strong>on</strong>gue at <strong>the</strong> base<br />
<strong>of</strong> <strong>the</strong> Eastern icefall <strong>of</strong> Forni Glacier. The AWS was checked several times,<br />
particularly during <strong>the</strong> first year, and no important issues were observed<br />
(Citterio et al., 2007; Senese et al., 2010, 2011). Despite <strong>the</strong> high winter<br />
snow accumulati<strong>on</strong>, <strong>the</strong> AWS is never completely covered by <strong>the</strong> snow<br />
(Fig. 1a at <strong>the</strong> end <strong>of</strong> March 2010). This data record is <strong>the</strong> l<strong>on</strong>gest from<br />
31
Figure 1. The four AWSs. From <strong>the</strong> left: AWS1 Forni (a), AWS Dosdè-Levissima (b), AWS<br />
M<strong>on</strong>te Bianco-Osram (c) and AWS Venerocolo (d).<br />
Table 1. Structure details <strong>of</strong> AWSs.<br />
Data Logger LSI-Lastem<br />
Babuc ABC<br />
AWS1 Forni AWS Dosdè-<br />
Levissima<br />
LSI-Lastem<br />
e-log<br />
AWS M<strong>on</strong>te<br />
Bianco-Osram<br />
AWS<br />
Venerocolo<br />
LSI-Lastem e-log LSI-Lastem<br />
e-log<br />
GSM Modem YES YES YES NO<br />
Steel mast 5 m 5 m 5 m 5 m<br />
Battery 100 Ah 100 Ah 100 Ah 100 Ah<br />
Panel solar 40 W 40 W 40 W 40 W<br />
Memory card 2 Mb (6 m<strong>on</strong>ths) 2 Mb 2 Mb 2 Mb<br />
an Italian AWS. Only a break in <strong>the</strong> data set is observed from 5 th to 11 th<br />
October 2008.<br />
The AWS Dosdè-Levissima (Fig. 1b) was installed in summer 2007<br />
<strong>on</strong> <strong>the</strong> ablati<strong>on</strong> area <strong>of</strong> Dosdè Glacier (Cima Piazzi Group). It’s <strong>the</strong> highest<br />
permanent stati<strong>on</strong> in Lombardy Regi<strong>on</strong> (2850 m a.s.l.). The data were <strong>use</strong>d<br />
to analyse <strong>the</strong> energy exchanges during <strong>the</strong> first Italian experiment <strong>of</strong><br />
"glacial protector", <strong>on</strong> Dosdè Glacier (Diolaiuti et al., 2009). In additi<strong>on</strong><br />
an hydrological stati<strong>on</strong> was installed to measure meltwater discharge <strong>of</strong><br />
Viola Torrent in collaborati<strong>on</strong> to Politecnico <strong>of</strong> Milan (POLIMI). Then <strong>the</strong><br />
hydrological balance <strong>of</strong> <strong>the</strong> whole glacierized basin can be calculated from<br />
<strong>the</strong>se data.<br />
The AWS M<strong>on</strong>te Bianco-Osram (Fig. 1c), installed in collaborati<strong>on</strong><br />
with <strong>the</strong> EVK2CNR, is <strong>the</strong> highest Italian permanent AWS <strong>on</strong> glacier (at<br />
about 3430 m a.s.l.). The stati<strong>on</strong> is located about 400 m from <strong>the</strong> "Punta<br />
Helbr<strong>on</strong>ner" stati<strong>on</strong> <strong>of</strong> M<strong>on</strong>t Blanc cable car, in <strong>the</strong> Gèant Glacier accumulati<strong>on</strong><br />
area. It is easily accessible, not too visited by tourists and excursi<strong>on</strong>ists,<br />
external to <strong>the</strong> snow cat working area (near <strong>the</strong> Punta Helbr<strong>on</strong>ner<br />
<strong>the</strong> snow is removed to fill up crevasses). To measure c<strong>on</strong>tinuously rock<br />
temperature at <strong>the</strong>se elevati<strong>on</strong>s with different expositi<strong>on</strong>, an <strong>automatic</strong><br />
stati<strong>on</strong> was set up in 2008 close to <strong>the</strong> AWS in collaborati<strong>on</strong> with <strong>the</strong> researchers<br />
<strong>of</strong> Insubria University (BST). The aim is to measure <strong>the</strong> <strong>the</strong>rmal<br />
cycles in <strong>the</strong> rock walls at different depths and intensity <strong>of</strong> periglacial process<br />
and permafrost degradati<strong>on</strong> in alpine high altitude areas. The AWS<br />
32
Table 2. Structure details <strong>of</strong> AWSs.<br />
Variable Range Accuracy Manufacturer<br />
Air Temperature<br />
Relative<br />
Humidity<br />
Air<br />
Pressure<br />
Solar<br />
Radiati<strong>on</strong><br />
Infrared<br />
Radiati<strong>on</strong><br />
Snow<br />
level<br />
-30-+70 ◦C ±0.001 ◦C LSI-Lastem<br />
DMA570<br />
0-100 % ±1% LSI-Lastem<br />
DMA570<br />
400-800<br />
hPa<br />
±10 hPa LSI-Lastem<br />
DQA223<br />
0.3-3 μm ±5% Kipp and<br />
Z<strong>on</strong>en CNR-1<br />
5-50 μm ±5% Kipp and<br />
Z<strong>on</strong>en CNR-1<br />
0-1000 cm ±2 cm Campbell<br />
SR50<br />
Rain 0-1000 mm ±1 mm LSI-Lastem<br />
DQA035<br />
Wind<br />
Speed<br />
Wind<br />
Directi<strong>on</strong><br />
0-50 ms−1 ±1% LSI-Lastem<br />
DNA022<br />
0◦-360◦ ±1◦ LSI-Lastem<br />
DNA022<br />
** Only during first winter<br />
Forni Dosdè Bianco-<br />
Osram<br />
Venerocolo<br />
30 min. 30 min. 30 min. 10 min.<br />
30 min. NO 30 min. NO<br />
60 min. 30 min. 30 min. 10 min.<br />
30 min. 30 min. 30 min. 10 min.<br />
30 min. 30 min. 30 min. 10 min.<br />
60 min. ** 60 min. NO<br />
30 min. NO NO 60 min.<br />
60 min. NO NO 10 min.<br />
60 min. NO NO 10 min.<br />
data (in particular mass gains) complete <strong>the</strong> m<strong>on</strong>itoring <strong>of</strong> ablati<strong>on</strong> areas<br />
<strong>of</strong> Mount Blank Massif.<br />
The AWS Venerocolo (Fig. 1d) (2621 m a.s.l.) is located <strong>on</strong> <strong>the</strong> median<br />
moraine, <strong>of</strong> <strong>the</strong> debris-covered ablati<strong>on</strong> area. It was installed <strong>on</strong> July<br />
27 th 2007 and removed <strong>on</strong> October 11 th 2007. To complete <strong>the</strong> analysis,<br />
<strong>the</strong>rmistors were installed into <strong>the</strong> debris to measure <strong>the</strong> c<strong>on</strong>ductive heat<br />
flux through debris layer. Energy fluxes at <strong>the</strong> air-debris-ice interface were<br />
analyzed to calculate <strong>the</strong> energy available for ice melting and <strong>the</strong> debris<br />
cover influence.<br />
C<strong>on</strong>trols<br />
The battery level is recorded by <strong>the</strong> data logger to allow a test during<br />
<strong>the</strong> data downloading. The battery-<strong>on</strong>ly power supply, is estimated in<br />
excess <strong>of</strong> two m<strong>on</strong>ths, with <strong>the</strong> solar panels permanently obscured by<br />
snow accumulati<strong>on</strong> and accounting for low temperature operati<strong>on</strong> and self<br />
discharge.<br />
The download is every day thanks to <strong>the</strong> GSM modem. The c<strong>on</strong>necti<strong>on</strong><br />
allows a test <strong>of</strong> <strong>the</strong> instruments and so <strong>the</strong> maintenance by <strong>the</strong> researchers<br />
(e.g. <strong>the</strong> damage <strong>of</strong> solar panel and so <strong>the</strong> decreasing <strong>of</strong> battery<br />
power).<br />
Difficulties<br />
Regarding AWS1 Forni and AWS Dosdè-Levissima, <strong>the</strong> most difficulty is to<br />
get to <strong>the</strong> AWS during winter, it’s possible <strong>on</strong>ly by downhill ski (with a<br />
33
limited possibility to carry <strong>the</strong> equipment) or by helicopter (less limits but<br />
more costs).<br />
The limit <strong>of</strong> all AWSs is <strong>the</strong> energy aut<strong>on</strong>omy, in fact <strong>the</strong> solar panels<br />
are enough to power for <strong>the</strong> stati<strong>on</strong>, but ano<strong>the</strong>r panel was necessary to<br />
<strong>the</strong> GSM modem. Thus to implement <strong>the</strong> instruments (e.g. additi<strong>on</strong>al ventilated<br />
<strong>the</strong>rmometer) is necessary to provide to auxiliary energy <strong>systems</strong>.<br />
At <strong>the</strong> installati<strong>on</strong> <strong>the</strong> pluviometer <strong>of</strong> AWS1 Forni was at <strong>the</strong> surface, but<br />
in 2007 it was replaced at <strong>the</strong> height <strong>of</strong> o<strong>the</strong>r sensors due to <strong>the</strong> disturb<br />
by frequent visits by <strong>the</strong> tourists and excursi<strong>on</strong>ists.<br />
Beca<strong>use</strong> <strong>the</strong> AWS M<strong>on</strong>te Bianco-Osram is <strong>on</strong> <strong>the</strong> accumulati<strong>on</strong> z<strong>on</strong>e,<br />
during winter it’s completely covered by <strong>the</strong> snow. This ca<strong>use</strong>s <strong>the</strong> stop <strong>of</strong><br />
<strong>the</strong> battery loading by solar panel, c<strong>on</strong>sequently it was <strong>of</strong>ten necessary to<br />
replace <strong>the</strong> battery.<br />
The debris-covered surface makes it difficult to maintain <strong>the</strong> AWS Venerocolo<br />
for more than <strong>on</strong>e seas<strong>on</strong>, so it was removed <strong>on</strong> October.<br />
Comparis<strong>on</strong>s<br />
Regarding air temperature records, <strong>the</strong> comparis<strong>on</strong>s made by researchers<br />
<strong>of</strong> Physic Institute (UNIMI) show a best agreement between <strong>the</strong> datasets<br />
with a slight overestimati<strong>on</strong> during spring seas<strong>on</strong> due to <strong>the</strong> naturally ventilated<br />
<strong>the</strong>rmometer. The choice <strong>of</strong> this type <strong>of</strong> sensor is due to <strong>the</strong> energy<br />
c<strong>on</strong>sume. To estimate <strong>the</strong> overestimati<strong>on</strong> amount, a ventilated sensor<br />
with sec<strong>on</strong>dary supply will be installed to analyze <strong>the</strong> differences between<br />
<strong>the</strong> data from two sensors. Regarding measured energy fluxes, <strong>the</strong>se results<br />
are in agreement with data from Morteratsch Glacier (Oerlemans,<br />
2001).<br />
The AWS sites are routinely m<strong>on</strong>itored by surveyors from Regi<strong>on</strong>al Agency<br />
for Envir<strong>on</strong>mental Protecti<strong>on</strong> (ARPA Lombardia and ARPA Valle d’Aosta),<br />
thus making it possible to compare <strong>the</strong> snow pit data collected by <strong>the</strong>se<br />
surveyors with <strong>the</strong> data recorded from <strong>the</strong> s<strong>on</strong>ic ranger <strong>of</strong> stati<strong>on</strong>s. Comparis<strong>on</strong><br />
<strong>of</strong> <strong>the</strong> two datasets c<strong>on</strong>firms <strong>the</strong> reliability <strong>of</strong> <strong>the</strong> data acquired by<br />
<strong>the</strong> s<strong>on</strong>ic ranger.<br />
Future projects<br />
We would like to install o<strong>the</strong>r meteorological stati<strong>on</strong>s: 1) in accumulati<strong>on</strong><br />
basin <strong>of</strong> Forni Glacier to evaluate <strong>the</strong> mass gains and albedo, 2) outside<br />
<strong>the</strong> Dosdè Glacier (in a lower part) to determinate <strong>the</strong> local gradients and<br />
measure <strong>the</strong> liquid precipitati<strong>on</strong> nearby <strong>the</strong> hydrological stati<strong>on</strong> and 3) in<br />
ablati<strong>on</strong> z<strong>on</strong>e <strong>of</strong> Giant Glacier to evaluate <strong>the</strong> mass loses.<br />
Ano<strong>the</strong>r next step <strong>of</strong> our research will be <strong>the</strong> installati<strong>on</strong> <strong>of</strong> two <strong>automatic</strong><br />
hydrologic stati<strong>on</strong>s at Forni and Giant Glaciers sites to quantify <strong>the</strong><br />
flows and so <strong>the</strong> hydrologic balance <strong>of</strong> glacierized basin.<br />
With a view to <strong>the</strong> improvement <strong>of</strong> AWS Dosdè-Levissima and AWS<br />
M<strong>on</strong>te Bianco-Osram, <strong>the</strong> additi<strong>on</strong> <strong>of</strong> o<strong>the</strong>r sensors to measure <strong>of</strong> wind<br />
34
directi<strong>on</strong> and speed and liquid precipitati<strong>on</strong> (that increases <strong>the</strong> melting<br />
during summer periods) should be c<strong>on</strong>sidered.<br />
References<br />
Citterio, M., G. Diolaiuti, C. Smiraglia, G. Verza and E. Meraldi. 2007. Initial results from <strong>the</strong><br />
<strong>automatic</strong> wea<strong>the</strong>r stati<strong>on</strong> (aws) <strong>on</strong> <strong>the</strong> ablati<strong>on</strong> t<strong>on</strong>gue <strong>of</strong> forni glacier (upper valtellina,<br />
italy). Geografia Fisica e Dinamica Quaternaria, 30, 141–151.<br />
Diolaiuti, G., C. Smiraglia and E. Meraldi. 2009. Strategie di protezi<strong>on</strong>e “attiva” dei ghiacciai.<br />
neve e valanghe.<br />
Oerlemans, J.. 2001. Glaciers and Climate Change. Balkema. pp. 148.<br />
Senese, A., D. Diolaiuti, C. Mihalcea and C. Smiraglia. 2010. Evoluzi<strong>on</strong>e meteorologica sulla<br />
lingua di ablazi<strong>on</strong>e del ghiacciaio dei forni, gruppo ortles-cevedale (parco nazi<strong>on</strong>ale dello<br />
stelvio, lombardia) nel periodo 2006-2008. Bollettino Della Società Geografica Italiana,<br />
XIII, 3(4), 845–864.<br />
Senese, A., D. Diolaiuti, C. Mihalcea and C. Smiraglia. 2011. Energy and mass balance <strong>of</strong><br />
forni glacier (stelvio nati<strong>on</strong>al park, italian alps) from a 4-year meteorological data record.<br />
Arctic, Antarctic, and Alpine Research. Accepted.<br />
35
WMO’s Global Cryosphere Watch (GCW) and<br />
incorporati<strong>on</strong> <strong>of</strong> in-situ Glacier Observati<strong>on</strong>s<br />
Dr. Barry Goodis<strong>on</strong><br />
Observing and Informati<strong>on</strong> Systems Department World Meteorological Organizati<strong>on</strong> (WMO),<br />
Geneva, Switzerland<br />
Introducti<strong>on</strong><br />
The cryosphere, its changes, and its impacts, have received increased<br />
scientific scrutiny in recent years, and now receive c<strong>on</strong>tinual attenti<strong>on</strong><br />
by decisi<strong>on</strong> makers and coverage by <strong>the</strong> media, creating an unparalleled<br />
demand for authoritative informati<strong>on</strong> <strong>on</strong> past, present and future states<br />
<strong>of</strong> <strong>the</strong> world’s snow and ice resources. The cryosphere is global, existing<br />
in various forms spanning all latitudes and occurring in approximately <strong>on</strong>e<br />
hundred countries in additi<strong>on</strong> to <strong>the</strong> Antarctic c<strong>on</strong>tinent. Yet, it remains<br />
<strong>the</strong> most under-sampled domain in <strong>the</strong> climate system.<br />
WMO, with <strong>the</strong> co-operati<strong>on</strong> <strong>of</strong> o<strong>the</strong>r nati<strong>on</strong>al and internati<strong>on</strong>al bodies,<br />
organizati<strong>on</strong>s and institutes and using its global observing and telecommunicati<strong>on</strong><br />
capability, is in a positi<strong>on</strong> to provide an integrated, authoritative,<br />
c<strong>on</strong>tinuing assessment <strong>of</strong> <strong>the</strong> cryosphere - a Global Cryosphere Watch<br />
(GCW). At its Sixteenth World Meteorological C<strong>on</strong>gress (Cg-XVI), WMO approved<br />
<strong>the</strong> GCW Implementati<strong>on</strong> Strategy (Link) (as part <strong>of</strong> its decisi<strong>on</strong>s<br />
<strong>on</strong> Polar activities document) which outlines <strong>the</strong> next steps for developing<br />
GCW. WMO’s Executive Council Panel <strong>of</strong> Experts <strong>on</strong> Polar Observati<strong>on</strong>s, Research<br />
and Services (EC-PORS) will guide development <strong>of</strong> GCW (see Link).<br />
Support for GCW was expressed by representatives <strong>of</strong> countries from all<br />
<strong>of</strong> WMO’s six Regi<strong>on</strong>s, with many developing countries specifically identifying<br />
<strong>the</strong> important impacts that glacier change is having <strong>on</strong> <strong>the</strong>ir country.<br />
Global Cryosphere Watch<br />
GCW, in its full/comprehensive form, would include observati<strong>on</strong>, m<strong>on</strong>itoring,<br />
product development, assessment, predicti<strong>on</strong>, and related research.<br />
It would provide <strong>the</strong> internati<strong>on</strong>al mechanism for implementing <strong>the</strong> recommendati<strong>on</strong>s<br />
<strong>of</strong> <strong>the</strong> report <strong>of</strong> <strong>the</strong> Integrated Global Observing Strategy<br />
(IGOS) Cryosphere Theme (CryOS) (IGOS Cryospheric Theme, 2007) which<br />
identified observati<strong>on</strong>al requirements and gaps for cryospheric observing<br />
and m<strong>on</strong>itoring, including those for <strong>glaciers</strong>. CryOS development engaged<br />
over 80 scientists from Europe, North America and Asia and has become<br />
<strong>the</strong> key document <strong>on</strong> cryospheric observati<strong>on</strong>al needs from both satellite<br />
and in-situ observing <strong>systems</strong>. GCW aims to ensure a comprehensive, coordinated,<br />
and sustainable system <strong>of</strong> in-situ and satellite observati<strong>on</strong>s and<br />
informati<strong>on</strong> and access to related informati<strong>on</strong> through <strong>the</strong> WMO Integrated<br />
36
Observing System (WIGOS) and <strong>the</strong> WMO Informati<strong>on</strong> System (WIS) to allow<br />
full understanding <strong>of</strong> <strong>the</strong> cryosphere, its changes and its interacti<strong>on</strong>s<br />
within <strong>the</strong> earth system.<br />
GCW would include all elements <strong>of</strong> <strong>the</strong> cryosphere at nati<strong>on</strong>al, regi<strong>on</strong>al<br />
and global scales and would build <strong>on</strong> and integrate what is being d<strong>on</strong>e<br />
already by WMO Members and o<strong>the</strong>r operati<strong>on</strong>al and research organizati<strong>on</strong>s<br />
institutes and internati<strong>on</strong>al programs. Collaborati<strong>on</strong>, partnership and<br />
engagement <strong>of</strong> various programs is essential in providing reliable, comprehensive<br />
observati<strong>on</strong>s <strong>of</strong> <strong>the</strong> comp<strong>on</strong>ents <strong>of</strong> <strong>the</strong> cryosphere through<br />
an integrated observing approach from nati<strong>on</strong>al to global scale to meet<br />
<strong>the</strong> needs <strong>of</strong> climate, hydrology, wea<strong>the</strong>r and envir<strong>on</strong>mental science <strong>on</strong><br />
a multitude <strong>of</strong> time and space scales, reaching from polar ice to tropical<br />
<strong>glaciers</strong>. WMO specifically requested that GCW engage pilot and dem<strong>on</strong>strati<strong>on</strong><br />
projects in different regi<strong>on</strong>s <strong>of</strong> <strong>the</strong> world, including tropical regi<strong>on</strong>s<br />
with <strong>glaciers</strong>.<br />
C<strong>on</strong>tributi<strong>on</strong> <strong>of</strong> Automatic Measuring Systems <strong>on</strong> Glaciers to GCW<br />
Achieving sustained observati<strong>on</strong> and m<strong>on</strong>itoring <strong>of</strong> <strong>the</strong> cryosphere and related<br />
envir<strong>on</strong>mental variables is a key task in <strong>the</strong> development <strong>of</strong> GCW.<br />
Reference sites will be a key element in <strong>the</strong> effort to establish or c<strong>on</strong>solidate<br />
best practices, guidelines and standards for cryospheric measurement<br />
(including metadata standards) in co-operati<strong>on</strong> with resp<strong>on</strong>sible<br />
bodies within WMO and with partner scientific associati<strong>on</strong>s and intergovernmental<br />
bodies. This will include c<strong>on</strong>siderati<strong>on</strong> <strong>of</strong> data homogeneity,<br />
interoperability, and compatibility <strong>of</strong> observati<strong>on</strong>s from all GCW c<strong>on</strong>stituent<br />
observing and m<strong>on</strong>itoring <strong>systems</strong> and derived cryospheric products.<br />
A prototype GCW portal is currently under development to facilitate<br />
<strong>the</strong> exchange <strong>of</strong>, and access to, cryospheric data, informati<strong>on</strong> and products.<br />
Automatic <strong>measuring</strong> <strong>systems</strong> are recognized as essential and have<br />
a special role in acquiring observati<strong>on</strong>s in remote, <strong>of</strong>ten hostile envir<strong>on</strong>ments,<br />
including <strong>the</strong> world’s ice sheets and mountain <strong>glaciers</strong>. For example,<br />
<strong>the</strong> Greenland Climate Network (GC-Net), initiated in 1990 with <strong>the</strong><br />
intenti<strong>on</strong> to m<strong>on</strong>itor climatological and glaciological parameters at various<br />
locati<strong>on</strong>s <strong>on</strong> <strong>the</strong> Greenland Ice Sheet over several decades to study <strong>the</strong> climate<br />
variability, now has 20 <strong>automatic</strong> stati<strong>on</strong>s in operati<strong>on</strong> that report in<br />
near-real time - a sustained observing network. Likewise in <strong>the</strong> Antarctic,<br />
<strong>automatic</strong> wea<strong>the</strong>r stati<strong>on</strong>s <strong>of</strong>ten operated by research institutes provide<br />
<strong>the</strong> spatial distributi<strong>on</strong> <strong>of</strong> measurement so essential in understanding variability<br />
and change. These will be part <strong>of</strong> <strong>the</strong> new WMO Antarctic Observing<br />
Network (AntON). There are numerous examples <strong>of</strong> <strong>automatic</strong> stati<strong>on</strong>s <strong>on</strong><br />
or near <strong>glaciers</strong> in <strong>the</strong> world’s mountain regi<strong>on</strong>s, providing data for a variety<br />
<strong>of</strong> purposes, but not necessarily being part <strong>of</strong> an integrated observing<br />
network providing real and near real-time observati<strong>on</strong>s.<br />
GCW will initiate a comprehensive cryosphere observing network called<br />
"CryoNet", a network <strong>of</strong> reference sites or "supersites" in cold climate re-<br />
37
gi<strong>on</strong>s, <strong>on</strong> land or sea, operating a sustained, standardized programme<br />
for observing and m<strong>on</strong>itoring as many cryospheric comp<strong>on</strong>ents as possible.<br />
Initially, it will build <strong>on</strong> existing cryosphere observing programmes or<br />
add standardized cryospheric observati<strong>on</strong>s to existing facilities to create<br />
supersite envir<strong>on</strong>mental observatories. GCW will facilitate <strong>the</strong> establishment<br />
<strong>of</strong> high-latitude and high-altitude supersites with co-located measurements<br />
<strong>of</strong> as many key cryospheric and related envir<strong>on</strong>mental variables<br />
as possible. Wherever possible, <strong>the</strong>se would also serve as l<strong>on</strong>g-term<br />
cryospheric calibrati<strong>on</strong> / validati<strong>on</strong> sites for satellite derived cryospheric<br />
products and model outputs.<br />
Existing cold climate observatories, such as those in <strong>the</strong> WMO Global<br />
Atmosphere Watch (GAW), are potential sites for establishing or enhancing<br />
cryospheric observati<strong>on</strong>s. The Finnish Sodankylä-Pallas supersite in <strong>the</strong><br />
boreal forest <strong>of</strong> nor<strong>the</strong>rn Finland has been <strong>of</strong>fered as a CryoNet site. Its<br />
infrastructure is already designed for integrated m<strong>on</strong>itoring <strong>of</strong> soil-snowvegetati<strong>on</strong>-atmosphere<br />
interacti<strong>on</strong> and provides reference measurements<br />
for satellite sensors <strong>on</strong> a c<strong>on</strong>tinuous basis. Likewise <strong>the</strong> GCOS/GTOS Networks<br />
for Permafrost (GTN-P), Glaciers (-G) and Hydrology (-H) may <strong>of</strong>fer<br />
potential reference sites while providing key observati<strong>on</strong>s from <strong>the</strong>ir global<br />
networks. The World Glacier M<strong>on</strong>itoring Service (WGMS), for example, has<br />
stated that it is willing to support GCW with data, informati<strong>on</strong> and expertise<br />
from within <strong>the</strong> Global Terrestrial Network for Glaciers (GTN-G).<br />
WMO Member countries, through <strong>the</strong>ir cryosphere focal points, are being<br />
asked to recommend suitable sites. China, for example, is establishing<br />
supersites in <strong>the</strong> "Third Pole" regi<strong>on</strong> where <strong>the</strong> High Asian Cryosphere<br />
(HAC) serves as <strong>the</strong> Asian "water tower" for over a billi<strong>on</strong> people (Xiao<br />
Cunde, Chinese Meteorological Administrati<strong>on</strong>; pers. comm.). Several<br />
Chinese institutes, including <strong>the</strong> State Key Laboratory <strong>of</strong> Cryospheric Sciences,<br />
are planning seven supersites with each c<strong>on</strong>taining several reference<br />
sites for <strong>the</strong> HAC. The l<strong>on</strong>g-term purpose is to benefit <strong>the</strong> operati<strong>on</strong>al<br />
level <strong>of</strong> regi<strong>on</strong>al/global wea<strong>the</strong>r/climate predicti<strong>on</strong>, as well as a<br />
better water-usage assessment. The supersites are designed to cover major<br />
geographic units and climatic z<strong>on</strong>es <strong>of</strong> <strong>the</strong> regi<strong>on</strong>, thus representing<br />
most cryospheric comp<strong>on</strong>ents and types. Measurements include many<br />
different variables <strong>of</strong> cryospheric comp<strong>on</strong>ents (glacier, snow cover, frozen<br />
ground/permafrost, lake/river ice, solid precipitati<strong>on</strong>, hydrology), and o<strong>the</strong>r<br />
comp<strong>on</strong>ents related to <strong>the</strong> climate system (atmosphere, biosphere) using<br />
<strong>automatic</strong>, manual, and satellite methods. They have <strong>of</strong>fered to merge<br />
<strong>the</strong> HAC sites into CryoNet and help lead <strong>the</strong> development <strong>of</strong> standardized<br />
cryosphere observing programmes. Inclusi<strong>on</strong> <strong>of</strong> o<strong>the</strong>r sites in <strong>the</strong> regi<strong>on</strong><br />
would be especially <strong>use</strong>ful for l<strong>on</strong>g-term, integrated m<strong>on</strong>itoring.<br />
GCW will work to engage operators <strong>of</strong> observing <strong>systems</strong> in mountainous<br />
regi<strong>on</strong>s, working collaboratively with institutes, agencies and programs.<br />
GCW will initiate efforts to engage additi<strong>on</strong>al agencies to enhance<br />
observing in high altitude/glacier z<strong>on</strong>es in all regi<strong>on</strong>s <strong>of</strong> <strong>the</strong> world, including<br />
<strong>the</strong> implementati<strong>on</strong> <strong>of</strong> high altitude reference sites. In some countries,<br />
38
meteorological services operate glacier observing networks, while in o<strong>the</strong>rs<br />
it may be a different agency or academic institute. GCW recognizes<br />
that <strong>automatic</strong> observing <strong>of</strong> cryospheric comp<strong>on</strong>ents and related envir<strong>on</strong>mental<br />
variables <strong>on</strong> and near <strong>glaciers</strong> will be critical to improve our collective<br />
understanding <strong>of</strong> cryospheric change in mountainous regi<strong>on</strong>s <strong>of</strong> <strong>the</strong><br />
world.<br />
References<br />
GCW development. http://www.wmo.int/pages/prog/www/Antarctica/antarctic.html.<br />
GCW implementati<strong>on</strong> strategy. ftp://ftp.wmo.int/Documents/SESSIONS/Cg-XVI/English/Appro<br />
ved%26Corrected/ PINK11-9_POLAR_ACTIVITIES_en_2.doc.<br />
IGOS Cryospheric Theme. 2007. A cryosphere <strong>the</strong>me report for <strong>the</strong> igos partnership.<br />
WMO/TD-No. 1405, World Meteorological Organisati<strong>on</strong> (WMO), IGOS Integrated Global<br />
Observing Strategy. http://igos-cryosphere.org/docs/cryos_<strong>the</strong>me_report.pdf.<br />
WMO integrated observing system (WIGOS). http://www.wmo.int/pages/prog/www/wigos/in<br />
dex_en.html.<br />
WMO informati<strong>on</strong> system (WIS). http://www.wmo.int/pages/prog/www/WIS/.<br />
39
AWS measurements at <strong>the</strong> Belgian Antarctic<br />
stati<strong>on</strong> Princess Elisabeth, in Dr<strong>on</strong>ning Maud<br />
Land, for precipitati<strong>on</strong> and surface mass balance<br />
studies<br />
Irina V. Gorodetskaya 1 , Nicole P.M. van Lipzig 1 , Wim Boot 2 , Carleen Reijmer 2 ,<br />
Michiel R. van den Broeke 2<br />
1 Department Earth and Envir<strong>on</strong>mental Sciences, Katholieke Universiteit Leuven<br />
Celestijnenlaan 200E, Heverlee, 3001, Belgium<br />
Email: Irina.Gorodetskaya@ees.kuleuven.be<br />
2 Institute for Marine and Atmospheric Research, Utrecht University, Ne<strong>the</strong>rlands<br />
Introducti<strong>on</strong><br />
The Antarctic mass balance and <strong>the</strong> hydrological cycle <strong>of</strong> <strong>the</strong> entire planet<br />
are tightly linked toge<strong>the</strong>r. Evaporati<strong>on</strong> from <strong>the</strong> ocean surface in <strong>the</strong><br />
tropical and middle latitudes, poleward moisture and energy transport,<br />
changes in <strong>the</strong> midlatitude atmospheric dynamics, cloud formati<strong>on</strong> microphysics<br />
- all <strong>the</strong>se processes determine <strong>the</strong> amount <strong>of</strong> precipitati<strong>on</strong> in<br />
Antarctica. The main objective <strong>of</strong> our project is to improve <strong>the</strong> understanding<br />
<strong>of</strong> <strong>the</strong> atmospheric branch <strong>of</strong> <strong>the</strong> hydrological cycle <strong>of</strong> Antarctica<br />
covering <strong>the</strong> chain from evaporati<strong>on</strong>/sublimati<strong>on</strong> at <strong>the</strong> surface via cloud<br />
formati<strong>on</strong> to snowfall. As <strong>the</strong>re is a lack <strong>of</strong> data <strong>on</strong> <strong>the</strong> clouds and precipitati<strong>on</strong><br />
processes in <strong>the</strong> Antarctic, <strong>the</strong> first goal is to establish a new<br />
database that can be <strong>use</strong>d for local process studies and large-scale model<br />
evaluati<strong>on</strong>. The base for our measurements is <strong>the</strong> new Belgian Antarctic<br />
stati<strong>on</strong> Princess Elisabeth (PE) built <strong>on</strong> <strong>the</strong> Utsteinen Ridge in Dr<strong>on</strong>ning<br />
Maud Land, East Antarctica (71 ◦ 57’ S and 23 ◦ 20’ E, ∼1400 m asl, 180 km<br />
inland). Princess Elisabeth stati<strong>on</strong> is located in a nearly thousand kilometer<br />
wide "data gap", where no l<strong>on</strong>g-term measurements <strong>of</strong> <strong>the</strong> surface<br />
mass balance have been d<strong>on</strong>e up to date and where regi<strong>on</strong>al climate models<br />
show large differences in snow accumulati<strong>on</strong> estimates.<br />
Measurements<br />
The meteorological data have been collected by an Automatic Wea<strong>the</strong>r<br />
Stati<strong>on</strong> (AWS) installed 300 m east from <strong>the</strong> Utsteinen ridge in February<br />
2009 (Fig. 1, Tab. 1). The AWS provides hourly mean data <strong>of</strong> near-surface<br />
air temperature, relative humidity, pressure, wind speed and directi<strong>on</strong>, up<br />
and downward directed broadband short-wave and l<strong>on</strong>g-wave radiative<br />
fluxes, snow height changes, and a 1 m snow temperature pr<strong>of</strong>ile. In additi<strong>on</strong>,<br />
ground-based cloud and precipitati<strong>on</strong> remote-sensing instruments<br />
have been operating during several m<strong>on</strong>ths, from which characteristics<br />
<strong>of</strong> cloud properties and individual storms have been derived. Informati<strong>on</strong><br />
40
a. b.<br />
Figure 1. Automatic Wea<strong>the</strong>r Stati<strong>on</strong> installed as part <strong>of</strong> <strong>the</strong> HYDRANT project near <strong>the</strong><br />
Belgian Antarctic stati<strong>on</strong> Princess Elisabeth. The AWS is designed by <strong>the</strong> IMAU group (Link).<br />
(a) Photo <strong>of</strong> <strong>the</strong> AWS in February 2010; (b) zoom <strong>on</strong> <strong>the</strong> instrument yard.<br />
about <strong>the</strong> instruments and measurement campaigns can be found <strong>on</strong> <strong>the</strong><br />
project website (Link).<br />
Method <strong>of</strong> filtering <strong>the</strong> snow height data<br />
Measurements <strong>of</strong> snow height changes using ultras<strong>on</strong>ic altimeter sensor<br />
provide hourly data with 0.01 m accuracy (Tab. 1). The measurements are<br />
highly sensitive to <strong>the</strong> air temperature and correcti<strong>on</strong> is applied using <strong>the</strong><br />
AWS near-surface air temperature measurements assuming iso<strong>the</strong>rmal<br />
temperature pr<strong>of</strong>ile. In additi<strong>on</strong>, prior to computing daily accumulati<strong>on</strong><br />
Table 1. C<strong>on</strong>figurati<strong>on</strong> <strong>of</strong> <strong>the</strong> AWS installed as part <strong>of</strong> <strong>the</strong> HYDRANT project at <strong>the</strong> Belgian<br />
Antarctic Princess Elisabeth base.<br />
Variable Sensor Range Accuracy<br />
Temperature Vaisala HMP35AC -80 to +56 ◦ C 0.3 ◦ C<br />
Relative Humidity<br />
(with respect to liquid)<br />
Vaisala HMP35AC 0 to 100% 2% (RH90%)<br />
Wind Speed Young 05103<br />
propvane<br />
0 to 60 m/s 0.3 m/s<br />
Wind Directi<strong>on</strong> Young 05103 0 to 360◦ 3◦ Pressure Vaisala PTB101B 600 to 1060 hPa 4 hPa<br />
Shortwave radiati<strong>on</strong> Kipp CNR1 305 to 2800 nm,<br />
0 to 2000 W/m2 2%<br />
L<strong>on</strong>gwave radiati<strong>on</strong> Kipp CNR1 5 to 50 μm,<br />
-250 to +250 W/m2 15 W/m2 Height above snow SR50 0.5 to 10 m 0.01 m or 0.4%<br />
Power supply SL-790 Lithium batteries<br />
Data transmissi<strong>on</strong> ARGOS<br />
41
a.<br />
b.<br />
c.<br />
Figure 2. Filtering method for <strong>the</strong> height above snow measurements during 2009: (a)<br />
original 2-hourly data with red triangles showing <strong>the</strong> upper and lower demarcati<strong>on</strong> lines for<br />
<strong>the</strong> outliers based <strong>on</strong> <strong>the</strong> inter-quartile range; (b) 2-hourly data with <strong>the</strong> outliers rejected<br />
after <strong>the</strong> first filter with <strong>the</strong> new demarcati<strong>on</strong> lines; (c) daily accumulati<strong>on</strong> data calculated<br />
based <strong>on</strong> <strong>the</strong> filtered 2-hour snow height values, c<strong>on</strong>verted to mm w.e. (water equivalent)<br />
using local measured snow density (Tab. 2).<br />
values, <strong>the</strong> original hourly measurements <strong>of</strong> height above <strong>the</strong> snow surface<br />
were subject to filtering to eliminate false reflecti<strong>on</strong>s. During snowfall<br />
<strong>the</strong>re are possible reflecti<strong>on</strong>s from individual snowflakes. There are also<br />
some parts <strong>of</strong> <strong>the</strong> AWS mast, which can be giving false signals. This problem<br />
was discussed intensively during <strong>the</strong> workshop and apparently is a<br />
challenge for many AWS observati<strong>on</strong>s <strong>on</strong> <strong>glaciers</strong> and ice sheets. After<br />
trying out various techniques, we found a reliable statistical method <strong>of</strong><br />
42
Table 2. Annual mean values <strong>of</strong> major meteorological variables measured by <strong>the</strong> AWS at<br />
Utsteinen (standard deviati<strong>on</strong>s and extreme values are based <strong>on</strong> daily means).<br />
2009 2010<br />
Feb 2 - Nov 21 Jan 12 - Dec 31 *<br />
Variable Mean±std Min/Max Mean±std Min/Max<br />
Air temperature (K)<br />
RH (%) with respect<br />
to ice<br />
Specific humidity<br />
(g/kg)<br />
254.0 ± 5.4 240 (Aug) /<br />
267 (Feb)<br />
253.7 ± 7.1 * 237 (Jul) /<br />
269 (Jan)<br />
61 ± 22 18 / 102 48 ± 19 * 16 / 101<br />
0.58 ± 0.37 0.1 / 2.1 0.52 ± 0.51 * 0 ** / 2.6<br />
Pressure (hPa) 827 ± 8.7 802 / 857 842 ± 10.3 802 / 850<br />
Wind speed (m/s) 5.3 ± 3.4 0.1 / 17.3 4.6 ± 2.6 1.3 / 17.5<br />
Total accumulati<strong>on</strong><br />
(mm w,e,) ***<br />
235 26<br />
* A gap exists in air temperature and humidity data from Oct 17 to Dec 22 2010.<br />
** Specific humidity less than 0.1 g/kg is below <strong>the</strong> measurement accuracy <strong>of</strong> Vaisala<br />
humicap (Table 1).<br />
*** accumulati<strong>on</strong> calculated from snow height difference between <strong>the</strong> first and <strong>the</strong> last day<br />
<strong>of</strong> each year using <strong>the</strong> snow density = 335.7 kg/m 3 measured Feb 2009 near <strong>the</strong> AWS.<br />
data filtering taking into account variability during quasi-m<strong>on</strong>thly period<br />
(40 day) for <strong>the</strong> year with large step-wise accumulati<strong>on</strong> events, and yearly<br />
variability (yearly mean ±3σ) for <strong>the</strong> year with nearly zero total accumulati<strong>on</strong>.<br />
As <strong>the</strong> accumulati<strong>on</strong> can vary quite drastically over time and space,<br />
a filtering method can differ for various locati<strong>on</strong>s and even for different<br />
years at <strong>on</strong>e locati<strong>on</strong> depending <strong>on</strong> <strong>the</strong> accumulati<strong>on</strong> variability patterns,<br />
amounts and <strong>the</strong> height <strong>of</strong> <strong>the</strong> snow sensor above <strong>the</strong> snow. Thus, special<br />
scrutiny is required for accumulati<strong>on</strong> data based <strong>on</strong> <strong>the</strong> knowledge <strong>of</strong> local<br />
processes.<br />
For <strong>the</strong> year 2009 with large step-wise accumulati<strong>on</strong> events, <strong>the</strong> quartile<br />
filter was applied to <strong>the</strong> height above snow data (Fig. 2). The original<br />
2-hour time series was divided into 40-day intervals, and quartiles were<br />
calculated for each interval. The demarcati<strong>on</strong> line for <strong>the</strong> outliers was calculated<br />
as Q3+1.5*IQR for <strong>the</strong> top and Q1-1.5*IQR for <strong>the</strong> bottom whisker,<br />
where Q3 is <strong>the</strong> upper quartile, Q1 is <strong>the</strong> lower quartile, and IQR is <strong>the</strong><br />
inter-quartile range (Tukey, 1977). For 2010, <strong>the</strong> inter-quartile range was<br />
found to be very small, restricting <strong>the</strong> snow height change variability bey<strong>on</strong>d<br />
physically possible values. Thus, <strong>the</strong> 3σ filter was applied to <strong>the</strong><br />
2010 hourly values. Daily mean snow height change values were calculated<br />
from <strong>the</strong> filtered hour data. Daily accumulati<strong>on</strong> was computed as<br />
<strong>the</strong> difference between snow height values <strong>of</strong> <strong>the</strong> two c<strong>on</strong>secutive days.<br />
In <strong>the</strong> final verificati<strong>on</strong> <strong>of</strong> <strong>the</strong> filtered data set, <strong>the</strong> daily accumulati<strong>on</strong> data<br />
were checked for closure, i.e. difference between <strong>the</strong> total sum <strong>of</strong> all positive<br />
and all negative daily accumulati<strong>on</strong> values should be nearly equal to<br />
<strong>the</strong> difference between <strong>the</strong> first and <strong>the</strong> last daily mean snow height for<br />
each year.<br />
43
Some meteorology and accumulati<strong>on</strong> characteristics<br />
The AWS measurements during 2009-2010 showed that <strong>the</strong> Utsteinen site<br />
is characterized by relatively mild meteorological c<strong>on</strong>diti<strong>on</strong>s (Tab. 2). The<br />
minimum daily mean near-surface air temperature observed during 2009-<br />
2010 was 237 K and <strong>the</strong> maximum daily wind speed was 17 m/s (maximum<br />
hourly wind speed <strong>of</strong> 30 m/s was recorded during 2009 winter). The AWS<br />
is located north <strong>of</strong> Sør R<strong>on</strong>dane mountains, east <strong>of</strong> <strong>the</strong> Utsteinen ridge, in<br />
a valley, at <strong>the</strong> t<strong>on</strong>gue <strong>of</strong> <strong>the</strong> outlet glacier Gunnestadbreen. This glacier<br />
is believed to channel <strong>the</strong> katabatic wind at PE (Pattyn et al., 2010). Indeed,<br />
a small percentage <strong>of</strong> high wind speeds at Utsteinen was associated<br />
with cold temperatures indicating enhanced katabatic wind. Despite<br />
<strong>the</strong>se rare channeling events, <strong>the</strong> large scale katabatic flow, typically limited<br />
to 500-1000 m above <strong>the</strong> surface in <strong>the</strong> Antarctic escarpment z<strong>on</strong>e<br />
(Parish and Bromwich, 2007), is blocked by <strong>the</strong> mountain range reducing<br />
<strong>the</strong> katabatic wind speeds in <strong>the</strong> AWS locality. Wind speeds str<strong>on</strong>ger than<br />
5 m/s are restricted to <strong>the</strong> E-SE directi<strong>on</strong> and are mostly associated with<br />
cycl<strong>on</strong>ic activity in <strong>the</strong> near-coastal ocean regi<strong>on</strong>. Cluster analysis has<br />
shown that <strong>the</strong> warm periods with str<strong>on</strong>g wind speeds are associated with<br />
increased cloudiness and accumulati<strong>on</strong>, while cold periods have calm wind<br />
speeds and ei<strong>the</strong>r zero accumulati<strong>on</strong> or slight net ablati<strong>on</strong> (by sublimati<strong>on</strong><br />
or wind erosi<strong>on</strong>). Few str<strong>on</strong>g accumulati<strong>on</strong> events were resp<strong>on</strong>sible for <strong>the</strong><br />
majority <strong>of</strong> <strong>the</strong> total yearly accumulati<strong>on</strong> during 2009 (Fig. 2c). The <strong>on</strong>going<br />
research using <strong>the</strong> AWS data includes analysis <strong>of</strong> synoptic c<strong>on</strong>trols <strong>of</strong><br />
precipitati<strong>on</strong>, and estimates <strong>of</strong> sublimati<strong>on</strong> rates at Utsteinen compared<br />
to o<strong>the</strong>r Dr<strong>on</strong>ning Maud Land stati<strong>on</strong>s.<br />
References<br />
Hydrant project website. http://ees.kuleuven.be/hydrant.<br />
IMAU aws site. http://www.projects.science.uu.nl/iceclimate/aws/.<br />
Parish, T. and D. Bromwich. 2007. Reexaminati<strong>on</strong> <strong>of</strong> <strong>the</strong> near-surface airflow over <strong>the</strong> antarctic<br />
c<strong>on</strong>tinent and implicati<strong>on</strong>s <strong>on</strong> atmospheric circulati<strong>on</strong>s at high sou<strong>the</strong>rn latitudes. M<strong>on</strong>.<br />
Wea<strong>the</strong>r Rev., 135, 1961–1973.<br />
Pattyn, F., K. Matsuoka and J. Berte. 2010. Glacio-meteorological c<strong>on</strong>diti<strong>on</strong>s in <strong>the</strong> vicinity <strong>of</strong><br />
<strong>the</strong> belgian princess elisabeth stati<strong>on</strong>, antarctica. Antarctic Science, 22(1), 79–85.<br />
Tukey, J.. 1977. Exploratory Data Analysis. Addis<strong>on</strong>-Wesley, Reading, MA. 688 p.<br />
44
High-elevati<strong>on</strong> wea<strong>the</strong>r stati<strong>on</strong>s <strong>on</strong> <strong>glaciers</strong> in<br />
<strong>the</strong> Tropics - 2011 update<br />
Douglas R. Hardy<br />
Climate System Research Center and Geosciences Department, Univ. Massach<strong>use</strong>tts,<br />
Amherst<br />
Climate measurements c<strong>on</strong>tinue at automated wea<strong>the</strong>r stati<strong>on</strong>s (AWS) <strong>on</strong><br />
Quelccaya Ice Cap, Perú and <strong>on</strong> Kilimanjaro’s Nor<strong>the</strong>rn Ice Field (Tanzania).<br />
Situated <strong>on</strong> flat surfaces at <strong>the</strong> glacier’s highest elevati<strong>on</strong>s (5680 m<br />
and 5775 m, resp.), <strong>the</strong>se locati<strong>on</strong>s were selected to represent what are<br />
now - or <strong>on</strong>ce were - tropical glacier accumulati<strong>on</strong> z<strong>on</strong>es. The AWS began<br />
operating in August 2003 and February 2000, respectively, to provide a<br />
better understanding <strong>of</strong> processes by which ice cores record climate (e.g.<br />
Hardy et al., 2003); l<strong>on</strong>g ice-core records have been developed from both<br />
sites (Thomps<strong>on</strong> et al., 1985, 2002), and limited mass balance studies are<br />
<strong>on</strong>-going.<br />
Figure 1. AWS <strong>on</strong> Quelccaya (left) and Kilimanjaro (right; stati<strong>on</strong>s are adjacent to <strong>on</strong>e<br />
ano<strong>the</strong>r). The Quelccaya tower and <strong>on</strong>e <strong>of</strong> those <strong>on</strong> Kilimanjaro are custom, modular<br />
designs <strong>of</strong> aluminum tubing and structural fittings. Recently, radiati<strong>on</strong> shields compatible<br />
with <strong>the</strong> U.S. Climate Reference Network (USCRN) began operating at both sites, visible in<br />
images as large white disks with vertical tubes beneath; <strong>the</strong>se ho<strong>use</strong> 3 PRTs each to<br />
measure temperature and a Vaisala HMT337 for humidity measurement.<br />
45
AWS instrumentati<strong>on</strong> is similar at <strong>the</strong> two sites, as shown in Figure 1<br />
and detailed elsewhere (Thomps<strong>on</strong> et al., 2002; Link). However, <strong>the</strong> tower<br />
designs differ c<strong>on</strong>siderably, due to c<strong>on</strong>trasting mass balance regimes in<br />
recent years. For example, <strong>the</strong> average net mass balance (w.e.) for 2005-<br />
2010 at Quelccaya AWS was ∼+0.8 m, in c<strong>on</strong>trast to ∼-0.24 m over <strong>the</strong><br />
same time interval at Kilimanjaro AWS. C<strong>on</strong>sequently, to maintain a relative<br />
c<strong>on</strong>stancy <strong>of</strong> measurement heights, we lowered <strong>the</strong> entire Kilimanjaro<br />
tower 4 times due ablati<strong>on</strong>, and have extended <strong>the</strong> Quelccaya stati<strong>on</strong> by<br />
12 m due accumulati<strong>on</strong>. This experience underscores <strong>the</strong> reality that AWS<br />
tower design must be adapted to <strong>the</strong> mass balance regime in which it is<br />
located. An initial evaluati<strong>on</strong> <strong>of</strong> each stati<strong>on</strong>’s performance was provided<br />
at <strong>the</strong> 2004 AWS <str<strong>on</strong>g>Workshop</str<strong>on</strong>g> in P<strong>on</strong>tresina (Hardy et al., 2004).<br />
The Quelccaya and Kilimanjaro sites are at similar elevati<strong>on</strong>s, yet measurements<br />
reveal important differences in climate. The magnitude <strong>of</strong> precipitati<strong>on</strong><br />
at Quelccaya, for example, is 4-6 times greater and delivered<br />
during <strong>on</strong>e wet seas<strong>on</strong>. A more-variable, bimodal precipitati<strong>on</strong> pattern<br />
predominates <strong>on</strong> Kilimanjaro. Also, <strong>the</strong> Quelccaya site is warmer, with aspirated<br />
air temperature typically rising above freezing <strong>on</strong> more than 100<br />
days per year; Kilimanjaro air temperature remains below freezing. An<br />
extended dry seas<strong>on</strong> occurs at both sites, during which <strong>the</strong> mean relative<br />
humidity averages 63 and 44 percent, respectively. As a result <strong>of</strong><br />
<strong>the</strong>se differing climates, <strong>the</strong> resoluti<strong>on</strong> and fidelity <strong>of</strong> envir<strong>on</strong>mental history<br />
records from <strong>the</strong> ice cores also differs c<strong>on</strong>siderably (cf., Thomps<strong>on</strong><br />
et al., 1985, 2006, 2002; Kaser et al., 2010).<br />
Issues, challenges, and less<strong>on</strong>s learned<br />
An abundance <strong>of</strong> challenges are inherent in all unattended measurements<br />
<strong>on</strong> <strong>glaciers</strong>, as discussed by Box et al. (2004). These include adapting<br />
to a surface height which is <strong>of</strong>ten changing c<strong>on</strong>stantly, meeting power<br />
requirements despite riming and snowfall, keeping <strong>the</strong> tower plumb, and<br />
for researchers, simply functi<strong>on</strong>ing at high elevati<strong>on</strong> during visits. A broad<br />
range <strong>of</strong> soluti<strong>on</strong>s to comm<strong>on</strong> and unique challenges are presented in this<br />
volume and in <strong>the</strong> 2004 proceedings.<br />
The following are some <strong>of</strong> <strong>the</strong> less<strong>on</strong>s learned in successfully operating<br />
AWS <strong>on</strong> Quelccaya and Kilimanjaro. The list begins with what might be<br />
c<strong>on</strong>sidered minor-yet-crucial details, and expands in scope toward broader<br />
issues.<br />
1. Structural slip-<strong>on</strong> fittings (e.g., Hollaender Manufacturing) have proven<br />
to be str<strong>on</strong>g and reliable. In combinati<strong>on</strong> with aluminum tubing, modular<br />
towers can be built to accommodate a broad range <strong>of</strong> <strong>use</strong>s and<br />
mass balance regimes (note extensive <strong>use</strong> at both stati<strong>on</strong>s, in Fig. 1).<br />
2. A supplemental enclosure or "juncti<strong>on</strong> box" allows extra sensor wire to<br />
be neatly c<strong>on</strong>tained, minimizing cable damage, riming, and <strong>the</strong> temptati<strong>on</strong><br />
to purchase excessively-short cables.<br />
46
3. "Air terminals" (see Fig. 1) may help to prevent electrostatic problems.<br />
At Quelccaya <strong>the</strong>se have proven robust enough to endure frequent riming,<br />
although <strong>the</strong>ir effectiveness remains anecdotal (i.e., not proven). In<br />
a similar situati<strong>on</strong> at Sajama and Illimani AWS without terminals, electrostatic<br />
discharge was a c<strong>on</strong>siderable problem.<br />
4. Helpful ideas <strong>on</strong> ultras<strong>on</strong>ic snow sensors are provided by Box et al.<br />
(2004). On Kilimanjaro and Quelccaya, annually changing <strong>the</strong> transducer<br />
has <strong>of</strong>ten reduced measurement noise. Both stati<strong>on</strong>s utilize identical<br />
sensors <strong>on</strong> opposite sides <strong>of</strong> <strong>the</strong> tower, improving data c<strong>on</strong>tinuity<br />
and reducing <strong>the</strong> influence <strong>of</strong> small-scale transient anomalies (e.g.,<br />
snow drifts).<br />
5. At any glacier stati<strong>on</strong>, a compelling reas<strong>on</strong> may develop to c<strong>on</strong>tinue<br />
operating <strong>the</strong> stati<strong>on</strong> bey<strong>on</strong>d a relatively-short research interval <strong>of</strong> several<br />
years. For example, <strong>the</strong> typical research period may inadequately<br />
characterize climate variability in some locati<strong>on</strong>s, or <strong>the</strong> initial measurements<br />
may reveal unanticipated findings. Designing for an extensi<strong>on</strong><br />
<strong>of</strong> time or measurement scope may prove easy and cost effective,<br />
should ei<strong>the</strong>r become warranted.<br />
6. In some envir<strong>on</strong>ments, such as at <strong>the</strong> summit <strong>of</strong> Quelccaya Ice Cap,<br />
thin-film capacitive humidity sensors are not compatible with part-time<br />
mechanical aspirati<strong>on</strong>. To save power at <strong>the</strong> Quelccaya and Kilimanjaro<br />
stati<strong>on</strong>s, <strong>on</strong>e radiati<strong>on</strong> shield is aspirated prior to each measurement<br />
for 2 <strong>of</strong> every 10 minutes. Under certain radiati<strong>on</strong>, temperature<br />
and humidity c<strong>on</strong>diti<strong>on</strong>s, water is hypo<strong>the</strong>sized to exist <strong>on</strong> <strong>the</strong> sensor<br />
when <strong>the</strong> fan is not operating; ice crystals <strong>the</strong>n apparently grow when<br />
<strong>the</strong> fan is switched <strong>on</strong> and colder air is introduced over <strong>the</strong> sensor. It<br />
appears that <strong>the</strong>se crystals ca<strong>use</strong> physical damage to <strong>the</strong> sensor, reducing<br />
its surface area and causing a measurement <strong>of</strong>fset (1999, 2009<br />
pers. comm. from Vaisala and Rotr<strong>on</strong>ic Instruments, resp.).<br />
7. Air temperature and humidity measurements are difficult over highelevati<strong>on</strong>,<br />
high-albedo surfaces such as <strong>glaciers</strong>, due to large, diurnallyvariable<br />
radiati<strong>on</strong> receipt from above and below. Vapor pressure calculati<strong>on</strong>s<br />
rely up<strong>on</strong> both. To optimize measurement accuracy, <strong>use</strong> a<br />
shield for which radiati<strong>on</strong> errors over snow and ice are well characterized.<br />
If resources permit, replicate air temperature measurements may<br />
be valuable, especially if <strong>the</strong> site permits mechanical aspirati<strong>on</strong>; <strong>of</strong>ten<br />
sites which present extreme radiati<strong>on</strong> loading (e.g., Kilimanjaro) are<br />
also optimal locati<strong>on</strong>s for solar power to operate fans. Replicate measurements<br />
permit intercomparis<strong>on</strong> studies, and will likely yield a more<br />
accurate representati<strong>on</strong> <strong>of</strong> true temperature and humidity.<br />
8. Instrument calibrati<strong>on</strong> is an essential element <strong>of</strong> measurement accuracy,<br />
especially for trend analysis. The need for calibrati<strong>on</strong> is especially<br />
acute at infrequently-visited AWS in extreme envir<strong>on</strong>ments. Yet,<br />
instrument calibrati<strong>on</strong> at glacier stati<strong>on</strong>s is fraught with difficulty, as<br />
discussed by Box et al. (2004) freshly-calibrated sensors to <strong>the</strong> site, removing<br />
<strong>the</strong> existing and re-wiring in <strong>the</strong> new sensor, and <strong>the</strong>n c<strong>on</strong>ducting<br />
a post-deployment calibrati<strong>on</strong> <strong>of</strong> <strong>the</strong> sensors taken out. At Quelc-<br />
47
caya and Kilimanjaro AWS, temperature and humidity sensors are nominally<br />
replaced <strong>on</strong> an annual basis. Although <strong>the</strong> Pt100 RTD temperature<br />
sensor (platinum resistance temperature detector) has remained very<br />
stable, <strong>the</strong> capacitive-type humidity sensor has comm<strong>on</strong>ly drifted by<br />
±2-5 percent between calibrati<strong>on</strong>s, and more serious shifts <strong>of</strong> 15-20<br />
percent have been found <strong>on</strong> several occasi<strong>on</strong>s (see less<strong>on</strong> #6, above).<br />
Without calibrati<strong>on</strong>, <strong>the</strong>se changes could have been overlooked, possibly<br />
even with replicate measurements.<br />
Finally, field notes and photographs during each visit provide essential<br />
documentati<strong>on</strong> that data analysis will rely up<strong>on</strong>. Our lists <strong>of</strong> fieldwork objectives<br />
are typically l<strong>on</strong>g, even overly-ambitious, yet should never compromise<br />
careful metadata collecti<strong>on</strong>.<br />
Acknowledgements<br />
Financial support has derived from <strong>the</strong> U.S. Nati<strong>on</strong>al Science Foundati<strong>on</strong> (Paleoclimate Pro-<br />
gram) and NOAA (Offices <strong>of</strong> Global Programs & U.S. Global Climate Observing System).<br />
Thanks to many collaborators, guides and porters for field assistance, and to Peruvian and<br />
Tanzanian authorities who facilitate <strong>the</strong> research.<br />
References<br />
Box, J., P. Anders<strong>on</strong> and M. R. van den Broeke. 2004. Less<strong>on</strong>s to be learned. In: Reijmer,<br />
C., editor, Automatic wea<strong>the</strong>r stati<strong>on</strong>s <strong>on</strong> <strong>glaciers</strong>, Proceedings <strong>of</strong> a workshop, 28-31<br />
March 2004, P<strong>on</strong>tresina (Switzerland), pages 9–28. Institute for Marine and Atmospheric<br />
Research Utrecht (IMAU).<br />
Hardy, D., M. Vuille and R. Bradley. 2003. Variability <strong>of</strong> snow accumulati<strong>on</strong> and isotopic<br />
compositi<strong>on</strong> <strong>on</strong> nevado sajama. J. Geophys. Res., 108(D22), 4693. Doi: 10.1029/<br />
2003JD003623.<br />
Hardy, D., C. Braun, M. Vuille and R. Bradley. 2004. Hich-elevati<strong>on</strong> wea<strong>the</strong>r stati<strong>on</strong>s <strong>on</strong><br />
<strong>glaciers</strong> in <strong>the</strong> tropics and <strong>the</strong> high arctic. In: Reijmer, C., editor, Automatic wea<strong>the</strong>r<br />
stati<strong>on</strong>s <strong>on</strong> <strong>glaciers</strong>, Proceedings <strong>of</strong> a workshop, 28-31 March 2004, P<strong>on</strong>tresina (Switzerland),<br />
pages 52–55. Institute for Marine and Atmospheric Research Utrecht (IMAU).<br />
Kaser, G., T. Mölg, N. J. Cullen, D. R. Hardy and M. Winkler. 2010. Is <strong>the</strong> decline <strong>of</strong> ice<br />
<strong>on</strong> kilimanjaro unprecedented in <strong>the</strong> holocene? The Holocene, 20, 1079–1091. Doi:<br />
10.1177/0959683610369498.<br />
Paleoclimate research at quelccaya - image gallery. http://www.geo.umass.edu/climate/quel<br />
ccaya/diuca/paleoclimate/index.html.<br />
Thomps<strong>on</strong>, L., E. Mosley-Thomps<strong>on</strong>, J. Bolzan and B. Koci. 1985. A 1500-year record <strong>of</strong> tropical<br />
precipitati<strong>on</strong> in ice cores from <strong>the</strong> quelccaya ice cap, peru. Science, 229(4714), 971–973.<br />
Thomps<strong>on</strong>, L., E. Mosley-Thomps<strong>on</strong>, M. Davis, K. Henders<strong>on</strong>, H. Brecher, V. Zagorodnov, P.-N.<br />
Lin, T. Mashiotta, V. Mikhalenko, D. Hardy and J. Beer. 2002. Kilimanjaro ice core records:<br />
Evidence <strong>of</strong> holocene climate change in tropical africa. Science, 298(5593), 589–593.<br />
Thomps<strong>on</strong>, L., E. Mosley-Thomps<strong>on</strong>, H. Brecher, M. Davis, B. L. D. Les, P.-N.Lin, T. Mashiotta<br />
and K. Mountain. 2006. Abrupt tropical climate change: Past and present. Proc. Nat. Acad.<br />
Sc. USA, 103, 10536–10543. Doi:10.1073/pnas.0603900103.<br />
48
Glacier Mass Balance Pods in Wireless Sensor<br />
Networks<br />
John Hulth 1 and Johan Strömbom 2<br />
1 Department <strong>of</strong> Ma<strong>the</strong>matical Sciences and Technology,<br />
Norwegian University <strong>of</strong> Life Sciences, Ås, Norway<br />
Email: john.hulth@umb.no<br />
2 Embsec AB, Täby, Sweden<br />
Motivati<strong>on</strong><br />
One <strong>of</strong> <strong>the</strong> main uncertainties in surface mass balance estimates is <strong>the</strong><br />
lack <strong>of</strong> detailed and geographically unbiased measurements. Simplified<br />
assumpti<strong>on</strong>s <strong>of</strong> linear ablati<strong>on</strong> and accumulati<strong>on</strong> gradients are <strong>use</strong>d to calculate<br />
area-average mass balances, even <strong>on</strong> <strong>glaciers</strong> with relatively dense<br />
networks <strong>of</strong> observati<strong>on</strong>s. Uncertainties <strong>of</strong> when <strong>the</strong> maximum winter balance<br />
and <strong>the</strong> minimum summer balance occurs, and lack <strong>of</strong> informati<strong>on</strong><br />
<strong>of</strong> summer snowfalls and winter melt events makes it difficult to couple<br />
surface mass balance observati<strong>on</strong>s with meteorological records. These<br />
problems become larger for regi<strong>on</strong>al estimates <strong>of</strong> glacier mass balance.<br />
In-situ measurements are time c<strong>on</strong>suming and field trips to remote<br />
<strong>glaciers</strong> are expensive. Dense networks <strong>of</strong> observati<strong>on</strong>s with high temporal<br />
resoluti<strong>on</strong> are required to accurately calibrate and validate mass<br />
balance models. These models are needed to improve estimates and projecti<strong>on</strong>s<br />
<strong>of</strong> run-<strong>of</strong>f and c<strong>on</strong>tributi<strong>on</strong> to sea-level rise due to glacier wastage.<br />
Therefore, automated methods to c<strong>on</strong>tinuously measure mass changes<br />
have great value in glacier m<strong>on</strong>itoring<br />
System overview<br />
We have developed a system that c<strong>on</strong>tinuously measures glacier surface<br />
elevati<strong>on</strong> changes due to change in surface mass balance. A number <strong>of</strong><br />
data acquisiti<strong>on</strong> units (Pods) records hourly data <strong>of</strong> ice melt, snow depth,<br />
air temperature and daily average <strong>of</strong> positi<strong>on</strong>. Each unit is installed <strong>on</strong> a<br />
floating platform (Fig. 1a). The <strong>on</strong>ly part that is mounted in <strong>the</strong> ice is <strong>the</strong><br />
ablatometer wire, which needs to be re-drilled after 15 m <strong>of</strong> net ablati<strong>on</strong>.<br />
Data are transmitted by radio in a wireless network <strong>on</strong> a daily basis.<br />
Maximum transmissi<strong>on</strong> range between two Pods is about 10 km, but with<br />
multiple-hop functi<strong>on</strong>ality <strong>the</strong> coverage is basically unlimited. One Pod<br />
(<strong>the</strong> base stati<strong>on</strong>) collects data from all o<strong>the</strong>r Pods. The base stati<strong>on</strong> is<br />
equipped with an Iridium modem and forwards data from all o<strong>the</strong>r Pods in<br />
<strong>the</strong> network to a central database. Daily updated data and system status<br />
are made accessible via <strong>the</strong> Internet through a Web interface (Fig. 2).<br />
Pods are designed to ’survive’ three years without maintenance. Units are<br />
49
Figure 1. Photographs showing (a) <strong>the</strong> complete setup <strong>of</strong> a mass balance pod and (b) a<br />
close-up <strong>of</strong> <strong>the</strong> logger box and instruments.<br />
powered with a small solar panel and internal battery, allowing <strong>the</strong>m to<br />
withstand 3-6 m<strong>on</strong>ths <strong>of</strong> darkness or being completely covered by snow.<br />
This system has been developed with <strong>the</strong> goal to provide a ’high-tech’<br />
alternative to ablati<strong>on</strong> stakes. We have <strong>the</strong> first prototypes ready for deployment.<br />
Sensors and measurement techniques have previously been<br />
tested in similar applicati<strong>on</strong>s with good results. The added value <strong>of</strong> c<strong>on</strong>tinuous<br />
measurements, <strong>the</strong> cost-effective telemetry, and <strong>the</strong> simplicity <strong>of</strong><br />
installati<strong>on</strong> and data handling, will make this system an interesting alternative<br />
to traditi<strong>on</strong>al glacier m<strong>on</strong>itoring methods.<br />
Sensors<br />
A new method was developed by Hulth (2010) to accurately measure surface<br />
change due to net ablati<strong>on</strong> with a draw-wire sensor (Fig. 1b). This<br />
approach provides high precisi<strong>on</strong> and temporal resoluti<strong>on</strong> ablati<strong>on</strong> measurements<br />
and eliminates <strong>the</strong> problem <strong>of</strong> stakes melting out or bending.<br />
It can operate without need <strong>of</strong> re-drilling for several ablati<strong>on</strong> seas<strong>on</strong>s depending<br />
<strong>on</strong> melt rate and <strong>the</strong> length <strong>of</strong> <strong>the</strong> wire.<br />
We have c<strong>on</strong>structed a low-cost s<strong>on</strong>ic ranger (Fig. 1b), which is compatible<br />
with most data loggers, to measure distance to <strong>the</strong> snow surface.<br />
Distance readings in combinati<strong>on</strong> with <strong>the</strong> known installati<strong>on</strong> height are<br />
c<strong>on</strong>verted to snow depth relative to <strong>the</strong> prior summer surface. Maximum<br />
measurement range is limited by <strong>the</strong> installati<strong>on</strong> height and recommended<br />
to 2 m for practical reas<strong>on</strong>s. The resoluti<strong>on</strong> <strong>of</strong> <strong>the</strong> sensor is 1 cm.<br />
Air temperature is measured inside an unventilated radiati<strong>on</strong> shield<br />
(Fig. 1b). These measurements are also <strong>use</strong>d to compensate <strong>the</strong> distance<br />
50
Figure 2. Illustrati<strong>on</strong> <strong>of</strong> <strong>the</strong> Web interface. Collected data are stored in a central database<br />
and accessible through a Web interface and downloadable directly from <strong>the</strong> webpage. Data<br />
presented are for illustrative purpose, though being au<strong>the</strong>ntic and collected at Kahiltna<br />
<strong>glaciers</strong>, Alaska, and Sørbreen, Jan Mayen, during testing <strong>of</strong> <strong>the</strong> instruments and<br />
measurement techniques. Storglaciären is shown in <strong>the</strong> Google map image to illustrate how<br />
a network <strong>of</strong> Pods could be organized <strong>on</strong> a glacier. (Data <strong>of</strong> snow depth and air temperature<br />
bel<strong>on</strong>gs to A. Arendt and J. Young, UAF).<br />
reading by <strong>the</strong> s<strong>on</strong>ic ranger. Locati<strong>on</strong> <strong>of</strong> <strong>the</strong> Pod is recorded with a singlefrequency<br />
GPS receiver. The precise time informati<strong>on</strong> <strong>of</strong> <strong>the</strong> GPS system<br />
is <strong>use</strong>d to synchr<strong>on</strong>ize <strong>the</strong> real-time clock in <strong>the</strong> pod.<br />
System advantages<br />
• Delivers detailed point mass balance data<br />
• Robust and easy to install<br />
• Designed to operate 3 years without maintenance<br />
• Reduces field expenditures<br />
• Incorporates a new promising type <strong>of</strong> ablatometer<br />
• 10 km transmissi<strong>on</strong> range in mesh network<br />
• Reduces <strong>the</strong> cost for satellite telemetry service<br />
• Provides a daily updated database <strong>of</strong> collected data<br />
• Easy sharing <strong>of</strong> data through Web interface<br />
References<br />
Hulth, J.. 2010. Using a draw-wire sensor to c<strong>on</strong>tinuously m<strong>on</strong>itor glacier melt. J. Glaciol.,<br />
56(199), 922–924.<br />
51
A versatile tower platform for glacier instrumentati<strong>on</strong>:<br />
GPS and Eddy Covariance Measurements<br />
Alexander H. Jarosch 1 , Far<strong>on</strong> S. Anslow 2 , Joseph Shea 3,4<br />
1 Centre for Climate and Cryosphere, University <strong>of</strong> Innsbruck, Austria.<br />
Email: Alexander.Jarosch@uibk.ac.at<br />
2 Pacific Climate Impact C<strong>on</strong>sortium, University <strong>of</strong> Victoria, Canada.<br />
Email: fanslow@uvic.ca<br />
3 Department <strong>of</strong> Geography, University <strong>of</strong> British Columbia, Canada.<br />
4 Department <strong>of</strong> Geography, University <strong>of</strong> Nor<strong>the</strong>rn British Columbia, Canada.<br />
Email: joseph.shea@geog.ubc.ca<br />
Introducti<strong>on</strong><br />
Deploying a high accuracy, kinematic GPS <strong>on</strong> a glacier to measure surface<br />
movements over time creates specific demands <strong>on</strong> <strong>the</strong> design <strong>of</strong> <strong>the</strong><br />
mounting platform. First, <strong>the</strong> platform must be anchored directly to <strong>the</strong> ice<br />
surface to ensure that <strong>the</strong> GPS device actually measures ice deformati<strong>on</strong>.<br />
Sec<strong>on</strong>d, accumulati<strong>on</strong> throughout <strong>the</strong> winter seas<strong>on</strong> dictates that <strong>the</strong> instrument<br />
must be mounted at a certain height above <strong>the</strong> ice surface to<br />
avoid burial by snow. Third, to ensure a direct coupling between <strong>the</strong> instrument<br />
and <strong>the</strong> ice surface, a very rigid mounting structure is required,<br />
which minimizes <strong>the</strong> interference <strong>of</strong> structural instabilities (e.g. vibrati<strong>on</strong><br />
or swaying) with <strong>the</strong> measurement <strong>of</strong> ice surface moti<strong>on</strong>. Finally, <strong>the</strong> design<br />
should be easily expandable, modular, <strong>on</strong>ly require <strong>of</strong>f-<strong>the</strong>-shelf comp<strong>on</strong>ents,<br />
allow for easy assembly in <strong>the</strong> field, and require a minimum <strong>of</strong><br />
custom fabricati<strong>on</strong>.<br />
Tower Design and Assembly<br />
Inspired by <strong>the</strong> requirements layed out in <strong>the</strong> introducti<strong>on</strong>, we describe <strong>the</strong><br />
design <strong>of</strong> our tower platform which was initially intended for GPS measurements.<br />
We also present <strong>the</strong> utilizati<strong>on</strong> <strong>of</strong> <strong>the</strong> tower for eddy covariance<br />
measurements. As <strong>the</strong> main building material for <strong>the</strong> tower we choose<br />
1 1/2" IPS (48 mm outer diameter) aluminum tubing, which fits perfectly<br />
into bore holes from a standard ice auger, is structurally very rigid, and<br />
readily available. To create a rigid structure, we c<strong>on</strong>nect tube segments<br />
<strong>of</strong> different length with standard industrial fittings as displayed in Figure 1.<br />
The following parts are required for building <strong>the</strong> basic tower:<br />
• 3 x 4 m, 1 1/2" IPS aluminum tubing as anchors (vary <strong>the</strong>se depending <strong>on</strong><br />
ablati<strong>on</strong>).<br />
• 3 x 2-3 m, 1 1/2" IPS aluminum tubing for tower (vary <strong>the</strong>se depending<br />
<strong>on</strong> accumulati<strong>on</strong>).<br />
• 9 x 0.5 m, 1 1/2" IPS aluminum tubing for cross bracing.<br />
• 3 x NuRail® #70-8 c<strong>on</strong>nectors to couple anchors to tower.<br />
52
Figure 1. A cross brace element <strong>of</strong> <strong>the</strong> tower is displayed in (a) and <strong>the</strong> whole tower setup<br />
in (b).<br />
• 9 x NuRail® #30C-8 c<strong>on</strong>nectors for cross bracing.<br />
Additi<strong>on</strong>ally <strong>on</strong>e can <strong>use</strong>:<br />
• 3x NuRail® #40-8 flanges to mount <strong>the</strong> custom top antenna plate.<br />
• 4x NuRail® #7-8 crosses to mount <strong>the</strong> solar panel.<br />
The vast amount <strong>of</strong> readily available industrial c<strong>on</strong>nectors allows for flexible<br />
design soluti<strong>on</strong>s, which should be suitable for many glaciological soluti<strong>on</strong>s.<br />
Assembly <strong>of</strong> <strong>the</strong> tower in <strong>the</strong> field is straight forward and <strong>on</strong>e can<br />
<strong>use</strong> our routine as a guideline:<br />
• Drill three holes vertically in <strong>the</strong> ice, which fit <strong>the</strong> three anchor poles and<br />
<strong>use</strong> an assembled cross brace (Fig. 1a) as a distance template between<br />
<strong>the</strong> holes. A water level designed to mount <strong>on</strong> pipes proved itself to be<br />
very <strong>use</strong>ful for vertical drilling.<br />
• Add <strong>the</strong> three #70-8 c<strong>on</strong>nectors to <strong>the</strong> anchors and mount <strong>the</strong> three<br />
tower poles.<br />
• Use <strong>on</strong>e set <strong>of</strong> #30C-8 c<strong>on</strong>nectors and a 0.5 m pipe segment to build a<br />
cross brace.<br />
• Slide three cross braces <strong>on</strong>to <strong>the</strong> tower poles to create <strong>on</strong>e level <strong>of</strong><br />
cross bracing.<br />
• Add three levels <strong>of</strong> cross bracing to <strong>the</strong> tower.<br />
• Additi<strong>on</strong>ally add a custom top plate and/or <strong>the</strong> solar panel mounts (#7-<br />
8 in our case).<br />
The finished tower can now be instrumented and auxiliary booms can be<br />
easily mounted to <strong>the</strong> rigid structure. Resetting <strong>of</strong> <strong>the</strong> tower after a year<br />
in <strong>the</strong> field is simple. One can just unmount <strong>the</strong> tower from <strong>the</strong> anchors<br />
by opening <strong>the</strong> #70-8 c<strong>on</strong>nectors and <strong>the</strong> anchors can be re-drilled or <strong>on</strong>e<br />
53
Figure 2. GPS tower setup located in Kluane Nati<strong>on</strong>al Park (a) and <strong>the</strong> eddy covariance<br />
setup at Castle Creek Glacier (b).<br />
<strong>use</strong>s ano<strong>the</strong>r set <strong>of</strong> anchor poles to set up <strong>the</strong> tower beside <strong>the</strong> old locati<strong>on</strong>.<br />
Normally two sets <strong>of</strong> anchor poles are sufficient as <strong>the</strong> old anchors<br />
normally melt out <strong>of</strong> <strong>the</strong> ice over <strong>the</strong> next year.<br />
For GPS applicati<strong>on</strong>s in Kluane Nati<strong>on</strong>al Park (see Fig. 2), we did not find<br />
<strong>the</strong> need to plug <strong>the</strong> anchor poles to prevent sinking over time, but this<br />
depends <strong>on</strong> <strong>the</strong> load <strong>of</strong> <strong>the</strong> tower and could easily be d<strong>on</strong>e. For <strong>the</strong> eddy<br />
covariance applicati<strong>on</strong>, large cork stoppers were inserted into <strong>the</strong> end <strong>of</strong><br />
<strong>the</strong> anchor poles and secured with tape. As <strong>the</strong> poles were inserted into<br />
water-filled holes, it became necessary to cut holes into <strong>the</strong> cork to allow<br />
water and air pressures to equilibrate.<br />
GPS Applicati<strong>on</strong><br />
Our tower design is <strong>use</strong>d to measure surface movements <strong>on</strong> a glacier<br />
(60 ◦ 49’20" N, 139 ◦ 7’26.8" W) in <strong>the</strong> Kluane Nati<strong>on</strong>al Park, Yuk<strong>on</strong>, Canada,<br />
instrumented with Trimble® R7 receivers toge<strong>the</strong>r with Zephyr Geodetic<br />
antennae, which are mounted with a custom made top plate <strong>on</strong>to our<br />
towers (cf. Fig. 2a). To provide power for a year round operati<strong>on</strong> <strong>of</strong> <strong>the</strong> instruments,<br />
we <strong>use</strong> 100 Ah deep-cycle AGM batteries at each tower which<br />
are recharged by 50 W solar panels. This setup allows us to measure for<br />
6 hrs each day (9 am to 3 pm local time) at a 1 Hz sampling rate. We limit<br />
<strong>the</strong> measurement time beca<strong>use</strong> <strong>of</strong> little sunlight and cold air temperatures<br />
during <strong>the</strong> winter m<strong>on</strong>ths which both have negative effects <strong>on</strong> <strong>the</strong> battery<br />
charge. With this setup several instruments have been <strong>measuring</strong> glacier<br />
moti<strong>on</strong> c<strong>on</strong>tinuously since 2008 at <strong>the</strong> field site <strong>of</strong> G.E. Flowers and C.G.<br />
Scho<strong>of</strong>. So far we have not encountered major difficulties or design flaws<br />
during <strong>the</strong> 3 years <strong>of</strong> operati<strong>on</strong>.<br />
Eddy Covariance Applicati<strong>on</strong><br />
In <strong>the</strong> summer <strong>of</strong> 2010, this tower design was tested as a mounting platform<br />
for open path eddy covariance (OPEC) measurements <strong>on</strong> Castle Creek<br />
Glacier (53 ◦ 2.2’ N, 120 ◦ 24.4’ W) in <strong>the</strong> Cariboo Mountains <strong>of</strong> British Columbia,<br />
Canada. A s<strong>on</strong>ic anemometer (CSAT-3) and krypt<strong>on</strong> hygrometer (KH-<br />
54
20) were installed <strong>on</strong> <strong>the</strong> tower structure, with an initial height <strong>of</strong> 1.86 m<br />
above <strong>the</strong> ice surface. The CSAT-3 was oriented to minimize turbulence<br />
with <strong>the</strong> tower structure, with <strong>the</strong> x-axis perpendicular to <strong>the</strong> dominant<br />
down-glacier (katabatic) wind directi<strong>on</strong>. OPEC measurements were collected<br />
at a frequency <strong>of</strong> 20 Hz, and stored <strong>on</strong> a 2 GB compact flash card<br />
using a Campbell® Scientific SC-115 flash storage attachment <strong>on</strong> <strong>the</strong><br />
CR1000 datalogger. Near-c<strong>on</strong>tinuous measurements were collected between<br />
August 2 nd and August 10 th , before power issues interrupted <strong>the</strong><br />
datalogger operati<strong>on</strong>. Two 10 W solar panels were <strong>use</strong>d to trickle charge<br />
<strong>the</strong> 12 V batteries, but cloudy c<strong>on</strong>diti<strong>on</strong>s during <strong>the</strong> observati<strong>on</strong> period<br />
limited <strong>the</strong> battery recharge. Voltages dropped below 10.5 V during <strong>the</strong><br />
night <strong>of</strong> August 10 th , 11 th and 12 th , and <strong>the</strong> datalogger functi<strong>on</strong> stopped<br />
completely <strong>on</strong> August 13 th . Despite <strong>the</strong> power supply issues, very <strong>use</strong>ful<br />
data has been collected and <strong>the</strong> tower proved itself to be a very stable<br />
mounting platform for eddy covariance measurements over a glacier surface.<br />
At a sampling frequency <strong>of</strong> 20 Hz, <strong>the</strong> flash card memory allows for<br />
approximately 30 days <strong>of</strong> observati<strong>on</strong>s. At high-melt locati<strong>on</strong>s, this may<br />
be <strong>the</strong> limit that <strong>the</strong> tower can be left unattended. For l<strong>on</strong>g term measurements<br />
we suggest to <strong>use</strong> 100 Ah deep-cycle AGM batteries and 40-50 W<br />
solar panels, which should allow for an operati<strong>on</strong> <strong>of</strong> <strong>the</strong> instruments for<br />
several m<strong>on</strong>ths.<br />
C<strong>on</strong>clusi<strong>on</strong>s<br />
We found <strong>the</strong> above described tower design to be very suitable for GPS<br />
and eddy covariance measurements above glacier surfaces. The design<br />
is readily available, <strong>on</strong>ly <strong>use</strong>s <strong>of</strong>f-<strong>the</strong>-shelf comp<strong>on</strong>ents and can be easily<br />
modified to be suitable for many o<strong>the</strong>r glaciological applicati<strong>on</strong>s. Finally,<br />
we hope o<strong>the</strong>rs find this design <strong>use</strong>ful for mounting <strong>the</strong>ir instruments and<br />
we would be delighted to answer questi<strong>on</strong>s or discuss <strong>the</strong> design fur<strong>the</strong>r<br />
via email.<br />
55
New AWS activities in Antarctica started by<br />
<strong>the</strong> Alfred Wegener Institute<br />
Bernd Loose<br />
Climate Sciences / Polar Meteorology / Meteorological Observatories,<br />
Alfred Wegener Institute for Polar and Marine Research in <strong>the</strong> Helmholtz Associati<strong>on</strong><br />
Email: Bernd.Loose@awi.de<br />
In some parts <strong>of</strong> Antarctica, mainly in <strong>the</strong> regi<strong>on</strong> <strong>of</strong> <strong>the</strong> Antarctic Peninsula,<br />
warming <strong>of</strong> <strong>the</strong> lower atmosphere over <strong>the</strong> past decades is well documented.<br />
But is <strong>the</strong>re also such a trend in o<strong>the</strong>r regi<strong>on</strong>s <strong>of</strong> <strong>the</strong> c<strong>on</strong>tinent?<br />
Steig et al. (2009) claim that <strong>the</strong> c<strong>on</strong>tinent-wide average near-surface temperature<br />
trend is positive. At Neumayer Stati<strong>on</strong> <strong>on</strong> <strong>the</strong> Ekström ice shelf<br />
(70 ◦ 40’ S, 8 ◦ 16’ W), <strong>the</strong> Alfred Wegener Institute operates a meteorological<br />
observatory since 1981. The time series <strong>of</strong> air temperature from that<br />
observatory does not show significant warming or cooling over this period<br />
<strong>of</strong> nearly thirty years. Measurements from a single stati<strong>on</strong> are naturally<br />
not representative for <strong>the</strong> whole c<strong>on</strong>tinent. Never<strong>the</strong>less an internal discussi<strong>on</strong><br />
<strong>on</strong> accuracy and reliability <strong>of</strong> AWS started beca<strong>use</strong> <strong>the</strong>ir data is<br />
an important basis for climatological analyses. These <strong>systems</strong> are <strong>of</strong>ten<br />
unattended over years. Their sensors and measurements are affected by<br />
many envir<strong>on</strong>mental influences such as coldness, storms, icing, snow accumulati<strong>on</strong>,<br />
solar radiati<strong>on</strong> and so <strong>on</strong>, which will reduce <strong>the</strong> quality <strong>of</strong><br />
Figure 1. The AWI AWS near Neumayer III. (Photo: Jölund Asseng)<br />
56
<strong>the</strong>ir data. To achieve answers up<strong>on</strong> <strong>the</strong> open questi<strong>on</strong>s, it was decided to<br />
install an AWS which should be composed mainly <strong>of</strong> widespread standard<br />
comp<strong>on</strong>ents. Only a sufficient <strong>the</strong>rmistor chain could not be found <strong>on</strong> <strong>the</strong><br />
market. Therefore an in-ho<strong>use</strong> development was made and is now a well<br />
functi<strong>on</strong>ing part <strong>of</strong> <strong>the</strong> AWS.<br />
The routine measurements with <strong>the</strong> new AWS started <strong>on</strong> 24 th January<br />
2011 close to <strong>the</strong> meteorological tower <strong>of</strong> <strong>the</strong> observatory <strong>of</strong> <strong>the</strong> research<br />
stati<strong>on</strong> Neumayer III. During <strong>the</strong> first year <strong>of</strong> operati<strong>on</strong>, we focus <strong>on</strong> <strong>the</strong> behavior<br />
<strong>of</strong> <strong>the</strong> meteorological sensors. To assure an easy and uninterrupted<br />
data retrieval, we installed a permanent c<strong>on</strong>necti<strong>on</strong> to external power and<br />
<strong>the</strong> network <strong>of</strong> <strong>the</strong> stati<strong>on</strong>. The meteorologist m<strong>on</strong>itors <strong>the</strong> functi<strong>on</strong> <strong>of</strong> <strong>the</strong><br />
AWS during this year and will document all particular events. The short<br />
distance to <strong>the</strong> sensors <strong>of</strong> <strong>the</strong> meteorological observatory and <strong>the</strong> permanent<br />
c<strong>on</strong>trol by <strong>the</strong> operator enables an optimal comparis<strong>on</strong> between <strong>the</strong><br />
two <strong>systems</strong>. At <strong>the</strong> end <strong>of</strong> <strong>the</strong> year it should be possible to make reliable<br />
statements <strong>on</strong> <strong>the</strong> quality <strong>of</strong> <strong>the</strong> AWS data.<br />
Comp<strong>on</strong>ents <strong>of</strong> <strong>the</strong> AWS:<br />
• Air pressure:<br />
R.M. Young barometric pressure sensor, Type: 61302V<br />
• Wind speed and directi<strong>on</strong>:<br />
R.M. oung Wind M<strong>on</strong>itor-MA, Type: 05106-5<br />
• Relative humidity and air temperature:<br />
Vaisala Humidity and Temperature Probe, Type: HMP155 which is mounted<br />
inside a Campbell Scientific Unaspirated Radiati<strong>on</strong> Shield, Type:<br />
MET 21<br />
• Short- and l<strong>on</strong>gwave radiati<strong>on</strong> comp<strong>on</strong>ents and balances:<br />
Kipp & z<strong>on</strong>en Net Radiometer, Type: CNR4<br />
• Snow height:<br />
Campbell Scientific Ultras<strong>on</strong>ic Snow Height Sensor, Type: SR50A<br />
• Snow temperature pr<strong>of</strong>ile:<br />
Self developed <strong>the</strong>rmistor chain, 15 Pt100 from -10 m to 1 m<br />
First comparis<strong>on</strong>s between <strong>the</strong> different data sets show already several<br />
discrepancies which are not negligible. Details will be described later<br />
and shall lead to improvements in <strong>the</strong> instrumentati<strong>on</strong> <strong>of</strong> <strong>the</strong> AWS. The<br />
development <strong>of</strong> effective validati<strong>on</strong> routines is also a task <strong>of</strong> <strong>the</strong> project.<br />
Until January 2012 it is intended to sample <strong>the</strong> data <strong>of</strong> <strong>the</strong> AWS over a<br />
period <strong>of</strong> <strong>on</strong>e year at its current positi<strong>on</strong>. This <strong>on</strong>e year record will be <strong>the</strong><br />
basis for calculating <strong>the</strong> differences to <strong>the</strong> data from <strong>the</strong> observatory in<br />
mean and for selected wea<strong>the</strong>r situati<strong>on</strong>s. Meanwhile wireless data transmissi<strong>on</strong><br />
equipment and a photovoltaic solar power supply will be chosen<br />
and purchased.<br />
In January 2012 during <strong>the</strong> Antarctic summer campaign, <strong>the</strong> AWS will be<br />
disassembled and transported to a new positi<strong>on</strong> about 20 km north from<br />
57
Neumayer III. Hence it will be still accessible for maintenance after a short<br />
ride by scooter. At this more remote positi<strong>on</strong> <strong>the</strong> testing <strong>of</strong> <strong>the</strong> system<br />
will c<strong>on</strong>tinue. Especially <strong>the</strong> functi<strong>on</strong> <strong>of</strong> <strong>the</strong> new comp<strong>on</strong>ents is <strong>of</strong> interest.<br />
Improvements are likely necessary to be d<strong>on</strong>e in future years.<br />
Scientific work for <strong>the</strong> coming years:<br />
Climatology <strong>of</strong> <strong>the</strong> Ekström ice shelf:<br />
The climatological c<strong>on</strong>diti<strong>on</strong>s <strong>on</strong> <strong>the</strong> Ekström ice shelf are inhomogeneous.<br />
The influence <strong>of</strong> <strong>the</strong> ocean decreases with increasing distance from <strong>the</strong><br />
ice edge. An additi<strong>on</strong>al AWS <strong>on</strong> <strong>the</strong> fast ice <strong>of</strong> <strong>the</strong> Atka Bay toge<strong>the</strong>r<br />
with <strong>the</strong> meteorological observatory should allow for spatially distributed<br />
observati<strong>on</strong>s <strong>of</strong> <strong>the</strong> wea<strong>the</strong>r in this regi<strong>on</strong>. The data is also supposed to<br />
be <strong>use</strong>d for modeling <strong>the</strong> regi<strong>on</strong>al climate <strong>of</strong> <strong>the</strong> Atka Bay.<br />
Validati<strong>on</strong> <strong>of</strong> Radar satellite pictures:<br />
High resoluti<strong>on</strong> radar satellite pictures are very helpful for <strong>the</strong> observati<strong>on</strong><br />
<strong>of</strong> ice movement and sea ice coverage. But <strong>the</strong> accurate interpretati<strong>on</strong><br />
<strong>of</strong> such pictures is complicated. In particular <strong>the</strong> snow accumulati<strong>on</strong> data<br />
could help to improve <strong>the</strong> interpretati<strong>on</strong>.<br />
Meteorological surface data for drilling sites:<br />
For better interpretati<strong>on</strong> <strong>of</strong> firn and ice cores it is important to get surface<br />
data over several years from <strong>the</strong> neighborhood <strong>of</strong> <strong>the</strong> boreholes. It is<br />
likely that <strong>the</strong> meteorological observatories group will work toge<strong>the</strong>r with<br />
our glaciologists if <strong>the</strong>y intend to install AWS in selected regi<strong>on</strong>s where<br />
AWI drilling projects will be carried out.<br />
References<br />
Steig, E., D. Schneider, S. Ru<strong>the</strong>rford, M. Mann, J. Comiso and D. Shindell. 2009. Warming<br />
<strong>of</strong> <strong>the</strong> antarctic ice-sheet surface since <strong>the</strong> 1957 internati<strong>on</strong>al geophysical year. Nature,<br />
457, 459–463.<br />
58
Eddy covariance measurements <strong>on</strong> semi-arid<br />
Andean <strong>glaciers</strong>: power, memory and penitentes<br />
Shelley MacD<strong>on</strong>ell<br />
Centro de Estudios Avanzados en Z<strong>on</strong>as Áridas, La Serena, Chile<br />
Email: shelley.macd<strong>on</strong>ell@gmail.com<br />
Penitentes, or ice/snow pinnacles, are <strong>on</strong>e <strong>of</strong> <strong>the</strong> most characteristic features<br />
<strong>of</strong> <strong>glaciers</strong> in <strong>the</strong> Norte Chico regi<strong>on</strong> <strong>of</strong> Chile (Fig. 1). The formati<strong>on</strong><br />
<strong>of</strong> penitentes is <strong>the</strong> result <strong>of</strong> differential ablati<strong>on</strong>, and is a clear sign <strong>of</strong><br />
<strong>the</strong> dominance <strong>of</strong> incoming shortwave radiati<strong>on</strong> and <strong>the</strong> latent heat flux<br />
in <strong>the</strong> energy balance (Lliboutry, 1954; Amstuz, 1955; Kraus, 1972; Lliboutry,<br />
1998; Kaser et al., 2004; Bettert<strong>on</strong>, 2001; Schulz and de J<strong>on</strong>g,<br />
2004; Bergen<strong>on</strong> et al., 2006). Penitentes begin to form due to high sublimati<strong>on</strong><br />
rates in envir<strong>on</strong>ments where <strong>the</strong> dew point is below zero. However,<br />
<strong>the</strong> exact triggers <strong>of</strong> formati<strong>on</strong>, and <strong>the</strong> rates <strong>of</strong> development remain unknown.<br />
The presence <strong>of</strong> penitentes makes it difficult to calculate ablati<strong>on</strong><br />
<strong>on</strong> a glacier, beca<strong>use</strong> not <strong>on</strong>ly does <strong>the</strong>ir complicated topography mean<br />
that <strong>the</strong>y receive solar energy in a different way to a simple planar surface,<br />
but <strong>the</strong>y also modify <strong>the</strong> glacier boundary by modifying turbulence<br />
over <strong>the</strong> glacier. Whilst many studies have made c<strong>on</strong>siderable progress<br />
in <strong>the</strong> understanding <strong>of</strong> penitente and climate interacti<strong>on</strong>s (for example:<br />
Corripio and Purves, 2005), we are still unable to properly account for<br />
penitente processes within mass balance models. The first step for <strong>the</strong><br />
development <strong>of</strong> a physically-based mass balance model that accounts for<br />
penitente processes is understanding <strong>the</strong>ir effect <strong>on</strong> <strong>the</strong> turbulent heat<br />
fluxes. To accomplish this aim, a dedicated eddy covariance measurement<br />
scheme is being <strong>use</strong>d to c<strong>on</strong>tinuously measure <strong>the</strong> turbulent heat<br />
fluxes over a developing penitente field, although primarily due to problems<br />
with power supply, this system has <strong>on</strong>ly been able to successfully<br />
record isolated days <strong>of</strong> data. This abstract will briefly outline <strong>the</strong> system<br />
setups <strong>use</strong>d thus far, and will report <strong>on</strong> <strong>the</strong> recommendati<strong>on</strong>s discussed<br />
during <strong>the</strong> meeting that will be <strong>use</strong>d for future trials.<br />
Thus far, five different power setups have been trialled with varying degrees<br />
<strong>of</strong> success to charge a CSAT3 s<strong>on</strong>ic anemometer, a LI-COR7500 gas<br />
analyser and CR1000 datalogger logging at 10 Hz (Tab. 1). Whilst <strong>the</strong>se<br />
setups were sufficient to run <strong>the</strong> system for a week, <strong>the</strong>y did not supply<br />
sufficient power to keep <strong>the</strong> system running for l<strong>on</strong>ger periods. Of <strong>the</strong> five<br />
setups, <strong>the</strong> most ’successful’ (i.e. <strong>the</strong> system had sufficient power for several<br />
days) were <strong>the</strong> first and third opti<strong>on</strong>s, where relatively large batteries<br />
were c<strong>on</strong>nected to a 60 W panel.<br />
The c<strong>on</strong>sensus view from discussi<strong>on</strong>s at <strong>the</strong> workshop was that <strong>the</strong> solar<br />
panel was probably not sufficient enough to charge <strong>the</strong> battery given<br />
59
Figure 1. Penitentes <strong>on</strong> <strong>the</strong> surface <strong>of</strong> a small glacier in <strong>the</strong> Huasco Valley, Chile in January<br />
2011. The photo shows a field <strong>of</strong> penitentes that are between 1.5 - 2 m high (easterly view).<br />
Note <strong>the</strong> pers<strong>on</strong> in <strong>the</strong> background for scale.<br />
<strong>the</strong> relatively large current needed to power <strong>the</strong> LI-COR7500 gas analyser.<br />
The recommendati<strong>on</strong>s were to ei<strong>the</strong>r add ano<strong>the</strong>r 60 W panel to Setup 3<br />
and to possibly add more battery power (i.e. 2 x 60 W panels and batteries<br />
totalling 200 Ahr). To achieve this level <strong>of</strong> battery capacity it was recommended<br />
to <strong>use</strong> four or more smaller batteries in parallel as opposed to<br />
<strong>on</strong>e large battery, as smaller batteries are easier to manage in <strong>the</strong> field).<br />
A 20 A diode to regulate each solar panel was suggested as an alternative<br />
to <strong>the</strong> regulator as <strong>the</strong>y are more ec<strong>on</strong>omical, easier to test and acquire.<br />
Finally, <strong>the</strong> measurement interval could be decreased to 1 Hz to reduce<br />
power requirements without losing informati<strong>on</strong> relevant to <strong>the</strong> turbulent<br />
flux measurements.<br />
This coming winter I plan to trial <strong>the</strong> new power system opti<strong>on</strong>s, and<br />
will hopefully have <strong>the</strong> system running c<strong>on</strong>tinuously before <strong>the</strong> penitentes<br />
start to grow again!<br />
Table 1. Power system trials<br />
Setup ID Power setup<br />
1 110Ah battery + 60 W panel + Morning star SunSaver 10 regulator<br />
2 150Ah + 60 W panel (c<strong>on</strong>nected at day)<br />
3 150Ah + 60 W panel + diode<br />
4 110Ah + 150 Ah (parallel)<br />
5 150Ah + 2*10 W panel + SunSaver / Campbell 9 Ah regulator<br />
60
Acknowledgements<br />
Special thanks to Michele Citterio, Paul Smeets, Alex Jarosch, Lindsey Nichols<strong>on</strong>, and Christophe<br />
Kinnard for helpful discussi<strong>on</strong>s.<br />
References<br />
Amstuz, G.. 1955. On <strong>the</strong> formati<strong>on</strong> <strong>of</strong> snow penitentes. J. Glaciol., 3(24), 304–311.<br />
Bergen<strong>on</strong>, V., C. Berger and M. Bettert<strong>on</strong>. 2006. C<strong>on</strong>trolled irradiative formati<strong>on</strong> <strong>of</strong> penitentes.<br />
Physical Review Letters, 96(098502).<br />
Bettert<strong>on</strong>, M.. 2001. Theory <strong>of</strong> structure formati<strong>on</strong> in snowfields motivated by penitentes,<br />
suncups, and dirt c<strong>on</strong>es. Physical Review E, 63(056129).<br />
Corripio, J. and R. Purves. 2005. Surface energy balance <strong>of</strong> high altitude <strong>glaciers</strong> in <strong>the</strong> central<br />
andes: <strong>the</strong> effect <strong>of</strong> snow penitentes. In: de J<strong>on</strong>g, C., D. Collins and R. Ranzi, editors,<br />
Climate and Hydrology in Mountain Areas. Wiley & S<strong>on</strong>s, L<strong>on</strong>d<strong>on</strong>.<br />
Kaser, G., D. Hardy, T. Mölg, R. Bradley and T. Hyera. 2004. Modern glacier retreat <strong>on</strong> kilimanjaro<br />
as evidence <strong>of</strong> climate change: observati<strong>on</strong>s and facts. Int. J. Climatol., 24,<br />
291–303.<br />
Kraus, H.. 1972. Energy exchange at air–ice interface, in role <strong>of</strong> snow and ice in hydrology.<br />
IAHS Pub., 107, 128–164. JAHS Press, Wallingford.<br />
Lliboutry, L.. 1954. The origin <strong>of</strong> penitentes. J. Glaciol., 2(15), 331–338.<br />
Lliboutry, L.. 1998. Glaciers <strong>of</strong> <strong>the</strong> dry andes. In: Williams, R. S. J. and J. G. Ferrigno, editors,<br />
Satellite Image Atlas <strong>of</strong> Glaciers <strong>of</strong> <strong>the</strong> World SOUTH AMERICA. Pr<strong>of</strong>essi<strong>on</strong>al Paper 1386–I.<br />
United States Geological Survey.<br />
Schulz, O. and C. de J<strong>on</strong>g. 2004. Snowmelt and sublimati<strong>on</strong>: field experiments and modelling<br />
in <strong>the</strong> high atlas mountains <strong>of</strong> morocco. Hydrology and Earth System Sciences, 8(6),<br />
1076–1089.<br />
61
Glaciological field studies at Zhadang Glacier<br />
(5500-6095 m), Tibetan Plateau<br />
Fabien Maussi<strong>on</strong> 1 , Yang Wei 2 , Eva Huintjes 3 , Tino Piecz<strong>on</strong>ka 4 , Dieter Scherer 1 , Tand<strong>on</strong>g<br />
Yao 2 , Shichang Kang 2 , Tobias Bolch 4 , Manfred Buchroithner 4 and Christoph<br />
Schneider 3<br />
1 Institut für Ökologie, Technische Universität Berlin, Berlin, Germany<br />
Email: fabien.maussi<strong>on</strong>@tu-berlin.de<br />
2 Institute <strong>of</strong> Tibetan Plateau Research, Chinese Academy <strong>of</strong> Sciences, Beijing, China<br />
3 Geographisches Institut, RWTH Aachen University, Aachen, Germany<br />
4 Institut für Kartographie, Technische Universität Dresden, Dresden, Germany<br />
Introducti<strong>on</strong><br />
For historical and logistical reas<strong>on</strong>s, meteorological observati<strong>on</strong>s <strong>on</strong> <strong>the</strong><br />
Tibetan Plateau (TP) are scarce. It is even more true for mountain-regi<strong>on</strong>s,<br />
where <strong>glaciers</strong> have been observed intensively <strong>on</strong>ly since recent years.<br />
This lack <strong>of</strong> observati<strong>on</strong>s is problematic, regarding <strong>the</strong>ir importance for<br />
both local and regi<strong>on</strong>al eco<strong>systems</strong>. Primarily, <strong>the</strong> Institute <strong>of</strong> Tibetan<br />
Plateau Research (ITP, Chinese Academy <strong>of</strong> Sciences) is dedicated to current<br />
glaciological observati<strong>on</strong>s <strong>on</strong> <strong>the</strong> TP.<br />
Zhadang Glacier is a small valley glacier (2.48 km 2 ) located in <strong>the</strong> Nyainqentanglha<br />
Range, about 200 km North from Lhasa (see Fig. 1 and Bolch<br />
et al. (2010), for a comprehensive descripti<strong>on</strong> <strong>of</strong> <strong>the</strong> study regi<strong>on</strong> and its<br />
glacier changes 1976-2009). The glacier is exposed to <strong>the</strong> northwest and<br />
drains into Lake Nam Co (4725 m a.s.l.), Tibet’s largest salt water lake. The<br />
regi<strong>on</strong> is under <strong>the</strong> complex influence <strong>of</strong> both <strong>the</strong> c<strong>on</strong>tinental climate <strong>of</strong><br />
Central Asia and <strong>the</strong> Indian M<strong>on</strong>so<strong>on</strong> system (Kang et al., 2009), which<br />
leads to a climate characterised by a str<strong>on</strong>g seas<strong>on</strong>ality in both temperature<br />
and precipitati<strong>on</strong>. Only little precipitati<strong>on</strong> occurs during winter, while<br />
about 90% <strong>of</strong> mean annual precipitati<strong>on</strong> is measured from June to September.<br />
Glaciers located in this c<strong>on</strong>tinental summer precipitati<strong>on</strong> climate, with<br />
<strong>the</strong> maximum <strong>of</strong> annual accumulati<strong>on</strong> and ablati<strong>on</strong> occurring simultaneously,<br />
are called summer accumulati<strong>on</strong> type <strong>glaciers</strong>.<br />
ITP operates two Automatic Wea<strong>the</strong>r Stati<strong>on</strong>s (AWS) since September<br />
2005 in <strong>the</strong> area <strong>of</strong> Zhadang Glacier: <strong>on</strong>e in <strong>the</strong> accumulati<strong>on</strong> area <strong>of</strong> <strong>the</strong><br />
glacier (5785 m a.s.l.) and <strong>the</strong> o<strong>the</strong>r in <strong>the</strong> valley (5400 m a.s.l.) in fr<strong>on</strong>t<br />
<strong>of</strong> <strong>the</strong> glacier. C<strong>on</strong>tinuous measurements are supplemented by mass balance<br />
measurements applying <strong>the</strong> glaciological method. The installati<strong>on</strong>s<br />
have been complemented in May 2009 by Sino-German teams within <strong>the</strong><br />
DynRG-TiP project (Link) with two AWS: <strong>on</strong>e <strong>on</strong> <strong>the</strong> ablati<strong>on</strong> z<strong>on</strong>e <strong>of</strong> <strong>the</strong><br />
glacier (5660 m a.s.l.) and <strong>on</strong>e that has been relocated recently to <strong>the</strong><br />
terminal moraine close to <strong>the</strong> glacier t<strong>on</strong>gue (5550 m a.s.l.). Besides, two<br />
time-lapse cameras have been installed in May 2010 (Fig. 1). This makes<br />
Zhadang Glacier to be <strong>the</strong> <strong>on</strong>e <strong>of</strong> <strong>the</strong> most sophisticated measurement<br />
62
a. b.<br />
Figure 1. a) Overview <strong>of</strong> <strong>the</strong> Nyainqentanglha Range, including a zoom into <strong>the</strong> Zhadang<br />
Glacier area (after Bolch et al., 2010). b) Panorama <strong>of</strong> Zhadang Glacier, with locati<strong>on</strong>s <strong>of</strong> <strong>the</strong><br />
AWS and camera installati<strong>on</strong>s (full panorama available <strong>on</strong>line (Link))<br />
sites <strong>on</strong> <strong>the</strong> TP. Here we focus <strong>on</strong> <strong>the</strong> recent DynRG-TiP AWS and camera<br />
installati<strong>on</strong>s.<br />
Logistical aspects<br />
The equipment and mechanical parts have been shipped from Germany<br />
to China a few m<strong>on</strong>ths before our arrival. The Chinese customs allow a<br />
temporary import for a period <strong>of</strong> six m<strong>on</strong>ths renewable <strong>on</strong>ly twice, and ask<br />
for a security deposit <strong>of</strong> about 20% <strong>of</strong> <strong>the</strong> ware value. Since our stati<strong>on</strong>s<br />
operate for a l<strong>on</strong>ger period, <strong>the</strong> deposit has been lost and <strong>the</strong> ware was<br />
<strong>of</strong>ficially imported to China in 2010. Some <strong>use</strong>ful mechanical parts (tools,<br />
tubes, etc.) can be bought in Lhasa, but <strong>the</strong>y are mostly <strong>of</strong> inferior quality<br />
or heavy.<br />
We usually visit <strong>the</strong> glacier twice a year (May and September). However,<br />
this will no l<strong>on</strong>ger be necessary as <strong>the</strong> <strong>systems</strong> are now running<br />
stable. We expect that <strong>on</strong>e campaign per year towards <strong>the</strong> end <strong>of</strong> <strong>the</strong><br />
ablati<strong>on</strong> seas<strong>on</strong> will be sufficient. Due to <strong>the</strong> high altitude two acclimatisati<strong>on</strong><br />
steps <strong>of</strong> three days each are necessary (Lhasa, 3650 m a.s.l. and<br />
Nam Co, 4740 m a.s.l) before being capable to go up to <strong>the</strong> base camp<br />
(5400 m a.s.l.), which is reached in a <strong>on</strong>e day walk. Tibetan nomads are<br />
living in <strong>the</strong> valley from May to September and let <strong>the</strong>ir yaks graze. Without<br />
<strong>the</strong>ir support and <strong>the</strong> strength <strong>of</strong> <strong>the</strong>ir horses or yaks to carry our<br />
equipment, <strong>the</strong> ascensi<strong>on</strong> would be virtually impossible. However, <strong>the</strong> nomads<br />
are not always in favour <strong>of</strong> our activities: some <strong>of</strong> <strong>the</strong>m are superstitious<br />
and recently our stati<strong>on</strong>s were held resp<strong>on</strong>sible for various capricious<br />
wea<strong>the</strong>r phenomena.<br />
Automatic wea<strong>the</strong>r stati<strong>on</strong>s<br />
The instruments (Tab. 1) were primarily mounted <strong>on</strong> a mast drilled into <strong>the</strong><br />
ice to more than 2.5 m depth. Based <strong>on</strong> <strong>the</strong> mass balance measurements<br />
63
Table 1. Sensor specificati<strong>on</strong>s.<br />
Measured quantity Instrument Sample interval<br />
Air temperature (2 heights) CS215 (Campbell) 10 min<br />
Relative humidity (2 heights) CS215 (Campbell) 10 min<br />
Air pressure DPI740 (T. Friedrichs & Co) 10 min<br />
Net radiati<strong>on</strong> NR-Lite (Campbell) 10 min<br />
Solar radiati<strong>on</strong> (up and down) CS300 (Campbell) 10 min<br />
L<strong>on</strong>gwave radiati<strong>on</strong> (up) IRTS-P Apogee 10 min<br />
Ice temperature (8 depths, down to 9 m) 107TP (Campbell) 10 min<br />
Surface height SR50 (Campbell) 10 min<br />
Wind speed and directi<strong>on</strong> 05103 (Young) 10 sec sample,<br />
10 min storage<br />
Wind (s<strong>on</strong>ic anemometer) Windmaster (Gill) 10 Hz sample,<br />
10 min storage<br />
Mast inclinati<strong>on</strong> (2D) SCA121T (VTI Tech) 10 min<br />
in previous years (about 1 m w.e. per year, Kang et al. (2009)) and our own<br />
estimati<strong>on</strong> <strong>of</strong> <strong>the</strong> equilibrium line altitude, this seemed to be a reas<strong>on</strong>able<br />
choice. The high ablati<strong>on</strong> in 2009, estimated to 2.5 m <strong>of</strong> ice, ca<strong>use</strong>d <strong>the</strong><br />
fall <strong>of</strong> both stati<strong>on</strong>s around mid-July. Therefore, we changed to a tripod<br />
set-up and a separate mast for <strong>the</strong> s<strong>on</strong>ic ranger (Campbell SR50) (Fig. 2).<br />
The stati<strong>on</strong>s was supposed to stay <strong>on</strong> <strong>the</strong>ir feet as <strong>the</strong> ice level decreases<br />
but for some reas<strong>on</strong>s (extreme wind? debris within <strong>the</strong> ice?) <strong>the</strong> stati<strong>on</strong>s<br />
again fell over in summer 2010. ITP staff could re-erect <strong>the</strong>m <strong>on</strong>e m<strong>on</strong>th<br />
later. A c<strong>on</strong>structi<strong>on</strong> with wider feet extent may have been more stable,<br />
but difficult to find in China. The SR50 structure inspired by Oerlemans<br />
et al. (2004) (three tubes <strong>of</strong> 5 m length, drilled inclined into <strong>the</strong> ice) proved<br />
to be very stable, but <strong>the</strong> inclined holes are difficult to drill properly using<br />
<strong>the</strong> steam drill.<br />
The stati<strong>on</strong>s worked perfectly and had no data or power failures (radiati<strong>on</strong><br />
values are high also in winter and <strong>the</strong> batteries are recharged efficiently).<br />
Thanks to <strong>the</strong> inclinometer placed at <strong>the</strong> mast, it was easy to<br />
track all events <strong>of</strong> falling over. By this means valid measurement periods<br />
could be selected. The low-cost <strong>of</strong> <strong>the</strong> sensor is less <strong>of</strong> a problem than<br />
<strong>the</strong> provisi<strong>on</strong> <strong>of</strong> two extra slots <strong>on</strong> <strong>the</strong> data-logger (CR1000, Campbell).<br />
Never<strong>the</strong>less, this is really worthwhile c<strong>on</strong>sidering <strong>the</strong> importance <strong>of</strong> <strong>the</strong><br />
informati<strong>on</strong> <strong>on</strong> mast tilt. In order to measure <strong>the</strong> radiati<strong>on</strong> budget we replaced<br />
<strong>the</strong> popular CNR1 from Kipp & Z<strong>on</strong>en by <strong>the</strong> cost-effective 4-sensor<br />
installati<strong>on</strong> described in Table 1. The shortwave radiati<strong>on</strong> measurements<br />
proved to be accurate. In c<strong>on</strong>trast, <strong>the</strong> l<strong>on</strong>gwave radiati<strong>on</strong> measurements<br />
were not satisfying for two reas<strong>on</strong>s. The IRTS sensor shows high sensitivity<br />
to solar radiati<strong>on</strong> and measured snow surface temperatures up to several<br />
K above <strong>the</strong> melting point during <strong>the</strong> day. Fur<strong>the</strong>rmore, incoming l<strong>on</strong>gwave<br />
radiati<strong>on</strong> (obtained using <strong>the</strong> net radiati<strong>on</strong> value subtracted from<br />
<strong>the</strong> three measured comp<strong>on</strong>ents) suffers from accuracy problems due to<br />
<strong>the</strong> different frequency resp<strong>on</strong>ses <strong>of</strong> <strong>the</strong> various sensors. Two temperature<br />
and relative humidity (RH) probes are placed in a ventilated radiati<strong>on</strong><br />
64
a. b.<br />
Figure 2. a) The AWS 1 in autumn 2010 and our young Tibetan helper. b) The terrestrial<br />
camera system (placed in a waterpro<strong>of</strong> box that is closed afterwards)<br />
shield (THIES Clima GmbH). The ventilators are directly c<strong>on</strong>nected to two<br />
solar panels in an independent circuit. This has <strong>the</strong> str<strong>on</strong>g advantage that<br />
<strong>the</strong> ventilator will not <strong>use</strong> <strong>the</strong> power <strong>of</strong> <strong>the</strong> battery and that <strong>the</strong> probes are<br />
efficiently ventilated during <strong>the</strong> day. However, <strong>the</strong>re is <strong>the</strong> disadvantage<br />
that <strong>the</strong> probes are not ventilated at night. The solar panel voltage is sampled<br />
every 10 minutes to track <strong>the</strong> strength <strong>of</strong> ventilati<strong>on</strong>. The effect <strong>of</strong><br />
this ventilati<strong>on</strong> strategy in comparis<strong>on</strong> with permanent ventilati<strong>on</strong> needs<br />
to be evaluated in more detail.<br />
Terrestrial cameras<br />
We installed two cameras <strong>on</strong> <strong>the</strong> glacier lateral moraine (Can<strong>on</strong> EOS D-<br />
60, objective <strong>of</strong> 28 mm focus, fixed aperture value <strong>of</strong> 7.1 and adaptive<br />
aperture time) taking three (recently changed to six) pictures a day <strong>of</strong> <strong>the</strong><br />
glacier t<strong>on</strong>gue area. The power supply for each camera and <strong>the</strong> camera<br />
timer, resp<strong>on</strong>sible for <strong>the</strong> triggering impulse, is ensured by a single 12 V<br />
battery recharged by a solar panel. Beca<strong>use</strong> both cameras (base <strong>of</strong> about<br />
400 m with a base-to-height ratio <strong>of</strong> about 0.3) are operating simultaneously<br />
it is possible to compute glacier volume changes using stereoscopy.<br />
Therefore, 14 Ground C<strong>on</strong>trol Points (GCPs) were measured in <strong>the</strong> glacier<br />
forefield. As point locati<strong>on</strong>s we chose single boulders which are supposed<br />
to be stable over time. Even though <strong>on</strong>e <strong>of</strong> <strong>the</strong> cameras was stolen in<br />
summer 2010, <strong>the</strong> sec<strong>on</strong>d camera provided a dataset <strong>of</strong> high quality (animati<strong>on</strong><br />
available <strong>on</strong>line (Link)). The pictures allow a rare insight into <strong>the</strong><br />
meteorological and surface c<strong>on</strong>diti<strong>on</strong>s <strong>of</strong> <strong>the</strong> glacier <strong>on</strong> a sub-daily basis,<br />
which is <strong>use</strong>ful for AWS data processing, analysis and validati<strong>on</strong>. For example,<br />
<strong>the</strong> image time series was analysed in order to produce a dataset<br />
<strong>of</strong> <strong>the</strong> timing and intensity <strong>of</strong> snow events which was <strong>use</strong>d for <strong>the</strong> validati<strong>on</strong><br />
<strong>of</strong> <strong>the</strong> s<strong>on</strong>ic ranger snowfall algorithm.<br />
65
Data treatment<br />
During winter, <strong>the</strong> tripod feet are covered by ice and snow and <strong>the</strong> system<br />
is very stable. Only standard correcti<strong>on</strong>s are necessary (RH for temperatures<br />
below zero using <strong>the</strong> values given by Campbell, interpolati<strong>on</strong> <strong>of</strong><br />
temperature and humidity at <strong>the</strong> 2 m height, s<strong>on</strong>ic range correcti<strong>on</strong> for<br />
temperature). During summer, rapid snow events and follow-up melt may<br />
occur within hours. High wind speeds and surface changes make <strong>the</strong> stati<strong>on</strong><br />
stagger.<br />
Precipitati<strong>on</strong> <strong>of</strong>ten occurs in <strong>the</strong> form <strong>of</strong> s<strong>of</strong>t hail. All <strong>the</strong>se surface c<strong>on</strong>diti<strong>on</strong>s<br />
toge<strong>the</strong>r seem to influence <strong>the</strong> quality <strong>of</strong> <strong>the</strong> signal <strong>of</strong> <strong>the</strong> s<strong>on</strong>ic<br />
ranger. The quality flag provided by <strong>the</strong> sensor is <strong>use</strong>ful for <strong>automatic</strong>ally<br />
filtering a large part <strong>of</strong> <strong>the</strong> invalid data. Never<strong>the</strong>less, <strong>the</strong> signal remains<br />
noisy (sometimes above <strong>the</strong> accuracy <strong>of</strong> 1 cm specified by <strong>the</strong> manufacturer)<br />
especially during precipitati<strong>on</strong> events. The temperature correcti<strong>on</strong><br />
is necessary to avoid artefacts, as <strong>the</strong> measured distance may "diminish"<br />
at <strong>the</strong> end <strong>of</strong> <strong>the</strong> day. This could falsely be interpreted as a snow event. In<br />
order to minimise this effect, a 3 h moving mean <strong>of</strong> top and bottom temperature<br />
sensors was <strong>use</strong>d for <strong>the</strong> correcti<strong>on</strong>. Finally, a 3 h moving mean is<br />
applied to <strong>the</strong> s<strong>on</strong>ic ranger data for noise reducti<strong>on</strong>. A larger window size<br />
would increase <strong>the</strong> smoothing but would reduce <strong>the</strong> signal <strong>of</strong> <strong>the</strong> short and<br />
small (less than 10 cm) but frequent snow events <strong>of</strong> <strong>the</strong> summer seas<strong>on</strong>.<br />
For <strong>the</strong> detecti<strong>on</strong> and quantificati<strong>on</strong> <strong>of</strong> snow events using s<strong>on</strong>ic ranger<br />
data, several algorithms were compared and gave largely variable results<br />
(up to a factor 3 in <strong>the</strong> amounts). The main issue is that no validati<strong>on</strong><br />
can be made without a reference dataset. Using <strong>the</strong> informati<strong>on</strong> provided<br />
by <strong>the</strong> time-lapse camera as reference, <strong>on</strong>e <strong>of</strong> <strong>the</strong> algorithms could objectively<br />
be selected. The 6 hourly snowfall amount is obtained as follows:<br />
if <strong>the</strong> mean surface height (snow depth) <strong>of</strong> <strong>the</strong> 6 h period is higher <strong>of</strong> at<br />
least 1 cm than <strong>the</strong> mean surface height <strong>of</strong> <strong>the</strong> previous 6 h, <strong>the</strong>n a snow<br />
event occurred. The 6 h snowfall is given by <strong>the</strong> difference between <strong>the</strong><br />
maximum and <strong>the</strong> minimum surface height during <strong>the</strong>se 6 h.<br />
Recommendati<strong>on</strong>s and c<strong>on</strong>clusi<strong>on</strong>s<br />
In this document, we presented <strong>the</strong> operati<strong>on</strong> <strong>of</strong> two AWS and two cameras<br />
in <strong>the</strong> harsh envir<strong>on</strong>ment <strong>of</strong> <strong>the</strong> TP. We addressed several topics such as<br />
logistics, instrumentati<strong>on</strong>, mechanical c<strong>on</strong>structi<strong>on</strong> and data treatment. In<br />
general, our field experiment is a success, but we also made several mistakes<br />
that we would like to share in <strong>the</strong> following list <strong>of</strong> recommendati<strong>on</strong>s.<br />
They are based <strong>on</strong> our own experience, and may be not entirely new or<br />
even be unsuitable for o<strong>the</strong>r envir<strong>on</strong>ments.<br />
• Despite <strong>the</strong> high altitude, ablati<strong>on</strong> is very str<strong>on</strong>g <strong>on</strong> <strong>glaciers</strong> <strong>of</strong> <strong>the</strong><br />
central TP. The ablati<strong>on</strong> seas<strong>on</strong> is short (June to mid-August) but intense.<br />
Therefore, AWS c<strong>on</strong>structi<strong>on</strong>s based <strong>on</strong> stable tripods are recommended<br />
for altitude ranges below 6000 m a.s.l.<br />
66
a.<br />
b.<br />
Figure 3. a) Daily means <strong>of</strong> snow accumulati<strong>on</strong> and ablati<strong>on</strong> at AWS 1 in 2009 and 2010<br />
and air temperature. b) Wind roses and diurnal cycle <strong>of</strong> wind speed for <strong>the</strong> whole<br />
measurement period, winter seas<strong>on</strong> and summer seas<strong>on</strong>.<br />
• The tripod should be as light and as bright as possible to resist <strong>the</strong><br />
harsh wea<strong>the</strong>r c<strong>on</strong>diti<strong>on</strong>s.<br />
• A sec<strong>on</strong>d system, installed next to <strong>the</strong> glacier, emerged as <strong>the</strong> safest<br />
way to ensure c<strong>on</strong>tinuous data collecti<strong>on</strong>.<br />
• Time-lapse cameras, besides <strong>the</strong> applicati<strong>on</strong> for stereoscopy, are a <strong>use</strong>ful<br />
tool to understand and observe surface and near-surface c<strong>on</strong>diti<strong>on</strong>s<br />
<strong>of</strong> a glacier. Cost-effective <strong>systems</strong> are easily available for such purposes.<br />
• The "daytime ventilati<strong>on</strong>", radiati<strong>on</strong> shield ventilators directly c<strong>on</strong>nected<br />
to independent dedicated solar panels, is an efficient way to ensure <strong>the</strong><br />
67
power supply <strong>of</strong> <strong>the</strong> instruments. The effect <strong>of</strong> this ventilati<strong>on</strong> strategy<br />
<strong>on</strong> <strong>the</strong> temperature measurements especially during night is not yet<br />
quantified.<br />
• If <strong>the</strong>re are adequate financial resources, a direct measurement <strong>of</strong> all<br />
four radiati<strong>on</strong> comp<strong>on</strong>ents using accurate sensors is a good soluti<strong>on</strong> to<br />
avoid complex and imperfect data post-processing.<br />
• If <strong>the</strong>re are enough slots available <strong>on</strong> <strong>the</strong> data-logger, <strong>the</strong> measurement<br />
<strong>of</strong> <strong>the</strong> tilt <strong>of</strong> <strong>the</strong> mast simplifies many aspects <strong>of</strong> data post-processing.<br />
• The signal quality flag provided by <strong>the</strong> SR50 sensor provides <strong>use</strong>ful<br />
informati<strong>on</strong> for efficient data filtering. There should be a memory slot<br />
reserved <strong>on</strong> <strong>the</strong> data logger for this number if ever possible.<br />
The authors will be pleased to answer any fur<strong>the</strong>r questi<strong>on</strong>s and are open<br />
to suggesti<strong>on</strong>s or comments regarding this list.<br />
In <strong>the</strong> meantime, <strong>the</strong> efforts <strong>of</strong> <strong>measuring</strong> near surface meteorology<br />
<strong>on</strong> Zhadang Glacier have provided us with outstanding and unique data<br />
(see Fig. 3) that in <strong>the</strong> near future will allow accurate and state-<strong>of</strong>-<strong>the</strong>art<br />
investigati<strong>on</strong> <strong>of</strong> surface energy and mass exchange from a logistically<br />
difficult remote high altitude site.<br />
Acknowledgements<br />
The work is supported by <strong>the</strong> German Research Foundati<strong>on</strong> (Deutsche Forschungsgemein-<br />
schaft, DFG) within <strong>the</strong> Tibetan Plateau (TiP) Priority Programme under <strong>the</strong> codes SCHE<br />
750/4-1, SCHN 680/3-1, and BU 949/20-1. Many thanks to our colleagues from <strong>the</strong> ITP,<br />
from Germany and to our Tibetan helpers.<br />
References<br />
Bolch, T., T. Yao, S. Kang, M. Buchroithner, D. Scherer, F. Maussi<strong>on</strong> and C. Schneider. 2010.<br />
A glacier inventory for <strong>the</strong> western nyainqentanglha range and nam co basin, tibet, and<br />
glacier changes 1976–2009. The Cryosphere, 4, 419–433.<br />
DynRG-TiP. Dynamic resp<strong>on</strong>se <strong>of</strong> <strong>glaciers</strong> <strong>on</strong> <strong>the</strong> tibetan plateau to climate change<br />
(http://www.klima.tu-berlin.de/index.php?show=forschung_asien_tibet &lan=en). DFG<br />
Priority Programme 1372. “Tibetan Plateau: Formati<strong>on</strong>, Climate Eco<strong>systems</strong> (TiP)”<br />
(http://www.tip.uni-tuebingen.de).<br />
Kang, S., F. Chen, T. Gao, Y. Zhang, W. Yang, W. Yu and T. Yao. 2009. Early <strong>on</strong>set <strong>of</strong> rainy<br />
seas<strong>on</strong> suppresses glacier melt: a case study <strong>on</strong> zhadang glacier, tibetan plateau. J.<br />
Glaciol., 55(192), 755–758.<br />
Oerlemans, J., W. Boot, M. van den Broeke, C. Reijmer and R. van de Wal.<br />
2004. Aws in <strong>the</strong> ablati<strong>on</strong> z<strong>on</strong>es <strong>of</strong> <strong>glaciers</strong>, workshop <strong>on</strong> <strong>the</strong> <strong>use</strong> <strong>of</strong> <strong>automatic</strong><br />
wea<strong>the</strong>r stati<strong>on</strong>s <strong>on</strong> <strong>glaciers</strong>. In: Reijmer, C., editor, Automatic wea<strong>the</strong>r stati<strong>on</strong>s<br />
<strong>on</strong> <strong>glaciers</strong>, Proceedings <strong>of</strong> a workshop, 28-31 March 2004, P<strong>on</strong>tresina (Switzerland),<br />
pages 83–87. Institute for Marine and Atmospheric Research Utrecht (IMAU).<br />
http://www.projects.science.uu.nl/iceclimate/workshop/documents/aws_ab stracts.pdf.<br />
One ablati<strong>on</strong> seas<strong>on</strong> at zhadang glacier. http://www.klima.tu-berlin.de/forschung/<br />
Asien/tibet/pics/<strong>on</strong>e_seas<strong>on</strong>.gif.<br />
Panorama <strong>of</strong> zhadang glacier. http://www.klima.tu-berlin.de/forschung/Asien/tibet/<br />
pics/panorama/zhadang_pano.html.<br />
68
Determining glacier velocity with single frequency<br />
GPS receivers<br />
C.H. Reijmer, R.S.W. van de Wal and W. Boot<br />
Institute for Marine and Atmospheric research Utrecht, Utrecht University, The Ne<strong>the</strong>rlands.<br />
Introducti<strong>on</strong><br />
A well-known phenomen<strong>on</strong> in glacier dynamics is <strong>the</strong> existence <strong>of</strong> a relati<strong>on</strong><br />
between <strong>the</strong> glacier velocity and available amount <strong>of</strong> melt water<br />
(Zwally et al., 2002; Van de Wal et al., 2008). This relati<strong>on</strong> is <strong>of</strong> particular<br />
importance when estimating <strong>the</strong> reacti<strong>on</strong> <strong>of</strong> <strong>glaciers</strong> and ice sheets to<br />
climate change. In order to better understand this relati<strong>on</strong>, detailed flow<br />
velocity and mass balance informati<strong>on</strong> is crucial. For this purpose, <strong>the</strong> Institute<br />
for Marine and Atmospheric research Utrecht (IMAU) developed a<br />
low cost stand-al<strong>on</strong>e single-frequency GPS unit to perform year round ice<br />
velocity observati<strong>on</strong>s.<br />
The Instruments<br />
The GPS units make <strong>use</strong> <strong>of</strong> <strong>the</strong> Global Positi<strong>on</strong>ing System (GPS) (United<br />
States Air Force, 1996; USA Department <strong>of</strong> Defence, 2008), to determine<br />
<strong>the</strong> locati<strong>on</strong> <strong>of</strong> an instrument at a preset time interval. GPS is available<br />
since 1973 and since in 2000 <strong>the</strong> selective availability (an artificial degrading<br />
<strong>of</strong> <strong>the</strong> signal) is turned <strong>of</strong>f, <strong>the</strong> stand-al<strong>on</strong>e system is commercially developed<br />
for navigati<strong>on</strong>al purposes. In 2003 IMAU started <strong>the</strong> development<br />
<strong>of</strong> a cheap and robust GPS receiver to m<strong>on</strong>itor glacier velocities. Figure 1<br />
presents <strong>the</strong> unit. It c<strong>on</strong>sists <strong>of</strong> a small chip c<strong>on</strong>taining <strong>the</strong> GPS receiver<br />
69<br />
Figure 1. GPS unit.
Figure 2. Scatter plot <strong>of</strong><br />
three years <strong>of</strong> n<strong>on</strong>-averaged<br />
data from a reference site <strong>on</strong><br />
Svalbard (NBB). Observati<strong>on</strong>s<br />
are plot with respect to <strong>the</strong><br />
average locati<strong>on</strong>, negative<br />
values denote <strong>the</strong> records to<br />
<strong>the</strong> south and/or west <strong>of</strong> <strong>the</strong><br />
average positi<strong>on</strong>. The red<br />
dots indicate <strong>the</strong> locati<strong>on</strong> <strong>of</strong><br />
<strong>the</strong> DGPS with respect to <strong>the</strong><br />
averaged locati<strong>on</strong>, 1 = 2007,<br />
2 = 2008. The green circle<br />
denotes <strong>on</strong>e standard<br />
deviati<strong>on</strong> <strong>of</strong> <strong>the</strong> n<strong>on</strong>-averaged<br />
data.<br />
and <strong>the</strong> data storage unit. The receiver <strong>use</strong>s 15 Ahr per year and when<br />
powered by <strong>on</strong>e 3.6 V Lithium battery can run for over <strong>on</strong>e year without<br />
servicing. The sample time is between 1 to 3 h and all data is stored locally.<br />
More details can be found in Den Ouden et al. (2010). First test with<br />
<strong>the</strong> system were carried out in 2004 <strong>on</strong> Breidamerkurjökull, and first year<br />
round deployment was in 2005 <strong>on</strong> <strong>the</strong> Kangerlussuaq transect, Western<br />
Greenland <strong>of</strong> which results are presented in Van de Wal et al. (2008). At<br />
present, about 60 IMAU GPS units are operati<strong>on</strong>al worldwide.<br />
Accuracy<br />
The IMAU GPS unit is a stand-al<strong>on</strong>e single-frequency system. The accuracy<br />
<strong>of</strong> a single measurement <strong>of</strong> such a system is <strong>on</strong> <strong>the</strong> order <strong>of</strong> 13 - 23 m<br />
depending <strong>on</strong> i<strong>on</strong>ospheric c<strong>on</strong>diti<strong>on</strong>s (HSAT value, USA Department <strong>of</strong> Defence,<br />
2008). A number <strong>of</strong> methods and models are available to improve<br />
<strong>the</strong> accuracy <strong>of</strong> this type <strong>of</strong> system (King et al., 2002). However, in order<br />
to limit power c<strong>on</strong>sumpti<strong>on</strong> <strong>on</strong>ly time and positi<strong>on</strong>al informati<strong>on</strong> is stored<br />
and almost no in situ computati<strong>on</strong>s are carried out. Therefore, n<strong>on</strong>e <strong>of</strong><br />
<strong>the</strong>se correcti<strong>on</strong>s can be applied due to lack <strong>of</strong> informati<strong>on</strong>. As a result,<br />
<strong>the</strong> accuracy <strong>of</strong> our system is variable in space and time, largely determined<br />
by i<strong>on</strong>ospheric c<strong>on</strong>diti<strong>on</strong>s. Figure 2 illustrates <strong>the</strong> accuracy <strong>of</strong> a<br />
reference system placed <strong>on</strong> solid rock <strong>on</strong> Svalbard. The standard deviati<strong>on</strong><br />
(std) in three years <strong>of</strong> data is 1.65 m, which is much better than <strong>the</strong><br />
HSAT values given above. This is due to <strong>the</strong> sampling strategy in which for<br />
every measurement <strong>the</strong> system is turned <strong>on</strong> for 3 minutes until a stable<br />
signal is reached.<br />
70
Figure 3. Scatter plot <strong>of</strong> three years <strong>of</strong> n<strong>on</strong>-averaged data from a reference site <strong>on</strong><br />
Svalbard (NBB). Observati<strong>on</strong>s are plot with respect to <strong>the</strong> average locati<strong>on</strong>, negative values<br />
denote <strong>the</strong> records to <strong>the</strong> south and/or west <strong>of</strong> <strong>the</strong> average positi<strong>on</strong>. The red dots indicate<br />
<strong>the</strong> locati<strong>on</strong> <strong>of</strong> <strong>the</strong> DGPS with respect to <strong>the</strong> averaged locati<strong>on</strong>, 1 = 2007, 2 = 2008. The<br />
green circle denotes <strong>on</strong>e standard deviati<strong>on</strong> <strong>of</strong> <strong>the</strong> n<strong>on</strong>-averaged data.<br />
Glaciers show a wide range <strong>of</strong> velocities from slow (order m/yr) to very<br />
fast flowing <strong>glaciers</strong> (order km/yr). To better distinguish signal from noise,<br />
especially for slower moving <strong>glaciers</strong>, <strong>the</strong> signal must be averaged. Unfortunately,<br />
this reduces <strong>the</strong> temporal resoluti<strong>on</strong>. The std in <strong>the</strong> averaged<br />
observati<strong>on</strong> reduces with 1/sqrt(n) with n being <strong>the</strong> number <strong>of</strong> measurements<br />
in <strong>the</strong> running average. With a sample time <strong>of</strong> 1 hour, averaging<br />
over n = 168 hours results in a reducti<strong>on</strong> <strong>of</strong> <strong>the</strong> std to 0.20 m. As a result,<br />
applicability <strong>of</strong> this system is limited to faster flowing <strong>glaciers</strong> (> 30 m/yr).<br />
An example <strong>of</strong> observed velocities after averaging is given in Figure 3.<br />
Challenges<br />
Besides <strong>the</strong> accuracy <strong>of</strong> <strong>the</strong> system posing a limit to its applicability, <strong>the</strong><br />
harsh envir<strong>on</strong>ment <strong>on</strong> <strong>glaciers</strong> also provides challenges. Moisture is a<br />
major problem for all electr<strong>on</strong>ic equipment <strong>on</strong> <strong>glaciers</strong>. The housing <strong>of</strong><br />
<strong>the</strong> unit is c<strong>on</strong>structed such that fortunately no moisture problems are<br />
encountered. Fur<strong>the</strong>rmore, <strong>the</strong> system is not opened in <strong>the</strong> field for data<br />
collecti<strong>on</strong> ensuring that no moisture can enter <strong>the</strong> system in situ.<br />
Ice formati<strong>on</strong> around <strong>the</strong> instrument may ca<strong>use</strong> <strong>the</strong> stake <strong>on</strong> which it is<br />
mounted to break, which may result in burial <strong>of</strong> <strong>the</strong> instrument. To prevent<br />
loss <strong>of</strong> <strong>the</strong> system through burial, a RECCO reflector is attached to <strong>the</strong> unit<br />
(Link). RECCO is a system <strong>use</strong>d for finding and rescuing avalanche victims.<br />
The RECCO transmitter <strong>use</strong>s a directi<strong>on</strong>al radar signal to locate a RECCO<br />
reflector. It works up to 200 m through air and depending <strong>on</strong> moisture<br />
c<strong>on</strong>tent <strong>of</strong> <strong>the</strong> snow up to 20 m through snow. Since using this system we<br />
found 5 units out <strong>of</strong> 6 that would o<strong>the</strong>rwise be lost.<br />
In very crevassed areas <strong>systems</strong> are placed using helicopters instead <strong>of</strong><br />
snow mobiles or hiking. In order to ensure data collecti<strong>on</strong>, <strong>the</strong> IMAU GPS<br />
71
are now equipped with Argos transmitters, broadcasting data every few<br />
days. Note that this type <strong>of</strong> IMAU GPS <strong>use</strong>s more than <strong>on</strong>e 3.6 V lithium<br />
battery.<br />
C<strong>on</strong>clusi<strong>on</strong>s<br />
The IMAU GPS system is a very robust system with low power c<strong>on</strong>sumpti<strong>on</strong>.<br />
Main issue <strong>of</strong> this system is its accuracy (order 1.5 - 2 m). As a result<br />
averaging is necessary to improve signal to noise ratio limiting <strong>the</strong> temporal<br />
resoluti<strong>on</strong> to several days, and applicability <strong>of</strong> <strong>the</strong> system to faster<br />
flowing <strong>glaciers</strong> (> 30 m/yr). Recent developments include a type that<br />
transmits data using <strong>the</strong> Argos satellite system and applying DGPS techniques<br />
to improve <strong>the</strong> accuracy. As a side result, <strong>the</strong> RECCO has proven to<br />
be very <strong>use</strong>ful in finding buried equipment.<br />
References<br />
Den Ouden, M., C. Reijmer, V. Pohjola, R. van de Wal, J. Oerlemans and W. Boot. 2010. Standal<strong>on</strong>e<br />
single-frequency gps ice velocity observati<strong>on</strong>s <strong>on</strong> nordenskiöldbreen, svalbard. The<br />
Cryosphere, 4, 593–604.<br />
King, M., S. Edwards and P. Clark. 2002. Precise point positi<strong>on</strong>ing: Breaking <strong>the</strong> m<strong>on</strong>opoly <strong>of</strong><br />
relative gps processing. Engineering Surveying Showcase, pages 40–41.<br />
RECCO Avelanche rescue technology. http://www.recco.com.<br />
United States Air Force. 1996. Navstar gps <strong>use</strong>r equipment introducti<strong>on</strong>. Techn. rep., United<br />
States Air Force.<br />
USA Department <strong>of</strong> Defence. 2008. Global positi<strong>on</strong>ing system standard positi<strong>on</strong>ing service<br />
performance standard. Techn. rep., Department <strong>of</strong> Defence, United States <strong>of</strong> America.<br />
Van de Wal, R., W. Boot, M. van den Broeke, C. Smeets, C. Reijmer, J. D<strong>on</strong>ker and J. Oerlemans.<br />
2008. Large and rapid melt-induced velocity changes in <strong>the</strong> ablati<strong>on</strong> z<strong>on</strong>e <strong>of</strong> <strong>the</strong><br />
greenland ice sheet. Science, 321, 111–113.<br />
Zwally, H., W. Abdalati, T. Herring, K. Lars<strong>on</strong>, J. Saba and K. Steffen. 2002. Surface meltinduced<br />
accelerati<strong>on</strong> <strong>of</strong> greenland ice-sheet flow. Science, 297, 218–222.<br />
72
Recent technical developments at <strong>the</strong> IMAU:<br />
a new generati<strong>on</strong> <strong>of</strong> AWS and wireless subglacial<br />
measurements<br />
Paul Smeets, Wim Boot, Michiel van den Broeke, Roderik van de Wal<br />
Institute for Marine and Atmospheric research Utrecht, Utrecht University, The Ne<strong>the</strong>rlands.<br />
Introducti<strong>on</strong><br />
Two technical developments are presented: a new generati<strong>on</strong> <strong>of</strong> AWS and<br />
a wireless subglacial measurement system. Both <strong>systems</strong> build <strong>on</strong> <strong>the</strong><br />
experience <strong>of</strong> <strong>the</strong> IMAU in developing GPS <strong>systems</strong> (Den Ouden et al.,<br />
2010). Combining methods to minimize energy c<strong>on</strong>sumpti<strong>on</strong> and wireless<br />
communicati<strong>on</strong> form <strong>the</strong> basis <strong>of</strong> <strong>the</strong> new <strong>systems</strong> described here.<br />
A new IMAU AWS<br />
The current AWS design originates from <strong>the</strong> early nineties, and its success<br />
is for a large part based <strong>on</strong> <strong>the</strong> <strong>use</strong> <strong>of</strong> lithium batteries and Campbell<br />
dataloggers. Currently <strong>the</strong> IMAU operates 18 AWS <strong>on</strong> <strong>glaciers</strong> (Antarctica<br />
9, Greenland 4, Norway 3, Svalbard 1, Switzerland 1). An AWS typically<br />
is powered by 96 lithium batteries for 3 years <strong>of</strong> c<strong>on</strong>tinues operati<strong>on</strong>.<br />
The transportati<strong>on</strong> rules for <strong>the</strong>se batteries become increasingly strict and<br />
<strong>the</strong>ir cost price is high. Additi<strong>on</strong>ally, Campbell Scientific recently stopped<br />
producing <strong>the</strong> CR10X datalogger which is <strong>use</strong>d in all IMAU AWS. In <strong>the</strong> light<br />
<strong>of</strong> <strong>the</strong>se developments, <strong>the</strong> rising costs and problems with <strong>the</strong> uniformity<br />
and <strong>the</strong> operati<strong>on</strong> and maintenance <strong>of</strong> an increasing number <strong>of</strong> AWS, <strong>the</strong><br />
IMAU decided to start <strong>the</strong> development <strong>of</strong> a completely new type <strong>of</strong> AWS.<br />
The core <strong>of</strong> <strong>the</strong> new AWS design is an IMAU developed logger unit that<br />
is customized to our requirements. Its main characteristics are minimal<br />
energy <strong>use</strong>, small size, wireless communicati<strong>on</strong> and easy handling. In<br />
Figure 1 <strong>the</strong> current and new AWS design are compared.<br />
The logger unit is small (dims. 18x32x12 cm) and integrates <strong>the</strong> energy<br />
supply (2 batteries, a capacitor and a small solar panel), <strong>the</strong> datalogger,<br />
Bluetooth for wireless communicati<strong>on</strong> and ARGOS communicati<strong>on</strong><br />
electr<strong>on</strong>ics. Fur<strong>the</strong>rmore, it includes sensors for temperature, humidity,<br />
pressure, GPS (time and positi<strong>on</strong>), tilt, compass and instrument height. As<br />
with <strong>the</strong> current AWS, ablati<strong>on</strong> and possibly sub-surface temperatures are<br />
measured at a separate stake. The new AWS <strong>use</strong>s Bluetooth instead <strong>of</strong><br />
a cable for <strong>the</strong> data transmissi<strong>on</strong>. In Figure 2 a schematic diagram <strong>of</strong> <strong>the</strong><br />
logger unit and part <strong>of</strong> its internal comp<strong>on</strong>ents is shown.<br />
A complete AWS <strong>of</strong> <strong>the</strong> new generati<strong>on</strong> c<strong>on</strong>stitutes a logger unit, a<br />
Young wind vane, and a KIPP CNR4 radiati<strong>on</strong> sensor all fixed to a single<br />
73
a. b.<br />
Figure 1. a) The current AWS design that is <strong>use</strong>d in Greenland (two measurement heights).<br />
Close to <strong>the</strong> surface <strong>the</strong> datalogger and battery box are fixed to <strong>the</strong> mast while all<br />
instruments for wind speed/directi<strong>on</strong>, temperature/humidity and radiati<strong>on</strong> are fixed at <strong>the</strong><br />
two mast extensi<strong>on</strong>s (2 and 5 m high). The lower mast extensi<strong>on</strong> also carries an antenna for<br />
ARGOS data transmissi<strong>on</strong>. b) The new AWS design has <strong>on</strong>e mast extensi<strong>on</strong> at 4 m height<br />
carrying all instruments, cables, ARGOS antenna, datalogger and batteries. If needed, a<br />
sec<strong>on</strong>d sensor arm can be attached.<br />
mast extensi<strong>on</strong> (Fig. 1) that fits in a standard Explorer case. The new design<br />
maintains <strong>the</strong> currently <strong>use</strong>d 4-legged foot with telescopic pole that<br />
is <strong>use</strong>d for <strong>the</strong> current AWS. Replacement <strong>of</strong> <strong>the</strong> complete AWS instrumentati<strong>on</strong><br />
is <strong>the</strong>refore much faster and easier than with <strong>the</strong> current design,<br />
while Bluetooth allows wireless data transfer between <strong>the</strong> logger unit and<br />
e.g. a laptop. Fast sampling <strong>of</strong> wind speed and temperature (using an additi<strong>on</strong>al<br />
<strong>the</strong>rmocouple) are also foreseen, allowing <strong>the</strong> derivati<strong>on</strong> <strong>of</strong> turbulence<br />
fluxes using <strong>the</strong> variance method (De Bruin and Hartogensis, 2005).<br />
A field experiment is currently carried out to assess <strong>the</strong> quality <strong>of</strong> this<br />
method for <strong>use</strong> with AWS data.<br />
Current status <strong>of</strong> <strong>the</strong> new IMAU AWS<br />
At <strong>the</strong> moment single logger comp<strong>on</strong>ents are tested and a complete versi<strong>on</strong><br />
<strong>of</strong> <strong>the</strong> new logger is expected to become available in <strong>the</strong> spring <strong>of</strong><br />
2012, if funding is obtained. First tests are foreseen in <strong>the</strong> Ne<strong>the</strong>rlands<br />
and Switzerland (Morteratch Glacier).<br />
74
Figure 2. Detailed schematic <strong>of</strong> <strong>the</strong> logger unit and its internal comp<strong>on</strong>ents.<br />
A wireless subglacial probe system for deep ice applicati<strong>on</strong>s<br />
Ano<strong>the</strong>r technological development at IMAU c<strong>on</strong>centrates <strong>on</strong> englacial measurements<br />
in ablati<strong>on</strong> z<strong>on</strong>es. A problem with this type <strong>of</strong> measurements<br />
is that <strong>the</strong> internal shearing may corrupt electrical cables preventing l<strong>on</strong>g<br />
term observati<strong>on</strong>s at depth. Here, we present <strong>the</strong> design and first results<br />
<strong>of</strong> a wireless subglacial probe system that is able to transmit data<br />
through at least 600 m thick ice without signal cables running from <strong>the</strong><br />
instruments to <strong>the</strong> surface. The motivati<strong>on</strong> to develop this type <strong>of</strong> system<br />
originated from <strong>the</strong> study <strong>of</strong> <strong>the</strong> role <strong>of</strong> surface melt water in <strong>the</strong> dynamics<br />
<strong>of</strong> ice sheets and ice caps. Melt water percolates in <strong>the</strong> snow and firn<br />
in <strong>the</strong> accumulati<strong>on</strong> area, where it partly refreezes. In <strong>the</strong> ablati<strong>on</strong> area,<br />
<strong>the</strong> meltwater partly runs <strong>of</strong>f at <strong>the</strong> surface and partly reaches <strong>the</strong> glacier<br />
base through crevasses and moulins, where it has <strong>the</strong> potential to increase<br />
basal sliding via increased basal water pressure. Recently <strong>the</strong> role <strong>of</strong> melt<br />
water has been identified as influencing <strong>the</strong> moti<strong>on</strong> <strong>of</strong> larger ice caps and<br />
even ice sheets in Iceland, Svalbard and Greenland (e.g. Zwally et al.,<br />
2002; Van de Wal et al., 2008; Benn et al., 2009; Sundal et al., 2011). At<br />
present, a lack <strong>of</strong> informati<strong>on</strong> <strong>on</strong> subglacial water pressure hampers a better<br />
fundamental understanding <strong>of</strong> this process and its importance for <strong>the</strong><br />
l<strong>on</strong>g term evoluti<strong>on</strong> <strong>of</strong> <strong>the</strong> ice sheet.<br />
The wireless system is designed to penetrate through thicker ice (up to<br />
75
Figure 3. a) A probe and its internal comp<strong>on</strong>ents (<strong>the</strong> transmitter, lithium battery and a<br />
pressure sensor) and b) a probe attached to <strong>the</strong> 3 mm kevlar rope.<br />
about 1000 m) than previous <strong>systems</strong> (Harris<strong>on</strong> et al., 2004; Hart et al.,<br />
2006). The receiver/datalogger system is mounted <strong>on</strong> a small 4-legged<br />
mast that stands freely <strong>on</strong> <strong>the</strong> ablating ice surface. This is in c<strong>on</strong>trast to<br />
previous wireless <strong>systems</strong> which installed <strong>the</strong>ir receiver somewhat below<br />
<strong>the</strong> ice surface while it was c<strong>on</strong>nected via a serial/power cable to <strong>the</strong> datalogger<br />
at <strong>the</strong> ice surface to avoid signal losses occurring in <strong>the</strong> upper part<br />
<strong>of</strong> <strong>the</strong> glacier resulting from <strong>the</strong> presence <strong>of</strong> liquid water.<br />
Figure 3 shows <strong>the</strong> internal comp<strong>on</strong>ents and <strong>the</strong> c<strong>on</strong>necti<strong>on</strong> to <strong>the</strong> kevlar<br />
rope that is <strong>use</strong>d to lower <strong>the</strong> wireless probes in a hole. The upper panel<br />
displays <strong>the</strong> custom made black housing <strong>of</strong> <strong>the</strong> probe and its internal comp<strong>on</strong>ents.<br />
The housing is composed <strong>of</strong> <strong>the</strong> technical plastic Delrin®. It has<br />
high mechanical strength and rigidity, excellent resistance to moisture<br />
and has a wide end-<strong>use</strong> temperature range. The housing <strong>of</strong> <strong>the</strong> prototype<br />
has an outer(inner) diameter <strong>of</strong> 50(40) mm, a length <strong>of</strong> 350 mm and<br />
was designed to resist 200 bar <strong>of</strong> pressure. The probe c<strong>on</strong>tains three main<br />
comp<strong>on</strong>ents (upper panel, Fig. 3) with, from left to right, <strong>the</strong> 100 mW transmitter<br />
working at a frequency <strong>of</strong> 30 MHz, a lithium battery (3.6 V, 35 Ah,<br />
Tadiran batteries), and a pressure transducer (working range 0-100 bar,<br />
maximum peak pressure 300 bar). The energy c<strong>on</strong>sumpti<strong>on</strong> <strong>of</strong> <strong>the</strong> wireless<br />
probe is minimized and c<strong>on</strong>tinuous operati<strong>on</strong> can be maintained for<br />
more than 5 years, while <strong>measuring</strong> and logging data every 2 hours. The<br />
76
current prototype <strong>of</strong> <strong>the</strong> probe c<strong>on</strong>tains 1 sensor at a time but future versi<strong>on</strong>s<br />
are foreseen to include multiple sensors. The probe is attached to a<br />
3 mm kevlar rope that is <strong>use</strong>d to lower <strong>the</strong> probes in a hole (lower panel,<br />
Fig. 3). At <strong>the</strong> outer ends <strong>of</strong> <strong>the</strong> housing rope clamps enable easy fixati<strong>on</strong><br />
<strong>of</strong> a probe to <strong>the</strong> rope.<br />
At <strong>the</strong> ice surface, an antenna c<strong>on</strong>figurati<strong>on</strong> is fixed horiz<strong>on</strong>tally to a<br />
wooden/plastic frame. The antenna is c<strong>on</strong>nected to <strong>the</strong> receiver/datalogger<br />
system, which is powered by a pack <strong>of</strong> lithium batteries and mounted <strong>on</strong><br />
a small 4-legged mast. Currently, <strong>on</strong>e receiver/datalogger system is able<br />
to m<strong>on</strong>itor 32 probes simultaneously. Each probe sends out a coded set<br />
<strong>of</strong> real time data at approximately every 3 minutes (each probe <strong>use</strong>s a<br />
slightly different time interval). Once every 2 hours <strong>the</strong> receiver starts to<br />
ga<strong>the</strong>r <strong>the</strong> data from all probes during 10 minutes.<br />
The test experiment was c<strong>on</strong>ducted at site SHR al<strong>on</strong>g <strong>the</strong> K-transect<br />
at Russell glacier in South-West Greenland near Kangerlussuaq, just north<br />
<strong>of</strong> <strong>the</strong> Arctic Circle. The K-transect was established in 1990 by <strong>the</strong> IMAU<br />
and currently c<strong>on</strong>stitutes eight locati<strong>on</strong>s with mass balance and GPS measurements<br />
and three locati<strong>on</strong>s with AWS; <strong>the</strong> latter have been operati<strong>on</strong>al<br />
since August 2003 (Van de Wal et al., 2005; Van den Broeke et al., 2009a).<br />
Locati<strong>on</strong> SHR lies about 15 km from <strong>the</strong> fr<strong>on</strong>t <strong>of</strong> Russell Glacier and was<br />
chosen beca<strong>use</strong> <strong>the</strong>re <strong>the</strong> summer speed-up is <strong>the</strong> largest al<strong>on</strong>g <strong>the</strong> Ktransect<br />
(Van de Wal et al., 2008). The experiment combined <strong>the</strong> measurement<br />
<strong>of</strong> subglacial pressure, surface velocity and surface melt water<br />
producti<strong>on</strong> with best possible precisi<strong>on</strong> at hourly resoluti<strong>on</strong>.<br />
Two holes were drilled with <strong>the</strong> hot water drill from <strong>the</strong> Alfred Wegener<br />
Institute (AWI, Bremerhaven, Germany), to <strong>the</strong> ice sheet bottom in <strong>the</strong><br />
marginal ice z<strong>on</strong>e, approximately 620 m deep. In <strong>on</strong>e hole, a wireless<br />
pressure and tilt probe were lowered to <strong>the</strong> base <strong>of</strong> <strong>the</strong> glacier, while a<br />
temperature pr<strong>of</strong>ile c<strong>on</strong>sisting <strong>of</strong> 23 probes was installed at a distance<br />
<strong>of</strong> 1.5, 5.5, 10.5, 15.5 m and <strong>on</strong>going at intervals <strong>of</strong> 25 m from <strong>the</strong> base.<br />
In <strong>the</strong> sec<strong>on</strong>d hole a wired pressure/temperature probe was lowered to<br />
<strong>the</strong> base for reference. Five GPS receivers were operated at and around<br />
<strong>the</strong> drill site, toge<strong>the</strong>r with an <strong>automatic</strong> wea<strong>the</strong>r stati<strong>on</strong> (AWS). First data<br />
were retrieved in August 2010 and at that time <strong>the</strong> wireless system was<br />
still operating as it was left in July, receiving data from 26 wireless probes.<br />
The sec<strong>on</strong>d dataset was obtained in June 2011 and showed that <strong>the</strong> receiver<br />
battery was drained in February 2011, but that all wireless sensors<br />
were still operati<strong>on</strong>al. During this last visit, batteries were exchanged and<br />
we hope to capture <strong>the</strong> remaining part <strong>of</strong> <strong>the</strong> melt seas<strong>on</strong>.<br />
First results from <strong>the</strong> wireless subglacial system<br />
Figure 4 shows <strong>the</strong> first results for <strong>the</strong> July-August 2010 campaign. We find<br />
good agreement between <strong>the</strong> timeseries <strong>of</strong> subglacial pressure measured<br />
by <strong>the</strong> wireless and wired <strong>systems</strong>. The absence <strong>of</strong> data gaps dem<strong>on</strong>strates<br />
that <strong>the</strong> wireless system is well capable <strong>of</strong> transmitting data c<strong>on</strong>tinuously<br />
through at least 600 m thick ice, with <strong>on</strong>ly a limited number <strong>of</strong><br />
77
Figure 4. a) A probe and its internal comp<strong>on</strong>ents (<strong>the</strong> transmitter, lithium battery and a<br />
pressure sensor) and b) a probe attached to <strong>the</strong> 3 mm kevlar rope.<br />
outliers. For a proper comparis<strong>on</strong>, we <strong>on</strong>ly selected data that were simultaneously<br />
measured by both probes within a time window <strong>of</strong> 30 minutes.<br />
Hole 2 was approximately 22 m deeper than hole 1, and to correct for<br />
this we <strong>of</strong>fset <strong>the</strong> wireless pressure data by +2.2 bar. The lower panel <strong>of</strong><br />
Figure 4 shows <strong>the</strong> pressure difference; besides a few spikes in <strong>the</strong> wireless<br />
data set (less than 1%) <strong>the</strong> standard deviati<strong>on</strong> <strong>of</strong> <strong>the</strong> differences between<br />
both timeseries is 0.2 bar including all spikes (or 0.05 bar excluding<br />
<strong>the</strong> most obvious spikes). The small random differences are probably to<br />
be explained by <strong>the</strong> subglacial pressure variati<strong>on</strong>s within <strong>the</strong> 30 min time<br />
window.<br />
Current status <strong>of</strong> <strong>the</strong> wireless subglacial system<br />
Future experiments will involve testing a modified versi<strong>on</strong> <strong>of</strong> <strong>the</strong> wireless<br />
system with higher transmissi<strong>on</strong> power (i1000 mW transmitter and<br />
a 400 bar probe housing) in <strong>the</strong> 3000 m deep drill hole at <strong>the</strong> NEEM site<br />
in June 2011, to obtain a maximum depth range for <strong>the</strong> wireless system.<br />
Fur<strong>the</strong>rmore, we hope to capture <strong>the</strong> 2011 melt seas<strong>on</strong> at SHR with <strong>the</strong><br />
currently installed wireless system, toge<strong>the</strong>r with simultaneous measurements<br />
<strong>of</strong> <strong>the</strong> surface velocity by GPD measurements and surface energy<br />
balance from a nearby AWS.<br />
78
Acknowledgements<br />
The development <strong>of</strong> <strong>the</strong> wireless probe system is part <strong>of</strong> research performed within ice2sea<br />
work package 2.2 and dedicated to <strong>the</strong> basal lubricati<strong>on</strong> by surface melt. We acknowl-<br />
edge <strong>the</strong> ice2sea project, funded by <strong>the</strong> European Commissi<strong>on</strong>’s 7th Framework Programme<br />
through grant number 226375, ice2sea manuscript number 037.<br />
References<br />
Benn, D., J. Gulley, A. Luckman, A. Adamek and P. Glowacki. 2009. Englacial drainage <strong>systems</strong><br />
formed by hydrologically driven crevasse propagati<strong>on</strong>. J. Glaciol., 55(191), 513–523.<br />
De Bruin, H. and O. Hartogensis. 2005. Variance method to determine turbulent fluxes <strong>of</strong><br />
momentum and sensible heat in <strong>the</strong> stable atmospheric surface layer. Boundary-Layer<br />
Meteorol., 392, 116:385. DOI: 10.1007/s10546-004-1986-2.<br />
Den Ouden, M., C. Reijmer, V. Pohjola, R. van de Wal, J. Oerlemans and W. Boot. 2010. Standal<strong>on</strong>e<br />
single-frequency gps ice velocity observati<strong>on</strong>s <strong>on</strong> nordenskiöldbreen, svalbard. The<br />
Cryosphere, 4, 593–604.<br />
Harris<strong>on</strong>, W., M. Truffer, K. Echelmeyer, D. Pomraning, R. Abnett and K. Ruhkick. 2004. Probing<br />
<strong>the</strong> till beneath black rapids glacier, alaska, usa. J. Glaciol., 50, 608–614.<br />
Hart, J., K. Martinez, R. Ong, A. Riddoch, K. Rose and P. Padhy. 2006. A wireless multi-sensor<br />
subglacial probe: design and preliminary results. J. Glaciol., 52, 389–397.<br />
Sundal, A., A. Shepherd, P. Nienow, E. Hanna, S. Palmer and P. Huybrechts. 2011. Meltinduced<br />
speed-up <strong>of</strong> greenland ice sheet <strong>of</strong>fset by efficient subglacial drainage. Nature,<br />
469, 521–524.<br />
Van de Wal, R., W. Greuell, M. van den Broeke, C. Reijmer and J. Oerlemans. 2005. Surface<br />
mass-balance observati<strong>on</strong>s and <strong>automatic</strong> wea<strong>the</strong>r stati<strong>on</strong> data al<strong>on</strong>g a transect near<br />
kangerlussuaq, west greenland. Ann. Glaciol., 42, 311–316.<br />
Van de Wal, R., W. Boot, M. van den Broeke, C. Smeets, C. Reijmer, J. D<strong>on</strong>ker and J. Oerlemans.<br />
2008. Large and rapid melt-induced velocity changes in <strong>the</strong> ablati<strong>on</strong> z<strong>on</strong>e <strong>of</strong> <strong>the</strong><br />
greenland ice sheet. Science, 321, 111–113.<br />
Van den Broeke, M., C. Smeets and J. Ettema. 2009a. Surface layer climate and turbulent<br />
exchange in <strong>the</strong> ablati<strong>on</strong> z<strong>on</strong>e <strong>of</strong> <strong>the</strong> west greenland ice sheet. Int. J. Climatol., 29(15),<br />
2309–2323.<br />
Zwally, H., W. Abdalati, T. Herring, K. Lars<strong>on</strong>, J. Saba and K. Steffen. 2002. Surface meltinduced<br />
accelerati<strong>on</strong> <strong>of</strong> greenland ice-sheet flow. Science, 297, 218–222.<br />
79
Using <strong>automatic</strong> wea<strong>the</strong>r stati<strong>on</strong> data to quantify<br />
snowmelt<br />
Michiel van den Broeke, Paul Smeets, Carleen Reijmer, Wim Boot<br />
Utrecht University, IMAU<br />
Motivati<strong>on</strong><br />
Snowmelt c<strong>on</strong>stitutes an important part <strong>of</strong> <strong>the</strong> surface energy and mass<br />
balance <strong>of</strong> <strong>the</strong> ice sheets <strong>of</strong> Greenland and Antarctica. In Greenland, <strong>the</strong><br />
entire ice sheet experiences occasi<strong>on</strong>al melt, as indicated by thin, isolated<br />
ice lenses in firn cores drilled at <strong>the</strong> highest part <strong>of</strong> <strong>the</strong> ice sheet and supported<br />
by regi<strong>on</strong>al atmospheric climate models (Ettema et al., 2010). In<br />
Antarctica, melt is limited to <strong>the</strong> coastal areas, but is especially significant<br />
in <strong>the</strong> Antarctic Peninsula, where <strong>the</strong> melt seas<strong>on</strong> may last as l<strong>on</strong>g as three<br />
m<strong>on</strong>ths (Tedesco and M<strong>on</strong>aghan, 2009). On both ice sheets, <strong>the</strong> largest<br />
fracti<strong>on</strong> <strong>of</strong> <strong>the</strong> melt energy is invested in <strong>the</strong> melting <strong>of</strong> snow ra<strong>the</strong>r than<br />
ice. The reas<strong>on</strong> is that <strong>the</strong> Greenland ablati<strong>on</strong> z<strong>on</strong>e is relatively narrow<br />
and c<strong>on</strong>stitutes less than 10% <strong>of</strong> <strong>the</strong> total surface area. In Antarctica,<br />
ablati<strong>on</strong> areas form at locati<strong>on</strong>s where sublimati<strong>on</strong> (not melt!) locally exceeds<br />
snowfall. These so-called blue ice areas c<strong>on</strong>stitute less than 1% <strong>of</strong><br />
<strong>the</strong> total surface area and as a result, nearly all surface melt in Antarctica<br />
is due to snowmelt.<br />
The energy associated with <strong>the</strong> melting <strong>of</strong> glacier ice can be deduced<br />
from surface height changes, obtained from re-<strong>measuring</strong> stakes that are<br />
fixed deep in <strong>the</strong> ice, or m<strong>on</strong>itored c<strong>on</strong>tinuously using s<strong>on</strong>ic height rangers<br />
(Van den Broeke et al., 2011). The c<strong>on</strong>versi<strong>on</strong> from height change to melt<br />
energy is simple, beca<strong>use</strong> glacier ice has a density that is known to within<br />
1% (910 +/- 10 kg m −3 ). A correcti<strong>on</strong> must be made for <strong>the</strong> effect <strong>of</strong> mass<br />
transport by sublimati<strong>on</strong>/depositi<strong>on</strong> (riming), but usually this is a sec<strong>on</strong>d<br />
order effect.<br />
Snow height changes can be measured equally well, but <strong>the</strong> c<strong>on</strong>versi<strong>on</strong><br />
to melt energy is much more problematic. The reas<strong>on</strong> is that, apart from<br />
melting and sublimati<strong>on</strong>/depositi<strong>on</strong>, snow surface height is also influenced<br />
by erosi<strong>on</strong>/depositi<strong>on</strong> <strong>of</strong> blowing snow and densificati<strong>on</strong> <strong>of</strong> snow layers<br />
between <strong>the</strong> anchor point <strong>of</strong> <strong>the</strong> instrument and <strong>the</strong> surface. Even if <strong>on</strong>e<br />
could be certain that melt is <strong>the</strong> <strong>on</strong>ly process affecting local snow height,<br />
<strong>the</strong> height change can <strong>on</strong>ly be c<strong>on</strong>verted to melt energy if <strong>the</strong> density <strong>of</strong><br />
<strong>the</strong> surface snow is known. Surface snow density is hard to measure and,<br />
beca<strong>use</strong> no internati<strong>on</strong>al standard exists for <strong>the</strong> depth to which surface<br />
snow should be sampled, it is an ill-defined quantity anyway.<br />
Not being able to directly observe snowmelt energy c<strong>on</strong>stitutes an important<br />
problem in climate and surface mass balance research, beca<strong>use</strong><br />
(regi<strong>on</strong>al) climate models calculate snowmelt energy (or melted snow mass,<br />
80
which is equivalent), and thus require observed snowmelt energy (or mass)<br />
for model evaluati<strong>on</strong>.<br />
Surface energy balance model<br />
An indirect yet sufficiently accurate way to quantify snowmelt energy is<br />
to <strong>use</strong> a surface energy balance (SEB) model in combinati<strong>on</strong> with data<br />
<strong>of</strong> manned wea<strong>the</strong>r stati<strong>on</strong>s (MWS) or <strong>automatic</strong> wea<strong>the</strong>r stati<strong>on</strong>s (AWS).<br />
The SEB <strong>of</strong> a melting ’skin’ layer <strong>of</strong> snow is given by:<br />
M = SWnet + LWnet + SHF + LHF + Gs<br />
[Wm −2 ]<br />
where M is melt energy, SWnet is absorbed (net) shortwave radiati<strong>on</strong>,<br />
LWnet is net l<strong>on</strong>gwave radiati<strong>on</strong>, SHF and LHF are <strong>the</strong> turbulent fluxes<br />
<strong>of</strong> sensible and latent heat and Gs is <strong>the</strong> subsurface (c<strong>on</strong>ductive) heat<br />
flux, evaluated at <strong>the</strong> surface. All terms are defined positive when directed<br />
towards <strong>the</strong> surface. To calculate Gs, a snow model that simulates<br />
snow temperatures and meltwater percolati<strong>on</strong>/refreezing is required. To<br />
calculate SHF and LHF requires instrument height and surface momentum<br />
roughness (z0) to be known. The scalar roughness lengths for heat<br />
(zh) and moisture (zq) can <strong>the</strong>n be calculated using <strong>the</strong> expressi<strong>on</strong>s <strong>of</strong> Andreas<br />
(1987), with <strong>the</strong> adjustments for rough ice surfaces <strong>of</strong> Smeets and<br />
van den Broeke (2008). If z0 varies significantly in time, its value can<br />
be obtained from two-level measurements <strong>of</strong> wind speed during neutral<br />
c<strong>on</strong>diti<strong>on</strong>s (Van den Broeke et al., 2009).<br />
For a sufficiently accurate determinati<strong>on</strong> <strong>of</strong> <strong>the</strong> SEB comp<strong>on</strong>ents, <strong>the</strong><br />
MWS/AWS measurements should be <strong>of</strong> good quality and with few data<br />
gaps. Especially important is <strong>the</strong> availability <strong>of</strong> a complete series <strong>of</strong> radiati<strong>on</strong><br />
measurements. For <strong>use</strong> <strong>on</strong> AWS, <strong>the</strong> Kipp and Z<strong>on</strong>en CNR1 has proven<br />
to be a good choice; this sensor measures all four radiati<strong>on</strong> comp<strong>on</strong>ents in<br />
a single housing, with sufficient accuracy <strong>on</strong>ce correcti<strong>on</strong>s have been applied<br />
for <strong>the</strong> relatively poor cosine resp<strong>on</strong>se at low sun elevati<strong>on</strong>s. Being<br />
single-domed, <strong>the</strong> shortwave sensors are relatively insensitive to riming<br />
(Van den Broeke et al., 2004). For a more detailed descripti<strong>on</strong> <strong>of</strong> <strong>the</strong> SEB<br />
solving technique and AWS sensors <strong>use</strong>d in Greenland and Antarctica, we<br />
refer to Van den Broeke et al. (2011) and references <strong>the</strong>rein.<br />
Example applicati<strong>on</strong>s<br />
Figure 1 shows two examples <strong>of</strong> <strong>the</strong> seas<strong>on</strong>al cycle <strong>of</strong> SEB comp<strong>on</strong>ents<br />
based <strong>on</strong> multiyear AWS data from Greenland (S9, 67 ◦ 03’ N, 48 ◦ 14’ W,<br />
1520 m asl, data period 1 Sep. 2003 - 31 Jul. 2010) and MWS data from<br />
Antarctica (Neumayer stati<strong>on</strong>, 70 ◦ 39’ S, 8 ◦ 15’ W, 40 m asl, data period 1<br />
Jan. 1995 - 31 Dec. 2007). Note <strong>the</strong> different scales <strong>on</strong> <strong>the</strong> vertical axes.<br />
Using daily-maintained, ventilated and heated radiati<strong>on</strong> sensors, <strong>the</strong> MWS<br />
radiati<strong>on</strong> data quality is clearly superior to that <strong>of</strong> <strong>the</strong> AWS data, and <strong>the</strong><br />
calculated SEB comp<strong>on</strong>ents <strong>the</strong>refore more accurate. Yet, a direct comparis<strong>on</strong><br />
<strong>of</strong> observed and SEB-modelled surface temperature under n<strong>on</strong>melting<br />
c<strong>on</strong>diti<strong>on</strong>s shows that <strong>the</strong> RMSE for <strong>the</strong> AWS in Greenland (0.97 K)<br />
81
Figure 1. Seas<strong>on</strong>al cycle (based <strong>on</strong> m<strong>on</strong>thly means) <strong>of</strong> SEB comp<strong>on</strong>ents at AWS S9<br />
situated <strong>on</strong> <strong>the</strong> Greenland ice sheet (67 ◦ 03’ N, 48 ◦ 14’ W, 1520 m asl, data period 1 Sep.<br />
2003 - 31 Jul. 2010) and Neumayer stati<strong>on</strong> in Antarctica (70 ◦ 39’ S, 8 ◦ 15’ W, 40 m asl, data<br />
period 1 Jan. 1995 - 31 Dec. 2007). Error bars indicate standard deviati<strong>on</strong> <strong>of</strong> <strong>the</strong> m<strong>on</strong>thly<br />
means. Note <strong>the</strong> difference in vertical scales.<br />
is <strong>on</strong>ly marginally larger than for <strong>the</strong> MWS in Antarctica (0.73 K). Note that<br />
at both locati<strong>on</strong>s, <strong>the</strong> net radiati<strong>on</strong> comp<strong>on</strong>ents to a large extent determine<br />
<strong>the</strong> SEB. Melting at <strong>the</strong> Greenland locati<strong>on</strong> lasts 3-4 m<strong>on</strong>ths and<br />
peaks after <strong>the</strong> summer solstice in July, when <strong>the</strong> shortwave reflectivity<br />
(albedo) <strong>of</strong> <strong>the</strong> metamorphosed snow surface is lowest and SWnet as a<br />
result largest. At Neumayer, melt is marginal and peaks around <strong>the</strong> summer<br />
solstice in December and January, <strong>the</strong> m<strong>on</strong>ths with <strong>the</strong> largest SWnet<br />
values. In spite <strong>of</strong> <strong>the</strong> very different climatological c<strong>on</strong>diti<strong>on</strong>s and melt<br />
intensities, <strong>the</strong> SEB model generates realistic melt energy for both locati<strong>on</strong>s<br />
that can be <strong>use</strong>d to evaluate regi<strong>on</strong>al climate models that are applied<br />
to <strong>the</strong> full ice sheets and/or satellite melt detecti<strong>on</strong> products. The great<br />
advantage <strong>of</strong> using an SEB model is that not <strong>on</strong>ly melt energy, but all<br />
individual SEB comp<strong>on</strong>ents are quantified, which is very valuable for <strong>the</strong><br />
evaluati<strong>on</strong> <strong>of</strong> physical processes that determine surface heat exchange in<br />
atmospheric models.<br />
References<br />
Andreas, E.. 1987. A <strong>the</strong>ory for <strong>the</strong> scalar roughness and <strong>the</strong> scalar transfer coefficients over<br />
snow and sea ice. Boundary-Layer Meteorol., 38(1-2), 159–184.<br />
Ettema, J., M. van den Broeke, E. van Meijgaard and W. van de Berg. 2010. Climate <strong>of</strong> <strong>the</strong><br />
greenland ice sheet using a high-resoluti<strong>on</strong> climate model – part 2: Near-surface climate<br />
and energy balance. The Cryosphere, 4, 529–544.<br />
Smeets, C. and M. van den Broeke. 2008. The parameterisati<strong>on</strong> <strong>of</strong> scalar transfer over rough<br />
ice. Boundary-Layer Meteorol., 128, 339–355.<br />
Tedesco, M. and A. M<strong>on</strong>aghan. 2009. An updated antarctic melt record through 2009 and its<br />
linkages to high-latitude and tropical variability. Geophys. Res. Lett., 36(L18502). Doi:<br />
10.1029/2009GL039186.<br />
82
Van den Broeke, M., D. van As, C. Reijmer and R. van de Wal. 2004. Assessing and improving<br />
<strong>the</strong> quality <strong>of</strong> unattended radiati<strong>on</strong> observati<strong>on</strong>s in antarctica. J. Atmos. Oceanic Technol.,<br />
21(9), 1417–1431.<br />
Van den Broeke, M., C. Smeets and J. Ettema. 2009. Surface layer climate and turbulent<br />
exchange in <strong>the</strong> ablati<strong>on</strong> z<strong>on</strong>e <strong>of</strong> <strong>the</strong> west greenland ice sheet. Int. J. Climatol., 29, 2309–<br />
2323. Doi: 10.1002/joc.1815.<br />
Van den Broeke, M., C. Smeets and R. van de Wal. 2011. The seas<strong>on</strong>al cycle and interannual<br />
variability <strong>of</strong> surface energy balance and melt in <strong>the</strong> ablati<strong>on</strong> z<strong>on</strong>e <strong>of</strong> <strong>the</strong> west greenland<br />
ice sheet. The Cryosphere, 5, 377–390.<br />
83
GLACIOCLIM: a glacio-meteorological network<br />
to study <strong>the</strong> ablati<strong>on</strong> processes over <strong>glaciers</strong><br />
and snow covers<br />
Patrick Wagn<strong>on</strong>, Maxime Litt, Jean Emmanuel Sicart and Yves Lejeune<br />
IRD (Institut de Recherche pour le Développement) / LTHE / LGGE<br />
38402 Saint Martin d’Hères Cedex, France<br />
(patrick@lgge.obs.ujf-grenoble.fr)<br />
GLACIOCLIM<br />
Mountain <strong>glaciers</strong> are widely recognized as excellent indicators <strong>of</strong> climate<br />
change over recent centuries. Indeed, glacier mass variati<strong>on</strong>s can be <strong>use</strong>d<br />
to assess climate warming over <strong>the</strong> 20 th Century and possible anthropogenic<br />
influences. For more than 5 decades, <strong>the</strong> CNRS-LGGE 1 has been<br />
<strong>measuring</strong> <strong>the</strong> yearly volume changes <strong>of</strong> several <strong>glaciers</strong> over <strong>the</strong> French<br />
Alps. For almost two decades in <strong>the</strong> tropical Andes and <strong>on</strong>e decade in<br />
Himalaya, <strong>the</strong> IRD 2 has m<strong>on</strong>itored <strong>the</strong> mass balance and energy balance<br />
<strong>of</strong> various selected <strong>glaciers</strong> <strong>of</strong> Bolivia (since 1991), Ecuador (since 1995),<br />
India (since 2002) or Nepal (since 2007). In 2002, both instituti<strong>on</strong>s had<br />
<strong>the</strong> opportunity to join <strong>the</strong>ir efforts and to create an ORE 3 . This led to<br />
<strong>the</strong> project GLACIOCLIM 4 which is supported by IRD and local partners for<br />
its Andean and Asian parts and by CNRS-LGGE, INSU 5 and OSUG 6 for its<br />
Alpine part. An Antarctic part, supported by IPEV 7 has also been included<br />
since 2005 in this ORE in order to provide ground truth for climate models<br />
and remote sensing estimates. The aim <strong>of</strong> GLACIOCLIM is to complete,<br />
homogenize and perpetuate <strong>the</strong> glaciological and meteorogical measurements<br />
c<strong>on</strong>ducted <strong>on</strong> selected <strong>glaciers</strong> or ice sheets representative <strong>of</strong> various<br />
climatological z<strong>on</strong>es. M<strong>on</strong>itoring l<strong>on</strong>g-term trends <strong>of</strong> <strong>glaciers</strong> is <strong>of</strong><br />
general interest for <strong>the</strong> study <strong>of</strong> climate change. By ga<strong>the</strong>ring mass balance<br />
measurements <strong>on</strong> <strong>glaciers</strong> toge<strong>the</strong>r with a meteorological follow-up,<br />
GLACIOCLIM represents a unique framework in <strong>the</strong> world for studying <strong>the</strong><br />
relati<strong>on</strong>ship between <strong>glaciers</strong> and climate or for understanding ablati<strong>on</strong><br />
processes. In this extended abstract, we first describe <strong>the</strong> structure <strong>of</strong> this<br />
observatory and <strong>the</strong>n illustrate its scientific interest through an example<br />
<strong>of</strong> analyze <strong>of</strong> <strong>the</strong> turbulent fluxes over a seas<strong>on</strong>al snow cover in <strong>the</strong> French<br />
Alps.<br />
1 CNRS-LGGE: Centre Nati<strong>on</strong>al de la Recherche Scientifique - Laboratoire de Glaciologie et<br />
de Géophysique de l’Envir<strong>on</strong>nement<br />
2 IRD: Institut de Recherche pour le Développement - UR R032<br />
3 ORE: Observatory <strong>of</strong> Research in Envir<strong>on</strong>ment<br />
4 GLACIOCLIM: <strong>the</strong> GLACIers, an Observatory <strong>of</strong> <strong>the</strong> CLIMate<br />
5 INSU: Institut Nati<strong>on</strong>al des Sciences de l’Univers<br />
6 OSUG: Observatoire des Sciences de l’Univers de Grenoble<br />
7 IPEV: Institut Polaire Paul Emile Victor<br />
84
Figure 1. World map showing <strong>the</strong> locati<strong>on</strong> <strong>of</strong> <strong>the</strong> <strong>glaciers</strong> selected in GLACIOCLIM. Antizana<br />
(Ecuador, inner tropics), Z<strong>on</strong>go (Bolivia, outer tropics), Chhota Shigri (India, Himalaya) and<br />
Mera (Nepal, Himalaya) are m<strong>on</strong>itored by IRD and local partners. Argentière, Saint Sorlin<br />
(and 3 o<strong>the</strong>rs, Mer de Glace, Gébroulaz and Sarennes but <strong>on</strong>ly for glaciological<br />
measurements, French Alps, temperate regi<strong>on</strong>) are m<strong>on</strong>itored by LGGE with <strong>the</strong> support <strong>of</strong><br />
INSU and OSUG. Two sites are selected in Antarctica (polar regi<strong>on</strong>s) thanks to <strong>the</strong> logistical<br />
support <strong>of</strong> IPEV.<br />
Figure 1 shows <strong>the</strong> <strong>glaciers</strong> which are part <strong>of</strong> GLACIOCLIM. These <strong>glaciers</strong><br />
line up al<strong>on</strong>g a virtual climatic meridian from <strong>the</strong> Ecuator to <strong>the</strong> polar regi<strong>on</strong>s<br />
al<strong>on</strong>g which <strong>the</strong> inner and outer tropical, Asian m<strong>on</strong>so<strong>on</strong>, temperate<br />
and polar climates are represented. This observatory includes both l<strong>on</strong>gterm<br />
measurements (listed in Tab. 1) and short-term energy balance field<br />
campaigns, <strong>the</strong> purpose <strong>of</strong> which is to better understand <strong>the</strong> physical link<br />
between melting <strong>of</strong> <strong>glaciers</strong> and meteorological variables. Data are accessible<br />
<strong>on</strong>-line (Link).<br />
Characterizati<strong>on</strong> <strong>of</strong> <strong>the</strong> boundary layer at Col de Porte, French<br />
Alps, and estimati<strong>on</strong> <strong>of</strong> <strong>the</strong> turbulent fluxes.<br />
Energy exchange above snow and ice surfaces is a key issue in <strong>the</strong> understanding<br />
<strong>of</strong> <strong>the</strong> links between melting and climate. Turbulent fluxes<br />
<strong>of</strong> sensible and latent heat play a critical role in this balance. They are<br />
still poorly understood and difficult to measure in stable boundary layers,<br />
typically found above ice or snow surfaces. In <strong>the</strong> springs 2007, 2008<br />
and 2009, meteorological measurements were performed above <strong>the</strong> seas<strong>on</strong>al<br />
snow cover at <strong>the</strong> Col de Porte, French Alps. The objective was to<br />
compute <strong>the</strong> turbulent fluxes from different methods in order to characterize<br />
<strong>the</strong>ir sensibility to data processing, evaluate <strong>the</strong>ir uncertainties, and<br />
understand <strong>the</strong>ir variability regarding to <strong>the</strong> atmospheric forcing. Two ap-<br />
85
Table 1. L<strong>on</strong>g-term measurements performed <strong>on</strong> <strong>glaciers</strong> in <strong>the</strong> framework <strong>of</strong> GLACIOCLIM.<br />
Glaciological measurements Meteorological measurements<br />
(from 1 to 4 times a year, depending<br />
<strong>on</strong> <strong>the</strong> site)<br />
(half-hourly means)<br />
• Ablati<strong>on</strong> (stakes)<br />
• Accumulati<strong>on</strong> (drilling)<br />
• Surface velocity (GPS)<br />
• Thickness variati<strong>on</strong>s (GPS)<br />
• Terminus mapping (GPS)<br />
• Wind speed and directi<strong>on</strong>, incident and<br />
reflected solar radiati<strong>on</strong>s, incoming and<br />
outgoing <strong>the</strong>rmal radiati<strong>on</strong>s, ventilated air<br />
temperature and humidity, precipitati<strong>on</strong><br />
(AWS <strong>on</strong> nearby moraine)<br />
• Daily albedo (terrestrial photographs)<br />
proaches were applied: <strong>the</strong> aerodynamic pr<strong>of</strong>ile and <strong>the</strong> eddy correlati<strong>on</strong><br />
methods. The measurements were performed within 3 meters above <strong>the</strong><br />
snow surface. We <strong>use</strong>d CSAT3 s<strong>on</strong>ic anemometers and LICOR7500 hygrometers<br />
for <strong>the</strong> eddy correlati<strong>on</strong> method, and a temperature and wind<br />
mast for <strong>the</strong> pr<strong>of</strong>ile method. The "Edire" s<strong>of</strong>tware (University <strong>of</strong> Edinburgh)<br />
was <strong>use</strong>d to process <strong>the</strong> eddy correlati<strong>on</strong> data. A specific processing list<br />
was derived for <strong>the</strong> local boundary layer c<strong>on</strong>diti<strong>on</strong>s. We showed that <strong>the</strong><br />
errors related to data processing were mostly due to: <strong>the</strong> spectral correcti<strong>on</strong>s<br />
<strong>of</strong> instrumental limitati<strong>on</strong>s, data filtering and divergences from<br />
<strong>the</strong> <strong>the</strong>oretical assumpti<strong>on</strong>s. A roughness length <strong>of</strong> 10 −1.5 m for wind was<br />
determined using both methods and a roughness length <strong>of</strong> 10 −5.5 m for<br />
temperature was found using <strong>the</strong> aerodynamic method. These values reflect<br />
<strong>the</strong> influence <strong>on</strong> <strong>the</strong> flow <strong>of</strong> roughness elements distinct from <strong>the</strong><br />
snow surface. This is c<strong>on</strong>firmed by a footprint calculati<strong>on</strong>. The two methods<br />
were in rough agreement for <strong>the</strong> estimati<strong>on</strong> <strong>of</strong> <strong>the</strong> turbulent fluxes.<br />
The aerodynamic method indicated slightly higher values in instable and<br />
neutral c<strong>on</strong>diti<strong>on</strong>s. In stable c<strong>on</strong>diti<strong>on</strong>s, <strong>the</strong> eddy correlati<strong>on</strong> method indicated<br />
higher fluxes. This is attributed to energy losses by <strong>the</strong> low frequency<br />
data sampling in <strong>the</strong> aerodynamic method. Calculati<strong>on</strong>s <strong>of</strong> <strong>the</strong> latent<br />
heat flux were perturbed by n<strong>on</strong>-stati<strong>on</strong>ary problems due to sensors<br />
path separati<strong>on</strong> (wind and humidity). The latent heat fluxes derived from<br />
<strong>the</strong> aerodynamic method were not reliable due to <strong>the</strong> difficulty to measure<br />
very small humidity gradients. Measured fluxes were compared with<br />
those calculated by <strong>the</strong> snow model CROCUS. The parameterizati<strong>on</strong> <strong>of</strong> <strong>the</strong><br />
roughness lengths in CROCUS agrees quite well with <strong>the</strong> two measurement<br />
methods. However, <strong>the</strong> model <strong>use</strong>s an empirical c<strong>on</strong>stant exchange coefficient<br />
for very stable c<strong>on</strong>diti<strong>on</strong>s, which overestimate <strong>the</strong> fluxes in <strong>the</strong>se<br />
flow c<strong>on</strong>diti<strong>on</strong>s.<br />
Figure 2 compares <strong>the</strong> turbulent fluxes derived from <strong>the</strong> aerodynamic<br />
bulk method, measured by eddy covariance and simulated by <strong>the</strong> snow<br />
model CROCUS. In neutral c<strong>on</strong>diti<strong>on</strong>s, <strong>the</strong> three methods give similar results,<br />
especially for <strong>the</strong> sensible heat flux. It indicates that <strong>the</strong> <strong>the</strong>oretical<br />
requirements <strong>of</strong> <strong>the</strong> similarity <strong>the</strong>ory are fulfilled in <strong>the</strong> boundary layer.<br />
Larger differences are observed for <strong>the</strong> latent heat flux. This may partly<br />
be due to measurement errors <strong>of</strong> <strong>the</strong> humidity.<br />
In stable c<strong>on</strong>diti<strong>on</strong>s, <strong>the</strong> differences between <strong>the</strong> methods are large.<br />
86
a. b.<br />
c. d.<br />
Figure 2. Turbulent fluxes <strong>of</strong> sensible (higher panels, a and b) and latent (lower panels, c<br />
and d) heat at Col de Porte for four days <strong>of</strong> neutral c<strong>on</strong>diti<strong>on</strong>s (left panels, a and c) and four<br />
days <strong>of</strong> stable c<strong>on</strong>diti<strong>on</strong>s (right panels, b and d). Black line shows <strong>the</strong> CROCUS simulati<strong>on</strong>s,<br />
Grey line shows <strong>the</strong> eddy correlati<strong>on</strong> measurements, and black line + white squares show<br />
<strong>the</strong> bulk aerodynamic method. Dotted line (right Y-axis) shows <strong>the</strong> bulk Richards<strong>on</strong> number.<br />
The eddy covariance fluxes generally are larger than <strong>the</strong> bulk aerodynamic<br />
fluxes. Various reas<strong>on</strong>s can be invoked to explain this result. Turbulence<br />
may not scale to <strong>the</strong> local variables, which means that turbulence generated<br />
at large scales, from surrounding topography for instance, prevails<br />
<strong>on</strong> <strong>the</strong> local sources <strong>of</strong> turbulence. Brief turbulent bursts, measured by<br />
<strong>the</strong> eddy correlati<strong>on</strong> system but not sampled by <strong>the</strong> slow resp<strong>on</strong>se pr<strong>of</strong>ile<br />
sensors, may significantly increase <strong>the</strong> fluxes. The transfer functi<strong>on</strong>s <strong>use</strong>d<br />
in CROCUS do not agree with <strong>the</strong> eddy covariance fluxes.<br />
References<br />
Online data at: http://www-lgge.obs.ujf-grenoble.fr/ServiceObs/index.htm.<br />
87
Ice-mounted masts as platforms for micro-meteorological<br />
measurements <strong>on</strong> <strong>glaciers</strong><br />
Michael Winkler 1 , Rainer Prinz 1 , Lindsey Nichols<strong>on</strong> 1 , Nicolas Cullen 2 , Christophe<br />
Kinnard 3<br />
1 Centre for Climate and Cryosphere, University <strong>of</strong> Innsbruck, Austria<br />
2 Department <strong>of</strong> Geography, University <strong>of</strong> Otago, New Zealand<br />
3 Centro de Estudios Avanzados en Z<strong>on</strong>as Áridas (CEAZA), La Serena, Chile<br />
Introducti<strong>on</strong><br />
Automated measurements <strong>of</strong> meteorological variables <strong>on</strong> <strong>glaciers</strong> are necessary<br />
for surface energy and mass balance studies. Typically, <strong>the</strong> instruments<br />
are mounted <strong>on</strong> tripods that are placed <strong>on</strong> <strong>the</strong> ice without additi<strong>on</strong>al<br />
securing devices (e.g. guy wires). We take <strong>the</strong> opportunity here<br />
to describe an alternative method, that involves using segmented masts<br />
that are drilled vertically into ice or snow covered glacial surfaces (Fig. 1).<br />
The presented system (or a versi<strong>on</strong> <strong>of</strong> it) was tested at <strong>the</strong> following sites:<br />
Kersten Glacier (Kilimanjaro, TZ), Lewis Glacier (Mt. Kenya, KE), Glaciar<br />
Shallap (Cordillera Blanca, PE), Glaciar Cerro Tapado (Coquimbo regi<strong>on</strong>,<br />
CL), Glaciar Guanaco, Glaciar Ortigas, Glaciarete Toro (all 3 sites Atacama<br />
regi<strong>on</strong>, CL), Brewster Glacier (NZ), and at various sites in Greenland.<br />
Ice-mounted segmented mast design<br />
The masts c<strong>on</strong>sist <strong>of</strong> aluminium (or steel) tube segments, each ca. 1 -<br />
1.5 m l<strong>on</strong>g (l in Fig. 1A) with an outer diameter <strong>of</strong> ca. 50 mm and a wall<br />
thickness <strong>of</strong> ca. 4 mm. The segments are c<strong>on</strong>nected to each o<strong>the</strong>r through<br />
ca. 20 - 30 cm tubes with outer diameters equal to <strong>the</strong> inner diameter<br />
<strong>of</strong> <strong>the</strong> segments. They are fixed to both c<strong>on</strong>secutive segments by high<br />
quality countersunk-head screws (Fig. 1B).<br />
The combined mast is put into a hole drilled by an ice auger 1 or steam<br />
drill. The depth <strong>of</strong> <strong>the</strong> bore hole (L in Fig. 1A) very much depends <strong>on</strong> <strong>the</strong><br />
ablati<strong>on</strong> rate between c<strong>on</strong>secutive maintenance visits; at least 1.5 m <strong>of</strong><br />
mast should always be encased by ice. It is valuable to drill a sec<strong>on</strong>d mast<br />
(Fig. 1A) to avoid turning <strong>of</strong> <strong>the</strong> whole stati<strong>on</strong> that can e.g. be ca<strong>use</strong>d by<br />
wind in <strong>the</strong> case that <strong>the</strong> mast is temporarily not frozen into <strong>the</strong> host ice<br />
and to block <strong>the</strong> bottom ends <strong>of</strong> <strong>the</strong> tube with a plug to prevent <strong>the</strong> mast<br />
from sinking into <strong>the</strong> ice under its own weight (Fig. 1C).<br />
If a standard wea<strong>the</strong>r stati<strong>on</strong> tower must be <strong>use</strong>d, <strong>the</strong> uppermost tube<br />
<strong>of</strong> <strong>the</strong> segmented mast can be equipped with a plate <strong>on</strong> top <strong>of</strong> which <strong>the</strong><br />
standard mast can be mounted (Fig. 1E). This has proved to be a stable<br />
structure, but care should be taken c<strong>on</strong>cerning <strong>the</strong> color and size <strong>of</strong> <strong>the</strong><br />
1 48 mm outer diameter masts work e.g. perfectly with 51 mm Kovacs® ice augers.<br />
88
Figure 1. Segmented mast drilled vertical into <strong>the</strong> ice.<br />
89
mounting plate, to minimise <strong>the</strong> influence <strong>of</strong> <strong>the</strong> plate <strong>on</strong> <strong>the</strong> meteorological<br />
measurements made. Additi<strong>on</strong>ally, <strong>the</strong> (single) mast can be braced<br />
with guy wires (Fig. 1D). A good way to fix <strong>the</strong> wires is by drilling holes in<br />
extensi<strong>on</strong> <strong>of</strong> <strong>the</strong> wires, plunging <strong>the</strong> wires into <strong>the</strong> holes and partly filling<br />
<strong>the</strong> holes with water. After <strong>the</strong> water is frozen, <strong>the</strong> wires can be tautened<br />
and <strong>the</strong> holes can be filled up completely. This guy line style was more<br />
successful than guy lines <strong>on</strong> traditi<strong>on</strong>al peg anchors as <strong>the</strong> pegs melt out<br />
and regular visits are needed to tensi<strong>on</strong> <strong>the</strong> wires correctly. Incorrectly<br />
tensi<strong>on</strong>ed guy lines can <strong>of</strong>ten be <strong>the</strong> ca<strong>use</strong> <strong>of</strong> ra<strong>the</strong>r than <strong>the</strong> cure for<br />
stati<strong>on</strong> tilting!<br />
Advantages <strong>of</strong> <strong>the</strong> ice-mounted segmented mast system<br />
1. The mast stays vertical assuring levelled sensors, a necessary requirement<br />
especially for <strong>measuring</strong> radiative fluxes, wind speed and wind<br />
directi<strong>on</strong>. Tilt due to ice flow was never experienced by <strong>the</strong> authors but<br />
could be an issue <strong>on</strong> fast flowing, shallow <strong>glaciers</strong>. Particularly, over<br />
rough and rapidly changing glacier surfaces, tripod masts can become<br />
tilted or even fall over. Correcti<strong>on</strong>s can be made using inclinometers<br />
but uncertainties remain.<br />
2. There is no need for a separate c<strong>on</strong>structi<strong>on</strong> carrying <strong>the</strong> s<strong>on</strong>ic sensor<br />
that measures ablati<strong>on</strong>. When tripod masts are <strong>use</strong>d <strong>the</strong>re always has<br />
to be a separate c<strong>on</strong>structi<strong>on</strong> drilled into <strong>the</strong> ice where <strong>the</strong> s<strong>on</strong>ic ranger<br />
is mounted <strong>on</strong>. In case <strong>the</strong> ice-mounted c<strong>on</strong>structi<strong>on</strong> can be prevented<br />
from melting into <strong>the</strong> ice, it makes a sec<strong>on</strong>d mast superfluous (and also<br />
<strong>the</strong> messy cables between <strong>the</strong> two c<strong>on</strong>structi<strong>on</strong>s).<br />
Three more positive attributes <strong>of</strong> <strong>the</strong> drilled-in mast are that (i) manufacturing<br />
is cheap and easy and can be d<strong>on</strong>e by any skilled craftsmen even<br />
in developing countries, (ii) <strong>the</strong> segmented design allows quick extensi<strong>on</strong><br />
or shortening <strong>of</strong> <strong>the</strong> mast according to accumulati<strong>on</strong> or ablati<strong>on</strong> situati<strong>on</strong>s<br />
without demounting <strong>the</strong> sensors, and (iii) dividing <strong>the</strong> mast’s load (about<br />
12 kg at 6 m length for <strong>the</strong> aluminium c<strong>on</strong>structi<strong>on</strong>) to several field pers<strong>on</strong>al<br />
allows alpine style expediti<strong>on</strong>s that access remote areas by foot to<br />
be carried out.<br />
Restricti<strong>on</strong>s <strong>of</strong> and recommendati<strong>on</strong>s for <strong>the</strong> ice-mounted segmented<br />
mast system<br />
There is <strong>on</strong>ly <strong>on</strong>e disadvantage <strong>of</strong> <strong>the</strong> described system (compared to <strong>the</strong><br />
usage <strong>of</strong> a tripod mast) that directly affects <strong>the</strong> measurement quality. Ablati<strong>on</strong><br />
c<strong>on</strong>tinuously changes <strong>the</strong> height <strong>of</strong> <strong>the</strong> sensors above <strong>the</strong> ice surface,<br />
which means that data from different periods cannot necessarily be<br />
compared to each o<strong>the</strong>r. However, <strong>the</strong> s<strong>on</strong>ic sensor provides height data<br />
for correcti<strong>on</strong>. All <strong>the</strong> o<strong>the</strong>r restricti<strong>on</strong>s menti<strong>on</strong>ed in <strong>the</strong> following are<br />
technical <strong>on</strong>es.<br />
Mast segment c<strong>on</strong>necti<strong>on</strong>s differing from Figure 1B were also tried, with<br />
moderate success. E.g. tubes with threads that can be screwed <strong>on</strong>to each<br />
90
o<strong>the</strong>r turned out to be weak and difficult to handle. The c<strong>on</strong>necti<strong>on</strong> presented<br />
in Figure 1B actually streng<strong>the</strong>ns <strong>the</strong> juncti<strong>on</strong> between two tube<br />
segments. Still, <strong>the</strong>re are also problems with <strong>the</strong> Figure 1B - soluti<strong>on</strong> beca<strong>use</strong><br />
<strong>the</strong> screws can break during opening beca<strong>use</strong> <strong>of</strong> <strong>the</strong> cold and from<br />
corrosi<strong>on</strong>. It is suggested to <strong>use</strong> <strong>on</strong>ly two high quality screws per c<strong>on</strong>necti<strong>on</strong>.<br />
The drilled-in mast <strong>systems</strong> can <strong>on</strong>ly be applied at sites where <strong>the</strong><br />
amount <strong>of</strong> mass turn over and <strong>the</strong> maintenance interval fit toge<strong>the</strong>r, e.g.<br />
at sites with low mass turn over or at frequently visited <strong>glaciers</strong>. A sec<strong>on</strong>d<br />
mast pole (or even a third, see Jarosch et al. "A versatile tower platform for<br />
glacier instrumentati<strong>on</strong>: GPS and Eddy Covariance Measurements" in this<br />
issue) not <strong>on</strong>ly prevents rotati<strong>on</strong> <strong>of</strong> a stati<strong>on</strong> but also gives it more stability<br />
(Fig. 1A). More than <strong>on</strong>e mast can also be helpful <strong>on</strong> highly penitented<br />
glacier surfaces where unpredictable and locally high rates <strong>of</strong> surface lowering<br />
can ca<strong>use</strong> <strong>the</strong> masts to melt out earlier than predicted.<br />
As a rule <strong>of</strong> thumb, <strong>the</strong> wea<strong>the</strong>r stati<strong>on</strong>’s center <strong>of</strong> gravity should never<br />
be more than 3 m above <strong>the</strong> ice surface and <strong>the</strong> mast should always be<br />
deeper in <strong>the</strong> ice than <strong>on</strong>e tube segment length (at least 1.5 m). Guy<br />
wires avoid failures <strong>of</strong> <strong>the</strong> system during str<strong>on</strong>g winds (Fig. 1D), but in<br />
most <strong>of</strong> <strong>the</strong> locati<strong>on</strong>s this mast type has been deployed in <strong>the</strong>se were<br />
not necessary, and instead, at sites that are expected to experience high<br />
winds simply increasing <strong>the</strong> diameter <strong>of</strong> <strong>the</strong> mast is sufficient to resist high<br />
winds.<br />
91
Notes <strong>on</strong> AWS Measurements <strong>on</strong> <strong>the</strong> Kahiltna<br />
Glacier, Central Alaska Range, and a Simple<br />
Floating Temperature Stand Design<br />
Joanna Young 1 , Anth<strong>on</strong>y Arendt 1 and John Hulth 2<br />
1 Geophysical Institute, University <strong>of</strong> Alaska Fairbanks, PO Box 757320, Fairbanks, Alaska<br />
99775-7320, USA.<br />
E-mail: joanna.young@gi.alaska.edu, arendta@gi.alaska.edu<br />
2 Department <strong>of</strong> Ma<strong>the</strong>matical Sciences and Technology, Norwegian University <strong>of</strong> Life Sciences,<br />
PO Box 5003, NO-1432 Ås, Norway.<br />
E-mail: john.hulth@umb.no<br />
Introducti<strong>on</strong><br />
In <strong>the</strong> Central Alaska Range in Subarctic Alaska, a highly glaciated but<br />
sparsely m<strong>on</strong>itored mountain range, <strong>the</strong> Kahiltna Glacier is <strong>on</strong>e <strong>of</strong> few<br />
<strong>glaciers</strong> with a legacy <strong>of</strong> l<strong>on</strong>g-term observati<strong>on</strong>s. The U.S. Nati<strong>on</strong>al Park<br />
Service has maintained a single index site near <strong>the</strong> equilibrium line altitude<br />
for <strong>the</strong> past 20 years, providing annual measurements <strong>of</strong> net mass<br />
balance at that locati<strong>on</strong> (Mayo, 2001). With <strong>the</strong> goal <strong>of</strong> leveraging <strong>the</strong>se<br />
records, an extended campaign <strong>of</strong> mass balance and meteorological field<br />
measurements forms part <strong>of</strong> a new and <strong>on</strong>going study to model <strong>the</strong> glacierwide<br />
mass balance <strong>of</strong> Kahiltna Glacier. In 2010, in additi<strong>on</strong> to mass balance<br />
measurements, a network <strong>of</strong> floating air temperature and relative<br />
humidity (RH) sensors was installed at five elevati<strong>on</strong>s during <strong>the</strong> melt<br />
seas<strong>on</strong>, and a fixed Automated Wea<strong>the</strong>r Stati<strong>on</strong> (AWS) with snow temperature,<br />
s<strong>on</strong>ic ranger, and air temperature sensors was deployed <strong>on</strong> <strong>the</strong><br />
lower ablati<strong>on</strong> area throughout <strong>the</strong> winter m<strong>on</strong>ths. As <strong>of</strong> June 2011, repeat<br />
measurements <strong>of</strong> air temperature and humidity were again underway, and<br />
an additi<strong>on</strong>al floating tripod AWS was deployed both to better characterize<br />
<strong>the</strong> local climate during <strong>the</strong> melt period, and to c<strong>on</strong>tinuously m<strong>on</strong>itor<br />
surface melt with a linear displacement - or draw-wire - sensor. Although<br />
<strong>the</strong> campaign to date has been quite successful, <strong>the</strong> inherent challenges<br />
<strong>of</strong> working in a glacial envir<strong>on</strong>ment have imparted some <strong>use</strong>ful less<strong>on</strong>s.<br />
In particular, given that characterizing local lapse rates is <strong>of</strong> key importance<br />
to melt modeling, adjustments to <strong>the</strong> design <strong>of</strong> floating temperature<br />
stands will be especially helpful for future work.<br />
Field Site<br />
With a surface area <strong>of</strong> 522 km 2 , a length <strong>of</strong> 70 km, and a range <strong>of</strong> altitudes<br />
between 275 - 6090 m above sea level, <strong>the</strong> Kahiltna Glacier is <strong>the</strong> largest<br />
within <strong>the</strong> Central Alaska Range. It is not characterized as surge-type, as<br />
are many <strong>of</strong> <strong>the</strong> o<strong>the</strong>r <strong>glaciers</strong> in <strong>the</strong> range. It is also <strong>on</strong>e <strong>of</strong> <strong>the</strong> most logistically<br />
accessible <strong>glaciers</strong> in <strong>the</strong> range, as fixed-wing aircraft frequently<br />
92
Figure 1. Winter AWS deployed in 2010/2011. Sensors are mounted <strong>on</strong> a fixed mast.<br />
transport climbers to its sou<strong>the</strong>ast fork. Toge<strong>the</strong>r with <strong>the</strong> l<strong>on</strong>g-term Nati<strong>on</strong>al<br />
Park Service mass balance site record, <strong>the</strong>se characteristics - a wide<br />
range <strong>of</strong> altitudes, n<strong>on</strong>-surge-type behaviour, and relative ease <strong>of</strong> access<br />
- make <strong>the</strong> Kahiltna Glacier an ideal locati<strong>on</strong> for expanding existing measurements<br />
in order to rec<strong>on</strong>struct glacier-wide mass balance.<br />
Measurements and Different AWS C<strong>on</strong>figurati<strong>on</strong>s<br />
To characterize temperature gradients <strong>on</strong> <strong>the</strong> glacier, five air temperature/RH<br />
sensors were installed in 2010 <strong>on</strong> <strong>the</strong> ablati<strong>on</strong> area centerline<br />
between 880 - 1440 m in elevati<strong>on</strong>, affixed to mass balance stakes.<br />
The fixed AWS installed for winter 2010/2011 (Fig. 1) was positi<strong>on</strong>ed at<br />
62 ◦ 45’35.30" N and 151 ◦ 18’26.51" E, at 1280 m elevati<strong>on</strong>. On a 1" aluminum<br />
mast drilled 3 m into <strong>the</strong> ice surface, three resistance <strong>the</strong>rmometers<br />
were affixed at 0.15 m, 0.50 m and 0.85 m above <strong>the</strong> ice surface<br />
to measure snow temperatures. On a horiz<strong>on</strong>tal cross-arm, a low-cost<br />
93
Figure 2. Summer AWS deployed in spring 2011. Sensors are mounted <strong>on</strong> a floating<br />
tetrahedr<strong>on</strong> frame, which accommodates <strong>the</strong> draw-wire sensor.<br />
custom-built s<strong>on</strong>ic ranger measured snow accumulati<strong>on</strong> rates. Air temperature<br />
and relative humidity were also recorded.<br />
The 2011 summer AWS (Fig. 2), deployed at <strong>the</strong> same locati<strong>on</strong>, is a<br />
floating tetrahedr<strong>on</strong> frame designed especially to accommodate a drawwire<br />
sensor. The draw-wire has been drilled and frozen into <strong>the</strong> ice, and<br />
delivers a linear displacement measurement as <strong>the</strong> wire recoils. This enables<br />
c<strong>on</strong>tinuous m<strong>on</strong>itoring <strong>of</strong> glacier melt at high precisi<strong>on</strong> and temporal<br />
resoluti<strong>on</strong> (Hulth, 2010). O<strong>the</strong>r measurements include incoming and<br />
reflected shortwave radiati<strong>on</strong>, wind speed and directi<strong>on</strong>, air temperature<br />
and humidity, and two-axis tilt. Data is telemetered via satellite, using a<br />
SolarStream wireless data transmitter.<br />
Floating Temperature Sensors<br />
In order to accurately determine local lapse rates, air temperature measurements<br />
were made at five different elevati<strong>on</strong>s al<strong>on</strong>g <strong>the</strong> ablati<strong>on</strong> area<br />
centerline. Given that snow/ice surfaces generate str<strong>on</strong>g vertical temperature<br />
gradients, particularly in <strong>the</strong> summer (Oerlemans, 2010), floating<br />
temperature stands were designed to maintain sensors at a c<strong>on</strong>stant<br />
height above <strong>the</strong> glacier surface. In 2010, <strong>the</strong>se stands were built using<br />
1-1/4" PVC sleeves fitted over existing 1" aluminum mass balance stakes;<br />
<strong>the</strong> former was meant to freely slide down <strong>the</strong> latter, as <strong>the</strong> glacier surface<br />
lowered. The stands also had square PVC bases, approximately 30 x 30 cm,<br />
which were intended to minimize melting into <strong>the</strong> snow or ice. Unfortu-<br />
94
Figure 3. Successful floating temperature stand design. Radiati<strong>on</strong> shield is mounted to a<br />
PVC sleeve that is fitted around an existing aluminum ablati<strong>on</strong> stake.<br />
nately, this initial design did not succeed. Ra<strong>the</strong>r than slide down, <strong>the</strong><br />
PVC sleeves became lodged <strong>on</strong> <strong>the</strong> aluminum stakes, ei<strong>the</strong>r resulting in<br />
air temperature readings at significant heights above <strong>the</strong> glacier surface,<br />
or in <strong>the</strong> bending or breaking <strong>of</strong> <strong>the</strong> aluminum stakes under <strong>the</strong> top-heavy<br />
weight <strong>of</strong> <strong>the</strong> sensors and stands.<br />
Though <strong>the</strong> exact reas<strong>on</strong> <strong>of</strong> <strong>the</strong> failure is unknown (i.e. whe<strong>the</strong>r <strong>the</strong><br />
sensors became lodged due to mechanical fricti<strong>on</strong>, or due to ice between<br />
<strong>the</strong> PVC and aluminum), two key adjustments were made to <strong>the</strong> design<br />
when re-installing <strong>the</strong> sensors in 2011. First, a 1-1/2" PVC sleeve was <strong>use</strong>d<br />
in place <strong>of</strong> <strong>the</strong> smaller variety, to allow significantly more room for <strong>the</strong>r-<br />
95
mal expansi<strong>on</strong> <strong>of</strong> both <strong>the</strong> PVC and aluminum in summer temperatures.<br />
Sec<strong>on</strong>d, <strong>the</strong> PVC base was completely omitted <strong>on</strong> <strong>the</strong> sec<strong>on</strong>d design. It<br />
is thought that <strong>the</strong> base may have c<strong>on</strong>tributed too much weight near <strong>the</strong><br />
bottom <strong>of</strong> <strong>the</strong> stand, effectively forcing a point <strong>of</strong> c<strong>on</strong>tact between <strong>the</strong><br />
PVC and aluminum, <strong>the</strong>reby pinching itself into place if <strong>the</strong> stand leaned<br />
even slightly. Regardless, it seems that simplicity is <strong>the</strong> key to a successful<br />
design in this case. The new stands, pictured in Figure 3, do experience<br />
some melting in, but are currently floating and recording fixed-height air<br />
temperatures effectively at five different elevati<strong>on</strong>s every ten minutes.<br />
It is our experience that a simple, low-cost floating temperature stand<br />
design can be quite effective at capturing fixed-height air temperatures,<br />
easily providing valuable informati<strong>on</strong> for helping determine local lapse<br />
rates for melt modeling purposes.<br />
Acknowledgements<br />
We gratefully acknowledge financial support from <strong>the</strong> Geophysical Institute, Nati<strong>on</strong>al Park<br />
Service George Melendez Wright Fellowship and Inventory & M<strong>on</strong>itoring Funding, and Univer-<br />
sity <strong>of</strong> Alaska Center for Global Change. Indispensable field assistance has been provided<br />
by Michael Loso, Sam Herreid, Andy Aschwanden, Alessio Gusmeroli, Rob Burrows and Guy<br />
Adema.<br />
References<br />
Hulth, J.. 2010. Using a draw-wire sensor to c<strong>on</strong>tinuously m<strong>on</strong>itor glacier melt. J. Glaciol.,<br />
56(199), 922–924.<br />
Mayo, L.. 2001. Manual for m<strong>on</strong>itoring <strong>glaciers</strong> at denali nati<strong>on</strong>al park, alaska, using <strong>the</strong> index<br />
site method. Technical report, Nati<strong>on</strong>al Park Service.<br />
Oerlemans, J.. 2010. The microclimate <strong>of</strong> valley <strong>glaciers</strong>. Igitur, Utrecht Publishing & Archiving<br />
Services. 138. pp.<br />
96