Neal Halfon Presentation - Using the EDI for Transforming
Neal Halfon Presentation - Using the EDI for Transforming
Neal Halfon Presentation - Using the EDI for Transforming

You also want an ePaper? Increase the reach of your titles
YUMPU automatically turns print PDFs into web optimized ePapers that Google loves.
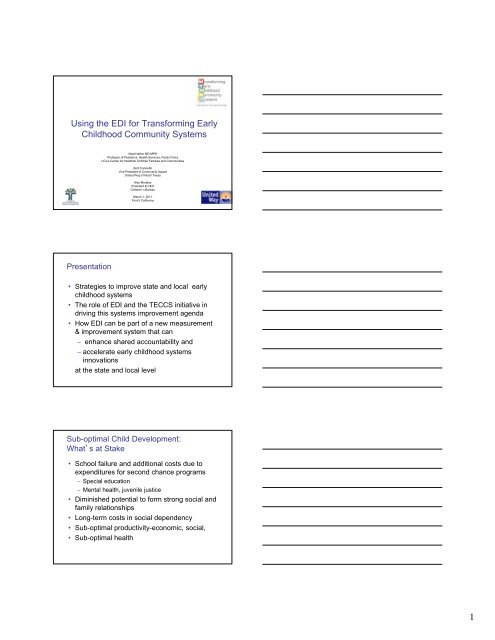
<strong>Using</strong> <strong>the</strong> <strong>EDI</strong> <strong>for</strong> Trans<strong>for</strong>ming Early<br />
Childhood Community Systems<br />
<strong>Presentation</strong><br />
<strong>Neal</strong> <strong>Halfon</strong> MD MPH<br />
Professor of Pediatrics, Health Services, Public Policy<br />
UCLA Center <strong>for</strong> Healthier Children Families and Communities<br />
April Cannetto<br />
Vice President of Community Impact<br />
United Way of North Texas<br />
Alex Morales<br />
President & CEO<br />
Children’s Bureau<br />
March 1, 2011<br />
First 5 Cali<strong>for</strong>nia<br />
• Strategies to improve state and local early<br />
childhood systems<br />
• The role of <strong>EDI</strong> and <strong>the</strong> TECCS initiative in<br />
driving this systems improvement agenda<br />
• How <strong>EDI</strong> can be part of a new measurement<br />
& improvement system that can<br />
enhance shared accountability and<br />
accelerate early childhood systems<br />
innovations<br />
at <strong>the</strong> state and local level<br />
Sub-optimal Child Development:<br />
What’s at Stake<br />
• School failure and additional costs due to<br />
expenditures <strong>for</strong> second chance programs<br />
Special education<br />
Mental health, juvenile justice<br />
• Di Diminished i i h d potential t ti l tto f<strong>for</strong>m strong t social i l and d<br />
family relationships<br />
• Long-term costs in social dependency<br />
• Sub-optimal productivity-economic, social,<br />
• Sub-optimal health<br />
1
learn<br />
Ready to<br />
Birth<br />
Early Infancy<br />
Strategies to Improve<br />
School Readiness Trajectories<br />
Poverty<br />
Late Infancy<br />
Lack of health services<br />
Parent education<br />
Emotional Health<br />
Literacy<br />
Early Toddler<br />
Reading to child<br />
Late Toddler<br />
Toxic Stress<br />
Health Services<br />
Appropriate Discipline<br />
Early Preschool<br />
“Healthy” Trajectory<br />
“At Risk” Trajectory<br />
Pre-school<br />
Late Preschool<br />
6 mo 12 mo 18 mo 24 mo 3 yrs 5 yrs<br />
Optimizing Healthy Development<br />
“Delayed/Disordered ” Trajectory<br />
Addressing <strong>the</strong> factors shaping health development<br />
trajectories over <strong>the</strong> lifespan<br />
Age<br />
The existing ECD service system<br />
• Fragmented service delivery<br />
Different sectors, (health, education,<br />
welfare) funding streams, cultures<br />
Lack of co-ordination - operate in silos<br />
• Diffi Difficulty lt accessing i services i<br />
Demand greater than services available<br />
Narrow programmatic criteria <strong>for</strong> eligibility<br />
Socio-economic factors limit access -<br />
social gradient in treatment and outcomes<br />
Age<br />
2
The existing ECD service system<br />
• Uneven quality<br />
Families have complex needs, often<br />
beyond capability of any single service<br />
Variable understanding of early years<br />
issues<br />
• Model of care is outmoded<br />
focus on treatment ra<strong>the</strong>r than<br />
prevention/early intervention<br />
episodic contact<br />
• Local community limited accountability<br />
or responsibility<br />
Upgrading <strong>the</strong> ECD System<br />
• ECD systems are evolving, enhancing<br />
functionality & per<strong>for</strong>mance<br />
ECD 1.0 is about improving services<br />
within sectors<br />
ECD 2.0 is about connecting sectors into<br />
more effective pathways<br />
ECD 3.0 will be fully integrated systems<br />
• Progress - significant but uneven<br />
• Lots of re-inventing <strong>the</strong> wheel & slow<br />
adoption of innovations<br />
Service Organization<br />
<strong>for</strong> Early Brain and Child Development<br />
PROGRAMS<br />
Influencing Early Brain, Child Development & School Readiness<br />
Pre/perinatal<br />
support<br />
Family<br />
Child Care<br />
Early<br />
Intervention<br />
programs<br />
Child care<br />
centers<br />
Family<br />
Resource Programs<br />
Head Start<br />
Program<br />
Pediatric<br />
services<br />
Mental<br />
Health<br />
services<br />
Preschool<br />
Parenting and Family<br />
Literacy Programs<br />
Child Care<br />
Resource Programs<br />
3
Service Organization<br />
<strong>for</strong> Early Brain and Child Development<br />
Pre/perinatal<br />
support<br />
Child care<br />
centers<br />
PROGRAMS SECTORS<br />
influencing Early Brain, Child Development & School Readiness<br />
Family<br />
Child Care<br />
ECE Programs Health Services<br />
Early<br />
Intervention<br />
programs<br />
Family<br />
Resource Programs<br />
Head Start<br />
Program<br />
Pediatric<br />
services<br />
Family Support<br />
Mental<br />
Health<br />
services<br />
Preschools<br />
Parenting and Family<br />
Literacy Programs<br />
Child Care<br />
Resource Programs<br />
Service Organization<br />
<strong>for</strong> Early Brain and Child Development<br />
SECTORS<br />
influencing Early Brain, Child Development & School Readiness<br />
Child care<br />
centers<br />
ECE Programs Health Services<br />
Family<br />
Child Care<br />
Sector based programs<br />
Common Agenda,<br />
Communications<br />
Shared outcome<br />
Measures, Data Systems<br />
Collaborative Systems<br />
Improvement<br />
Financial and<br />
Policy Alignment<br />
Head Start<br />
Program<br />
Preschool<br />
Family<br />
Resource Programs<br />
Pre/perinatal<br />
support<br />
Family Support<br />
Systems Building: Cross‐sector Linkage and<br />
Integration Strategies<br />
Child Care<br />
Resource Programs<br />
Parenting and Family<br />
Literacy Programs<br />
Early<br />
Pediatric<br />
IIntervention t ti<br />
services<br />
programs<br />
Mental<br />
Health<br />
services<br />
ECE Programs Health Family Support Child Welfare<br />
4
Health Developmeent<br />
Creating a 21 st Century Early<br />
Childhood System<br />
• Vision, goals, place place-base base framework<br />
• Leadership and participation of<br />
multiple sectors ( health, ECE, family support, etc)<br />
Multiple levels ( national, state, city, community)<br />
• Cross sector pathways & innovations<br />
• Evidence Evidence-based based & in<strong>for</strong>med practices<br />
• New integrated finance strategies<br />
• Data that catalyzes systems improvement<br />
and innovation<br />
• Collaborative Improvement<br />
&Trans<strong>for</strong>mation Methods<br />
EC-CS Measurement Design: 3.0<br />
• Measure Development Trajectories<br />
Linked outcomes over time<br />
• Measure Determinants of Outcomes<br />
Availability, quality, per<strong>for</strong>mance of services<br />
Developmental assets<br />
• Measure Disparities<br />
• Progress in Shifting Population Outcome Curves<br />
• Link Individual, Systems, Population measures,<br />
across sectors,<br />
Develop a schema <strong>for</strong> Shared Accountability<br />
• Drive Continuous Improvement, Innovation<br />
Systematic Data Collection<br />
For tracking Health Development Trajectories<br />
Birth<br />
Certificate<br />
Pediatric Early Child<br />
Assessment<br />
Preschool Assessment<br />
<strong>EDI</strong>= Early<br />
Development<br />
Inventory<br />
Birth 1yr 2 ys 3 ys 4 ys<br />
School Readiness<br />
• Physical Wellbeing & motor dev’t<br />
• Social & emotional dev’t<br />
• Approaches to learning<br />
• Language dev’t<br />
• Cognition & general knowledge<br />
5 ys<br />
5
Early<br />
Development<br />
Instrument<br />
•104 items (10-15 min)<br />
•Teacher’s Observation<br />
•5 developmental domains<br />
16 sub-domains<br />
NEGP Concordance<br />
What Does <strong>the</strong> <strong>EDI</strong><br />
Measure?<br />
Why use a population approach?<br />
• The <strong>EDI</strong> delivers essential in<strong>for</strong>mation about<br />
early childhood development <strong>for</strong> all children<br />
in <strong>the</strong> community<br />
• Provides <strong>the</strong> opportunity to identify and<br />
highlight <strong>the</strong> social and environmental<br />
factors that influence child development<br />
throughout childhood<br />
• Moves <strong>the</strong> focus of ef<strong>for</strong>t from <strong>the</strong> individual<br />
to <strong>the</strong> community to make a bigger<br />
difference<br />
• Provides an opportunity to “shift <strong>the</strong> curve”<br />
or future of a whole population and <strong>the</strong>re<strong>for</strong>e<br />
improve outcomes <strong>for</strong> many children<br />
6
Early<br />
Development<br />
Instrument<br />
Extensive Validity and<br />
Reliability data from<br />
several countries<br />
Percent not meeting m<br />
expectattions<br />
% dev vulnerable<br />
v<br />
80.0<br />
70.0<br />
60.0<br />
50.0<br />
40.0<br />
30.0<br />
20.0<br />
10.0<br />
0.0<br />
Individual linkage of <strong>EDI</strong> to<br />
Gr.4 Standardized tests<br />
(<strong>EDI</strong> 2001 – 2004)<br />
Zero One Two Three Four Five<br />
Number of <strong>EDI</strong> vulnerabilities<br />
Results: Socioeconomic status<br />
16<br />
14<br />
12<br />
10<br />
8<br />
6<br />
4<br />
2<br />
0<br />
physical social emotional<br />
A<strong>EDI</strong> Domain<br />
lang/cog comm<br />
Reading<br />
Numeracy<br />
Q1<br />
Q2<br />
Q3<br />
Q4<br />
Q5<br />
7
The <strong>EDI</strong> DOES NOT:<br />
• Score individual children as developmentally<br />
vulnerable or per<strong>for</strong>ming well<br />
• Identify if children have specific learning<br />
disabilities<br />
• Recommend which children should be placed<br />
in special education categories, who should<br />
receive extra classroom assistance, or<br />
whe<strong>the</strong>r children should be held back a grade<br />
• Recommend specific teaching approaches <strong>for</strong><br />
individual children<br />
• Reflect per<strong>for</strong>mance of school or quality of<br />
teaching<br />
Average Score on <strong>the</strong> Social Competence Subscale of <strong>the</strong> <strong>EDI</strong>, 2003<br />
From Hertzman<br />
8
2009 snapshot of Australia’s children:<br />
a developmental census of five year-olds<br />
Nor<strong>the</strong>rn Territory: 3,255<br />
WA WA: 27,579 27 579<br />
SA: 16,208<br />
Tasmania: 5,916<br />
Queensland: 55,449<br />
NSW: 87,168<br />
ACT: 4,432<br />
Victoria: 61,196<br />
Total = 261,203 children (97.5% of estimated population)<br />
9
Trans<strong>for</strong>ming Early Childhood<br />
Community Systems (TECCS)<br />
Health Development<br />
UCLA, UWW, WK Kellogg, Cincinnati Children's Hospital<br />
States, Counties, Communities<br />
Sector based programs<br />
ECE Programs Health F amily Support C hild Welfare<br />
Common LCHD Agenda,<br />
Communications<br />
Share LCHD outcome<br />
Measures, data Systems<br />
C ollaborative Systems<br />
I mprovement<br />
F inancial and Policy<br />
Alignment<br />
Systems Building: Cross‐sector Linkage and<br />
Integration Strategies<br />
Systematic Data Collection<br />
For tracking Health Development Trajectories<br />
Birth<br />
Certificate<br />
Pediatric Early Child<br />
Assessment<br />
Preschool Assessment<br />
<strong>EDI</strong>= Early<br />
Development<br />
Inventory<br />
Birth 1yr 2 ys 3 ys 4 ys<br />
School Readiness<br />
• Physical Wellbeing & motor dev’t<br />
• Social & emotional dev’t<br />
• Approaches to learning<br />
• Language dev’t<br />
• Cognition & general knowledge<br />
5 ys<br />
11
Trans<strong>for</strong>ming Early Childhood<br />
Community Systems (TECCS)<br />
Provide States, Counties, Communities with an<br />
integrated approach to:<br />
Engage communities to achieve school readiness<br />
results<br />
Measure & map school readiness outcomes<br />
Measure & map population determinants of school<br />
readiness<br />
Facilitate targeted, collaborative, multi-sector early<br />
childhood community systems improvement<br />
process<br />
Share learning, lessons, tools, approaches across<br />
communities and sites<br />
Pacoima, Cali<strong>for</strong>nia<br />
12
<strong>EDI</strong> Scores<br />
30%<br />
25%<br />
20%<br />
15%<br />
10%<br />
5%<br />
0%<br />
100%<br />
80%<br />
60%<br />
40%<br />
20%<br />
0%<br />
100%<br />
80%<br />
60%<br />
40%<br />
20%<br />
0%<br />
100%<br />
80%<br />
60%<br />
40%<br />
20%<br />
0%<br />
Communication Gross<br />
Motor<br />
Fine<br />
Motor<br />
Pacoima Community Dashboard<br />
December 15, 2010<br />
Developmental Progress - % of Children Ages 1-4 Years with Developmental Risk<br />
Problem<br />
Solving<br />
Personal-<br />
Social<br />
Socio-Emotional<br />
High Risk Moderate Risk Expected High Risk Expected Moderate Risk<br />
% of 3rd Grade Children Who are Proficient in Reading<br />
Any<br />
Social<br />
Hardship<br />
% Parents Reporting Reading to Their Child Daily % Children Receiving Developmental Screening<br />
Q1 Q2 Q3 Q4 Q1 Q2 Q3 Q4 Q1 Q2<br />
2009 2010 2011<br />
75%<br />
50%<br />
25%<br />
0%<br />
Dangerous<br />
Neighborhood<br />
% Affected by Hardship Area<br />
Any<br />
Health<br />
Hardship<br />
High Risk <strong>for</strong><br />
Depression<br />
Any<br />
Economic<br />
Hardship<br />
Food<br />
Running Out<br />
Any<br />
Parenting<br />
Hardship<br />
% Parents Asked About Developmental Concerns % Parents Discussing Child Care w/ Child's Doctor % Parents Discussing Local Resources <strong>for</strong> Families<br />
Q1 Q2 Q3 Q4 Q1 Q2 Q3 Q4 Q1 Q2<br />
2009 2010 2011<br />
% Parents Asked About Maternal Depression % Parents Asked About Domestic Violence % Parents Asked About Family Stressors<br />
Q1 Q2 Q3 Q4 Q1 Q2 Q3 Q4 Q1 Q2<br />
2009 2010 2011<br />
% of Children Reached<br />
Q1 Q2 Q3 Q4 Q1 Q2 Q3 Q4 Q1 Q2<br />
2009 2010 2011<br />
Q1 Q2 Q3 Q4 Q1 Q2 Q3 Q4 Q1 Q2<br />
2009 2010 2011<br />
Little Control<br />
Over Life<br />
Q1 Q2 Q3 Q4 Q1 Q2 Q3 Q4 Q1 Q2<br />
2009 2010 2011<br />
Q1 Q2 Q3 Q4 Q1 Q2 Q3 Q4 Q1 Q2<br />
2009 2010 2011<br />
Q1 Q2 Q3 Q4 Q1 Q2 Q3 Q4 Q1 Q2<br />
2009 2010 2011<br />
Developmental Trajectory: Progress by<br />
Kindergarten Entry<br />
• Yellow percentages show <strong>the</strong> % of children who are<br />
developmentally vulnerable<br />
• Red percentages show <strong>the</strong> % of children with an Individualized<br />
Education Plan (special education)<br />
Proportion of Kindergarten Children:<br />
Developmentally vulnerable (%)<br />
Has IEP<br />
Area No. Comm Phys Lang Soc Emo 1+ 2+ (%)<br />
Arleta 105 15 10 4 11 13 30 15 10<br />
Pacoima 397 14 9 11 11 10 26 16 7<br />
<strong>EDI</strong> Scores<br />
Developmental<br />
progress ages 1‐<br />
4 years<br />
Measures of<br />
real‐time<br />
improvement<br />
in health and<br />
education<br />
Reach to <strong>the</strong><br />
population<br />
Pacoima Community Dashboard<br />
December 15, 2010<br />
% of 3rd Grade Children Who are Proficient in Reading<br />
% Affected by Hardship Area<br />
Developmental Progress - % of Children Ages 1-4 Years with Developmental Risk<br />
Any<br />
Any<br />
Any<br />
Any<br />
30%<br />
75% Social Health Economic Parenting<br />
Hardship Hardship Hardship Hardship<br />
25%<br />
20%<br />
15%<br />
10%<br />
50%<br />
5%<br />
0%<br />
Problem Personal- Socio-Emotional<br />
Communication Gross<br />
Fine<br />
Solving<br />
Social<br />
25%<br />
Motor<br />
Motor<br />
High Risk Moderate Risk Expected High Risk Expected Moderate Risk<br />
0%<br />
% Parents Reporting Reading to Their Child Daily % Children Receiving Developmental Screening<br />
100%<br />
80%<br />
60%<br />
40%<br />
20%<br />
0%<br />
Q1 Q2 Q3 Q4 Q1 Q2 Q3 Q4 Q1 Q2<br />
Q1 Q2 Q3 Q4 Q1 Q2 Q3 Q4 Q1 Q2<br />
2009 2010 2011<br />
2009 2010 2011<br />
% Parents Asked About Developmental Concerns % Parents Discussing Child Care w/ Child's Doctor % Parents Discussing Local Resources <strong>for</strong> Families<br />
100%<br />
80%<br />
60%<br />
40%<br />
20%<br />
0%<br />
100%<br />
80%<br />
60%<br />
40%<br />
20%<br />
0%<br />
Q1 Q2 Q3 Q4 Q1 Q2 Q3 Q4 Q1 Q2<br />
2009 2010 2011<br />
% Parents Asked About Maternal Depression % Parents Asked About Domestic Violence % Parents Asked About Family Stressors<br />
Q1 Q2 Q3 Q4 Q1 Q2 Q3 Q4 Q1 Q2<br />
2009 2010 2011<br />
% of Children Reached<br />
Q1 Q2 Q3 Q4 Q1 Q2 Q3 Q4 Q1 Q2<br />
2009 2010 2011<br />
Q1 Q2 Q3 Q4 Q1 Q2 Q3 Q4 Q1 Q2<br />
2009 2010 2011<br />
Dangerous<br />
Neighborhood<br />
High Risk <strong>for</strong><br />
Depression<br />
Food<br />
Running Out<br />
Little Control<br />
Over Life<br />
Q1 Q2 Q3 Q4 Q1 Q2 Q3 Q4 Q1 Q2<br />
2009 2010 2011<br />
Q1 Q2 Q3 Q4 Q1 Q2 Q3 Q4 Q1 Q2<br />
2009 2010 2011<br />
Third grade<br />
reading<br />
41<br />
Social<br />
determinants/<br />
hardships<br />
13
<strong>Using</strong> <strong>the</strong> <strong>EDI</strong> to Optimize an Early<br />
Childhood System of Services and<br />
Supports<br />
The Magnolia Place Community Initiative<br />
Alex Morales<br />
WHAT WE HOPE & DREAM…<br />
The 35,000 children living in <strong>the</strong><br />
neighborhoods within <strong>the</strong> 5 square<br />
mile/500 blocks of <strong>the</strong> Magnolia<br />
Catchment Area, Area will break all records of<br />
success in <strong>the</strong>ir education, health and <strong>the</strong><br />
quality of nurturing care <strong>the</strong>y receive from<br />
<strong>the</strong>ir families and community.<br />
Magnolia Place Community Initiative<br />
Catchment Area<br />
Zip codes 90007, 90006, 90015, 90011<br />
14
A strategic plan identified four recognized<br />
goals as having <strong>the</strong> most impact in achieving<br />
long term outcomes <strong>for</strong> children ages 0-5<br />
yyears.<br />
1. Family functioning (safety and nurturing)<br />
2. Health and well-being<br />
3. School-readiness<br />
4. Economic stability<br />
Theory of Change<br />
Points of Intervention<br />
Social Networks<br />
IIndividual di id l RRelationship l ti hi<br />
s<br />
s<br />
Risk and Protective<br />
Factors<br />
Development facilitated by<br />
Patricia Bowie and Cheryl Wold<br />
in partnership with The<br />
Children’s Council, The<br />
Magnolia Place Network and<br />
First 5 LA<br />
Community Societal<br />
Organizational and<br />
Social Networks<br />
15
• Each Network member agency or individual contributes to<br />
<strong>the</strong> vision and mission by using <strong>the</strong>ir own resources.<br />
• The partners work to align <strong>the</strong>ir own activities within <strong>the</strong><br />
500 blocks towards <strong>the</strong> Initiative’s mission and strategies<br />
through cooperation, coordination and collaboration.<br />
• Network members <strong>for</strong>m subsets of partnerships to<br />
accomplish specific project initiatives<br />
• The Network explicitly encourages and nurtures<br />
innovations that could be scaled<br />
• For example, serving as <strong>the</strong> site <strong>for</strong> testing co-location and<br />
an integrated services strategy among multiple county<br />
departments, in partnership with <strong>the</strong> Los Angeles County<br />
Chief Executive Office<br />
Goal<br />
100% of children succeed in<br />
health and education<br />
Magnolia Community Dashboard<br />
15 January 2011<br />
Proportion of Kindergarten Children:<br />
% of 3rd Grade Children Who are Proficient in Reading<br />
Developmentally vulnerable (%)<br />
Has IEP<br />
Area No. Comm Phys Lang Soc Emo 1+ 2+ (%)<br />
Northwest 137 12 10 17 17 7 30 18 7<br />
"Children with parent
How <strong>the</strong> <strong>EDI</strong> Supports Our Community<br />
Engagement Strategy<br />
Community Survey Community Dialogues Mapping Local Neighborhoods<br />
Introducing <strong>EDI</strong> Results<br />
Mapping Our Neighborhoods<br />
Creating a Community Data<br />
Dashboard<br />
• Shows how well a community system of services and<br />
supports is helping young children develop and thrive<br />
• Portrays data in ways that increase understanding and<br />
encourage action<br />
• Describes experiences and outcomes that represent all<br />
young children<br />
• Shows data in real time<br />
54<br />
55<br />
17
Community Data Dashboard<br />
Developmental<br />
progress at<br />
school entry (<strong>EDI</strong>)<br />
Protective factors<br />
<strong>for</strong> families<br />
Parent activities<br />
with children 0‐5<br />
% of children 0‐5<br />
who are reached<br />
by network<br />
improvements<br />
Magnolia Community Dashboard<br />
15 January 2011<br />
Proportion of Kindergarten Children:<br />
% of 3rd Grade Children Who are Proficient in Reading<br />
Developmentally vulnerable (%)<br />
Has IEP<br />
Phys Lang Soc Emo 1+ 2+ (%)<br />
Area No. Comm<br />
Northwest 137 12 10 17 17 7 30 18 7<br />
"Children with parent
Our Community<br />
• Population: 101,314<br />
• School district (WFISD): 27 campuses<br />
• Kindergarten population (1,164)<br />
• Major industry: Manufacturing<br />
• Educational achievement: 20% of adults over 25 do<br />
not have HS diploma; 47% among <strong>the</strong> Latino<br />
population<br />
• Income data: 65% free and reduced lunch<br />
Why Was <strong>the</strong> <strong>EDI</strong> Important to Our<br />
Community?<br />
• History of fragmented Early Childhood community<br />
Apathy; lack of horizontal alignment; no central<br />
organizational ef<strong>for</strong>t<br />
• We want to be smarter about how to impact school<br />
readiness<br />
Targeted; visual; compare across communities and<br />
neighborhoods<br />
• It promotes SHARED accountability <strong>for</strong> school<br />
readiness<br />
Community accountability: parents, institutions,<br />
neighborhoods and communities<br />
Allows us to track progress over time in populations<br />
• It will help us mobilize <strong>the</strong> community to improve school<br />
di<br />
How Does It Help Us Mobilize?<br />
• Align institutional, neighborhood and community level to<br />
vulnerabilities<br />
Institutional<br />
• QRIS (home and centers in neighborhood); rofessional<br />
development (emergent literacy); Public schools<br />
(storytelling program <strong>for</strong> parents); Language facilitator<br />
(home; center and public school); Corporations in<br />
neighborhood (volunteer reading program)<br />
Neighborhoods<br />
• Discover, connect and mobilize neighborhood assets to<br />
improve school readiness<br />
• Community/parent cafes specific to vulnerabilities; Asset<br />
mapping (in<strong>for</strong>mal child care providers)<br />
Community<br />
• Social marketing campaigns; Parent engagement (Live N’<br />
Learn)Advocacy (resident advocacy council)<br />
59<br />
61<br />
19
The <strong>EDI</strong> in Wichita Falls<br />
• Implemented in 2009-2010 school year<br />
• 100% Kindergarten campuses participated (16)<br />
• 1,164 <strong>EDI</strong>’s were collected (79% of population were valid)<br />
• Data was mapped to 28 neighborhoods<br />
Defined by community residents<br />
Strategies <strong>for</strong> Success:<br />
Early Childhood systems focus began one year prior to<br />
implementation<br />
Key stakeholders were partners in <strong>the</strong> Early Childhood<br />
Education Council<br />
District staff, child care, licensing, Head Start, ESC<br />
The <strong>EDI</strong> in Wichita Falls<br />
• Effective communication with Council on <strong>EDI</strong> benefits<br />
and <strong>EDI</strong>’s purpose as school readiness mobilization tool<br />
not student assessments<br />
• Strong relationship with superintendent’s office and<br />
teachers (focused RD on teachers and principals)<br />
• Promised continued partnerships with teachers<br />
• Developed relationship with <strong>the</strong> gatekeeper to <strong>the</strong><br />
teachers: K-2 Curriculum specialist<br />
• Individual and group meetings by campus<br />
• Never addressed “option” of participation<br />
• Coordinated with principals to use campus development<br />
day <strong>for</strong> training and data entry of students<br />
• Key district staff responsible <strong>for</strong> oversight of continuing<br />
data entry<br />
63<br />
Preparation <strong>for</strong> use of <strong>EDI</strong> data<br />
• Developing and implementing plans <strong>for</strong> community, institutional<br />
and neighborhood systems change<br />
• Prior to <strong>EDI</strong> implementation:<br />
• No institutional ECE focus: No focus on quality ECE outside<br />
of federal/state funded programs; minimal collaboration,<br />
minimal birth to three focus<br />
• No neighborhood g mobilization work<br />
• No community wide ef<strong>for</strong>ts: No CCRR, no resources or<br />
materials <strong>for</strong> parents, no parent education programs, no<br />
social marketing<br />
Developed frameworks <strong>for</strong> quality ECE and <strong>for</strong> community<br />
mobilizing<br />
<strong>EDI</strong> provided a tangible product to generate buy-in: Expanded<br />
momentum<br />
Procured funds <strong>for</strong> frameworks: Align with <strong>EDI</strong> when data is<br />
64<br />
available<br />
62<br />
20
Preparation <strong>for</strong> Use of <strong>EDI</strong> Data<br />
Mobilization Model<br />
65<br />
66<br />
67<br />
21
The Institutions<br />
Government<br />
(HA, CDGB, County)<br />
Higher Education<br />
(Professional Development) Volunteer<br />
ECE<br />
Providers<br />
Advocate<br />
Fund<br />
Ali Align<br />
Institutional Mobilization In Action<br />
Small Business/Corporations<br />
(Hospitals, neighborhood<br />
business, media)<br />
Non-Profits<br />
(Social services, advocacy, arts, civic)<br />
• Discuss vulnerabilities and how to align program<br />
components in <strong>the</strong> institutions around <strong>the</strong> data<br />
• Targeting QRIS in pilot neighborhoods<br />
• Developing professional development specific to <strong>EDI</strong><br />
vulnerabilities (neighborhood providers and community<br />
level vulnerabilities)<br />
• Media kicking-off one year health campaign: will target<br />
segments to early childhood, neighborhood mobilizing<br />
• Submitted collaborative federal grant <strong>for</strong> pilot neighborhood<br />
to align housing authority, Even Start, childcare and<br />
work<strong>for</strong>ce development<br />
• Submitted comprehensive systems change grant using <strong>EDI</strong><br />
data<br />
Community Mobilization In Action<br />
• Developing media and outreach campaign aligned with<br />
<strong>EDI</strong> and windows of opportunity<br />
2-1-1<br />
• Developed Live N’ Learn program<br />
Parent and child literacy engagement through daily<br />
activities<br />
68<br />
69<br />
70<br />
22
Neighborhood Mobilization In Action<br />
• 2 pilot neighborhoods (targeted to <strong>the</strong> <strong>EDI</strong>)<br />
• Neighborhood meetings with schools, teachers,<br />
childcare providers, Head Start, Pre-K, residents,<br />
parents, associations: Identifying connector parents<br />
• Aligning Parent Cafes with <strong>EDI</strong> (Streng<strong>the</strong>ning Families<br />
focused)<br />
• Hiring community organizer<br />
• Residents are developing strategy <strong>for</strong> asset mapping<br />
(finding in<strong>for</strong>mal childcare providers)<br />
• Prosperity Hub opening (vacant property)<br />
• Book drives<br />
What’s Next<br />
• Compile a school readiness population level report card<br />
with yearly indicators<br />
• Expand <strong>the</strong> <strong>EDI</strong> to 6 additional schools in neighboring<br />
school districts<br />
• Fully implement <strong>the</strong> community, institutional and<br />
neighborhood frameworks and procure funds <strong>for</strong> pilots<br />
and scaling<br />
• Overlay additional data with <strong>EDI</strong>: 2-1-1; TPRI<br />
Conclusions about <strong>the</strong> <strong>EDI</strong><br />
• A valid, reliable tool <strong>for</strong> measuring school<br />
readiness<br />
Looking Forward – challenges facing children in<br />
school<br />
Backward – quality and content of early<br />
experience<br />
• An extensive per<strong>for</strong>mance record,<br />
• Becoming widely used<br />
• Anchors a powerful measurement and<br />
systems improvement tool kit<br />
71<br />
72<br />
23
Conclusions about <strong>the</strong> <strong>EDI</strong><br />
• The <strong>EDI</strong> Toolkit is easily implementable –<br />
Responding to <strong>the</strong> urgency of crisis we face<br />
Can be used to unleash <strong>the</strong> power of communities<br />
to improve early childhood system<br />
• <strong>EDI</strong> can be linked to future academic<br />
per<strong>for</strong>mance assessment to monitor trends<br />
and track outcomes <strong>for</strong> cohorts of children<br />
• Provides strategic in<strong>for</strong>mation to support<br />
early intervention and a range of educational<br />
innovations<br />
TECCS<br />
• Prototype of a ECD Community Improvement<br />
System<br />
• Built on a Collaborative Systems<br />
Improvement Plat<strong>for</strong>m<br />
• Designed to Catalyze Innovation and<br />
Accelerate Rapid Improvement<br />
• Designed to Align and Engage Multiple<br />
Stakeholders, Across Sectors in Pursuit of<br />
Common Outcomes and Goals<br />
Questions ?<br />
For copies of <strong>the</strong> slides or more<br />
in<strong>for</strong>mation<br />
www.healthychild.ucla.edu<br />
24