Discussion Paper - Mutual Learning Programme
Discussion Paper - Mutual Learning Programme
Discussion Paper - Mutual Learning Programme

Create successful ePaper yourself
Turn your PDF publications into a flip-book with our unique Google optimized e-Paper software.
DISCUSSION PAPER<br />
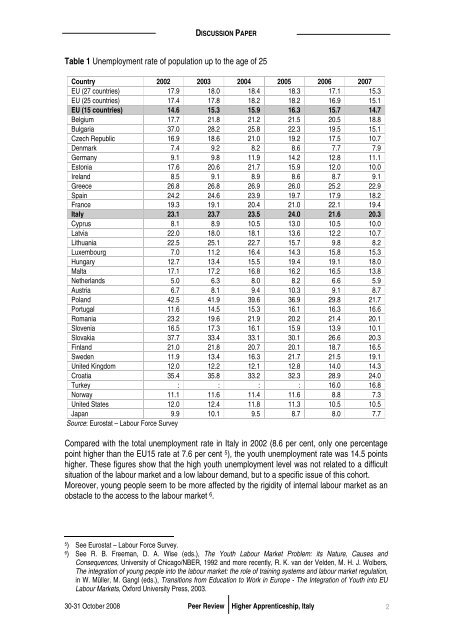
Table 1 Unemployment rate of population up to the age of 25<br />
Country 2002 2003 2004 2005 2006 2007<br />
EU (27 countries) 17.9 18.0 18.4 18.3 17.1 15.3<br />
EU (25 countries) 17.4 17.8 18.2 18.2 16.9 15.1<br />
EU (15 countries) 14.6 15.3 15.9 16.3 15.7 14.7<br />
Belgium 17.7 21.8 21.2 21.5 20.5 18.8<br />
Bulgaria 37.0 28.2 25.8 22.3 19.5 15.1<br />
Czech Republic 16.9 18.6 21.0 19.2 17.5 10.7<br />
Denmark 7.4 9.2 8.2 8.6 7.7 7.9<br />
Germany 9.1 9.8 11.9 14.2 12.8 11.1<br />
Estonia 17.6 20.6 21.7 15.9 12.0 10.0<br />
Ireland 8.5 9.1 8.9 8.6 8.7 9.1<br />
Greece 26.8 26.8 26.9 26.0 25.2 22.9<br />
Spain 24.2 24.6 23.9 19.7 17.9 18.2<br />
France 19.3 19.1 20.4 21.0 22.1 19.4<br />
Italy 23.1 23.7 23.5 24.0 21.6 20.3<br />
Cyprus 8.1 8.9 10.5 13.0 10.5 10.0<br />
Latvia 22.0 18.0 18.1 13.6 12.2 10.7<br />
Lithuania 22.5 25.1 22.7 15.7 9.8 8.2<br />
Luxembourg 7.0 11.2 16.4 14.3 15.8 15.3<br />
Hungary 12.7 13.4 15.5 19.4 19.1 18.0<br />
Malta 17.1 17.2 16.8 16.2 16.5 13.8<br />
Netherlands 5.0 6.3 8.0 8.2 6.6 5.9<br />
Austria 6.7 8.1 9.4 10.3 9.1 8.7<br />
Poland 42.5 41.9 39.6 36.9 29.8 21.7<br />
Portugal 11.6 14.5 15.3 16.1 16.3 16.6<br />
Romania 23.2 19.6 21.9 20.2 21.4 20.1<br />
Slovenia 16.5 17.3 16.1 15.9 13.9 10.1<br />
Slovakia 37.7 33.4 33.1 30.1 26.6 20.3<br />
Finland 21.0 21.8 20.7 20.1 18.7 16.5<br />
Sweden 11.9 13.4 16.3 21.7 21.5 19.1<br />
United Kingdom 12.0 12.2 12.1 12.8 14.0 14.3<br />
Croatia 35.4 35.8 33.2 32.3 28.9 24.0<br />
Turkey : : : : 16.0 16.8<br />
Norway 11.1 11.6 11.4 11.6 8.8 7.3<br />
United States 12.0 12.4 11.8 11.3 10.5 10.5<br />
Japan 9.9 10.1 9.5 8.7 8.0 7.7<br />
Source: Eurostat – Labour Force Survey<br />
Compared with the total unemployment rate in Italy in 2002 (8.6 per cent, only one percentage<br />
point higher than the EU15 rate at 7.6 per cent 5 ), the youth unemployment rate was 14.5 points<br />
higher. These figures show that the high youth unemployment level was not related to a difficult<br />
situation of the labour market and a low labour demand, but to a specific issue of this cohort.<br />
Moreover, young people seem to be more affected by the rigidity of internal labour market as an<br />
obstacle to the access to the labour market 6 .<br />
5 ) See Eurostat – Labour Force Survey.<br />
6 ) See R. B. Freeman, D. A. Wise (eds.), The Youth Labour Market Problem: its Nature, Causes and<br />
Consequences, University of Chicago/NBER, 1992 and more recently, R. K. van der Velden, M. H. J. Wolbers,<br />
The integration of young people into the labour market: the role of training systems and labour market regulation,<br />
in W. Müller, M. Gangl (eds.), Transitions from Education to Work in Europe - The Integration of Youth into EU<br />
Labour Markets, Oxford University Press, 2003.<br />
30-31 October 2008 Peer Review Higher Apprenticeship, Italy<br />
2