LTE Emulator
LTE Emulator
LTE Emulator

You also want an ePaper? Increase the reach of your titles
YUMPU automatically turns print PDFs into web optimized ePapers that Google loves.
TUCN – Data Transmission Laboratory<br />
- ensures the compilation of a packet filter, converting a high level filtering expression<br />
into a program which can be interpreted by the kernel-level filtering procedures; for more details,<br />
see “Filtering expression syntax” [Wpc];<br />
int pcap_setfilter (pcap_t *p, struct bpf_program *fp)<br />
12<br />
- associates a filter to a capture process – details can be found in [Wpc];<br />
3.2.2. Delay of the intercepted packets and error insertion in these packets<br />
The emulation of the packet-delay is accomplished by the generation of the instantaneous<br />
bit rate; the intercepted data are transferred from the buffer of the input network-card to the<br />
buffer of the output network-card in the rhythm of this instantaneous bit rate. In this way, the<br />
packets delays are generated automatically. This is practically accomplished by generating the<br />
number of bits/TTI at the beginning of each channel coherence time interval; additional details<br />
can be found in paragraph 5.2.2. that deals with the generation of the tables with statistics in the<br />
simulation process. The error-patterns inserted in the intercepted (and filtered) packets are<br />
described by two statistics; one of them contains the number of errors/TTI and the other one, the<br />
effective error-distribution (localization) inside that error packet.<br />
The values taken by the number of bits/TTI and by the number of errors/TTI are jointly<br />
processed by means of a discreet bi-dimensional random variable described by a finite set of “no.<br />
errors/TTI – no. bits/TTI” pairs, which is obtained after processing the initial data provided by<br />
the simulation. A cumulative probability function (cdf), is associated to the above mentioned<br />
pairs, see fig. 3.4.; for details see paragraph 5.2.2.<br />
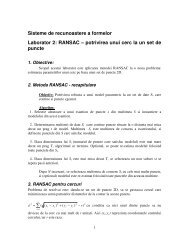
This distribution is represented (stored) using 3 tables, two of them containing the values of<br />
no. errors/TTI and respectively no. bits/TTI, i.e. the previously mentioned pairs; the third table<br />
contains the values of the cumulative distribution function (cdf) associate to these pairs.<br />
bit1 bit2 bit3 bit4 bit5 ...... bitn-1 bitn<br />
err1 err2 err3 err4 err5 ...... errn-1 errn<br />
P1 P2 P3 P4 P5 ...... Pn-1 Pn<br />
bits/TTI<br />
bit errors /TTI<br />
cdf function values<br />
Fig. 3.4. Representation of the bi-dimensional random variable no. errors/TTI – no. bits/TTI.<br />
To generate a pair of random variable according to an imposed probability function the<br />
following steps have to be performed:<br />
o a uniformly distributed variable within the interval [0 , 1] is generated; this could be<br />
accomplished by using a random number generator, e.g. the generator offered by the<br />
programming environment. Then, the generated values are divided by the maxim value<br />
that was be generated;<br />
o the Pa and Pa+1 values of the cdf function which frame the currently generated value of<br />
the uniform random variable are established; the minimum and maximum possible<br />
values of the cdf function, i.e. 0 and 1, may not be stored in the tables;<br />
o the values erra and bita, meaning no. errors/TTI and no. bits/TTI corresponding to value<br />
Pa of the cdf function which lower-bounds the currently generated value of the uniform<br />
random variable, are extracted from the appropriate tables; more details can be found in<br />
[Bot02] [Bot00]. The number of bits/TTI is transformed in number of bytes/TTI for an<br />
easier generation of the instantaneous transfer rate;<br />
The error-patterns generation has to consider not only the number or errors/TTI, but also the<br />
distribution pattern of these errors (the error-localization). For this distribution pattern, a second<br />
statistics which describes the distance between consecutive bit errors is used, more details being<br />
available in paragraph 5.2.2. This statistics is represented by two tables, one containing the