JST Vol. 21 (1) Jan. 2013 - Pertanika Journal - Universiti Putra ...
JST Vol. 21 (1) Jan. 2013 - Pertanika Journal - Universiti Putra ...
JST Vol. 21 (1) Jan. 2013 - Pertanika Journal - Universiti Putra ...

Create successful ePaper yourself
Turn your PDF publications into a flip-book with our unique Google optimized e-Paper software.
Modelling of Motion Resistance Ratios of Pneumatic and Rigid Bicycle Wheels<br />
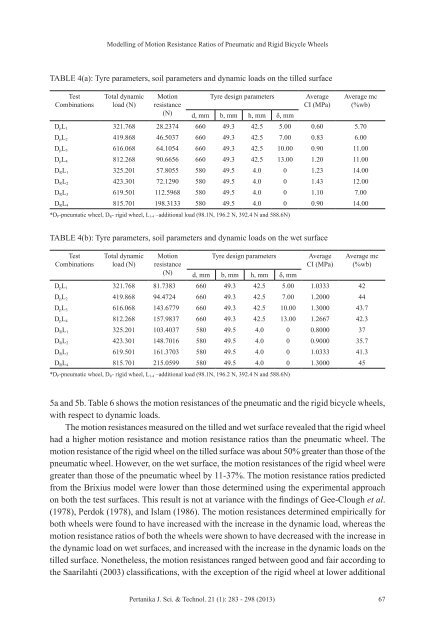
TABLE 4(a): Tyre parameters, soil parameters and dynamic loads on the tilled surface<br />
Test<br />
Combinations<br />
Total dynamic<br />
load (N)<br />
Motion<br />
resistance<br />
(N)<br />
Tyre design parameters Average<br />
CI (MPa)<br />
d, mm b, mm h, mm δ, mm<br />
5a and 5b. Table 6 shows the motion resistances of the pneumatic and the rigid bicycle wheels,<br />
with respect to dynamic loads.<br />
The motion resistances measured on the tilled and wet surface revealed that the rigid wheel<br />
had a higher motion resistance and motion resistance ratios than the pneumatic wheel. The<br />
motion resistance of the rigid wheel on the tilled surface was about 50% greater than those of the<br />
pneumatic wheel. However, on the wet surface, the motion resistances of the rigid wheel were<br />
greater than those of the pneumatic wheel by 11-37%. The motion resistance ratios predicted<br />
from the Brixius model were lower than those determined using the experimental approach<br />
on both the test surfaces. This result is not at variance with the findings of Gee-Clough et al.<br />
(1978), Perdok (1978), and Islam (1986). The motion resistances determined empirically for<br />
both wheels were found to have increased with the increase in the dynamic load, whereas the<br />
motion resistance ratios of both the wheels were shown to have decreased with the increase in<br />
the dynamic load on wet surfaces, and increased with the increase in the dynamic loads on the<br />
tilled surface. Nonetheless, the motion resistances ranged between good and fair according to<br />
the Saarilahti (2003) classifications, with the exception of the rigid wheel at lower additional<br />
<strong>Pertanika</strong> J. Sci. & Technol. <strong>21</strong> (1): 283 - 298 (<strong>2013</strong>)<br />
Average mc<br />
(%wb)<br />
D pL 1 3<strong>21</strong>.768 28.2374 660 49.3 42.5 5.00 0.60 5.70<br />
D pL 2 419.868 46.5037 660 49.3 42.5 7.00 0.83 6.00<br />
D pL 3 616.068 64.1054 660 49.3 42.5 10.00 0.90 11.00<br />
D pL 4 812.268 90.6656 660 49.3 42.5 13.00 1.20 11.00<br />
D RL 1 325.201 57.8055 580 49.5 4.0 0 1.23 14.00<br />
D RL 2 423.301 72.1290 580 49.5 4.0 0 1.43 12.00<br />
D RL 3 619.501 112.5968 580 49.5 4.0 0 1.10 7.00<br />
D RL 4 815.701 198.3133 580 49.5 4.0 0 0.90 14.00<br />
*D P-pneumatic wheel, D R- rigid wheel, L 1-4 –additional load (98.1N, 196.2 N, 392.4 N and 588.6N)<br />
TABLE 4(b): Tyre parameters, soil parameters and dynamic loads on the wet surface<br />
Test<br />
Combinations<br />
Total dynamic<br />
load (N)<br />
Motion<br />
resistance<br />
(N)<br />
Tyre design parameters Average<br />
CI (MPa)<br />
d, mm b, mm h, mm δ, mm<br />
Average mc<br />
(%wb)<br />
D pL 1 3<strong>21</strong>.768 81.7383 660 49.3 42.5 5.00 1.0333 42<br />
D pL 2 419.868 94.4724 660 49.3 42.5 7.00 1.2000 44<br />
D pL 3 616.068 143.6779 660 49.3 42.5 10.00 1.3000 43.7<br />
D pL 4 812.268 157.9837 660 49.3 42.5 13.00 1.2667 42.3<br />
D RL 1 325.201 103.4037 580 49.5 4.0 0 0.8000 37<br />
D RL 2 423.301 148.7016 580 49.5 4.0 0 0.9000 35.7<br />
D RL 3 619.501 161.3703 580 49.5 4.0 0 1.0333 41.3<br />
D RL 4 815.701 <strong>21</strong>5.0599 580 49.5 4.0 0 1.3000 45<br />
*D P-pneumatic wheel, D R- rigid wheel, L 1-4 –additional load (98.1N, 196.2 N, 392.4 N and 588.6N)<br />
67