- Page 2 and 3:
Journal of Science & Technology Jou
- Page 4 and 5:
International Advisory Board Adarsh
- Page 6 and 7:
ut bovine milk allergy by far is th
- Page 8 and 9:
Selected Articles from UPM-Malaysia
- Page 11 and 12:
ISSN: 0128-7680 © 2013 Universiti
- Page 13 and 14:
Aspect of Fatigue Analysis of Compo
- Page 15 and 16:
Aspect of Fatigue Analysis of Compo
- Page 17 and 18:
Aspect of Fatigue Analysis of Compo
- Page 19 and 20:
Aspect of Fatigue Analysis of Compo
- Page 21 and 22:
Aspect of Fatigue Analysis of Compo
- Page 23 and 24:
Aspect of Fatigue Analysis of Compo
- Page 25 and 26:
ISSN: 0128-7680 © 2013 Universiti
- Page 27 and 28:
Application of Anthropometric Dimen
- Page 29 and 30:
Application of Anthropometric Dimen
- Page 31 and 32:
Application of Anthropometric Dimen
- Page 33 and 34:
Application of Anthropometric Dimen
- Page 35 and 36:
Application of Anthropometric Dimen
- Page 37 and 38:
Application of Anthropometric Dimen
- Page 39 and 40:
ISSN: 0128-7680 © 2013 Universiti
- Page 41 and 42:
Different Media Formulation on Bioc
- Page 43 and 44:
Different Media Formulation on Bioc
- Page 45:
Different Media Formulation on Bioc
- Page 48 and 49:
Heng, S. C., Ibrahim, Z. B., Suleim
- Page 50 and 51:
Heng, S. C., Ibrahim, Z. B., Suleim
- Page 52 and 53:
Heng, S. C., Ibrahim, Z. B., Suleim
- Page 54 and 55:
CONCLUSION Heng, S. C., Ibrahim, Z.
- Page 56 and 57:
Y. Yusuf, J. M. Juoi, Z. M. Rosli,
- Page 58 and 59:
Y. Yusuf, J. M. Juoi, Z. M. Rosli,
- Page 60 and 61:
Y. Yusuf, J. M. Juoi, Z. M. Rosli,
- Page 62 and 63:
Surface Roughness Y. Yusuf, J. M. J
- Page 64 and 65:
DISCUSSION Y. Yusuf, J. M. Juoi, Z.
- Page 66 and 67:
Y. Yusuf, J. M. Juoi, Z. M. Rosli,
- Page 69 and 70:
ISSN: 0128-7680 © 2013 Universiti
- Page 71 and 72:
Modelling of Motion Resistance Rati
- Page 73 and 74:
The Empirical Method Modelling of M
- Page 75 and 76:
Modelling of Motion Resistance Rati
- Page 77 and 78:
Modelling of Motion Resistance Rati
- Page 79 and 80:
Modelling of Motion Resistance Rati
- Page 81 and 82:
Modelling of Motion Resistance Rati
- Page 83 and 84:
Modelling of Motion Resistance Rati
- Page 85 and 86:
ISSN: 0128-7680 © 2013 Universiti
- Page 87 and 88:
Assessment of Heavy Metal Pollution
- Page 89 and 90:
TABLE 1: Size of mussels in average
- Page 91 and 92:
Assessment of Heavy Metal Pollution
- Page 93 and 94:
TABLE 5: Heavy metal concentrations
- Page 95 and 96:
Assessment of Heavy Metal Pollution
- Page 97 and 98:
Assessment of Heavy Metal Pollution
- Page 99 and 100:
Assessment of Heavy Metal Pollution
- Page 101 and 102:
Assessment of Heavy Metal Pollution
- Page 103 and 104:
Assessment of Heavy Metal Pollution
- Page 105 and 106:
Assessment of Heavy Metal Pollution
- Page 107 and 108: ISSN: 0128-7680 © 2013 Universiti
- Page 109 and 110: Physico-Chemical and Electrical Pro
- Page 111 and 112: Physico-Chemical and Electrical Pro
- Page 113 and 114: Physico-Chemical and Electrical Pro
- Page 115 and 116: TABLE 1: (continued) Physico-Chemic
- Page 117 and 118: Physico-Chemical and Electrical Pro
- Page 119: Physico-Chemical and Electrical Pro
- Page 122 and 123: Norhashila Hashim et al. effectiven
- Page 124 and 125: Statistical Analysis Norhashila Has
- Page 126 and 127: Norhashila Hashim et al. Post-hoc a
- Page 128 and 129: Norhashila Hashim et al. Cubero, S.
- Page 130 and 131: S. Ismail and K. A. Mohd Atan 4 4 p
- Page 132 and 133: S. Ismail and K. A. Mohd Atan The f
- Page 134 and 135: Lemma 1.1 The equation S. Ismail an
- Page 136 and 137: CONCLUSION S. Ismail and K. A. Mohd
- Page 138 and 139: INTRODUCTION Tajau, R. et al. A hig
- Page 140 and 141: Tajau, R. et al. the acrylate’s c
- Page 142 and 143: Tajau, R. et al. double bond) and C
- Page 144 and 145: Tajau, R. et al. Ulanski, P., & Ros
- Page 146 and 147: Aji, I. S., Zinudin, E. S., Khairul
- Page 148 and 149: Aji, I. S., Zinudin, E. S., Khairul
- Page 150 and 151: CONCLUSION Aji, I. S., Zinudin, E.
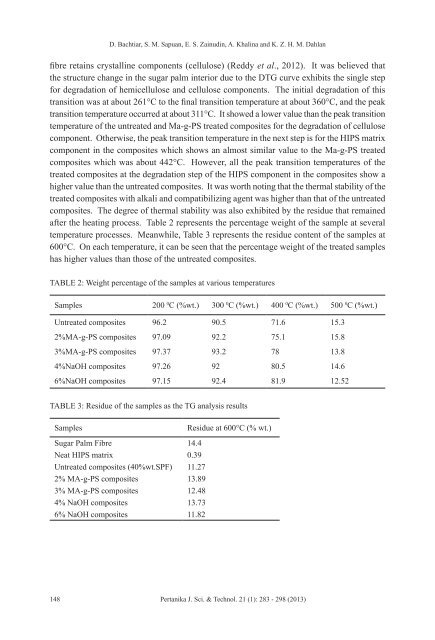
- Page 152 and 153: D. Bachtiar, S. M. Sapuan, E. S. Za
- Page 154 and 155: D. Bachtiar, S. M. Sapuan, E. S. Za
- Page 156 and 157: TABLE 1: (continue) 4 D. Bachtiar,
- Page 160 and 161: D. Bachtiar, S. M. Sapuan, E. S. Za
- Page 162 and 163: N. Maizatul, I. Norazowa, W. M. Z.
- Page 164 and 165: N. Maizatul, I. Norazowa, W. M. Z.
- Page 166 and 167: N. Maizatul, I. Norazowa, W. M. Z.
- Page 168 and 169: REFERENCES N. Maizatul, I. Norazowa
- Page 171 and 172: ISSN: 0128-7680 © 2013 Universiti
- Page 173 and 174: CBIR Using Colour and Shape Fused F
- Page 175 and 176: CBIR Using Colour and Shape Fused F
- Page 177 and 178: CBIR Using Colour and Shape Fused F
- Page 179 and 180: ISSN: 0128-7680 © 2013 Universiti
- Page 181 and 182: Toward Automatic Semantic Annotatin
- Page 183 and 184: Toward Automatic Semantic Annotatin
- Page 185 and 186: Toward Automatic Semantic Annotatin
- Page 187 and 188: Toward Automatic Semantic Annotatin
- Page 189 and 190: Toward Automatic Semantic Annotatin
- Page 191 and 192: Toward Automatic Semantic Annotatin
- Page 193 and 194: ISSN: 0128-7680 © 2013 Universiti
- Page 195 and 196: Issues on Trust Management in Wirel
- Page 197 and 198: Issues on Trust Management in Wirel
- Page 199 and 200: Trust Value MF-ID 1 0.8 0.6 0.4 0.2
- Page 201 and 202: Issues on Trust Management in Wirel
- Page 203 and 204: ISSN: 0128-7680 © 2013 Universiti
- Page 205 and 206: A Negation Query Engine for Complex
- Page 207 and 208: A Negation Query Engine for Complex
- Page 209 and 210:
A Negation Query Engine for Complex
- Page 211 and 212:
A Negation Query Engine for Complex
- Page 213 and 214:
REFERENCES A Negation Query Engine
- Page 215 and 216:
ISSN: 0128-7680 © 2013 Universiti
- Page 217 and 218:
The Problem Association Rule Mining
- Page 219 and 220:
Association Rule Mining threshold t
- Page 221 and 222:
Association Rule Mining must be sor
- Page 223 and 224:
Association Rule Mining On the othe
- Page 225:
Association Rule Mining Quinlan, J.
- Page 228 and 229:
Che Mustapha Yusuf, J., Mohd Su’u
- Page 230 and 231:
Che Mustapha Yusuf, J., Mohd Su’u
- Page 232 and 233:
Che Mustapha Yusuf, J., Mohd Su’u
- Page 234 and 235:
Che Mustapha Yusuf, J., Mohd Su’u
- Page 236 and 237:
Che Mustapha Yusuf, J., Mohd Su’u
- Page 238 and 239:
Az Azrinudin Alidin and Fabio Crest
- Page 240 and 241:
Az Azrinudin Alidin and Fabio Crest
- Page 242 and 243:
Az Azrinudin Alidin and Fabio Crest
- Page 244 and 245:
Az Azrinudin Alidin and Fabio Crest
- Page 246 and 247:
Az Azrinudin Alidin and Fabio Crest
- Page 248 and 249:
Az Azrinudin Alidin and Fabio Crest
- Page 250 and 251:
Yogan Jaya Kumar, Naomie Salim, Ahm
- Page 252 and 253:
Yogan Jaya Kumar, Naomie Salim, Ahm
- Page 254 and 255:
Yogan Jaya Kumar, Naomie Salim, Ahm
- Page 256 and 257:
REFERENCES Yogan Jaya Kumar, Naomie
- Page 258 and 259:
Hasiah Mohamed@Omar, Azizah Jaafar
- Page 260 and 261:
Hasiah Mohamed@Omar, Azizah Jaafar
- Page 262 and 263:
Hasiah Mohamed@Omar, Azizah Jaafar
- Page 264 and 265:
Hasiah Mohamed@Omar, Azizah Jaafar
- Page 266 and 267:
Hasiah Mohamed@Omar, Azizah Jaafar
- Page 268 and 269:
Hasiah Mohamed@Omar, Azizah Jaafar
- Page 271 and 272:
ISSN: 0128-7680 © 2013 Universiti
- Page 273 and 274:
The Role of Similarity Measurement
- Page 275 and 276:
The Role of Similarity Measurement
- Page 277 and 278:
The Role of Similarity Measurement
- Page 279 and 280:
The Role of Similarity Measurement
- Page 281 and 282:
TABLE 5: Winners MRS The Role of Si
- Page 283:
REFEREES FOR THE PERTANIKA JOURNAL
- Page 286 and 287:
Guidelines for Authors Publication
- Page 288 and 289:
table should be prepared on a separ
- Page 290 and 291:
The Journal’s review process What
- Page 293 and 294:
Usability of Educational Computer G