JST Vol. 21 (1) Jan. 2013 - Pertanika Journal - Universiti Putra ...
JST Vol. 21 (1) Jan. 2013 - Pertanika Journal - Universiti Putra ...
JST Vol. 21 (1) Jan. 2013 - Pertanika Journal - Universiti Putra ...

Create successful ePaper yourself
Turn your PDF publications into a flip-book with our unique Google optimized e-Paper software.
<strong>Journal</strong> of Science & Technology <strong>Journal</strong> of Science & Technology <strong>Journal</strong> of Science & Technology<br />
<strong>Journal</strong> of Sciences & Technology<br />
About the <strong>Journal</strong><br />
<strong>Pertanika</strong> is an international peer-reviewed journal devoted to the publication of original papers, and it serves<br />
as a forum for practical approaches to improving quality in issues pertaining to tropical agriculture and its<br />
related fields. <strong>Pertanika</strong> began publication in 1978 as the <strong>Journal</strong> of Tropical Agricultural Science. In 1992,<br />
a decision was made to streamline <strong>Pertanika</strong> into three journals to meet the need for specialised journals in<br />
areas of study aligned with the interdisciplinary strengths of the university. The revamped <strong>Journal</strong> of Science<br />
& Technology (<strong>JST</strong>) aims to develop as a pioneer journal focusing on research in science and engineering,<br />
and its related fields. Other <strong>Pertanika</strong> series include <strong>Journal</strong> of Tropical Agricultural Science (JTAS); and<br />
<strong>Journal</strong> of Social Sciences and Humanities (JSSH).<br />
<strong>JST</strong> is published in English and it is open to authors around the world regardless of the nationality. It is<br />
currently published two times a year, i.e. in <strong>Jan</strong>uary and July.<br />
Goal of <strong>Pertanika</strong><br />
Our goal is to bring the highest quality research to the widest possible audience.<br />
Quality<br />
We aim for excellence, sustained by a responsible and professional approach to journal publishing.<br />
Submissions are guaranteed to receive a decision within 12 weeks. The elapsed time from submission to<br />
publication for the articles averages 5-6 months.<br />
Indexing of <strong>Pertanika</strong><br />
<strong>Pertanika</strong> is now over 33 years old; this accumulated knowledge has resulted in <strong>Pertanika</strong> journals being<br />
indexed in SCOPUS (Elsevier), EBSCO, DOAJ, AGRICOLA, and CABI etc. <strong>JST</strong> is indexed in SCOPUS,<br />
EBSCO, DOAJ, ISC and ERA.<br />
Future vision<br />
We are continuously improving access to our journal archives, content, and research services. We have the<br />
drive to realise exciting new horizons that will benefit not only the academic community, but society itself.<br />
We also have views on the future of our journals. The emergence of the online medium as the predominant<br />
vehicle for the ‘consumption’ and distribution of much academic research will be the ultimate instrument in<br />
the dissemination of research news to our scientists and readers.<br />
Aims and scope<br />
<strong>Pertanika</strong> <strong>Journal</strong> of Science and Technology aims to provide a forum for high quality research related<br />
to science and engineering research. Areas relevant to the scope of the journal include: bioinformatics,<br />
bioscience, biotechnology and biomolecular sciences, chemistry, computer science, ecology, engineering,<br />
engineering design, environmental control and management, mathematics and statistics, medicine and<br />
health sciences, nanotechnology, physics, safety and emergency management, and related fields of study.<br />
Editorial Statement<br />
<strong>Pertanika</strong> is the official journal of <strong>Universiti</strong> <strong>Putra</strong> Malaysia. The abbreviation for <strong>Pertanika</strong> <strong>Journal</strong> of<br />
Science & Technology is <strong>Pertanika</strong> J. Sci. Technol.
Editorial Board<br />
<strong>2013</strong>-2015<br />
Editor-in-Chief<br />
Mohd. Ali HASSAN, Malaysia<br />
Bioprocess engineering, Environmental biotechnology<br />
Chief Executive Editor<br />
Nayan D.S. KANWAL, Malaysia<br />
Environmental issues- landscape plant modelling applications<br />
Editorial Board Members<br />
Abdul Halim Shaari (Professor Dr), Superconductivity and Magnetism, <strong>Universiti</strong> <strong>Putra</strong> Malaysia, Malaysia.<br />
Adem KILICMAN (Professor Dr), Mathematical Sciences, <strong>Universiti</strong> <strong>Putra</strong> Malaysia, Malaysia.<br />
Ahmad Makmom Abdullah (Associate Professor Dr), Ecophysiology and Air Pollution Modelling, <strong>Universiti</strong> <strong>Putra</strong> Malaysia, Malaysia.<br />
Ali A. MOOSAVI-MOVAHEDI (Professor Dr), Biophysical Chemistry, University of Tehran, Tehran, Iran.<br />
Amu THERWATH (Professor Dr), Oncology, Molecular Biology, Université Paris, France.<br />
Angelina CHIN (Professor Dr), Mathematics, Group Theory and Generalisations, Ring Theory, University of Malaya, Malaysia.<br />
Bassim H. HAMEED (Professor Dr), Chemical Engineering: Reaction Engineering, Environmental Catalysis & Adsorption, <strong>Universiti</strong> Sains<br />
Malaysia, Malaysia.<br />
Biswa Mohan BISWAL (Professor Dr), Medical, Clinical Oncology, Radiotherapy, <strong>Universiti</strong> Sains Malaysia, Malaysia.<br />
Christopher G. JESUDASON (Professor Dr), Mathematical Chemistry, Molecular Dynamics Simulations, Thermodynamics and General Physical<br />
Theory, University of Malaya, Malaysia.<br />
Ivan D. RUKHLENKO (Dr), Nonliner Optics, Silicon Photonics, Plasmonics and Nanotechnology, Monash University, Australia.<br />
Kaniraj R. SHENBAGA (Professor Dr), Geotechnical Engineering, <strong>Universiti</strong> Malaysia Sarawak, Malaysia.<br />
Kanury RAO (Professor Dr), Senior Scientist & Head, Immunology Group, International Center for Genetic Engineering and Biotechnology,<br />
Immunology, Infectious Disease Biology and Systems Biology, International Centre for Genetic Engineering & Biotechnology, New Delhi, India.<br />
Karen Ann CROUSE (Professor Dr), Chemistry, Material Chemistry, Metal Complexes – Synthesis, Reactivity, Bioactivity, <strong>Universiti</strong> <strong>Putra</strong><br />
Malaysia, Malaysia.<br />
Ki-Hyung KIM (Professor Dr), Computer and Wireless Sensor Networks, AJOU University, Korea.<br />
Kunnawee KANITPONG (Associate Professor Dr), Transportation Engineering- Road traffic safety, Highway Materials and Construction, Asian<br />
Institute of Technology, Thailand.<br />
Megat Mohamad Hamdan MEGAT AHMAD (Professor Dr), Mechanical and Manufacturing Engineering, <strong>Universiti</strong> Pertahanan Nasional<br />
Malaysia, Malaysia.<br />
Mirnalini KANDIAH (Professor Dr), Public Health Nutrition, Nutritional Epidemiology, <strong>Universiti</strong> Malaysia Perlis (UniMAP), Malaysia.<br />
Mohamed Othman (Professor Dr), Communication Technology and Network, Scientific Computing, <strong>Universiti</strong> <strong>Putra</strong> Malaysia, Malaysia.<br />
Mohd Adzir Mahdi (Professor Dr), Physics, Optical Communications, <strong>Universiti</strong> <strong>Putra</strong> Malaysia, Malaysia.<br />
Mohd Sapuan Salit (Professor Dr), Concurrent Engineering and Composite Materials, <strong>Universiti</strong> <strong>Putra</strong> Malaysia, Malaysia.<br />
Narongrit SOMBATSOMPOP (Professor Dr), Engineering and Technology: Materials and Polymer Research, King Mongkut’s University of<br />
Technology Thonburi (KMUTT), Thailand.<br />
Prakash C. SINHA (Professor Dr), Physical Oceanography, Mathematical Modelling, Fluid Mechanics, Numerical Techniques, <strong>Universiti</strong> Malaysia<br />
Terengganu, Malaysia.<br />
Rajinder SINGH (Dr), Biotechnology, Biomolecular Science, Molecular Markers/ Genetic Mapping, Malaysian Palm Oil Board, Kajang, Malaysia.<br />
Renuganth VARATHARAJOO (Professor Dr-Ing Ir), Engineering, Space System, <strong>Universiti</strong> <strong>Putra</strong> Malaysia, Malaysia.<br />
Riyanto T. BAMBANG (Professor Dr), Electrical Engineering, Control, Intelligent Systems & Robotics, Bandung Institute of Technology,<br />
Indonesia.<br />
Sabira KHATUN (Professor Dr), Engineering, Computer Systems and Software Engineering, Applied Mathematics, <strong>Universiti</strong> Malaysia Pahang,<br />
Malaysia.<br />
Shiv Dutt GUPTA (Dr), Director, IIHMR, Health Management, public health, Epidemiology, Chronic and Non-communicable Diseases, Indian<br />
Institute of Health Management Research, India.<br />
Shoba RANGANATHAN (Professor Dr), UNESCO Chair of Biodiversity Informatics Bioinformatics and Computational Biology, Biodiversity<br />
Informatics, Protein Structure, DNA sequence, Macquarie University, Australia.<br />
Suan-Choo CHEAH (Dr), Biotechnology, Plant Molecular Biology, Asiatic Centre for Genome Technology (ACGT), Kuala Lumpur, Malaysia.<br />
Waqar ASRAR (Professor Dr), Engineering, Computational Fluid Dynamics, Experimental Aerodynamics, International Islamic University,<br />
Malaysia.<br />
Wing-Keong NG (Professor Dr), Aquaculture, Aquatic Animal Nutrition, Aqua feed Technology, <strong>Universiti</strong> Sains Malaysia, Malaysia.<br />
Yudi SAMYUDIA (Professor Dr Ir), Chemical Engineering, Advanced Process Engineering, Curtin University of Technology, Malaysia.
International Advisory Board<br />
Adarsh SANDHU (Professor Dr), Editorial Consultant for Nature Nanotechnology and contributing writer for Nature Photonics, Physics,<br />
Magnetoresistive Semiconducting Magnetic Field Sensors, Nano-Bio-Magnetism, Magnetic Particle Colloids, Point of Care Diagnostics, Medical<br />
Physics, Scanning Hall Probe Microscopy, Synthesis and Application of Graphene, Electronics-Inspired Interdisciplinary Research Institute<br />
(EIIRIS), Toyohashi University of Technology, Japan.<br />
Graham MEGSON (Professor Dr), Computer Science, The University of Westminster, U.K.<br />
Kuan-Chong TING (Professor Dr), Agricultural and Biological Engineering, University of Illinois at Urbana-Champaign, USA.<br />
Malin PREMARATNE (Professor Dr), Advanced Computing and Simulation, Monash University, Australia.<br />
Mohammed Ismail ELNAGGAR (Professor Dr), Electrical Engineering, Ohio State University, USA.<br />
Peter G. ALDERSON (Associate Professor Dr), Bioscience, The University of Nottingham, Malaysia Campus.<br />
Peter J. HEGGS (Emeritus Professor Dr), Chemical Engineering, University of Leeds, U.K.<br />
Ravi PRAKASH (Professor Dr), Vice Chancellor, JUIT, Mechanical Engineering, Machine Design, Biomedical and Materials Science, Jaypee<br />
University of Information Technology, India.<br />
Said S.E.H. ELNASHAIE (Professor Dr), Environmental and Sustainable Engineering, Penn. State University at Harrisburg, USA.<br />
Suhash Chandra DUTTA ROY (Emeritus Professor Dr), Electrical Engineering, Indian Institute of Technology (IIT) Delhi, India.<br />
Vijay ARORA (Professor), Quantum and Nano-Engineering Processes, Wilkes University, USA.<br />
Yi LI (Professor Dr), Chemistry, Photochemical Studies, Organic Compounds, Chemical Engineering, Chinese Academy of Sciences, Beijing,<br />
China.<br />
<strong>Pertanika</strong> Editorial Office<br />
Office of the Deputy Vice Chancellor (R&I), 1st Floor, IDEA Tower II, UPM-MTDC Technology Centre<br />
<strong>Universiti</strong> <strong>Putra</strong> Malaysia, 43400 Serdang, Selangor, Malaysia<br />
Tel: +603 8947 1622<br />
E-mail: executive_editor.pertanika@upm.my<br />
URL: http://www.pertanika.upm.edu.my/editorial_board.htm<br />
Publisher<br />
The UPM Press<br />
<strong>Universiti</strong> <strong>Putra</strong> Malaysia<br />
43400 UPM, Serdang, Selangor, Malaysia<br />
Tel: +603 8946 8855, 8946 8854 • Fax: +603 8941 6172<br />
penerbit@putra.upm.edu.my<br />
URL: http://penerbit.upm.edu.my<br />
The publisher of <strong>Pertanika</strong> will not be responsible for the statements made by the authors in any articles published in the journal. Under no circumstances will the publisher of this<br />
publication be liable for any loss or damage caused by your reliance on the advice, opinion or information obtained either explicitly or implied through the contents of this publication.<br />
All rights of reproduction are reserved in respect of all papers, articles, illustrations, etc., published in <strong>Pertanika</strong>. <strong>Pertanika</strong> provides free access to the full text of research articles<br />
for anyone, web-wide. It does not charge either its authors or author-institution for refereeing/ publishing outgoing articles or user-institution for accessing incoming articles.<br />
No material published in <strong>Pertanika</strong> may be reproduced or stored on microfilm or in electronic, optical or magnetic form without the written authorization of the Publisher.<br />
Copyright © <strong>2013</strong> <strong>Universiti</strong> <strong>Putra</strong> Malaysia Press. All Rights Reserved.
Editorial i<br />
Milk and Its Bioactive Peptides: Phenomenal Nutraceutical Food<br />
of the Century<br />
EXPRESSION OF THOUGHT:<br />
Professor Ali A. Moosavi –Movahedi,<br />
University of Tehran, Iran<br />
We live in a century where everything is observed in<br />
nano size scale and there is a new vision and a new way<br />
of looking at everything that already exits. Scientists<br />
and researchers are very precise in observing<br />
everything and finding new functionalities from the<br />
existing materials. Different side effects have been<br />
reported to result from the uses of synthetic drugs<br />
and food additives, and thus, finding natural drugs<br />
and food additives from natural sources is at the top<br />
of research list in most developed countries. In fact,<br />
we have reached the time where the terms drug and<br />
additives have been replaced with nutraceuticals and<br />
where prevention is more important than treatment.<br />
Unfortunately more than 50% of the people are suffering from diseases such as cardiovascular<br />
disease, bone defects, rheumatoid arthritis, atherosclerosis, cancer, AIDS, Alzheimer, and<br />
diabetes. The first step in reducing the risk of suffering from different diseases is to have a double<br />
check at what we eat every day, i.e. to consider everyday food not only from its nutritional<br />
aspect but also from health and medicinal point of view and to eat food with high antioxidant<br />
agent. Among food that is consumed every day, milk has a high potential in this regard. Milk is a<br />
rich source of dietary protein, which is made of caseins and whey proteins. Its great nutritional<br />
value has made milk an important must-use everyday food for centuries. During the last two<br />
decades, an increasing number of data have shown that milk can play additional functions than<br />
merely energetic and nutritional ones. Milk proteins exert a wide range of biological, nutritional<br />
and functional activities such as chaperon activity and bioactivity of their peptides. It has been<br />
reported that multiple biologically active (bioactive) proteins and peptides can originate from<br />
milk. Bioactive peptides are a great source of natural drugs, which can both prevent and cure<br />
different diseases. These peptides can be produced in vivo during gastrointestinal digestion or<br />
in vitro through food processing using specific enzymes. Milk protein derived peptides have<br />
different functionalities including antioxidant activity, antimicrobial activity and blood pressure–<br />
lowering effect. These peptides have been used in the formulation of other food products for<br />
the production of functional food. Most food products are produced using bovine’s milk proteins
ut bovine milk allergy by far is the most prevalent food allergy, especially in children, and<br />
β-lactoglobulin (β-LG) is considered the dominant bovine milk allergen. Camel milk lacks β-LG<br />
and is enriched with α-Lactalbumin such as human milk. The milk of camel, a high-tech animal<br />
whose antibodies have successfully been used for the treatment of cancer, contains proteins<br />
that can cure hepatitis and diabetes. Thus, the health benefits of camel milk are attributed to<br />
the presence of high concentrations of insulin-like protein and other factors that have positive<br />
effects on immunity. Its composition is closer to human milk compared to bovine’s milk. The<br />
functionality of the bioactive peptides produced from camel milk has been studied both in vitro<br />
and in vivo. The results are phenomenal. The bioactive peptides produced from camel milk open<br />
a new era for the production of healthy additives, nutraceutical components and new products,<br />
in which health and prevention is considered the most important factor in the food industry.<br />
Ali A. Moosavi –Movahedi, PhD<br />
Institute of Biochemistry and Biophysics<br />
University of Tehran, Iran<br />
Telephone: + (98<strong>21</strong>) 6640 3957.<br />
Fax: + (98<strong>21</strong>) 6640 4680.<br />
moosavi@ibb.ut.ac<br />
www.ibb.ut.ac.ir/~moosavi<br />
<strong>Jan</strong>uary, <strong>2013</strong><br />
Dr. Ali A. Moosavi-Movahedi is currently a professor of Biophysics at the Institute of Biochemistry and Biophysics,<br />
University of Tehran. He graduated from the National University of Iran (NUI) with a BSc in Chemistry in 1975 from<br />
Eastern Michigan University (EMU) USA, followed by an MSc in Chemistry in 1979 and a PhD in Biophysical Chemistry<br />
in 1986 from University of Manchester, UK. In recognition of his outstanding research in the field of science, he was<br />
awarded the International Khawrazmi Prize (1990), National Distinguished Professor (1997), the first class medal for<br />
research at the University of Tehran (2003), National Eminent Character (2003), Razi Festival First Rank Award (2005),<br />
Elsevier-Scopus International Award for Top Researcher in the Field of Biochemistry & Molecular Biology (2007),<br />
Avicenna Festival First Rank Award for Top Researcher (2008), Eminent National Researcher (2009) and also selected<br />
as an Eminent Professor of the University of Tehran in 2010.<br />
Professor Dr. Ali A. Moosavi-Movahedi is also the author of 13 books and 360 full research papers published in<br />
international research journals, mainly in the area of structural elucidation of protein, enzyme and DNA. To date, the<br />
avid researcher has supervised 33 PhD and 42 MSc students and also guided postdoctoral researchers in the cited<br />
area. Apart from being a member of various societies such as Biophysical Society (USA), Protein Society (USA), Iranian<br />
Chemical Society, Iranian Biochemical Society, Professor Ali A. Moosavi-Movahedi is also currently the President of Iran<br />
Society of Biophysical Chemistry.<br />
i DISCLAIMER<br />
The views expressed in this article are those of the author and do not necessarily represent the views of, and should not be attributed to, the<br />
<strong>Pertanika</strong> <strong>Journal</strong> or the <strong>Pertanika</strong> Editorial Board.
<strong>Pertanika</strong> <strong>Journal</strong> of Science & Technology<br />
<strong>Vol</strong>. <strong>21</strong> (1) <strong>Jan</strong>. <strong>2013</strong><br />
Contents<br />
Editorial<br />
Milk and Its Bioactive Peptides: Phenomenal Nutraceutical Food of the Centurys<br />
Ali A. Moosavi –Movahedi<br />
Regular Articles<br />
Aspect of Fatigue Analysis of Composite Materials: A Review 1<br />
Suriani, M. J., Aidy Ali, S. M. Sapuan and A. Khalina<br />
Application of Anthropometric Dimensions for Estimating Stove Height, Stove Depth<br />
and Cooking Task Envelope for Malaysian Elderly Population<br />
Ruhaizin Sulaiman, Zahari Taha and Siti Zawiah Md. Dawal<br />
Different Media Formulation on Biocellulose Production by<br />
Acetobacter xylinum (0416)<br />
Suryani Kamarudin, Mohd Sahaid, K., Mohd Sobri, T., Wan Mohtar, W. Y.,<br />
Dayang Radiah, A. B. and Norhasliza, H.<br />
Solving Delay Differential Equations by Using Implicit 2-Point Block Backward<br />
Differentiation Formula<br />
Heng, S. C., Ibrahim, Z. B., Suleiman, M. and Ismail, F.<br />
Effects of Process Temperature and Time on the Properties of Microwave Plasma<br />
Nitrided Ti-6Al-4V Alloy<br />
Y. Yusuf, J. M. Juoi, Z. M. Rosli, W. L. Kwan and Z. Mahamud<br />
Modelling of Motion Resistance Ratios of Pneumatic and Rigid Bicycle Wheels 59<br />
Ahmad, D., Jamarei, O., Sulaiman, S., Fashina, A. B. and Akande, F. B.<br />
Assessment of Heavy Metal Pollution in the Straits of Johore by Using Transplanted<br />
Caged Mussel, Perna viridis<br />
Eugene Ng, Y. J., Yap, C. K., Zakaria, M. P. and Tan, S. G.<br />
Physico-Chemical and Electrical Properties of Bismuth Chromate Solid Solutions 97<br />
Wong Y. C. and Tan Y. P.<br />
Application of Computer Vision in the Detection of Chilling Injury in Bananas 111<br />
Norhashila Hashim, Rimfiel B. <strong>Jan</strong>ius, Russly Abdul Rahman, Azizah Osman,<br />
Mahendran Shitan and Manuela Zude<br />
On the Integral Solutions of the Diophantine Equation x 4 + y 4 = z 3 119<br />
S. Ismail and K. A. Mohd Atan<br />
i<br />
15<br />
29<br />
37<br />
45<br />
75
Selected Articles from UPM-Malaysian Nuclear Agency Symposium 2011<br />
Guest Editor: Mohd Sapuan Salit<br />
Guest Editorial Board: Mansor Ahmad, Syams Zainudin, Hawa Ze Jaafar,<br />
Fathinul Fikri Ahmad Saad, Kamarudin Hashim and Mohamad Azwar Hashim<br />
Radiation-Induced Formation of Acrylated Palm Oil Nanoparticle Using Pluronic<br />
F-127 Microemulsion System<br />
Tajau, R., Wan Yunus, W. M. Z., Mohd Dahlan, K. Z., Mahmood, M. H.,<br />
Hashim, K., Ismail, M., Salleh, M. and Che Ismail, R.<br />
Induced Tensile Properties With EB- Cross Linking of Hybridized Kenaf/Palf<br />
Reinforced HDPE Composite<br />
Aji, I. S., Zinudin, E. S., Khairul, M. Z., Abdan, K. and S. M. Sapuan<br />
Thermal Properties of Alkali-Treated Sugar Palm Fibre Reinforced High Impact<br />
Polystyrene Composites<br />
D. Bachtiar, S. M. Sapuan, E. S. Zainudin, A. Khalina and K. Z. H. M. Dahlan<br />
FTIR and TGA Analysis of Biodegradable Poly(Lactic Acid)/Treated Kenaf Bast<br />
Fibre: Effect of Plasticizers<br />
N. Maizatul, I. Norazowa, W. M. Z. W. Yunus, A. Khalina and K. Khalisanni<br />
Selected Articles from The International Conference on Information Retrieval<br />
and Knowledge Management, CAMP’12<br />
Guest Editors: Shyamala Doraisamy and Ramlan Mahmod<br />
Guest Editorial Board: Lili Nurliyana Abdullah, Rusli Abdullah, Masrah Azmi Murad, Rodziah<br />
Atan and Rabiah Abdul Kadir<br />
Content-based Image Retrieval Using Colour and Shape Fused Features 161<br />
Mas Rina Mustaffa, Fatimah Ahmad, Ramlan Mahmod and Shyamala Doraisamy<br />
Toward Automatic Semantic Annotating and Pattern Mining for Domain Knowledge<br />
Acquisition<br />
Tianyong Hao and Yingying Qu<br />
Issues on Trust Management in Wireless Environment 183<br />
Abubakr Sirageldin, Baharum Baharudin and Low Tang Jung<br />
A Negation Query Engine for Complex Query Transformations 193<br />
Rizwan Iqbal and Masrah Azrifah Azmi Murad<br />
Modified Multi-Class Classification using Association Rule Mining 205<br />
Yuhanis Yusof and Mohammed Hayel Refai<br />
Multi-Format Information Fusion through Integrated Metadata Using Hybrid<br />
Ontology for Disaster Management<br />
Che Mustapha Yusuf, J., Mohd Su’ud, M., Boursier, P. and Muhammad, A.<br />
Context Modelling for Just-In-Time Mobile Information Retrieval (JIT-MobIR) 227<br />
Az Azrinudin Alidin and Fabio Crestani<br />
Using SVMs for Classification of Cross-Document Relationships 239<br />
Yogan Jaya Kumar, Naomie Salim, Ahmed Hamza Osman<br />
and Albaraa Abuobieda<br />
127<br />
135<br />
141<br />
151<br />
169<br />
<strong>21</strong>7
Usability of Educational Computer Game (UsaECG): A Quantitative Approach 247<br />
Hasiah Mohamed@Omar, Azizah Jaafar and Rohana Yusoff<br />
The Role of Similarity Measurement in an Agent-Based Supplier Selection<br />
Framework<br />
Alireza Jahani, Masrah Azrifah Azmi Murad, Md. Nasir Sulaiman<br />
and Hasan Selamat<br />
261
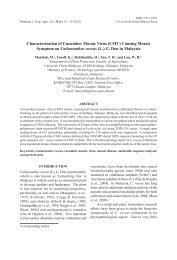
ISSN: 0128-7680 © <strong>2013</strong> <strong>Universiti</strong> <strong>Putra</strong> Malaysia Press.<br />
<strong>Pertanika</strong> J. Sci. & Technol. <strong>21</strong> (1): 1 - 14 (<strong>2013</strong>)<br />
SCIENCE & TECHNOLOGY<br />
<strong>Journal</strong> homepage: http://www.pertanika.upm.edu.my/<br />
Aspect of Fatigue Analysis of Composite Materials: A Review<br />
Suriani, M. J. 1 *, Aidy Ali 1 , S. M. Sapuan 1 and A. Khalina 2<br />
1 Department of Mechanical and Manufacturing Engineering, Faculty of Engineering, <strong>Universiti</strong> <strong>Putra</strong><br />
Malysia, 43400 Serdang, Selangor, Malaysia<br />
2 Department of Biological and Agriculture Engineering, Faculty of Engineering, <strong>Universiti</strong> <strong>Putra</strong> Malysia,<br />
43400 Serdang, Selangor, Malaysia<br />
ABSTRACT<br />
This paper reviewed the aspect of fatigue approaches and analysis in a fibre reinforced composite materials<br />
which have been done by researchers worldwide. The aim of this review is to provide a better picture<br />
on analytical approaches that are presently available for predicting fatigue life in composite materials.<br />
This review also proposes a new interpretation of available theories and identifies area in fatigue of<br />
natural fibre reinforced composite materials. Thus, it was concluded there are still very limited studies<br />
on fatigue analysis of natural fibre reinforced composite materials, especially using non-destructive<br />
technique (NDT) methods and a new mathematical modelling on fatigue should be formulated.<br />
Keywords: Fatigue life, composite materials, non-destructive technique<br />
INTRODUCTION<br />
Fatigue life of the classical engineering materials is difficult to predict, and not even<br />
surprisingly for composite materials. Predicting fatigue life for homogeneous materials was<br />
done in the past three decade but from a review of the limited research done and developed<br />
on natural fibre reinforced composite. Previously, a vast majority of the fatigue studies<br />
focused on synthetic fibre/resin system (Harris, 2003). Research on the fatigue properties<br />
of natural fibre composites is a new field and these have become a focus for many engineers<br />
Article history:<br />
Received: 23 April 2010<br />
Accepted: 5 August 2011<br />
E-mail addresses:<br />
surianimatjusoh@gmail.com (Suriani, M. J.),<br />
aidy@eng.upm.edu.my (Aidy Ali),<br />
sapuan@eng.upm.edu.my (S. M. Sapuan)<br />
khalina@eng.upm.edu.my (A. Khalina)<br />
*Corresponding Author<br />
and scientists. In composites, fatigue damage<br />
and failure mechanism commonly occurs<br />
is more complex compared to homogenous<br />
materials such as metal. There are four basic<br />
failure occurs in the composites under cyclic<br />
loading which are matrix cracking, interfacial<br />
debonding, delamination and fibre breakage<br />
(Wu & Yau, 2009).
Suriani, M. J., Aidy Ali, S. M. Sapuan and A. Khalina<br />
A long time ago, a man produced materials used which were widely in building and in<br />
many structure but later the materials had changes in the composites. Nowadays, due to<br />
the increased interest in the potential of natural fibre composites for applications in primary<br />
structures such as automotive parts and buildings, a fundamental study of their fatigue properties<br />
is essential (Towo & Ansell, 2008). Recently, scientists and researchers have discussed and<br />
worked on natural fibre in composites such as Kenaf, sugar palm, coconut, coir, jute, sisal,<br />
bamboo, wood, pineapple and banana. There are many reasons for using natural fibre as a<br />
filler or reinforcement in composites compared to glass fibres, and these include low density,<br />
biodegradable and recyclable, high strength and stiffness good fibre adhesion and environmental<br />
consciousness (Sapuan et al., 2006). Thus, the following section will elaborate on the aspect<br />
of the composites analysis of fatigue to better understand the integrity of this new material<br />
under dynamic loading.<br />
PREDICTING FATIGUE LIFE<br />
Fatigue can be defined as a failure under a repeated or varying load. These failures have two<br />
domains of cyclic or stressing and straining in different mechanisms of low-cycle fatigue and<br />
high-cycle fatigue (Wu & Yau, 2009).<br />
Fatigue failure process involves two distinct phases in the rubber. The first phase is a<br />
period during which cracks nucleate in regions that were initially invisible or free of observable<br />
cracks. The period during which nucleated cracks grow to the point of failure is the second<br />
phase of the fatigue failure process. It will be seen that in the second phase, nucleation, growth<br />
and final failure may be rationalized in terms of the fracture mechanical behaviour of rubber<br />
(Mars & Fatemi, 2002).<br />
Normally, three methods are used to predict life including total life by plotting stress-life<br />
(S-N) curve, crack initiation strain-life (E-N) and crack growth. Meanwhile, there are two<br />
approaches used for predicting the models for rubber. The first approach focuses on predicting<br />
crack nucleation life, given the history of quantities that are defined at a material point, in the<br />
sense of continuum mechanics. Stress and strain are examples of such quantities. The second<br />
approach, based on the ideas from fracture mechanics, focuses on predicting the growth of a<br />
particular crack, given the initial geometry and energy release rate history of the crack (Mars<br />
& Fatemi, 2002).<br />
Predicting fatigue life in composite materials is more complicated as compared to metal.<br />
This is because in the composite materials, failure does not occur by the propagation of a single<br />
macroscopic crack. The micro-structural mechanisms of damage accumulation, including<br />
fibre breakage and matrix cracking debonding, transverse-ply cracking, and delamination,<br />
occur independently sometimes and interactively at times, and the predominance of one or<br />
the other may strongly affect both materials variables and testing conditions. Fig.1 shows the<br />
degradation of composites strength until failure occurs (Harris, 2003).<br />
Many experiments have been done by the researchers to predict fatigue analysis by using the<br />
derived empirical S–N curves between stress and fatigue life. Fig.2 shows a typical S-N graph,<br />
where straight lines indicate endurance limit region. These relationships have been suggested<br />
for use in design in numerous industries such as aerospace, automotive and construction. The<br />
2 <strong>Pertanika</strong> J. Sci. & Technol. <strong>21</strong> (1): 283 - 298 (<strong>2013</strong>)
Aspect of Fatigue Analysis of Composite Materials: A Review<br />
Fig.1: The degradation of composites strength until failure occurs (Harris, 2003)<br />
Fig.2: A typical S-N graph where straight lines indicate endurance limit region (Harris, 2003)<br />
linear and non-linear S–N curves have been proposed (Yang, 1978; Nicholas, 2000). It also<br />
uses a non-linear curve between strains to predict the fatigue life of the composite materials<br />
(Reifsnider et al., 2000). It also discusses on a linear relationship between the maximum stress<br />
S and the logarithm of N, while the number of load cycles to fatigue failure is widely used to<br />
fit the experimental data, as follows:<br />
S = mlog N = b<br />
(1)<br />
where m and b are parameters dependent on material properties. By predicting fatigue life<br />
under constant cyclic loading, fatigue damage can be evaluated after a given number of cycles.<br />
Composite is assumed to fail in the phase when accumulated damage exceeds the critical level<br />
of damage (Clark et al., 1999).<br />
In a study on the flexural behaviour of sandwich composite materials under cycling<br />
loading, El Mahi et al. (2004) utilized Wohler Curve (S-N Curve) to obtain the comparison<br />
between the experimental result and analytical results. It was reported that a good agreement<br />
had been found between these two analyses. The approach was based on the interpolation by<br />
empirical function, in which the parameters were obtained from the experimental results using<br />
the stiffness concept. It was also reported that this approach is able to predict the fatigue life<br />
and the evolution of damage according to the loading level, which will reduce the number of<br />
experiments. In their work on the derivation of the model for fatigue life criteria, the failure<br />
<strong>Pertanika</strong> J. Sci. & Technol. <strong>21</strong> (1): 283 - 298 (<strong>2013</strong>)<br />
3
Suriani, M. J., Aidy Ali, S. M. Sapuan and A. Khalina<br />
occurs to residual strength degradation method. The failures were caused by the degradation<br />
of residual strength to the applied stress.<br />
Another approach that has been used by several authors is strain failure criterion which<br />
considers the final failure of the composite materials that occurs at the stage of resultant strain<br />
that reaches the ultimate static strain (D’amore et al., 1999; Clark et al., 1999). The other<br />
method used to predict fatigue life, done by Salvia et al. (1997), is stiffness reduction or<br />
degradation which needs another failure condition rather than the total failure of the specimen<br />
such as predefined critical number of cycles representing certain damage state. The critical<br />
number of the cycles was obtained when a given stiffness loss (predefined) was reached, and<br />
then the critical cycle numbers and stiffness reduction were associated.<br />
MODELLING FATIGUE IN COMPOSITES<br />
Damage Accumulation<br />
Damage evolution mechanism is one of the important focuses and also a foundation to predict<br />
fatigue life. The mechanical properties of the composite materials show progressive degradation<br />
with the increasing of the number of cyclic loading. Two quantitative relations, obtained from<br />
a study on a fatigue damage model of composite, are defined by the stiffness degradation rule<br />
in the loading direction. The proposed model is as follows:<br />
E0<br />
− E(<br />
n)<br />
⎛ n B ⎞<br />
D( n)<br />
= = 1−<br />
⎜1−<br />
( ) ⎟<br />
E − E ⎝ N ⎠<br />
4 <strong>Pertanika</strong> J. Sci. & Technol. <strong>21</strong> (1): 283 - 298 (<strong>2013</strong>)<br />
0<br />
Where 0 E is the initial Young’s modulus, E f is the failure Young’s modulus, ( ) n E is Young’s<br />
modulus of the material subjected to nth cycling loading, n is the cycle, N is the fatigue life, A<br />
and B are model parameters, D(n) is the fatigue damage which equals 0 when n=0 and equals<br />
1 when n=N (Wu & Yau, 2009).<br />
Shen et al. (1993), in predicting of fatigue life of Boron/Aluminium composite, worked on<br />
a technique involving the iteration of damage accumulation and internal stress redistribution.<br />
As pointed by Shen et al. (1993), damage accumulation can be determined by applying the<br />
fatigue damage evolution law and the redistribution of stress. The characteristics of damage<br />
growth in the composite materials have been studied and compared with those of the damage<br />
growth in homogeneous materials.<br />
The study on the fatigue damage of composite materials of characteristic of damage<br />
accumulation in composites materials was done in 2002 by Mao and Mahadevan, who reported<br />
that the concept of damage accumulation might be used as a more suitable approach to predict<br />
the fatigue life of the structures of composite materials. However, fatigue damage cannot be<br />
measured directly. Therefore, for quantitative evaluation of fatigue damage, Young’s modulus<br />
or the stiffness of composite materials is often used to evaluate the fatigue damage due to<br />
cyclic loading. Fig.3 shows a schematic comparison of damage accumulation in the composite<br />
materials and homogeneous materials as a function of fatigue cycle ratio. Fig.3 is plotted in<br />
terms of damage index versus cycle ratio, where the damage index is defined as Eq. (3):<br />
f<br />
A<br />
(2)
Aspect of Fatigue Analysis of Composite Materials: A Review<br />
Fig.3: Sketched fatigue damage accumulation (Mao & Mahadevan, 2002)<br />
1 1 E<br />
D = − (3)<br />
E<br />
where D 1 is accumulated fatigue damage, E is the Young’s modulus of the damaged material<br />
and E 0 is Young’s modulus of undamaged material. The cycle ratio is the number of cycles at<br />
a given instant divided by the fatigue life.<br />
Mao and Mahadevan (2002) presented a new damage accumulation model to describe the<br />
degradations of composite materials. This model accurately explains the rapid damage growth<br />
during both the early and final stages of life. The proposed function is of the following form:<br />
<strong>Pertanika</strong> J. Sci. & Technol. <strong>21</strong> (1): 283 - 298 (<strong>2013</strong>)<br />
0<br />
m m<br />
1<br />
2<br />
⎛ n ⎞ ⎛ n ⎞<br />
D= q⎜ ⎟ + ( 1−q)<br />
⎜ ⎟<br />
⎝ N ⎠ ⎝ N ⎠ (4)<br />
where D is the normalized accumulated damage; q, m 1 and m 2 are material dependent parameters;<br />
n is the number of applied loading cycles, and N is the fatigue life at the corresponding applied<br />
load level. The parameters for Eq. (4) are defined as:<br />
q =<br />
α<br />
⎛ N0<br />
⎞<br />
−( − ) ⎜ ⎟<br />
1 1<br />
m<br />
m<br />
α<br />
⎛ N0<br />
⎞<br />
A⎜ N<br />
⎟<br />
⎝ ⎠<br />
A<br />
⎝ N ⎠ (5)<br />
β<br />
⎛ No<br />
⎞<br />
1 = ⎜ ⎟<br />
2<br />
⎝ N ⎠ (6)<br />
γ<br />
⎛ N ⎞<br />
= ⎜ ⎟<br />
N<br />
⎝ 0 ⎠ (7)<br />
5
Suriani, M. J., Aidy Ali, S. M. Sapuan and A. Khalina<br />
where N 0 is the reference fatigue life. The parameters α, β and γ are material dependent<br />
constants. These parameters can be obtained with fatigue experimental data. Once the damage<br />
indices are obtained during the fatigue tests, regression analysis can be carried out to obtain the<br />
parameters q, m 1 and m 2. Then, the parameters α, β and γ can be calculated using Eqs. (5) – (7).<br />
Crack Nucleation Approaches<br />
Fatemi et al. (2002) stated that there are two approaches used in the models for predicting fatigue<br />
life in rubber. The first one focuses on predicting crack nucleation life, given the history of<br />
quantities that are defined at a material point, in the sense of continuum mechanics. Stress and<br />
strain are examples of such quantities. The other approach, based on the ideas from fracture<br />
mechanics, focuses on predicting the growth of a particular crack, given the initial geometry<br />
and energy release rate history of the crack.<br />
Crack Growth Approaches<br />
Fatigue crack growth approach has been used to analyze fatigue in composites (see Salvia<br />
et al., 1997; Fatemi et al., 2002; Dawis & Bradstreet, 1970; Savastano Jr., 2009; Woo et al.,<br />
2008). It was started to be used and applied widely since 1960s and the cracks were claimed<br />
to be related to damage. In the experimental study of resistance-curve behaviour and fatigue<br />
crack, the crack growth was observed to have occurred in three stages, namely, an initial<br />
decelerated growth, a steady-state growth and the final catastropic crack growth (Savastano Jr.,<br />
2009). Nowadays, this concept was applied with sophisticated tool and a technique available<br />
that can measure a very small crack up to 1μm (Fatemi & Yang, 1998). Southen and Thomas<br />
(1978) applied fracture mechanic approach based on fatigue crack growth to develop a model<br />
for abrasive wear of rubber. Stevenson, (1987) also stated that compressive loading must be<br />
considered carefully in any analysis of fatigue growth.<br />
Savastano Jr. (2009) presented the results of an experimental study on resistance-curve<br />
behaviour and fatigue crack growth in cementitious matrices reinforced with eco-friendly<br />
natural fibre obtained from agricultural by-products. He used blast furnace slag cement (BFS)<br />
reinforced with pulped fibres of sisal, banana and bleached eucalyptus pulp and ordinary<br />
Portland cement (OPC), which was reinforced with bleached eucalyptus pulp. Meanwhile,<br />
single-edge notched specimen was used to analyze fatigue crack growth and fracture resistance<br />
(R-curve). Then, the analysis of crack/microstructure interaction was done by using the NDT<br />
method via scanning electron microscopy (SEM) and X-ray spectroscopy (EDS). As pointed<br />
in this study, fatigue crack growth occurs in three stages, which are initial decelerated growth,<br />
a steady-state growth, and a final catastrophic crack growth. The crack growth diagram was<br />
plotted and the results of Sisal BFS, Banana BFS, Eucalyptus BFS and Eucalyptus OPC are<br />
shown in Fig.4a to Fig.4d, respectively.<br />
The fatigue life of banana and sisal fibre reinforced composite mostly occurred in the<br />
second stage of steady state crack growth (Fig.4a and Fig.4b). The fatigue crack growth rates<br />
of Eucalyptus reinforced composites are faster as compared to the sisal and banana reinforced<br />
composites (Fig.4c and Fig.4d). The results of the crack/microstructure interactions revealed<br />
6 <strong>Pertanika</strong> J. Sci. & Technol. <strong>21</strong> (1): 283 - 298 (<strong>2013</strong>)
Aspect of Fatigue Analysis of Composite Materials: A Review<br />
Fig.4: Fatigue crack growth rate of diagram (a) Sisal BFS, (b) Banana BFS, (c) Eucalyptus BFS, and<br />
(d) Eucalyptus OPC (Savastano Jr et al., 2009)<br />
Fig.5: Fatigue life of rubber materials at maximum displacement (Woo et al., 2008).<br />
that fatigue crack growth in composites occurred by matrix cracking, crack deflection around<br />
fibres and crack-bridging by uncracked fibres and ligaments (Savastano Jr., 2009).<br />
Woo et al. (2008) studied on the material properties and fatigue life of natural rubber<br />
component. The fatigue lifetime prediction methodology by using the incorporating of finite<br />
element (using Green-Lagrange strain) analysis and fatigue damage parameters has been<br />
proposed. Meanwhile, fatigue damage parameters were obtained from the fatigue test and<br />
Green-Lagrange (G-L) strain determined at the critical location. A single function of G-L strain<br />
was then used to represent the equation for predicting fatigue life. Fatigue test was performed<br />
using a 3D dumbbell specimen and roll front component in ambient temperature under the<br />
stroke controlled condition with a sine waveform of 5 Hz and the mean displacement is 0-10mm<br />
at a displacement range is -11 to <strong>21</strong>mm. Fig.5 shows the relationship between the maximum<br />
<strong>Pertanika</strong> J. Sci. & Technol. <strong>21</strong> (1): 283 - 298 (<strong>2013</strong>)<br />
7
Suriani, M. J., Aidy Ali, S. M. Sapuan and A. Khalina<br />
displacement with fatigue life. This shows that fatigue life decreases as the maximum tension<br />
displacement increases. In this study, the fatigue lives of the 3D specimens are represented<br />
by the maximum G-L strain parameter, N f , as performed in Eq. (8):<br />
N = 495, 450 ε<br />
f<br />
[ ] 1.324 −<br />
Toubal et al. (2006) worked on woven laminates composite of fabric (HR 285/G803),<br />
with high strength carbon fibre and the matrix is epoxy resin. This composite has been used in<br />
manufacturing aeronautical structures. The fatigue test was carried out under tension-tension<br />
load and analysis of temperature on external surface involving thermal concept or thermal<br />
imaging technique using infra-red camera applied in this research. This study intended to<br />
relate the damage evolution and heat dissipation in composites. An analytical model based<br />
on the cumulative damage has also been proposed to predict damage evolution. Roylance<br />
(2001) stated that a cumulative damage model is often hypothesized when the cyclic load<br />
level varies during the fatigue process. They are considered to be two main approaches for<br />
cumulative damage such as Miner’s rule and the other is that of residual strength. Miner’s<br />
rule can be written as Eq. (9):<br />
G−L 8 <strong>Pertanika</strong> J. Sci. & Technol. <strong>21</strong> (1): 283 - 298 (<strong>2013</strong>)<br />
(8)<br />
ni<br />
1<br />
N = ∑ (9)<br />
i<br />
where n i is the number of cycles applied at a load corresponding to a lifetime of Ni, and for<br />
residual strength σ R, Broutman and Sahu (1972) stated Eq. (10) as follows:<br />
( σ ) S i<br />
n<br />
∑ −<br />
= σ σ σ<br />
(10)<br />
i<br />
R S<br />
N<br />
i<br />
i<br />
−<br />
where σ S is the instantaneous tensile static strength as measured on the virgin material before<br />
any fatigue damage is induced as σ S=σ i (with σ i being the maximum stress in the cycle). In<br />
another example, Granda et al. (2008) reported from their prediction of fatigue damage of<br />
an automotive axle, which was subjected to variable loading observations that there was a<br />
localized damage process which resulted from a cumulative damage. Marin (1962) proposed<br />
a cumulative damage based on the consideration of the relations between damage as a function<br />
of cycle ratio and changes in the S-N curve due to damage accumulation.<br />
Cumulative damage, as a function of loading cycles, is described in Fig.6. It was<br />
determined that D is cumulative damage, N is the three numbers of loading cycles and N f is<br />
the number of cycles to failure. Cumulative damage was determined by using Equation (11):<br />
E<br />
D = 1− E<br />
where E is the residual modulus and E 0 is the initial modulus (Toubal et al., 2006).<br />
Toubal et al. (2006) used Eq. (4) proposed by Mao and Mahadevan (2002) to determine<br />
the analytical model of accumulation damage and the values of q, m 1 and m 2 are given in Table<br />
1 and plotted in Fig.7 to Fig.8, respectively.<br />
0<br />
(11)
Aspect of Fatigue Analysis of Composite Materials: A Review<br />
Fig.6: Evolution of the modulus of elasticity E and damage D according to the number of cycle<br />
(Toubal et al., 2006)<br />
Fig.7: Evolution of q according to load (Toubal et al., 2006).<br />
Fig.8: Evolution of m 1 and m 2 according to load (Toubal et al., 2006).<br />
Table 1: The values of q, m 1 and m 2, Toubal et al. (2006)<br />
Loading of load (%) q m 1 m 2<br />
70 0.585 0.600 4.50<br />
67.5 0.520 0.460 7.20<br />
65 0.500 0.180 10<br />
62.5 0.400 0.142 14<br />
60 0.365 0.135 15<br />
<strong>Pertanika</strong> J. Sci. & Technol. <strong>21</strong> (1): 283 - 298 (<strong>2013</strong>)<br />
9
Suriani, M. J., Aidy Ali, S. M. Sapuan and A. Khalina<br />
Fig.9 shows a comparison of the evolution of the damage for different loads by analytical<br />
means using Eq. (4), as proposed by Mao and Mahadevan (2002) and the experimental<br />
approaches. Fig.10 shows an image of the thermal distribution on the surface of the examined<br />
specimens provided by an infrared camera. It shows that the hot zone is localized at the<br />
centre of the specimens. The correlation between the increase of temperature and the damage<br />
evolution in the composites was done by using this thermography and experimental data.<br />
Fig.11a, Fig.11b, and Fig.11c show a comparison between the change of temperature and the<br />
damage at different loadings.<br />
Fig.9: A comparison of the evolution of the damage by experimental and analytical<br />
(Toubal et al., 2006).<br />
Fig.10: Various cartographics of temperature for various cycles (Toubal et al., 2006)<br />
10 <strong>Pertanika</strong> J. Sci. & Technol. <strong>21</strong> (1): 283 - 298 (<strong>2013</strong>)
Aspect of Fatigue Analysis of Composite Materials: A Review<br />
Fig.11: A comparison between the change of the temperature and the damage; (a) 70%loading, (b)<br />
67.5% loading, and (c) 60% loading (Toubal et al., 2006).<br />
Non-destructive Technique (NDT)<br />
Non-destructive technique (NDT) is used for a group or a single part of an instrumental which<br />
does not damage or disturb (permanently) the object. NDT for testing and evaluating are the<br />
concepts and terms that have been used by the scientists or researchers for only the past 50-60<br />
years (Boogard, 1994). The terms ‘technique’ and ‘method’ have been cautiously applied as<br />
follows: method will be used for the description of a discipline such as ultrasonic inspection,<br />
while pulse-echo or through-transmission is qualified as a technique. The principal objective<br />
of a non-destructive examination (NDE) is to provide the inspector with quantitative as well<br />
as qualitative information (Coffey, 1983). Non-destructive testing (NDT) is particularly<br />
relevant to the inspection of large and expensive components. The aerospace, food, nuclear<br />
and offshore industries are only a few examples of industries which employ a wide range of the<br />
NDT techniques. The most commonly used NDT methods in industry include visual inspection,<br />
liquid penetrant inspection, magnetic particle inspection, eddy current testing, alternating<br />
current potential drop, alternating current field measurement, ultrasonic testing, radiography and<br />
thermography. These NDT techniques can be used for the detection of unwanted discontinuities<br />
and separations in a material (flaws), structural assessment of a component (microstructure<br />
and matrix structure), metrology and dimensional purposes (thickness measurement, checking<br />
of displacement and alignment), determination of the physical properties of a material<br />
(electrical, magnetic or mechanical properties, as well as the detection of foreign bodies in<br />
food (Gros, 1996). In addition, NDT also provides information about product’s properties<br />
such as composition and chemical analysis, stress and dynamics response, signature analysis<br />
and abnormal sources of heat (Giorleo & Meola, 2002).<br />
<strong>Pertanika</strong> J. Sci. & Technol. <strong>21</strong> (1): 283 - 298 (<strong>2013</strong>)<br />
11
CONCLUSION<br />
Suriani, M. J., Aidy Ali, S. M. Sapuan and A. Khalina<br />
Most of the presented studies conducted on predicting fatigue life of the composites materials or<br />
the proposed models have used synthetic fibre. There are still limited works done on predicting<br />
the fatigue life of natural fibre reinforced composites materials. Based on the review, the<br />
following are concluded:<br />
1. Generally, it was found that many fatigue analyses had been done in composites materials<br />
but studies carried out on composites materials reinforced by natural fibres are rather<br />
limited.<br />
2. As observed in the present results, most of the researchers obviously intended to use a<br />
non-destructive technique (NDT) in their work.<br />
ACKNOWLEDGEMENTS<br />
The authors wish to thank the Department of Mechanical Engineering and the technical staff<br />
at UPM for their support.<br />
REFERENCES<br />
Boogard, J. (1994). Non Destructive Technique. In X. P. V. Maldague (Ed.), Need and Necessity of NDT<br />
(pp. 3-7). Boston MA: Cahners Publishing.<br />
Broutman, L. J., & Sahu, S. (1972). A new theory to predict cumulative damage in glass reinforced<br />
composites. Composite Materials Testing and Design, ASTM STP, 497, 170-188.<br />
Chrysochoos, A. (2002). Infrared thermography, a potential tool for analysing the material behaviour.<br />
Meca Indus., 135-141.<br />
Clark, S. D., Shenoi, R. A., & Allen, H. G. (1999). Modelling the fatigue behaviour of sandwish beams<br />
under monotonics, 2 step and block loading regimes. Composites Science Technology, 59, 471-486.<br />
Coffey, J. M. (1983). Advances in non-destructive examination for structural integrity: Applied Science.<br />
In Nicholas, R. W. (Ed), NDT International, 16(6), 360-361.<br />
D’amore, A., Caprino, G., Stupak, R., Zhou, J., & Nicholas, L. (1999). Effect of stress ratio on the<br />
flexural fatigue behaviour of continuous stand mat reinforced palstics. Science Engineering Composite<br />
Materials, 5, 1-8.<br />
Dawis, L. W., & Bradstreet, W. S. (1970). Metal and Ceramic Matrix Composites (pp. 193-194). Boston<br />
MA: Cahners Publishing.<br />
El Mahi, A., Khawar Farooq, M., Sahraoui, S., & Bezazi, A. (2004). Modeling the flexural behaviour of<br />
sandwish composites materials under cyclic fatigue. Materials and Design, 25, 199-208.<br />
Fatemi, A., & Yang, L. (1998). Cumulative fatigue damage and life prediction theories: a survey of the<br />
state of the art for homogeneous materials. Int. J. Fatigue, 20(1), 9-34.<br />
Fatemi, A., & Mars, W. V. (2002). A literature survey on fatigue analysis approach for rubber. International<br />
<strong>Journal</strong> of Fatigue, 24, 949-961.<br />
Giorleo, G., & Meola, C. (2002). Comparison between pulsed and modulated thermography in glassepoxy<br />
laminates, NDT & E International, 35(5), 287-292.<br />
12 <strong>Pertanika</strong> J. Sci. & Technol. <strong>21</strong> (1): 283 - 298 (<strong>2013</strong>)
Aspect of Fatigue Analysis of Composite Materials: A Review<br />
Granda, M., Hernandez, G., Urriolagoitia, C., Urriolagoitia, S., & Merchan, C. (2008). Cumulative<br />
Damage Evaluation under Fatigue Loading. Applied Mechanics and Materials, 13(14), 141-150.<br />
Gros, X. E. (1996). NDT Data Fusion. London: Arnold Publisher.<br />
Harris, B. (2003). Fatigue in Composites. In B. Harris, B. (Ed). Fatigue in composites science and<br />
technology of the fatigue response of fibre-reinforced plastics (pp.145-156).Cambridge: Woodhead<br />
Publishing.<br />
Harris, B. (2003). Fatigue in Composites. In Harris (Ed.), A historical review of the fatigue behavior of<br />
fibre-reinforced plastics (pp. 3-31). Cambridge: Woodhead Publishing.<br />
Kim, W. D., Lee, H. J., Kim J. Y., & Koh, S. K. (2004). Fatigue life estimation of an engine rubber mount.<br />
Fatigue life estimation of an engine rubber mount. International <strong>Journal</strong> of Fatigue, 26, 553-560.<br />
Lawson, R. N. (1956). Implications of surface temperatures in the diagnosis of breast cancer. Canadian<br />
Medical Association <strong>Journal</strong>, 75, 309-310.<br />
Li, Y., Mai, Y. W., & Ye, L. (2000). Sisal fibre and its composites: a review of recent developments.<br />
Composite Science Technology, 60(11), 2037-55.<br />
Lindley, P. B., & Stevenson, A. (1982). Fatigue resistance of natural rubber in compression. Rubber<br />
Chemistry and Technology, 55, 337-351.<br />
Mao, H., & Mahadevan, S. (2002). Fatigue damage modelling of composites materials. Composite<br />
Structures, 58, 405-410.<br />
Marin, J. (1962). Mechanical Behaviour of Engineering Materials. Prentice-Hall.<br />
Mars, W. V., & Fatemi, A. (2002). A literature survey on fatigue analysis approaches for rubber.<br />
International <strong>Journal</strong> of Fatigue, 24, 949-961.<br />
Mathur, V. K. (2006). Composite materials from local resources. Construction and Building Materials,<br />
20, 470-477.<br />
Nicholas, T. (2000). An approach to fatigue life modelling in titanium-matrix composites. Materials<br />
Science Engineering A., 29-37.<br />
Reifsnider, K., Case, S., & Duthoit, J. (2000). The mechanics of composite strength evolution. Composites<br />
Science Technology, 60, 2539-2546.<br />
Royo, J. (1992). Fatigue Testing of Rubber Materials and Articles. Polymer Testing, II, 325-344.<br />
Roylance, D. (2001). Fatigue by Department of Materials Science and Engineering, Massachusetts<br />
Institute of Technology, Cambridge. Retrieved from http://ocw.mit.edu/courses/materials_science_<br />
and_engineering/3_11_mechanics-of-materials_fall_1999/modules/fatigue.pdf.<br />
Salvia, M., Fournier P., & Vincent, L. (1997). Flexural fatigue behaviour of UDGFRP experimental<br />
approach. International <strong>Journal</strong> of Fatigue, 19(3), 253-262.<br />
Sapuan, S. M., Leenie, M., Harimi, & Beng, Y. K. (2006). Mechanical properties of woven banana fibre<br />
reinforced epoxy composites. Materials and Design, 27, 689-693.<br />
Savastano Jr, H., Santos, S. F., Randojic, M., & Soboyejo, W. O. (2009). Fracture and fatigue fiberreinforced<br />
cementitious composites. Cement and Concrete Composites, 31, 232-243.<br />
Shen, G., Glinka, G., & Plumtree. (1993). A Fatigue life prediction of a B/Al Composite. Engineering<br />
Fracture Mechanics, 44(3), 449-457.<br />
<strong>Pertanika</strong> J. Sci. & Technol. <strong>21</strong> (1): 283 - 298 (<strong>2013</strong>)<br />
13
Suriani, M. J., Aidy Ali, S. M. Sapuan and A. Khalina<br />
Southern, E., & Thomas, A. G. (1978). Studies of rubber abrasion. Plastic and Rubber Materials and<br />
Applications, 3, 133-138.<br />
Stevenson, A. (1987). Crack at fatigue resistance. Europe Rubber <strong>Journal</strong>, 169(11), 24-29.<br />
Woo C. S., Kim, W. D. & Kwon, J. D. (2008). A study on material properties and fatigue life prediction<br />
of natural rubber component. Materials & Science A., 483-484, 376-381<br />
Yuanjian, T., & Isaac, D. H. (2007). Impact and fatigue behavior of hemp fibre composites. Composites<br />
Science & Technology, 67, 3300-3307.<br />
Wu, F., & Yao, W. (2009). A fatigue damage model of composite materials. International <strong>Journal</strong> of<br />
Fatigue. Article in Press.<br />
14 <strong>Pertanika</strong> J. Sci. & Technol. <strong>21</strong> (1): 283 - 298 (<strong>2013</strong>)
ISSN: 0128-7680 © <strong>2013</strong> <strong>Universiti</strong> <strong>Putra</strong> Malaysia Press.<br />
<strong>Pertanika</strong> J. Sci. & Technol. <strong>21</strong> (1): 15 - 28 (<strong>2013</strong>)<br />
SCIENCE & TECHNOLOGY<br />
<strong>Journal</strong> homepage: http://www.pertanika.upm.edu.my/<br />
Application of Anthropometric Dimensions for Estimating Stove<br />
Height, Stove Depth and Cooking Task Envelope for Malaysian<br />
Elderly Population<br />
Ruhaizin Sulaiman 1 *, Zahari Taha 2 and Siti Zawiah Md. Dawal 3<br />
1 Department of Industrial Design, Faculty of Design & Architecture, <strong>Universiti</strong> <strong>Putra</strong> Malaysia, 43400<br />
Serdang, Selangor, Malaysia<br />
2 Department of Manufacturing Engineering, <strong>Universiti</strong> Malaysia Pahang, Lebuhraya Tun Razak, 26300<br />
Gambang, Kuantan, Pahang, Malaysia<br />
3 Centre for Product Design and Manufacturing (CPDM), Department of Engineering Design and<br />
Manufacturing, Faculty of Engineering, University of Malaya, Lembah Pantai, 50603 Kuala Lumpur,<br />
Malaysia<br />
ABSTRACT<br />
Elderly are exposed to physical impairment. This has a strong impact on their daily activities including<br />
frying, which is one of the most popular cuisine preparations. The stove height and work envelope<br />
are two major ergonomic issues in performing cooking task. There has been little research focusing<br />
on Malaysian elderly task performing in addressing these issues. The objectives of this study were to<br />
identify the acceptable stove height and depth and to determine the working envelope among Malaysian<br />
elderly using anthropometric data. A total of 55 Malaysian elderly (25 male and 30 female) aged between<br />
60 to 85 years participated in this study. Five body measurements were taken from each subject using<br />
an anthropometer. The measurements are stature height, shoulder height, arm span, arm reach forward<br />
and waist height. Apart from these anthropometric measurements, their present stove height was also<br />
measured. The acquisition of stove height dimensions was performed through a series of door to door<br />
visit of the elderly homes in Kg. Sg. Merab. These variables were used to estimate the elderly working<br />
envelope and determine the stove height, width and depth. Data were analysed using SPSS software. The<br />
waist height dimension was to estimate the stove height, the arm reach forward for the depth and the arm<br />
span for the length of the table-top where the stove was placed. Meanwhile the stature and shoulder height<br />
were used for estimating the position of the overhead compartment or placement of cooking utensils.<br />
The 5 th percentile was chosen since it is appropriate to accommodate 90% of the studied population.<br />
Article history:<br />
Received: 4 November 2010<br />
Accepted: 4 April 2011<br />
E-mail addresses:<br />
ruhaizin@putra.upm.edu.my (Ruhaizin Sulaiman),<br />
ztr.motion@googlemail.com (Zahari Taha),<br />
sitizawiahmd@um.edu.my (Siti Zawiah Md. Dawal)<br />
*Corresponding Author<br />
The 5 th percentile was also applied for the setting<br />
of the working envelope so as to provide better<br />
reaching tolerances. Meanwhile, standard was used<br />
to compare the present state of the studied kitchen<br />
setting. The results show that 56.4% of the elderly<br />
waist height is lower than the standard table-top<br />
height which is 36 inches (91.4cm) and 36.4% of
Ruhaizin Sulaiman, Zahari Taha and Siti Zawiah Md. Dawal<br />
the stove height was found higher than that of the standard. This could apparently cause fatigue and<br />
discomfort to shoulders, the neck, the arm and the back of the user. Anthropometrics measurements can<br />
be used for estimating the stove height, length and depth. These could also calculate a space taken for<br />
certain physical activities, such as frying task envelope. Providing a good combination of stove height,<br />
length, depth and ergonomic working envelope could hopefully improve the elderly cooking task and<br />
increase their quality of life.<br />
Keywords: Elderly, fatigue, discomfort, ergonomic working envelope, quality of life<br />
INTRODUCTION<br />
Physical dimensions and human movement are significant to a space they occupy in any<br />
performance of task. This human anthropometrics is also very useful as a guideline in designing<br />
products, equipment, furniture, transport or even buildings.<br />
Anthropometry means the study of human body measurement for use in anthropological<br />
classification and comparison (Answer.com, 2010). Work envelope, on the other hand, means<br />
a space which can cater part or the whole human body movement when performing certain<br />
tasks. In this paper, the investigation was carried out based on standing work posture and the<br />
work envelope derived from the anthropometrics measurements of the elderly. There are other<br />
methods of assessing working posture, such as Rapid Entire Body Assessment (REBA) by<br />
Hignett (1998), McAtamney and Hignett (1995), or Rapid Upper Limb Assessment (RULA) by<br />
McAtamney and Corlett (1993); nonetheless, these will not be discussed further in this paper.<br />
Working in a kitchen could be an issue for some elderly, especially when preparing their<br />
meal. This is due to shrunk cartilage throughout the spine that begs their standing strength<br />
ability and endurance. The posture among the aged also has a slumped character that could<br />
limit the movement (Tilley, 2008). According to Opila et al. (1988), line of gravity is forward<br />
of the spine (L4-5), i.e. the body has a forward bending moment which is counterbalanced by<br />
ligament forces and back muscle forces. If the body centre gravity is moved forward, it causes<br />
a variety of biomechanical stresses while standing or walking (Lee et al., 2001). Another<br />
factor is the 50% reduction of leg strength (Tilley, 2008) which decreases the elderly standing<br />
endurance and this may require them to use supportive instrument, such as canes, tripod aids,<br />
walkers, or even chair when performing cooking task.<br />
Ecologically, elderly are exposed to breakdown of functional impairments. These include<br />
changes in anthropometry, musculoskeletal attributes, respiration and circulation, nervous<br />
functions, capacity for physical work, brain and memory, visual functions, hearing, taste and<br />
smell, as well as sensitivity and also sensory and psychomotor performance (Taha & Ruhaizin,<br />
2010). These factors have negative impacts on their performance in instrumental activities of<br />
daily living (IADL) or even the basic activities of daily living (BADL). In a household setting,<br />
a task such as opening a can of red beans is considered far more complex than cellular or<br />
molecular mechanisms of aging due to complex body and environmental systems involved.<br />
Some surveys conducted show that older populations (65+) have greater difficulty in performing<br />
one or more common self-care activities, such as eating, using the toilet, dress, bathing, or<br />
16 <strong>Pertanika</strong> J. Sci. & Technol. <strong>21</strong> (1): 283 - 298 (<strong>2013</strong>)
Application of Anthropometric Dimensions for Estimating Stove Height, Stove Depth and Cooking Task Envelope<br />
preparing meals in the kitchen (Dawson et al., 1987; AARP, 2000; Taha & Ruhaizin, 2008).<br />
Cooking task is normally performed in a standing posture. This is because ordinary meal<br />
preparation requires high physical mobility between a work-triangle. The performers in this<br />
case, who are the elderly, will have to stand and use both their hands while performing the task<br />
regardless of whether they are right-, or left-handed. The dominant hand normally performs<br />
the main task and is supported by the other hand. For example, a right-handed user holds the<br />
ladle with his right hand while the left hand will hold and stabilise the frying pan caused by<br />
forces of stirring.<br />
Besides physical frailty, the other factors effecting cooking performance are the height of<br />
the stove and work-top. For example, the incorrect height of the table-top could contribute to<br />
shoulder fatigue, neck pain, back pain and elbow pain after completing the task. The actual<br />
frying task normally requires higher hand rising due to additional stove height and the height<br />
of the frying pan. Furthermore, the ladle set used for mixing the cuisine could also add-up<br />
the height of hand rising and make the situation worst. Although providing stepping stool for<br />
Fig.1: The height of the stove is higher than the subject’s waist height.<br />
Fig.2: Subject’s arm could easily rise-up close to his shoulder height while stirring.<br />
<strong>Pertanika</strong> J. Sci. & Technol. <strong>21</strong> (1): 283 - 298 (<strong>2013</strong>)<br />
17
Ruhaizin Sulaiman, Zahari Taha and Siti Zawiah Md. Dawal<br />
Fig.3: The stove is too low than the subject’s waist height. Bending the neck exceeding 20 degree could<br />
cause neck fatigue.<br />
Fig.4: The arm is lifted above the shoulder height. This contributes to shoulder pain and arm fatigue.<br />
shorter persons may overcome this problem, this is merely a short-term solution and can still<br />
contribute to accident in the kitchen.<br />
Fig.1, Fig.2, Fig.3 and Fig.4 illustrate the subjects performing frying task in their kitchen<br />
settings. Each figure shows a different ratio between the subject’s waist height and the height of<br />
the stove. In particular, both Fig.1 and Fig.4 show that the table-top is too high. It is clear that<br />
the pan is higher than the subject’s elbow height. This position may cause shoulder discomfort<br />
or fatigue. Meanwhile, Fig.3 illustrates that the tabletop level is far below the waist height,<br />
and this position forces the subject to tilt her neck down. As shown in Fig.5, the neck flexion<br />
angle should not exceed the range between 0-20 degrees to prevent neck fatigue.<br />
Some of the examples above show that incorrect stove height could contribute to<br />
musculoskeletal disorder, primarily on the shoulder and the neck. Pain on the elbow is also<br />
reported at times. Konz and Johnson (2004) stated that musculoskeletal disorder is also known<br />
as occupational cerviobrachial disorder (OCD) and upper limb disorder (ULD). If an elderly<br />
is diagnosed of having this disorder, the chances to come back to a normal healthy state are<br />
very slim or there is no chance for it at all. He or she will definitely depend on others for the<br />
rest of his or her life.<br />
18 <strong>Pertanika</strong> J. Sci. & Technol. <strong>21</strong> (1): 283 - 298 (<strong>2013</strong>)
Application of Anthropometric Dimensions for Estimating Stove Height, Stove Depth and Cooking Task Envelope<br />
Fig.5: The Neck Extension (A) and Flexion (B) (Source: FAA William J. Hughes Technical Centre)<br />
(Exhibit 14.3.3.2.1 Joint movement ranges)<br />
Therefore, greater focus on elderly anthropometrics measurement, their working envelopes,<br />
and the kitchens stove height should be investigated. This paper presents the result of a study<br />
on the elderly stoves height and their nature of working envelopes in everyday cooking task.<br />
The most common height for a kitchen counter top is 36 inches (or 91.4cm). Premade<br />
based cabinets are designed for this finished height. Thus, the height of 36 inches (91.4cm) is<br />
typically the optimal and most ergonomic height for a kitchen counter. It may not be the best for<br />
a specific task, but it is apparently the best overall compromise for the majority of tasks done<br />
in the kitchen. For most people, a kitchen counter top height of 36 inches (91.4cm) provides<br />
a comfortable work station. Extremely short or tall people, or those with special needs, may<br />
want to modify that height to better suit their needs (About.com, 2008).<br />
According to the National Kitchen and Bath Association (NKBA), the minimum height<br />
of the first level, which is 28 inches (71cm), shows that it is fully complied for the elderly<br />
requirement. On the other hand, the maximum height of the second level, which is 45 inches<br />
(114cm), is too high for Malaysian elderly.<br />
According to Peterson (1998) and Tilley (2002), the standard kitchen cabinet height is 36<br />
inches (91.4cm) and 24 inches (61cm) deep. NKBA has proposed two level ranges of workcounter<br />
heights. One is 28 inches (71cm) to 36 inches (91.4cm) above the finished floor and<br />
the second is 36 inches (91cm) to 45 inches (114cm), (Krengel, 1997).<br />
METHOD AND INSTRUMENT<br />
Anthropometrics measurement<br />
A total of 55 Malaysian elderly (25 males and 30 females) aged between 60 to 85 years, with<br />
the mean age of 66.98 years, participated in the anthropometrics measurement of this study.<br />
The subjects were pooled in a community hall for a briefing on the objectives of the research<br />
and the procedures of the data acquisition. Basic subjects’ background information, such as<br />
name, age, health status, gender and address, was also recorded for demographic purposes.<br />
<strong>Pertanika</strong> J. Sci. & Technol. <strong>21</strong> (1): 283 - 298 (<strong>2013</strong>)<br />
19
Ruhaizin Sulaiman, Zahari Taha and Siti Zawiah Md. Dawal<br />
Fig.6: Instrument used to acquire anthropometric data<br />
Five body dimensions were measured on each individual elderly during the session. These<br />
include stature (standing height), shoulder height, arm span, arm reach forward and waist height.<br />
The “anthropometer” is the main instrumental set used in the data acquisition (see Fig.6).<br />
Each measurement was taken 3 times and the average was recorded for statistical analysis.<br />
Measuring the Table-top, Stove and Frying Pan Height<br />
The acquisition of these measurements was performed through a series of door-to-door visit of<br />
55 elderly homes in Kg. Sg. Merab. These data are important to evaluate the existing kitchen<br />
settings and to compare those with the present guidelines or standard, as well as the relation<br />
with the elderly anthropometrics. Each of the table-top, stove and pan heights, as well as the<br />
depth of their kitchen worktops, was measured using an ordinary measuring tape. The data<br />
were analysed using SPSS software.<br />
Fig.7, Fig.8, Fig.9, Fig.10 and Fig.11 show the acquired anthropometrics measurements<br />
in this study.<br />
Fig.7: Stature height Fig.8: Shoulder height<br />
20 <strong>Pertanika</strong> J. Sci. & Technol. <strong>21</strong> (1): 283 - 298 (<strong>2013</strong>)
Application of Anthropometric Dimensions for Estimating Stove Height, Stove Depth and Cooking Task Envelope<br />
RESULTS AND DISCUSSION<br />
Fig.9: Waist height Fig .10: Arm reach forward<br />
Fig.11: Arm span<br />
The anthropometrics data acquisition involved 5 measurements, and these included stature<br />
height, shoulder height, arm span, arm reach forward and waist height. The other variable is<br />
stove height. The statistical results are shown in Table 1 to Table 8 as well as Fig.7 to Fig.12.<br />
Table 9, on the other hand, shows the comparison with the previous findings.<br />
The Stove Height<br />
The ‘stove height’ is a dimension measured from the floor to the top of the stove. This includes<br />
table or cabinet where the stove is placed on. The results are in Tables 1, and 2, as well as in<br />
Fig.12. Table 2 shows that 36.4% of the stove height is higher than 36 inches (91.4cm) which<br />
is as suggested by NKBA.<br />
<strong>Pertanika</strong> J. Sci. & Technol. <strong>21</strong> (1): 283 - 298 (<strong>2013</strong>)<br />
<strong>21</strong>
TABLE 1: Statistics of the stove height<br />
Stove Height<br />
N Valid 55<br />
Missing 0<br />
Mean 87.5709<br />
Std. Deviation 7.10870<br />
Minimum 73.60<br />
Maximum 99.00<br />
Percentiles 5 74.6400<br />
50 86.3000<br />
95 99.0000<br />
Ruhaizin Sulaiman, Zahari Taha and Siti Zawiah Md. Dawal<br />
TABLE 2: Frequency of the height of stoves<br />
Frequency Percentage<br />
Valid<br />
Percentage<br />
22 <strong>Pertanika</strong> J. Sci. & Technol. <strong>21</strong> (1): 283 - 298 (<strong>2013</strong>)<br />
Cumulative<br />
Percentage<br />
Valid 73.6 2 3.6 3.6 3.6<br />
74.9 2 3.6 3.6 7.3<br />
76.2 3 5.5 5.5 12.7<br />
83.8 14 25.5 25.5 38.2<br />
TABLE 3: Statistics of waist height<br />
Waist Height<br />
N Valid 55.0000<br />
Missing .0000<br />
Mean 90.0491<br />
Std. Deviation 4.3723<br />
Minimum 81.0000<br />
Maximum 101.0000<br />
Percentiles 5 82.6000<br />
50 90.0000<br />
95 96.6000<br />
Fig.12: Frequency of the height of stoves<br />
86.3 14 25.5 25.5 63.6<br />
91.4 6 10.9 10.9 74.5<br />
96.5 10 18.2 18.2 92.7<br />
99 4 7.3 7.3 100.0<br />
Total 55 100.0 100.0<br />
Fig.13: Frequency of waist height
Application of Anthropometric Dimensions for Estimating Stove Height, Stove Depth and Cooking Task Envelope<br />
TABLE 4: Frequency of waist height<br />
Frequency Percentage Valid Percentage Cumulative Percentage<br />
Valid 81 2 3.6 3.6 3.6<br />
83 1 1.8 1.8 5.5<br />
83.2 1 1.8 1.8 7.3<br />
84 1 1.8 1.8 9.1<br />
84.2 1 1.8 1.8 10.9<br />
84.5 1 1.8 1.8 12.7<br />
85 1 1.8 1.8 14.5<br />
85.1 1 1.8 1.8 16.4<br />
85.8 1 1.8 1.8 18.2<br />
86.4 1 1.8 1.8 20.0<br />
86.5 2 3.6 3.6 23.6<br />
87 1 1.8 1.8 25.5<br />
87.2 1 1.8 1.8 27.3<br />
87.5 2 3.6 3.6 30.9<br />
87.8 1 1.8 1.8 32.7<br />
88 4 7.3 7.3 40.0<br />
88.8 1 1.8 1.8 41.8<br />
89 2 3.6 3.6 45.5<br />
89.5 1 1.8 1.8 47.3<br />
89.6 1 1.8 1.8 49.1<br />
90 1 1.8 1.8 50.9<br />
91 3 5.5 5.5 56.4<br />
91.4 1 1.8 1.8 58.2<br />
92 3 5.5 5.5 63.6<br />
92.1 1 1.8 1.8 65.5<br />
92.2 1 1.8 1.8 67.3<br />
92.5 2 3.6 3.6 70.9<br />
92.7 1 1.8 1.8 72.7<br />
93 1 1.8 1.8 74.5<br />
93.5 1 1.8 1.8 76.4<br />
93.8 2 3.6 3.6 80.0<br />
93.9 1 1.8 1.8 81.8<br />
94.5 1 1.8 1.8 83.6<br />
95 1 1.8 1.8 85.5<br />
95.1 1 1.8 1.8 87.3<br />
95.2 1 1.8 1.8 89.1<br />
95.5 2 3.6 3.6 92.7<br />
95.9 1 1.8 1.8 94.5<br />
96.5 1 1.8 1.8 96.4<br />
97 1 1.8 1.8 98.2<br />
101 1 1.8 1.8 100.0<br />
Total 55 100.0 100.0<br />
<strong>Pertanika</strong> J. Sci. & Technol. <strong>21</strong> (1): 283 - 298 (<strong>2013</strong>)<br />
23
Ruhaizin Sulaiman, Zahari Taha and Siti Zawiah Md. Dawal<br />
Tables 3 and 4, as well as Fig.13, show the results of the waist height of the elderly. It was<br />
found that 56.4% of the waist height of the elderly is lower than 36 inches (91.4cm).<br />
Referring to the heights of both the stoves and the waist, it was found that Malaysian elderly<br />
are working on a higher work-top, and therefore, they are exposed to discomfort and fatigue.<br />
The recommended stove height for Malaysian elderly is 82.6cm (32.5 inches). This is a little<br />
bit higher than the height of countertop for seated user which is between 28 – 32 inches (71cm<br />
– 81.3cm), as suggested by Peterson (1998). In order to fulfil the majority of the elderly stove<br />
height requirement, a range of stove height is more significant and it should be established. The<br />
5 th percentile of both the stove height (74.6cm) and waist height (82.6cm) could accommodate<br />
90% of the studied population. Therefore, the recommended range of stove height should be<br />
from 74.6 - 82.6cm (or 29.4 - 32.5 inches).<br />
The Working Envelope<br />
All the variables (namely, stature height, shoulder height, arm span, arm reach forward and waist<br />
height) were measured and analysed to identify the elderly working envelopes. The stature and<br />
shoulder height were meant for setting the overhead compartment height. Meanwhile, the arm<br />
span dimension is to set the width of kitchen cabinet and considering the left and right reaching.<br />
The arm reach forward is to set the work-top depth and the frontal reaching. Meanwhile,<br />
the waist height is to set the height of the work-top. In this study, the working envelope was<br />
calculated based on the 5 th percentile of the above variables so as to ensure that the space fit<br />
most subjects. Table 5 shows that the arm reach forward is 67.28cm (26.7 inches), while Fig.14<br />
reveals the frequency of arm reach forward. Table 6 shows that the height envelope is 138.14cm<br />
(or 54.4 inches). Meanwhile, the arm span (see Table 7) is 142.6cm (or 56.1 inches). Table 8<br />
shows the results of the shoulder height at 114.2cm (or 45.0 inches).<br />
The results of the arm span presented in Table 7 and Fig.16 are to identify the minimum<br />
length of the work-top. All the visited kitchens have a longer table top and this comply with<br />
the anthropometric of the studied population.<br />
TABLE 5: Statistics of arm reach forward<br />
ArmReach_Forward<br />
N Valid 55.0000<br />
Missing .0000<br />
Mean 76.1964<br />
Std. Deviation 4.8223<br />
Minimum 66.8000<br />
Maximum 89.5000<br />
Percentiles 5 67.2800<br />
50 76.0000<br />
95 85.5200<br />
24 <strong>Pertanika</strong> J. Sci. & Technol. <strong>21</strong> (1): 283 - 298 (<strong>2013</strong>)<br />
Fig.14: Frequency of arm reach forward
Application of Anthropometric Dimensions for Estimating Stove Height, Stove Depth and Cooking Task Envelope<br />
TABLE 6: Statistics of stature height<br />
Height<br />
N Valid 55.0000<br />
Missing .0000<br />
Mean 149.8055<br />
Std. Deviation 7.4186<br />
Minimum 135.0000<br />
Maximum 167.4000<br />
Percentiles 5 138.1400<br />
50 150.0000<br />
95 163.7600<br />
TABLE 7: Statistics of arm span<br />
Arm Span<br />
N Valid 55.0000<br />
Missing .0000<br />
Mean 155.8782<br />
Std. Deviation 8.1482<br />
Minimum 134.8000<br />
Maximum 172.8000<br />
Percentiles 5 142.6000<br />
50 155.6000<br />
95 170.2600<br />
TABLE 8: Statistics of Shoulder Height<br />
Shoulder Height<br />
N Valid 55.0000<br />
Missing .0000<br />
Mean 125.0109<br />
Std. Deviation 6.5600<br />
Minimum 111.5000<br />
Maximum 141.6000<br />
Percentiles 5 114.2000<br />
50 124.5000<br />
95 136.3200<br />
<strong>Pertanika</strong> J. Sci. & Technol. <strong>21</strong> (1): 283 - 298 (<strong>2013</strong>)<br />
Fig.15: Frequency of the stature height<br />
Fig.16: Frequency of arm span<br />
Fig.17: Frequency of shoulder height<br />
25
Ruhaizin Sulaiman, Zahari Taha and Siti Zawiah Md. Dawal<br />
According to Hignett and McAtamney (2000), the good work envelope should consider<br />
the limitations of body movements and measurements. Trunk flexion is within 0-20 degree and<br />
extension may reach 60 degree. Meanwhile, the neck movement is within 0-20 degree in flexion<br />
and extension. The knees flexion is within 30-60 degrees. The upper arm extension is within<br />
20 degree, while the flexion may be up to 90 degree and over. The lower arms flex is between<br />
60-100 degrees and over. As for the wrist movement, it is 0-15 degree, either in flexion or<br />
extension. Following these setting could avoid illness or syndrome from bad working envelope.<br />
According to Grey (1997), there are two worktop heights. One is for the use of small<br />
appliances which is 17-25cm (7-10inches) lower than the elbow height. The other is 5-10cm<br />
(3-4inches) below the users’ flexed elbow height while work on food preparation.<br />
On the other hand, Sharifah Norazizan et al. (2006) also measured the elderly elbow<br />
height and found that the mean of Malaysian elderly elbow height is 89.20cm for the females<br />
and this is 97.10 cm for the males. The average for both the means is 93.15cm. Therefore,<br />
the stove height for both genders is 68.15-76.15cm and the worktop height is 83.15-88.15cm<br />
based on Grey’s tolerances.<br />
Table 9 shows the estimating dimension of stove deep. In contrast with the high reach<br />
and easy reach dimensions, the 5 th percentile was used. This was done to ensure the optimum<br />
reach for majority of the studied population. Meanwhile, Woodson et al. (1992) stated that<br />
the counter width or deep dimensions should be between 16-24 inches (or 40.64 - 60.96cm).<br />
It was found that the proposed width or depth dimension (60.00-70.00cm) was above that of<br />
Woodson’s findings.<br />
Both the variables in this study are important in the sense of user friendly task performing<br />
and the recommended values should met requirement for most of the user populations, i.e. the<br />
‘design for the tall accommodates the small (Konz & Johnson, 2004).<br />
CONCLUSION<br />
Anthropometric measurements can be used to estimate the work envelope as well as to<br />
suggest the stove height, depth and length dimensions. It is also crucial for Malaysian elderly<br />
to have the right working envelope setting to avoid fatigue which could further contribute to<br />
musculoskeletal disorder (MSD) problem in the long-term. Besides, this could also improve<br />
safety, especially to avoid kitchen accident during meal preparations. It is suggested to further<br />
investigate other ADL or IADL tasks envelope and compare it with the anthropometrics of<br />
Malaysian elderly in order to improve their task performance and quality of life.<br />
Moreover, the future kitchen furniture design should incorporate ergonomics consideration,<br />
specifically the height and reaching distance of the users. The recommendations are stated in<br />
the last column of Table 9. In more specific, providing an ideal or custom stove length, width<br />
and height will hopefully reduce ergonomics issues of cooking and ensure user’s comfort. In<br />
order to accommodate 90% of the elderly population, the 5 th percentile of their waist height,<br />
arm span and arm reach forward data were used as the reference point for designing the stove<br />
height, length and depth. On the other hand, the elderly should also be exposed to a good meal<br />
preparation practice and basic understanding on ergonomics. According to Saxon and Etten<br />
(2002), the gerogogy approach of teaching should be adapted to the elderly so as to increase their<br />
26 <strong>Pertanika</strong> J. Sci. & Technol. <strong>21</strong> (1): 283 - 298 (<strong>2013</strong>)
Application of Anthropometric Dimensions for Estimating Stove Height, Stove Depth and Cooking Task Envelope<br />
ergonomics awareness towards performing any BADL, ADL and IADL. A good understanding<br />
and realization of self physical and physiological limitations may also help the elderly reduces<br />
exhaustion, muscle pain, eliminate fatigue and so forth upon completing certain tasks. It is<br />
hoped this doing this will further increase their independency and improve their well being.<br />
REFERENCES<br />
TABLE 9: A Comparison of the Standing Work Envelope<br />
* Estimating using Grey’s tolerances.<br />
Dawson, D., Hendershot, G., & Fulton, J. (1987). Functional Limitations of Individuals Age 65 Years<br />
and Over, Advanced Data, Vital and Health Statistics No. 133. US Public Health Service, Hyattsville,<br />
MD, June 10.<br />
Grey, J. (1997). Home Design Workbooks: Kitchen. London: Dorling Kindersley Limited.<br />
Hignett, S., & McAtamney, L. (2000). Rapid Entire Body Assessment (REBA). Applied Ergonomics,<br />
31, 201-205.<br />
Konz, S., & Johnson, S. (2004). Work Design: Occupational Ergonomics (6 th ed). Arizona: Holcomb<br />
Hathaway Publishers.<br />
Krengel, J. W., & Baczynski, B. (1997). Kitchens, Lifestyle and design. Glen Cove, N.Y.: PBC<br />
International Inc.<br />
Lee, C-M, Jeong, E-H, & Freivalds, A. (2001). Biomechanical effects of wearing high-heeled shoes.<br />
Int. J. Of Ind. Ergonomics, 28, 3<strong>21</strong>-326.<br />
McAtamney, L., & Corlett, N. (1993). RULA: a survey method for the investigation of work-related<br />
upper limb disorders. Applied Ergonomics, 24(2), 91-99.<br />
Opila, K., Wagner, S., Schiowitz, S., & Chen, J. (1988). Postural alignment in barefoot and high-heeled<br />
stance. Spine, 13(5), 542-547.<br />
Peterson, M. J. (1998). Universal kitchen and bathroom planning. New York: McGraw-Hill.<br />
Saxon, S. V., & Etten, M. J. (2002). Physical Change and Aging: A Guide for the Helping Professions<br />
(4 th ed). New York: Springer Publishing Company, Inc.<br />
Sharifah Norazizan, S. A. R., Rosnah, M. Y., Tengku Aizan, H., Ahmad Hariza, H., Aini, M. S., Mohd<br />
Rizal, H., Hirfarizan Mardianah, M. T., & Lina, G. S. C. (2006). Anthropometric data of older<br />
Malaysians. Asia Pacific <strong>Journal</strong> of Public Health. 18.<br />
<strong>Pertanika</strong> J. Sci. & Technol. <strong>21</strong> (1): 283 - 298 (<strong>2013</strong>)<br />
27
Ruhaizin Sulaiman, Zahari Taha and Siti Zawiah Md. Dawal<br />
Taha, Z., & Ruhaizin, S. (2008). Ergonomics Consideration in the Design of Products for the Elderly<br />
Population. Proceedings of the 9 th Asia Pacific Industrial Engineering & Management Systems<br />
Conference (APIEMS2008) (p. 309), Bali, Indonesia, December 3 rd – 5 th .<br />
Taha, Z., & Ruhaizin, S. (2010). Perceived Kitchen Environment among Malaysian Elderly. American<br />
<strong>Journal</strong> of Engineering and Applied Sciences 3(2), 270-276.<br />
Tilley, A. R. (2002). The Measure of Man and Woman: Human Factors in Design. New York: John<br />
Wiley & Sons, Inc.<br />
Wagner, D., Birt, J. A., Snyder, M., & Duncanson, J. P. (1996). Human Factors Design Guide: for<br />
acquisition of Commercial-Off-The-Shelf Subsystems, Non-developmental Items, and Developmental<br />
Systems. Final Report and Guide. FAA William J. Hughes Technical Center, USA. DOT/FAA/CT-96/1<br />
Woodson, W. E., Tillman, B., & Tillman, P. (19920. Human Factors Design Handbook (2nd ed.) New<br />
York: McGraw-Hill, Inc.<br />
28 <strong>Pertanika</strong> J. Sci. & Technol. <strong>21</strong> (1): 283 - 298 (<strong>2013</strong>)
ISSN: 0128-7680 © <strong>2013</strong> <strong>Universiti</strong> <strong>Putra</strong> Malaysia Press.<br />
<strong>Pertanika</strong> J. Sci. & Technol. <strong>21</strong> (1): 29 - 36 (<strong>2013</strong>)<br />
SCIENCE & TECHNOLOGY<br />
<strong>Journal</strong> homepage: http://www.pertanika.upm.edu.my/<br />
Different Media Formulation on Biocellulose Production by<br />
Acetobacter xylinum (0416)<br />
Suryani Kamarudin 1,2 *, Mohd Sahaid, K. 1 , Mohd Sobri, T. 1 , Wan Mohtar, W. Y. 3 ,<br />
Dayang Radiah, A. B. 2 and Norhasliza, H. 2<br />
1 Department of Chemical and Process Engineering, Faculty of Engineering and Build Environment,<br />
University Kebangsaan Malaysia, 43600 Bangi, Selangor, Malaysia<br />
2 Department of Chemical and Environmental Engineering, Faculty of Engineering, University <strong>Putra</strong><br />
Malaysia, 43400 Serdang, Selangor, Malaysia<br />
3 Department of Bioscience and Biotechnology, Faculty of Science, University Kebangsaan Malaysia, 43600<br />
Bangi, Selangor, Malaysia<br />
ABSTRACT<br />
Biocellulose (BC), produced by Acetobacter xylinum (0416), was carried out using three types of medium<br />
composition under static surface culture. The media used in this experiment included CWHSM (Coconut<br />
water in Hestrin-Schramm medium), CM (Complex medium) and HSM (Hestrin-Schramm medium).<br />
CWHSM and CM used coconut water from agro-waste as the main source of sugar. The fermentation<br />
was conducted for 12 days and the results of BC dry weight, cell entrapped, pH medium and productivity<br />
were evaluated and compared. The results show that CWHSM is the most suitable medium for BC<br />
production with a productivity of up to 0.044 g l -1 day -1 .<br />
Keywords: Acetobacter xylinum, agro-waste, biocellulose, coconut water, production medium<br />
Article history:<br />
Received: 1 February 2011<br />
Accepted: 4 October 2011<br />
E-mail addresses:<br />
suryani@eng.upm.edu.my (Suryani Kamarudin),<br />
sahaid@eng.ukm.my (Mohd Sahaid, K.),<br />
sobri@vlsi.eng.ukm.my (Mohd Sobri, T.),<br />
wantar@pkrisc.cc.ukm.my (Wan Mohtar, W. Y.),<br />
dayang@eng.upm.edu.my (Dayang Radiah, A. B.),<br />
snowiequeen809@yahoo.com (Norhasliza, H.)<br />
*Corresponding Author<br />
INTRODUCTION<br />
It is known that some Acetobacter strains<br />
produce cellulose. This cellulose is called<br />
bacterial cellulose (BC) (Ross et al., 1991).<br />
BC is a chemically pure form of cellulose<br />
and it is free from hemicellulose, pectin,<br />
and lignin, which are associated with plant<br />
cellulose and are difficult to eliminate<br />
(Bielecki et al., 2002; Jung et al., 2005).<br />
In addition, BC is extremely pure and it<br />
exhibits a high degree of polymerisation<br />
and crystallinity. BC has many applications
Suryani Kamarudin, et al.<br />
which include temporary artificial skin for the therapy of burns, ulcers and dental implants;<br />
it is also used as non-woven paper or fabric to improve latex or other binders and repair old<br />
documents, as sensitive diaphragms for stereo headphones, cellulose for immobilisation of<br />
proteins and chromatographic techniques, stabiliser for emulsions in cosmetics, food and<br />
coating compositions and edible cellulose for addition to food (Jonas & Farah, 1998).<br />
BC production has been demonstrated from glucose, sucrose, fructose, glycerol, mannitol<br />
and arabitol, among which mannitol and fructose are better carbon sources (Masaoka et al.,<br />
1993; Oikawa et al., 1995a; Oikawa et al., 1995b; Ross et al., 1991; Shoda & Sugano, 2005).<br />
The high economic cost of mannitol and fructose, as well as the relatively low-yield production<br />
with these carbon sources, limits industrial production and extended commercial applications<br />
of BC. Therefore, it is challenging and meaningful for us to look for a new approach to<br />
prepare a carbon source for high-yield BC production (Hong et al., 2007). There are many<br />
sources of carbon that have been experimentally verified as substrates but the elimination is in<br />
the method of preparation, which involves highly toxic chemicals and time consuming steps<br />
such as hydrolysis and detoxification. It is necessary for the substrate to be detoxified before<br />
being utilised.<br />
In this research, a relatively low-cost carbon source of culture media was successfully<br />
developed from agro-waste. The results indicate that coconut water, waste from copra and<br />
coconut milk industries with additional nutrient formulation could serve as a feedstock or<br />
potential media for bacterial cellulose production. Meanwhile, direct application of coconut<br />
water without involving any hydrolysis and detoxification steps makes it very economical as<br />
a main carbon source of media for BC production. The usage of coconut water as a medium<br />
substrate has also been suggested by Budhiono et al. (1999), but the formulation is totally<br />
different from the proposed medium in this study. Other than the nutrient, the significant<br />
difference was in the initial pH value of 4.5 for them and 6.0 for this study. With the aim to<br />
manipulate the waste into a valuable material, the waste from coconut water is turned into a<br />
valuable polymeric material for commercial application. The productivity and BC production<br />
rate are the important parameters in this study.<br />
MATERIALS AND METHODS<br />
The strain Acetobacter xylinum (0416) was supplied by the Malaysian Agricultural Research<br />
and Development Institute (MARDI) in Serdang, Selangor, Malaysia. Three types of media<br />
formulation for the new proposed medium are: (1) CWHSM (Coconut water in Hestrin-<br />
Schramm medium), (2) CM (Complex medium) as suggested by MARDI, and, (3) HSM<br />
(Hestrin-Schramm medium) as suggested by Hestrin and Schramm (1954). The composition<br />
of each medium is stated in Table 1. The fermentation was carried out in 250 ml conical flasks<br />
containing 100 ml of the medium for 12 days. Each flask was inoculated with a 3-day old<br />
preculture grown statically at 30°C. The dry weight of BC, cell entrapped within the pellicle,<br />
pH of the medium and productivity for each medium were evaluated and compared.<br />
30 <strong>Pertanika</strong> J. Sci. & Technol. <strong>21</strong> (1): 283 - 298 (<strong>2013</strong>)
Different Media Formulation on Biocellulose Production by Acetobacter xylinum (0416)<br />
TABLE 1: Composition of media used<br />
(1) CWHSM: Coconut<br />
water in HS medium<br />
Sodium hydrogen<br />
phosphate (Na 2HPO 4)<br />
Bacto peptone<br />
Yeast extract<br />
Citric acid<br />
Coconut water<br />
pH<br />
Strain A. xylinum<br />
Harvesting method<br />
2.7 g l -1<br />
5 g l -1<br />
5 g l -1<br />
1.15 g l -1<br />
Up to 1 l<br />
6.0<br />
100 ml<br />
MEDIUM COMPOSITION<br />
(2) CM: Complex medium (3) HSM: HS medium<br />
Sucrose<br />
Ammonium<br />
sulphate (NH4) 2SO4 Coconut water<br />
pH<br />
Strain A. xylinum<br />
80 g l -1<br />
5 g l -1<br />
Up to 1 l<br />
4.5<br />
100 ml<br />
<strong>Pertanika</strong> J. Sci. & Technol. <strong>21</strong> (1): 283 - 298 (<strong>2013</strong>)<br />
Glucose<br />
Sodium hydrogen<br />
phosphate<br />
(Na 2HPO 4)<br />
Bacto peptone<br />
Yeast extract<br />
Citric acid<br />
Distilled water<br />
pH<br />
Strain A. xylinum<br />
20 g l -1<br />
2.7 g l -1<br />
5 g l -1<br />
5 g l -1<br />
1.15 g l -1<br />
Up to 1 l<br />
6.0<br />
100 ml<br />
After removing the BC sample from the flask, the BC was washed twice with distilled water.<br />
Then, the gel was boiled in 0.5 M sodium hydroxide solution (NaOH) for 20 minutes to dissolve<br />
the cell entrapped within the pellicle. After that, it was drained and rewashed with distilled<br />
water several times. The gel was soaked in distilled water overnight to remove alkaline solution<br />
in the BC gel. The purpose of this step is to ensure that the alkaline used in this treatment is<br />
totally removed from the gel. This step was also performed to ensure that the degradation of<br />
BC would not occur as it could disturb the consistency of the BC dry weight measurement and<br />
the quality of the BC produced. Then, the gel was slowly dried in an oven at 40 o C for about<br />
5 hours. The dried gel sheets were weighed and the data were claimed as a dry weight of the<br />
BC production. The samples were stored in airtight cases.<br />
RESULTS AND DISCUSSION<br />
Fig.1 shows that M1-CWHSM (Coconut water in HS medium) gave the maximum BC<br />
production in the dry weight of product, followed by M2-CM (Complex medium) and the<br />
lowest was M3-HSM (HS medium). In order to get uniform results and for the purpose of<br />
comparison, the pre-culture used throughout the experiments was obtained from the same batch.<br />
The trend of the BC production in M1 and M3 is almost the same, while M2 remains constant<br />
throughout the experiment. A major difference observed between M1 and M3 formulation is<br />
only by substituting coconut water for the distilled water and glucose. The high production rate<br />
in M1 was probably because of the monosaccharide and disaccharides present in the medium,<br />
as suggested by Unagul et al. (2007), and which would have affected the metabolic pathway<br />
of the BC production. The highest production rate was obtained at day-8 of M1 by 0.343 g<br />
l -1 , which is approximately 4.0 fold higher than M3.<br />
31
Suryani Kamarudin, et al.<br />
Fig.1: The dry weight of BC in different fermentation media<br />
The metabolic pathway suggested by Serafica (1997) clearly states that glucose will directly<br />
convert to glucose-6-phosphate and phosphogluconic acid as a by-product. The precursors<br />
in cellulose synthesis are UDP-glucose and glucose, while sucrose and fructose are used as<br />
substrates for growth and BC formation. This is in a good agreement with the finding by<br />
Vandamme et al. (1998). When A. Xylinum is grown on a dextrose substrate (or a carbohydrate<br />
substrate of which it is a component), it was observed to have converted 26% of glucose into<br />
gluconic and 2-keto-gluconic acid (European Patent No. 86308092.5).<br />
Medium M3, which only contains glucose as a substrate, was consumed by about onethird<br />
into by-product and this limited the conversion to BC as a major product. This result<br />
was verified and shown in Fig.2 for pH profile for each medium. A comparison between M1<br />
and M3 clearly showed that a significant drop in pH was observed on day-4 of M3, which is<br />
strongly believed to be due to the accumulation of gluconic acid or acidic by-products in the<br />
medium. In more specific, the accumulation of acidic by-products is inversely proportional<br />
to the BC formation. Glucose for BC production was applied for the formation of other byproducts.<br />
The first reading at day-2 showed that the pH value had dropped significantly for<br />
all the media. After that, the increase in the pH of the medium was observed up to day-6 for<br />
M1; however, M2 remained constant throughout the fermentation time. Medium M1 was too<br />
flexible as compared to the others, which is strongly believed to be due to various types of<br />
carbohydrate (monosaccharide and disaccharide) that is present in the medium. This condition<br />
provides a chance for microorganisms to adapt with the mild environment and promotes<br />
growth and conversion of polysaccharide. The accumulation of one type of substrate, with<br />
high concentration results in the medium to fast conversion reduces the chances for microbes<br />
to convert glucose into BC. The profile pH for M3 almost fluctuated because of the conversion<br />
of BC and acidic by-products by the glucose substrate.<br />
Fig.3 shows the amount of cells entrapped within the BC pellicles plus water (wet state) in<br />
different medium formulations. The assumption was made that the amount of water that could<br />
be retained in the BC pellicle was almost the same. It is strongly believed that the amount of<br />
cells entrapped plus water is reflected in the amount of cells producing BC in the sample. It<br />
32 <strong>Pertanika</strong> J. Sci. & Technol. <strong>21</strong> (1): 283 - 298 (<strong>2013</strong>)
Different Media Formulation on Biocellulose Production by Acetobacter xylinum (0416)<br />
Fig.2: The pH of BC fermentation media<br />
Fig.3: The amount of cells entrapped plus water in different fermentation media (wet state)<br />
also represents active and viable cells that could synthesize BC. The BC pellicle formation<br />
mechanisms by A. xylinum cells is in a backward and forward motions of the Acetobacter cells<br />
known as reversal movements caused by synthesis of the cellulose (Shah & Malcolm, 2004).<br />
Recent research suggests that the build up of strain during the crystallisation of cellulose<br />
may be responsible for these reversals. The amount of cells entrapped within the pellicle is<br />
proportional to the BC production rate, as shown by media M1, M2 and M3. These results are<br />
in close agreement with those reported by Marx-Figini and Pion (1974); cellulose synthesis only<br />
occurs in growing bacterial populations and the yield of cellulose and the growth of bacterial<br />
populations obey the same reaction law, which is a first-order one. The fact that the cellulose<br />
synthesis only occurs when the bacteria is able to divide indicates that the production of BC<br />
must be combined with cell division itself or with some other events in the cell related to it<br />
(Marx-Figini & Pion, 1974).<br />
<strong>Pertanika</strong> J. Sci. & Technol. <strong>21</strong> (1): 283 - 298 (<strong>2013</strong>)<br />
33
Suryani Kamarudin, et al.<br />
Fig.4 shows the productivity of BC in different fermentation media, which is proportional<br />
to the dry weight of BC. The highest productivity was obtained by M1 at day-6 of incubation<br />
at 0.044 g l -1 day -1 . This means the M1 medium formulation shows excellent productivity<br />
compared to the other media. Hestrin and Schramm (1954) and Forng et al. (1989) reported<br />
that although various undefined and synthetic media have been developed for A. xylinum, more<br />
cellulose has been produced by the undefined medium compared to the synthetic medium.<br />
M1 medium formulation serves the most complex composition compared to the others, which<br />
covers the requirements for BC production.<br />
CONCLUSION<br />
Based on the results obtained in this experiment, it can be concluded that medium formulation<br />
M1 CWHSM can be a potential medium for production of BC. The advantage of CWHSM is<br />
that the medium substrate is easy to procure, as it can be locally sourced and is inexpensive as<br />
well. The use of coconut water, without any pre-treatment or hydrolysis, makes it very effective<br />
from the economic point of view. In addition, it does not involve toxic and hazardous materials<br />
in producing BC, which is excellent and suitable for safe environments such as medical and<br />
cosmetic applications. Moreover, the static surface culture fermentation also requires a low<br />
cost operation and is easy to perform.<br />
ACKNOWLEDGEMENTS<br />
The study was supported by an E-Science Fund Grant from the Ministry of Science Technology<br />
and Innovation (MOSTI).<br />
REFERENCES<br />
Bielecki, S., Krystynowicz, A., Turkiewicz, M., & Kalinowska, H. (2002) In E. J. Vandamme, S. De<br />
Baets, & A. Steinbuechel. Biopolymers. Weinheim: Wiley-VCH.<br />
Ben-Bassat, A., Bruner, R., Shoemaker, S. P., Aloni, Y., Wong, H., Johnson, D. C., & Naogi, A. N. (1987).<br />
European Patent No. 86308092.5.<br />
Budhiono, A., Rosidia B., Tahera, H., & Iguchib, M. (1999). Kinetic aspects of bacterial cellulose<br />
formation in nata-de-coco culture system. Carbohydrate Polymers, 40, 137 - 143.<br />
Forng, E. R, Anderson, S. M., & Cannon, R. E. (1989). Synthetic medium for Acetobacter xylinum<br />
that can be used for isolation of auxotrophic mutants and study of cellulose biosynthesis. Applied<br />
Environment Microbiology, 55(5), 1317 - 1319.<br />
Hestrin, S., & Schramm, M. (1954). Synthesis of cellulose by Acetobacter xylinum: preparation of freeze<br />
dried cells capable of polymerizing glucose to cellulose, Biochemical <strong>Journal</strong>, 58, 345.<br />
Hong, F., & Qiu, K. (2007). An alternative carbon source from konjac powder for enhancing production<br />
of bacterial cellulose in static cultures by a model strain Acetobacteraceti subsp. xylinus ATCC 23770,<br />
Carbohydrate Polymers, 72(3), 545 - 549.<br />
Jonas, R., & Farah, L. F. (1998). Production and application of microbial cellulose. Polymer Degradation<br />
and Stability, 59, 101 - 106.<br />
34 <strong>Pertanika</strong> J. Sci. & Technol. <strong>21</strong> (1): 283 - 298 (<strong>2013</strong>)
Different Media Formulation on Biocellulose Production by Acetobacter xylinum (0416)<br />
Jung, J. Y., Park, J. K., & Chang, H. N. (2005). Bacterial cellulose production by Gluconacetobacter<br />
hanseniiin an agitated culture without living non-cellulose producing cells. Enzyme and Microbial<br />
Technology, 37, 347 - 354.<br />
Marx-Figini, M., & Pion, B. G. (1974). Kinetic investigations on biosynthesis of cellulose by Acetobacter<br />
xylinum. Biochimicaet Biophysica Acta, 338, 382 - 393.<br />
Masaoka, S., Ohe, T., & Sakota, N. (1993). Production of cellulose from glucose by Acetobacter xylinum.<br />
<strong>Journal</strong> of Fermentation and Bioengineering, 75, 18 - 22.<br />
Oikawa, T., Morino, T., & Ameyama, M. (1995a). Production of cellulose from D-arabitol by Acetobacter<br />
xylinum KU-1. Bioscience Biotechnology and Biochemistry, 59, 1564 - 1565.<br />
Oikawa, T., Ohtori, T., & Ameyama, M. (1995b). Production of cellulose from D-mannitol by Acetobacter<br />
xylinum KU-1. Bioscience Biotechnology and Biochemistry, 59, 331 - 332.<br />
Ross, P., Mayer, R., & Benziman, M. (1991). Cellulose biosynthesis and function in bacteria. Microbiology<br />
and Molecular Biology Reviews, 55, 35 - 58.<br />
Serafica, G. C. (1997). Production of bacterial cellulose using a rotating disk film bioreactor by<br />
Acetobacter xylinum (PhD Thesis dissertation). Renselaer Polytechnic Institute.<br />
Shah, J., & Malcolm, B. R. Jr. (2004). US patent 60/507,961.<br />
Shoda, M., & Sugano, Y. (2005). Recent advances in bacterial cellulose production. Biotechnology and<br />
Bioprocess Engineering, 10, 1-8.<br />
Unagul, P., Assantachai C., Phadungruengluij S., Suphantharika, M., Tanticharoen, M., & Verduyn, C.<br />
(2007). Coconut water as a medium additive for the production of docosahexaenoic acid (C22:6n3)<br />
by Schizochytrium mangrovei Sk-02. Bioresource Technology, 98, 281 - 287.<br />
Vandamme, E. J, de Baets, S., Vanbaelen, A., Joris, K., & de Wulf, P. (1998). Improved production of<br />
bacterial cellulose and its application potential. Polymer Degradation Stability, 59, 93 - 99.<br />
<strong>Pertanika</strong> J. Sci. & Technol. <strong>21</strong> (1): 283 - 298 (<strong>2013</strong>)<br />
35
ISSN: 0128-7680 © <strong>2013</strong> <strong>Universiti</strong> <strong>Putra</strong> Malaysia Press.<br />
<strong>Pertanika</strong> J. Sci. & Technol. <strong>21</strong> (1): 37 - 44 (<strong>2013</strong>)<br />
SCIENCE & TECHNOLOGY<br />
<strong>Journal</strong> homepage: http://www.pertanika.upm.edu.my/<br />
Solving Delay Differential Equations by Using Implicit 2-Point<br />
Block Backward Differentiation Formula<br />
Heng, S. C.*, Ibrahim, Z. B., Suleiman, M. and Ismail, F.<br />
Mathematics Department, Faculty of Science, <strong>Universiti</strong> <strong>Putra</strong> Malaysia, 43400 Serdang, Selangor,<br />
Malaysia<br />
ABSTRACT<br />
In this paper, an implicit 2-point Block Backward Differentiation formula (BBDF) method was<br />
considered for solving Delay Differential Equations (DDEs). The method was implemented by using a<br />
constant stepsize via Newton Iteration. This implicit block method was expected to produce two points<br />
simultaneously. The efficiency of the method was compared with the existing classical 1-point Backward<br />
Differentiation Formula (BDF) in terms of execution time and accuracy.<br />
Keywords: Block Backward Differentiation formula, Delay Differential Equations, Interpolations<br />
INTRODUCTION<br />
In the recent years, the Mathematics society is gradually shifting their interest into numerical<br />
treatment of DDEs due to its ability in Mathematical modelling of processes in various<br />
applications as it provides the best, if not the only realistic simulation of the observed<br />
phenomena (Ismail et al., 2002). This is because many physical systems possess the feature of<br />
having a delayed respond in input conditions so that the rate at which processes occur depends<br />
not only on the current state of the systems but also the past states (Ismail 1999).<br />
Some of the known application areas of DDEs include the fields of Engineering, Biology<br />
and Economy, such as in mixing of liquid, population growth, prey-predator population model<br />
and electrodynamics (Driver 1976). The general form of the first order DDE is as follows:<br />
Article history:<br />
Received: 18 March 2011<br />
Accepted: 13 September 2011<br />
E-mail addresses:<br />
cerylyn@yahoo.com (Heng, S. C.),<br />
zarina@math.upm.edu.my (Ibrahim, Z. B.),<br />
msuleiman@science.upm.edu.my (Suleiman, M.)<br />
fudziah@science.upm.edu.my (Ismail, F.)<br />
*Corresponding Author<br />
y'( t) = f( t, yyt , ( −τ ),... yt ( −τ ), t≥ t (1)<br />
0<br />
1 n<br />
0<br />
yt () = φ(),<br />
t t≤ t<br />
(2)<br />
where ( t)<br />
φ is the initial function, and i<br />
τ is the<br />
delay function with i = 1, 2,..., n.<br />
According to<br />
Bellen and Zennaro (2003), the delays τ i or
Heng, S. C., Ibrahim, Z. B., Suleiman, M. and Ismail, F.<br />
lags as known to some, and which are always non-negative, can be divided into three different<br />
situations according to the complexity of the phenomenon. The delays may be just constant,<br />
which is referred to as the constant delay case, or the function of t, where τ i = τ i (t) which is<br />
referred to as the variable or time dependant delay case, or even the function of t and y itself,<br />
where τ i = τ i ( t, y( t)<br />
) , which is referred to as the state dependant delay case.<br />
Currently, most of the numerical methods for solving ordinary differential equations<br />
(ODEs) can be adapted to give corresponding techniques in solving DDEs. For example, stiff<br />
DDEs are recognized through the behaviour of ODEs. This is because of the solutions in the<br />
systems of DDEs, which may contain strongly damped components that rapidly approach<br />
equilibrium states (Roth, 1980). In general, the largest source of stiff DDEs is the stiffness in<br />
the ODEs components that are without the delay term. The stiffness of a linear system of ODEs<br />
y¢ = Ay is expressed as ratio ( max i | Re li | min i |Re l i | ) where l i are eigenvalues of A.<br />
For this reason, there are actually many numerical methods proposed for solving DDEs. The<br />
range of the methods comprises of one-step methods, as in Euler method and Runge-Kutta<br />
methods, as well as multistep methods and block implicit methods (Ismail, 1999). Among the<br />
proposed methods, the family of Runge-Kutta is the most famous numerical method used to<br />
solve DDEs.<br />
Research has shown various families of Runge-Kutta methods and interpolation techniques<br />
which are used to solve DDEs. Among other, Oberle and Pesch (1981) developed two numerical<br />
methods known as the Runge-Kutta-Fehlberg methods of orders 4 and 7 to solve DDEs.<br />
Hermite interpolation is used to approximate the delay term. Ismail et al. (2002) solved delay<br />
differential equations by using embedded Singly Diagonally Implicit Runge–Kutta method<br />
and the delay term was obtained by using Hermite interpolation.<br />
While most numerical methods to determine the solution for DDEs are based on the Runge-<br />
Kutta formulas, some opted for Adams and backward differentiation formula (BDF) methods<br />
to solve them. For instance, Bocharov et al. (1996) considered the application of the linear<br />
multistep methods for the numerical solution of initial value problem for stiff delay differential<br />
equations with several constant delays. As for the approximation of delayed variables, Bocharov<br />
et al. (1996) used Nordsieck’s interpolation technique.<br />
BLOCK BACKWARD DIFFERENTIATION FORMULA<br />
The purpose of this paper is to solve stiff DDEs using 2-point block backward differentiation<br />
formula (BBDF) method derived by Ibrahim et al. (2007). The corrector formulas are<br />
formulated as follows:<br />
1 2<br />
3 3<br />
yn+ 1=- yn- 1+ 2yn- yn+ 2+ 2hf<br />
n+<br />
1<br />
(3)<br />
2 9 18 6<br />
11 11 11 11<br />
yn+ 2 = yn- 1- yn+ yn+ 1+ hf n+<br />
2<br />
(4)<br />
38 <strong>Pertanika</strong> J. Sci. & Technol. <strong>21</strong> (1): 283 - 298 (<strong>2013</strong>)
Solving Delay Differential Equations by Using Implicit 2-Point Block Backward Differentiation Formula<br />
The numerical results were then compared to the classical 1-point backward differentiation<br />
formula (BDF). The corrector formula (Lambert, 1993) is given as:<br />
2 9 18 6<br />
yn+ 1= yn-2- yn- 1+ yn+ hf (5)<br />
n+<br />
1<br />
11 11 11 11<br />
In general, most numerical methods for solving differential equations produce only one<br />
new approximation value. However, the implicit block method can produce two new values<br />
simultaneously at each step. Thus, it is logically safe to presume that this particular method<br />
can reduce the timing of the calculation and its computational cost as well.<br />
IMPLEMENTATION OF THE METHOD<br />
Newton iteration is implemented in the method to evaluate the values of y n+<br />
1<br />
and y n+<br />
2 for solving equation [1]. The values for both y n+<br />
1 and y n+<br />
2 at ( i + 1)<br />
( i+<br />
1)<br />
( i+<br />
1)<br />
th iterative are given as y n+<br />
1 and y n+<br />
2 . According to Ibrahim et al. (2007), the<br />
Newton iteration takes the form of<br />
and<br />
Hence,<br />
æ ö<br />
ç f<br />
ç<br />
÷<br />
ç<br />
÷<br />
è ø÷<br />
( i)<br />
F1 y<br />
( i+ 1) ( i)<br />
n+<br />
1)<br />
n+ 1 = n+ 1- ' ( i)<br />
F1 yn+<br />
1<br />
y y<br />
( )<br />
( )<br />
( i)<br />
F2y ( i+ 1) ( i)<br />
n+<br />
2)<br />
n+ 2 = n+ 2- ' ( i)<br />
F2 yn+<br />
2<br />
y y<br />
( )<br />
( )<br />
n+<br />
1 ( i+ 1 ) ( i) () i () i () i<br />
1-2h ( yn+ 1 - yn+ 1) =-yn+ 1- yn+ 2+ 2hfn+<br />
1+ V 1<br />
yn+<br />
1<br />
3<br />
(8)<br />
æ 6 ö<br />
ç f ÷<br />
18 6<br />
ç ÷<br />
ç<br />
÷<br />
è ÷ ø<br />
n+<br />
2 ( i+ 1 ) ( i) () i () i () i<br />
1- h ( yn+ 2 - yn+ 2) = yn+ 1- yn+ 2+ hfn+<br />
2+ V 2<br />
11 yn+<br />
2<br />
11 11<br />
(9)<br />
where f<br />
y is a Jacobian and 1 V , V 2 are the back values.<br />
Let<br />
<strong>Pertanika</strong> J. Sci. & Technol. <strong>21</strong> (1): 283 - 298 (<strong>2013</strong>)<br />
2<br />
e = y -y<br />
(10)<br />
( i+ 1) ( i+ 1) ( i)<br />
n+ 1 n+ 1 n+<br />
1<br />
e = y -y<br />
(11)<br />
( i+ 1) ( i+ 1) ( i)<br />
n+ 2 n+ 2 n+<br />
2<br />
(6)<br />
(7)<br />
39
Heng, S. C., Ibrahim, Z. B., Suleiman, M. and Ismail, F.<br />
Then, equations [8] and [9] can be rewritten in the matrix form, as follows:<br />
é f 1 2 ù<br />
n+<br />
ê1-2 h(<br />
) ú é 2ù<br />
ê ( i+ 1) ê 1 ú () i é2 0 ù () i<br />
y 1 3 úé n e ù - -<br />
1 3<br />
é<br />
n y ù é<br />
n 1 f ù éVù + ê úê + ú ê ú + ê ú n+<br />
1 1<br />
= h<br />
( i+ 1) ê úê<br />
ú+ ê () i 6 úê<br />
ú+ ê ú (12)<br />
ê () i<br />
18 6 f úê<br />
n+ 2 e ú<br />
n 2 18 êy ú<br />
n 2 0 êf ú êVú ê<br />
+ + n+<br />
2 2<br />
1 h(<br />
) úë û ê ú<br />
1 ë û<br />
ê ú<br />
11<br />
ë û ë û<br />
ê<br />
- - - ê ú<br />
11 11 y ú ê ú ë û<br />
ê ê11 ú<br />
ë n+<br />
2 úû<br />
ë û<br />
In order to solve the above matrix equation, LU decomposition, which is a matrix<br />
decomposition that rewrites the matrix in the upper triangular matrix and lower triangular<br />
matrix was used (William et al., 2007).<br />
Let<br />
é æ f ö<br />
1 2 ù<br />
ê n<br />
1 2hç<br />
+ ÷<br />
ú<br />
ê<br />
- ç ÷<br />
yn+<br />
1 3 ú<br />
ê<br />
ç è ÷ ø<br />
ú<br />
A = ê ú<br />
ê 18 6 æ f öú<br />
n+<br />
2<br />
ê - 1-<br />
h ç<br />
÷ ú<br />
ê ÷<br />
11 11 è<br />
çç<br />
y ø÷<br />
ú<br />
ë n+<br />
2 û<br />
é 2ù<br />
ê-1- ú ( i) é2 0 ù ( i)<br />
ê 3úê<br />
éy ù<br />
n+ 1 ê úé<br />
f ù é n 1 V ù<br />
+ 1<br />
B= ê úê<br />
ú+ hê<br />
( i) 6 úê<br />
ú+ ê ú<br />
18 0<br />
( i<br />
ê úê<br />
ú )<br />
2 2 2<br />
1<br />
y ê úê<br />
ú<br />
n f êVú + n+<br />
ê - úë ûú ê ê ú<br />
11úë<br />
û ë û<br />
ê<br />
ë û<br />
ë11 úû<br />
é ( i+<br />
1)<br />
e ù<br />
n+<br />
1<br />
E = ê ú<br />
ê ( i+<br />
1)<br />
e ú<br />
ë n+<br />
2 û<br />
Suppose that matrix A is a product of the two matrices,<br />
40 <strong>Pertanika</strong> J. Sci. & Technol. <strong>21</strong> (1): 283 - 298 (<strong>2013</strong>)<br />
(13)<br />
(14)<br />
(15)<br />
AE × = B<br />
(16)<br />
LU × = A<br />
(17)<br />
where L is the lower triangular and U is the upper triangular. Thus,<br />
Let<br />
Hence,<br />
( LU × ) × E= B.<br />
(18)<br />
X = U× E.<br />
(19)<br />
L× X = B.<br />
(20)
Solving Delay Differential Equations by Using Implicit 2-Point Block Backward Differentiation Formula<br />
and then solving,<br />
U× E= X<br />
(<strong>21</strong>)<br />
to get the matrix value of E . Finally, the approximation values of y n+<br />
1 and y n+<br />
2 can be<br />
obtained. Furthermore, the existence of the delay term is the main difference between ODEs<br />
and DDEs. Thus, in order to get the numerical solutions for DDEs, the delay term needs to be<br />
solved in advance. For a situation where α ≤ t , the initial function φ 0<br />
( t)<br />
is used to calculate<br />
the delay term, y ( α ) . Otherwise, the delay term is calculated by using Newton Divided<br />
Difference interpolation.<br />
Meanwhile, the formula to calculate the delay term (Richard et al., 1993) can be written as:<br />
where zx [ ] = zx ( ) .<br />
n<br />
P( x) = zx [ ] + å zx [ , x, ¼, x]( x-x) ¼( x-x - )<br />
(22)<br />
n 0 0 1 k o k 1<br />
k=<br />
1<br />
0 0<br />
Equation [22] is known as the Newton’s interpolatory divided-difference formula.<br />
Normally, the delay terms are obtained by interpolation on the values of the chosen support<br />
points. In order to obtain these support points, the delay argument should be close to the centre<br />
of the points. However, if the delay argument under consideration is outside the points, it will<br />
be treated as a special case and it can only be obtained through extrapolation.<br />
PROBLEM TESTED<br />
The followings are some of the tested problems to get the numerical results. All the tested<br />
problems are stiff DDEs. The numerical results are obtained by using C language with constant<br />
stepsize, H.<br />
Problem 1:<br />
( )<br />
( ) ( ) ( )<br />
'<br />
y t yt yt t<br />
( )<br />
=- 1000 + -(ln 1000- 1 ) , 0 £ £ 3,<br />
-t<br />
yt= e , t£<br />
0.<br />
t<br />
Exact solution is yt ( ) e .<br />
-<br />
=<br />
Problem 2:<br />
- -<br />
( ) 1000 ( ) 997 ( 1) ( 1000 99 )<br />
' 3 3<br />
y t yt e yt e t<br />
=- + - + - 7 , 0 £ £ 3,<br />
( ) ( )<br />
yt= 1+ exp - 3 t, t£<br />
0.<br />
<strong>Pertanika</strong> J. Sci. & Technol. <strong>21</strong> (1): 283 - 298 (<strong>2013</strong>)<br />
41
Heng, S. C., Ibrahim, Z. B., Suleiman, M. and Ismail, F.<br />
Exact solution is yt ( ) = + ( - t)<br />
Problem 3:<br />
( ) ( )<br />
1 exp 3 .<br />
( -25)<br />
( )<br />
'<br />
y t 24yt e yt 1 t<br />
( )<br />
=- - - , 0 £ £ 3,<br />
( - ) t<br />
25<br />
yt= e , t£<br />
0.<br />
t<br />
Exact solution is yt ( ) e .<br />
-<br />
=<br />
NUMERICAL RESULTS AND DISCUSSION<br />
In this section, the numerical results showed the performance of block method in solving the<br />
first order stiff DDEs. All the results were obtained using the Microsoft Visual Studio 2010<br />
software on a personal computer with Intel Core2 Duo CPU. The abbreviations used are stated<br />
in Table 1.<br />
TABLE 1: List of Abbreviations<br />
Notation Description<br />
H Stepsize<br />
1BDF 1-point BDF method<br />
2BBDF 2-point BBDF method<br />
TS total number of steps<br />
MAXE Maximum error<br />
TIME CPU time in seconds<br />
The errors are calculated by using the following formulas:<br />
The maximum error, MAXE, is defined as:<br />
err = y - y<br />
(23)<br />
i i i<br />
t exact approximate<br />
1££<br />
i TS<br />
i ( errt<br />
)<br />
MAXE = max .<br />
(24)<br />
The numerical results are given in Table 2 to Table 4. In the results, the notation 9.75159e-<br />
004 represents the value of 9.75159 X 10 -4 . From the numerical results, it is clear that the total<br />
number of steps in solving 2-point BBDF is half of the steps needed to solve the 1-point BDF.<br />
The execution time for the 2-point BBDF is reduced up to 77% as compared to the 1-point<br />
BDF. Meanwhile, the maximum errors for 2-point BBDF method are better than the 1-point<br />
BDF for all the tested problems.<br />
42 <strong>Pertanika</strong> J. Sci. & Technol. <strong>21</strong> (1): 283 - 298 (<strong>2013</strong>)
Solving Delay Differential Equations by Using Implicit 2-Point Block Backward Differentiation Formula<br />
TABLE 2: Numerical results for Problem 1 1<br />
H METHOD TS MAXE TIME(seconds)<br />
10 -2 1BDF<br />
2BBDF<br />
10 -3 1BDF<br />
2BBDF<br />
10 -4 1BDF<br />
2BBDF<br />
10 -5 1BDF<br />
2BBDF<br />
300<br />
150<br />
3000<br />
1500<br />
30000<br />
15000<br />
300000<br />
150000<br />
9.75159e-004<br />
3.80236e-004<br />
3.22629e-007<br />
2.61239e-007<br />
1.45149e-008<br />
1.33568e-008<br />
1.73433e-010<br />
1.57914e-010<br />
<strong>Pertanika</strong> J. Sci. & Technol. <strong>21</strong> (1): 283 - 298 (<strong>2013</strong>)<br />
0.00836748<br />
0.00190863<br />
0.01103256<br />
0.00451134<br />
0.0374<strong>21</strong>93<br />
0.03079985<br />
0.29473164<br />
0.27820763<br />
1 The time of the execution of the 2-point BBDF for Problem 1 is about 77%, 59%, 17%, and 5% faster for the step-sizes of<br />
10 -2 , 10 -3 , 10 -4 , and 10 -5 , respectively. The smaller step-size obtained a small difference in the execution time. This is due<br />
to the total calculation of LU decomposition that requires matrix in 2BBDF.<br />
TABLE 3: Numerical results for Problem 2 2<br />
H METHOD TS MAXE TIME(seconds)<br />
10 -2 1BDF<br />
2BBDF<br />
10 -3 1BDF<br />
2BBDF<br />
10 -4 1BDF<br />
2BBDF<br />
10 -5 1BDF<br />
2BBDF<br />
300<br />
150<br />
3000<br />
1500<br />
30000<br />
15000<br />
300000<br />
150000<br />
8.73499e-003<br />
3.40594e-003<br />
2.88750e-006<br />
2.339<strong>21</strong>e-006<br />
1.30592e-007<br />
1.20176e-007<br />
1.56085e-009<br />
1.4<strong>21</strong>18e-009<br />
0.00843524<br />
0.00295110<br />
0.01167929<br />
0.00715678<br />
0.04287257<br />
0.03564649<br />
0.32652507<br />
0.30610835<br />
2 The time of the execution of the 2 point BBDF for Problem 2 is about 65%, 38%, 16%, and 6% faster for the respective<br />
step-sizes of 10 -2 , 10 -3 , 10 -4 , and 10 -5<br />
TABLE 4: Numerical results for Problem 3 3<br />
H METHOD TS MAXE TIME(seconds)<br />
10 -2 1BDF<br />
2BBDF<br />
10 -3 1BDF<br />
2BBDF<br />
10 -4 1BDF<br />
2BBDF<br />
10 -5 1BDF<br />
2BBDF<br />
300<br />
150<br />
2000<br />
1500<br />
20000<br />
15000<br />
200000<br />
150000<br />
4.63438e-002<br />
4.411<strong>21</strong>e-002<br />
1.00359e-003<br />
9.28409e-004<br />
1.10170e-005<br />
9.97473e-006<br />
1.11197e-007<br />
1.00464e-007<br />
0.00857305<br />
0.00296303<br />
0.01145794<br />
0.00553071<br />
0.03680099<br />
0.02976354<br />
0.26814825<br />
0.26649446<br />
3 The time of the execution of the 2-point BBDF for Problem 3 is about 65%, 51%, 19%, and 1% faster for the stepsizes<br />
of 10 -2 , 10 -3 , 10 -4 , and 10 -5 , respectively<br />
43
CONCLUSION<br />
Heng, S. C., Ibrahim, Z. B., Suleiman, M. and Ismail, F.<br />
In this paper, it was observed that the 2-point BBDF achieved better results in terms of the<br />
accuracy of the method as well as the execution time. Therefore, it can be concluded that the<br />
2-point BBDF is suitable for solving stiff DDEs.<br />
ACKNOWLEDGEMENTS<br />
This work was fully supported by the Institute of Mathematical Research, <strong>Universiti</strong> <strong>Putra</strong><br />
Malaysia, under the Fundamental Scheme Research Grant (Project code: 01-09-09-681FR).<br />
REFERENCES<br />
Bellen, A., & Zennaro, M. (2003). Numerical Methods for Delay Differential Equations. New York:<br />
Oxford University Press.<br />
Bocharov, G. A., Marchuk, G. I., & Romanyukha, A. A. (1996). Numerical solution by LMMs of Stiff<br />
Delay Differential systems modelling an Immnune Response. Numer. Math., 73, 131-148.<br />
Driver, R. D. (1976). Ordinary and Delay Differential Equations. New Year: Springer-Verlag.<br />
Ibrahim, Z. B., Othman, K. I., & Suleiman, M. (2007). Implicit r-point Block Backward Differentiation<br />
Formula for Solving First Order Stiff ODEs. Applied Mathematics and Computation, 186, 558-565.<br />
Ismail, F. (1999). Numerical Solution of Ordinary and Delay Differential Equations by Runge-Kutta<br />
Type Methods (Ph.D Thesis dissertation). <strong>Universiti</strong> <strong>Putra</strong> Malaysia, Malaysia.<br />
Ismail, F., Al-Khasawneh, R. A., Lwin, A. S., & Suleiman, M. (2002). Numerical Treatment of Delay<br />
Differential Equations by Runge-Kutta Method Using Hermite Interpolation. Matematika, 18(2),<br />
79-90.<br />
Lambert, J. D. (1993). Numerical Methods for Ordinary Differential Systems: The Initial Value Problem.<br />
Chichester, England: John Wiley and Sons.<br />
Oberle, H. J., & Pesch, H. J. (1981). Numerical Treatment of Delay Differential Equations by Hermite<br />
Interpolation. Numer. Math., 37, 235-255.<br />
Richard, L., Burden, J., & Douglas, F. (1993). Numerical Analysis. Boston: PWS-Kent Pub. Co.<br />
Roth, M. G. (1980). Difference Methods for Stiff Delay Differential Equations (Master Thesis<br />
dissertation). University of Illinois, Illinois.<br />
William, H. P., Saul, A. T., William, T. V., & Brian, P. F. (2007). Numerical Recipes: The Art of Scientific<br />
Computing. New York: Cambridge University Press.<br />
44 <strong>Pertanika</strong> J. Sci. & Technol. <strong>21</strong> (1): 283 - 298 (<strong>2013</strong>)
ISSN: 0128-7680 © <strong>2013</strong> <strong>Universiti</strong> <strong>Putra</strong> Malaysia Press.<br />
<strong>Pertanika</strong> J. Sci. & Technol. <strong>21</strong> (1): 45 - 58 (<strong>2013</strong>)<br />
SCIENCE & TECHNOLOGY<br />
<strong>Journal</strong> homepage: http://www.pertanika.upm.edu.my/<br />
Effects of Process Temperature and Time on the Properties of<br />
Microwave Plasma Nitrided Ti-6Al-4V Alloy<br />
Y. Yusuf*, J. M. Juoi, Z. M. Rosli, W. L. Kwan and Z. Mahamud<br />
Faculty of Manufacturing Engineering, <strong>Universiti</strong> Teknikal Malaysia Melaka, Durian Tunggal, 76109<br />
Melaka, Malaysia<br />
ABSTRACT<br />
Titanium alloy (e.g. Ti-6Al-4V) has an excellent combination of properties. However in many cases,<br />
the application is limited because of the poor wear property. In this work, a surface modification<br />
(plasma nitriding) is carried out to improve the surface properties of Ti-6Al-4V, as a treatment prior to a<br />
hardcoating deposition, leading to a duplex coating system. This is an effort to improve the surface and<br />
near surface property of Ti-6Al-4V. Plasma nitriding is performed utilizing microwave plasma method<br />
in 25% Ar- 75% N 2 atmosphere at temperatures of 600°C and 700°C for different processing times (1,<br />
3 and 5 hours). The phase and microstructure of plasma nitrided substrate were characterized by using<br />
X-ray diffraction (XRD) and Scanning electron microscopy (SEM). The plasma nitrided Ti-6Al-4V<br />
properties (surface roughness, surface hardness and case depth) were determined using profilometer<br />
and microhardness, respectively. Results obtained showed a significant increase on the surface hardness<br />
of Ti-6Al-4V. This is due to the formation of TiN and Ti 2N phases in the form of compound layer.<br />
Besides, it shows that the diffusion of nitrogen into the Ti-6Al-4V substrate produces case depth up to<br />
130 µm and this contributes to the improvement of the near surface hardness due to the changes in the<br />
microstructures. It was also found that the surface hardness and surface roughness increased with the<br />
increases in the process temperature and times.<br />
Keywords: Ti-6Al-4V, surface modification, plasma nitriding, microwave plasma<br />
Article history:<br />
Received: 26 April 2011<br />
Accepted: 22 November 2011<br />
E-mail addresses:<br />
yusliza.yusuf@yahoo.com (Y. Yusuf),<br />
jariah@utem.edu.my (J. M. Juoi),<br />
zmr@utem.edu.my (Z. M. Rosli),<br />
Kwailoon86@gmail.com (W. L. Kwan),<br />
zainab.mahamud86@gmail.com (Z. Mahamud)<br />
*Corresponding Author<br />
INTRODUCTION<br />
Titanium and its alloys have received<br />
extensive interest due to their excellent<br />
combination of properties, such as excellent<br />
corrosion resistance, high strength to weight<br />
ratio, high strength at elevated temperatures,<br />
low modulus elasticity and biological<br />
compatibility. Besides, titanium and its alloys
Y. Yusuf, J. M. Juoi, Z. M. Rosli, W. L. Kwan and Z. Mahamud<br />
are widely used for a range of applications in the aerospace, automotive, marine, chemical<br />
and biomedical industries.<br />
The most common titanium alloy used is Ti-6Al-4V. The reasons for the success of this<br />
particular type of alloy are its beneficial properties (e.g. high strength to weight ratio and<br />
corrosion resistance), making it remarkable for technical application varying from construction<br />
materials to medical implant materials. However, Ti-6Al-4V is found to be inconsiderably<br />
utilized in mechanical engineering applications, as in sliding systems (Ma et al., 2004). This is<br />
because of its poor tribological properties such as poor abrasive wear resistance, poor fretting<br />
behaviour and high coefficient of friction (Zhecheva et al., 2005). When the untreated titanium<br />
alloy surface is in rubbing contact with another material, even though being lubricated, there<br />
is a strong tendency for galling to take place leading to severe wear (Bell 1993).<br />
Therefore, surface modifications become a fundamental requirement when Ti-6Al-4V is<br />
subjected to wear problem. Some examples of surface modifications of Ti-6Al-4V that are<br />
usually carried out are the deposition of hardcoating by chemical vapour deposition (CVD) or<br />
physical vapour deposition (PVD) techniques and thermochemical treatment such as diffusion<br />
techniques. However, the restriction on common use of hardcoating on Ti-6Al-4V substrate<br />
is the load carrying the capacity of the coating-substrate system with correlated to the soft<br />
substrate beneath the coating (Ma et al., 2004). As a consequence, delamination and premature<br />
failure of the hardcoating on the surface of Ti-6Al-4V components under wear conditions have<br />
been observed (Yetim et al., 2008). In order to prevent the failure, a surface modification (e.g.<br />
thermochemical treatment) is required intended as a pre-treatment to Ti-6Al-4V substrate before<br />
the hardcoating deposition with reference to the duplex coating concept.<br />
Thus, the thermochemical treatment involving diffusion of the substrate material with<br />
different elements is an option for improvement in Ti-6Al-4V surface and near surface<br />
property. Diffusion treatment like plasma nitriding can increase the wear resistance, decrease<br />
the coefficient of friction and certainly harden the surface of materials (Yetim et al., 2009).<br />
The high reactivity of titanium with respect to nitrogen, oxygen and carbon is an advantage to<br />
produce high hardness of surface layer, making the diffusion treatment particularly interesting<br />
to improve the wear property of Ti-6Al-4V. Processes such as oxidation, carburizing and<br />
nitriding are among popular thermochemical treatments used to improve the surface properties<br />
of titanium alloy, especially Ti-6Al-4V (Holmberg & Matthews, 2009).<br />
In conducting thermochemical treatment on the substrate, the utilization of plasma<br />
advantageously reduces the duration of process. This is due to the diffusion of high energy<br />
ions and intensification of the elements (nitrogen, oxygen, carbon) transportation from the<br />
surface to the substrate core. Besides, the process parameters such as temperature and time<br />
are available for the modification to improve the surface properties such as phase composition,<br />
microstructure and surface morphology (Zhecheva et al., 2005).<br />
A common method used for thermochemical process of Ti-6Al-4V is plasma nitriding.<br />
The nitrogen used has high solubility in α-Ti phase, and it therefore strengthens the surface<br />
layer significantly. Modification on the surface layer of plasma nitride Ti-6Al-4V consists of<br />
a compound layer on top of the surface with TiN and Ti 2N phases. The presence of TiN and<br />
Ti 2N phases has significant effect on the surface hardness of Ti-6Al-4V (Yildiz et al., 2008;<br />
Lakshmi, 2002). Underneath the compound layer is the diffusion layer which consists of an<br />
46 <strong>Pertanika</strong> J. Sci. & Technol. <strong>21</strong> (1): 283 - 298 (<strong>2013</strong>)
Effects of Process Temperature and Time on the Properties of Microwave Plasma Nitrided Ti-6Al-4V Alloy<br />
interstitial solution of nitrogen in the α-Ti phase (Yildiz et al., 2008). The diffusion layer is<br />
also known to improve the hardness properties of Ti-6Al-4V with the formation of case depth<br />
profile (Yildiz et al., 2008).<br />
Various methods have been used by other researchers to ensure the success of the plasma<br />
nitriding process including Direct Current (DC) and Radio Frequency (RF) methods. DC plasma<br />
nitriding method is the most widely used. In this method, plasma is created by an electrical<br />
discharge between the two electrodes. According to Yildiz et al. (2008), the DC technique<br />
formed dense TiN phase as process temperature and time were increased, while the Ti 2N phase<br />
disappeared when the process temperature and time were increased. Besides, Yilbas et al.,<br />
(1996) utilised the DC plasma nitriding method and also found that the diffusion of nitrogen<br />
increased with the increase in the surface temperature.<br />
Another method used by researchers for the plasma nitriding process is RF plasma nitriding<br />
method. In this method, plasma is produced when the electrons absorb power from the RF field,<br />
and then transmit it through collisions of electrons with the gaseous atoms. The installation<br />
of RF is per the industrial band standard (13.56 MHz) in order to avoid interference with<br />
communication network (Chattopadhyay, 2004). The RF plasma nitriding also produces TiN<br />
and Ti 2N phases with significant improvement on the surface hardness of Ti-6Al-4V. These also<br />
lead to the improvements of wear resistance (Fouquet et al., 2004; El-Hossary et al., 2006).<br />
Another method that can generate plasma for the nitriding process is microwave plasma<br />
nitriding method. The advantages of this method are due to its efficiency in generating<br />
the plasma and it is also readily available at low cost of 2.45 GHz microwave generators<br />
(Chattopadhyay, 2004). Besides, it requires low pressure as compared to the DC and RF<br />
methods. In addition, it applies magnetic field to encourage the formation of plasma. This<br />
study aimed to understand the effects of process parameters (e.g. temperature and time) on the<br />
microstructure and mechanical properties of microwave plasma nitride Ti-6Al-4V substrate.<br />
EXPERIMENTAL<br />
The samples used for this study is Ti-6Al-4V, with the following chemical compositions<br />
(wt %): Al (6), V (4) and Ti (balance). The samples were cut from a long rod, with 10mm ×<br />
25mm (thickness × diameter) and mechanically polished for surface roughness, Ra< 0.5. After<br />
polishing, the sample was cleaned using ultrasonic cleaning in ethanol bath for 15 minutes<br />
and then dried using hot air dryer.<br />
The sample was put inside the chamber and evacuated by a rotary pump until the pressure<br />
reached 10 -2 mTorr (Fig.1), and subsequently cleaned by hydrogen plasma with an overall<br />
pressure of 15 mTorr for 5 minutes. The samples were then heated to the required temperature<br />
(600 o C, 700 o C) and nitrogen along with argon gas was introduced into the microwave source<br />
(1kW, 2.45GHz) to produce plasma. The operating pressure in the chamber was fixed at 30<br />
mTorr, and the flow rates of the N 2 and Ar gas mixtures were set at 25% (Ar): 75% (N 2). The<br />
nitriding temperatures were monitored and performed for 1hr, 3hr and 5 hr.<br />
X-ray diffraction (XRD) for phase identification was carried out with X’Pert PRO system<br />
with monochromatic Cu Kα radiation in θ - 2θ geometry. All the XRD patterns were obtained<br />
with scan steps of 0.01 o and a counting time of 40s. The surface roughness of the samples was<br />
<strong>Pertanika</strong> J. Sci. & Technol. <strong>21</strong> (1): 283 - 298 (<strong>2013</strong>)<br />
47
Y. Yusuf, J. M. Juoi, Z. M. Rosli, W. L. Kwan and Z. Mahamud<br />
measured using Mitutoyo SJ 301 surface profilometer with SR10 tip type. Cross sectional<br />
metallographic examination was carried out using a scanning electron microscope (Zeiss).<br />
Prior to that, the cross sectioned area was ground and polished to produce mirror-like finish<br />
surface and the surface was etched using Kroll’s reagent to reveal the microstructures. For the<br />
purpose of mechanical property study, Mitutoyo microhardness tester with Vickers indenter was<br />
employed with 100g load to measure the surface hardness and 25g for the case depth profile<br />
for the cross sectioned samples. The choice of load was based on the measurable indentation<br />
size produced during the experimental work. The lower load used for the case depth profiling<br />
was to avoid overlapping of indentation.<br />
RESULTS<br />
As received<br />
The XRD patterns of as received Ti-6Al-4V revealed that the sample consisted of α-Ti (ICDD:<br />
00-001-1198) and β-Ti (ICDD: 00-044-1288), as shown in Fig.2 and the SEM cross-sectioned<br />
micrograph is shown in Fig.3. It is shows that the microstructures consist of equiaxed α phases<br />
and fine acicular shape for the β transform phases. As for the surface roughness, the average Ra<br />
value obtained was 0.23 ± 0.03 µm and the surface hardness value was 349.04 ± 4.77 HV 0.1.<br />
The Effects of Process Temperature and Time<br />
Phase Composition<br />
Fig.1: A schematic diagram of the Microwave plasma reactor<br />
The XRD pattern of plasma nitride surface of the substrate revealed the formation of TiN<br />
phases with cubic structures (ICDD: 01-087-0633) and Ti 2N phases with tetragonal structure<br />
(ICDD: 01-0076-0198) (Fig.4). In addition, the diffraction peaks show that the TiN phases<br />
has a dominant (highest intensity) at [111] plane, while Ti 2N phases have a dominant at [111]<br />
plane. It was also observed that the diffraction pattern at both process temperatures (600°C and<br />
700°C), the α-Ti of [100], [002] and [101] peaks were shifted to lower 2θ side. Whereas, the β-Ti<br />
48 <strong>Pertanika</strong> J. Sci. & Technol. <strong>21</strong> (1): 283 - 298 (<strong>2013</strong>)
Effects of Process Temperature and Time on the Properties of Microwave Plasma Nitrided Ti-6Al-4V Alloy<br />
Fig.2: The XRD patterns of as received Ti-6Al-4V substrate<br />
Fig.3: The SEM micrograph of the cross-sectioned of as-received Ti-6A1-4V substrate<br />
peak (Observed in the as received Ti-6Al-4V) was not detected in the plasma nitrided samples.<br />
In general, as the temperature increased, changes on the peak intensities of TiN [111]<br />
and [200] and Ti 2N [<strong>21</strong>0] peaks were observed. The intensity of TiN [111] peak of the sample<br />
600°C 3 hours was double the intensity of α-Ti [002], but for the 700°C 3 hours sample, the<br />
intensity was almost the same. The intensity of TiN [200] was almost the same with that of<br />
Ti 2N [<strong>21</strong>0] peak for 600°C 5 hours sample, but for the 700°C 5 hours sample, the intensity<br />
of TiN [200] was more than 2 times higher than Ti 2N [<strong>21</strong>0]. However, these changes did not<br />
affect conclusion made on the type of phase present in the samples. While the intensity of Ti 2N<br />
[111] peak showed increases with the decrease of the process temperature. This is evident in<br />
the samples nitrided for 5 hours at 600°C and 700°C. In contrast, as the process time increased,<br />
the intensities of TiN [111] and [200] and Ti 2N [<strong>21</strong>0] peaks showed irregular changes in the<br />
intensities. Meanwhile, the Ti 2N [111] peak intensities increased as the process time increased.<br />
<strong>Pertanika</strong> J. Sci. & Technol. <strong>21</strong> (1): 283 - 298 (<strong>2013</strong>)<br />
49
Y. Yusuf, J. M. Juoi, Z. M. Rosli, W. L. Kwan and Z. Mahamud<br />
Fig.4: The XRD pattern of microwave plasma nitrided at various process temperatures and times<br />
Microstructures<br />
The SEM micrographs on the cross-sectioned plasma nitride samples revealed that the variation<br />
in the microstructure is visible at the depth of 120 µm (Fig.5). Throughout this depth, 3 distinct<br />
regions with different microstructures were observed. As the process temperature and time<br />
increased, the outermost layer was apparently observed. Underneath this continuous outermost<br />
layer, a distinct layer with lamellar and acicular structures was found to exist. These lamellar<br />
and acicular structures grew bigger with the increase of process temperature. Besides, the<br />
distinct layer was observed broadening with the increase of process time.<br />
50 <strong>Pertanika</strong> J. Sci. & Technol. <strong>21</strong> (1): 283 - 298 (<strong>2013</strong>)
Effects of Process Temperature and Time on the Properties of Microwave Plasma Nitrided Ti-6Al-4V Alloy<br />
<strong>Pertanika</strong> J. Sci. & Technol. <strong>21</strong> (1): 283 - 298 (<strong>2013</strong>)<br />
Fig.5: The SEM micrograph of the cross-sectioned microwave plasma nitrided Ti-6Al-4V at various of process temperatures and times, indicating the<br />
case depth obtained for each sample<br />
51
Surface Roughness<br />
Y. Yusuf, J. M. Juoi, Z. M. Rosli, W. L. Kwan and Z. Mahamud<br />
The surface roughness, Ra of the as received and microwave plasma nitrided Ti-6Al-4V alloy<br />
at various temperatures and time is shown in Fig 6. It shows that the plasma nitriding process<br />
increased the Ra value of the nitrided samples as compared to the as received alloy. In general,<br />
the Ra value increased as of the process temperature and time increased. However, the increase<br />
of Ra value was less obvious for the samples nitrided at 700°C for 3 hours and 5 hours.<br />
Surface Hardness<br />
The surface hardness of plasma nitrided Ti-6Al-4V samples was found to be higher as compared<br />
to the as received sample (Fig.7). This means that the surface hardness for the plasma nitrided<br />
samples increased as the process temperature and time increased. The highest value was<br />
observed for the sample nitrided at 700°C for 5 hours and the lowest value was observed at<br />
Fig.6: The surface roughness of the as received and microwave plasma nitrided Ti-6Al4V at various<br />
temperatures and times.<br />
Fig.7: The surface hardness results of the as received and microwave plasma nitrided Ti-6Al-4V at<br />
various temperatures and times<br />
52 <strong>Pertanika</strong> J. Sci. & Technol. <strong>21</strong> (1): 283 - 298 (<strong>2013</strong>)
Effects of Process Temperature and Time on the Properties of Microwave Plasma Nitrided Ti-6Al-4V Alloy<br />
the sample nitrided at 600°C for 1 hour. It should be noted that major increment on the surface<br />
hardness is due to the increase of temperature. This is evident for the sample nitrided for 1 hour<br />
at 600°C and 700°C, whereby the surface hardness of the sample was 911.97 ± 9.45 HV 0.1 at<br />
600°C and 1034.32 ± 7.98 HV 0.1 at 700°C, respectively. In contrast, less significant increment<br />
of the surface hardness was observed for the sample nitrided at the same temperature, namely,<br />
the sample nitrided at 700°C for 3 hours the surface hardness was 1105.79 ± 9.84 HV 0.1 and<br />
with 5 hours, the surface hardness was 1194.5 ± 11.8 HV 0.1.<br />
Case Depth Profile<br />
Fig.8 shows the case depth profile of the microwave plasma nitrided samples in varying process<br />
temperatures and times. The hardness of as received Ti-6Al-5V is 350 ± 4.26 HV 0.025. Thus,<br />
it is considered as the hardness limit (core hardness). It was found that the highest hardness<br />
obtained was at the near surface area region. The hardness gradually decreased with the depth<br />
of the sample and finally reached the hardness limit (core hardness). This represents the case<br />
depth profile for each sample. It was also observed that the case depth profile increased with the<br />
increases of process temperatures and times. In particular, the highest case depth was obtained<br />
(130µm) in the sample nitrided at 700°C 5 hours.<br />
Fig.8: The case depth profile of microwave plasma nitrided Ti-6Al-4V at various of process<br />
temperatures and times<br />
<strong>Pertanika</strong> J. Sci. & Technol. <strong>21</strong> (1): 283 - 298 (<strong>2013</strong>)<br />
53
DISCUSSION<br />
Y. Yusuf, J. M. Juoi, Z. M. Rosli, W. L. Kwan and Z. Mahamud<br />
During microwave plasma nitriding, process parameter (temperature and time) plays a<br />
significant role on the microstructures and mechanical properties of the plasma nitrided Ti-6Al-<br />
4V substrate. The new phases, such as TiN and Ti 2N, were observed at 600°C for 1 hour. This<br />
parameter (600°C 1 hour) was lower processing parameter compared to other study (utilizing<br />
RF plasma) where a moderate parameter, 700°C 4 hours was required to form the TiN phase<br />
(Fouquet et al., 2004). This finding is in agreement with suggestion made by Yildiz et al.<br />
(2008), whereby it was mentioned that the Ti 2N phase is formed at the temperature < 700°C.<br />
However, there is an increase in the Ti 2N peak intensities with the process time increases, and<br />
this is in contrast with the result by Yildiz et al. (2008) which indicated that the intensity of<br />
Ti 2N decreased as the process time increased using the DC plasma method.<br />
The determination of TiN and Ti 2N phases indicates that the compound layer is formed on<br />
the plasma nitrided Ti-6Al-4V surface at the process parameter of 600°C 1 hour. The formation<br />
of this particular compound layer during nitriding of titanium is as per in the schematic<br />
presentations of the kinetics of formation and the growth of surface layers during nitriding<br />
of titanium suggested by Zhecheva et al. (2005) (see Fig.9). This is also supported with the<br />
SEM micrograph cross section of the samples (Fig.5), where the existence of compound layer<br />
was observed on the outermost layer. The compound layer thickness increased as the process<br />
temperature and time increased.<br />
The XRD pattern of the nitrided samples at 600°C and 700°C shows that the TiN phase<br />
has a dominant peak at [111] and [200] planes. This is in agreement with the findings by Yildiz<br />
et al. (2008) and Fouquet et al. (2004). Besides, Ti 2N phase has dominant planes at [111] and<br />
Fig.9: A schematic presentation of the kinetics of formation and growth of surface layers during<br />
nitriding of titanium (Zhecheva et al., 2005)<br />
54 <strong>Pertanika</strong> J. Sci. & Technol. <strong>21</strong> (1): 283 - 298 (<strong>2013</strong>)
Effects of Process Temperature and Time on the Properties of Microwave Plasma Nitrided Ti-6Al-4V Alloy<br />
[<strong>21</strong>0], but these findings contradict with the results obtained by Raaif et al. (2007) and Fouquet<br />
et al. (2004), where the Ti 2N dominant planes at [<strong>21</strong>0] and [111]. This variation seems to be<br />
due to the different types of nitriding gases used, such as Raaif et al. (2007) who utilized pure<br />
nitrogen plasma and Fouquet et al. (2004) who utilized hydrogen. It was also observed that the<br />
Ti 2N phase is highly oriented and depending on the composition of gas (Raveh et al., 1989).<br />
Besides, the diffraction pattern of α-Ti phases with [100], [002] and [101] planes shifted to<br />
lower θ side and the peaks were broadened as the process time increased. This is due to the<br />
enlargement of α-Ti cell caused by the nitrogen atoms, where the compressive residual stresses<br />
occur (Yildiz et al., 2008). This also explains the undetected β-Ti peak as suggested by Yildiz<br />
et al. (2008).<br />
In term of surface roughness, it was observed that it increased with the increases of the<br />
process temperature and time. This is consistent with findings by Yildiz et al. (2008) using the<br />
DC method and Fouquet et al. (2004) who used the RF method. The increase of the surface<br />
roughness of plasma nitrided Ti-6Al-4V alloy was probably due to the cones formed by the<br />
effect of ions bombardment during the nitriding process (Yildiz et al., 2008). This increment<br />
might also be caused by the enlargement of the α-Ti structures, as shown in the SEM micrograph<br />
of cross-sectioned microwave plasma nitrided samples (Fig.5). The α-Ti structures were<br />
observed to have enlarged during the plasma nitiriding process and grown as the process<br />
temperature increased. Consequently, this contributed to the roughness of the outer layer. In<br />
addition, it was also observed that when the process time increased, the growth α-Ti structure<br />
was more prominent leading to the agglomeration of the TiN grain forming a compound layer.<br />
As a result, a less significant increase in the surface roughness was observed. For example, at<br />
700°C for 3 hours, Ra is 0.508 ± 0.063, while for 5 hours Ra is 0.515 ± 0.035.<br />
The improvement of microwave plasma nitrided surface hardness samples is suggested<br />
by the existence of Ti 2N and TiN phases in the form of compound layer, the finding which has<br />
also been observed by El-Hossary et al. (2006). Besides, the increase in the surface hardness<br />
is also parallel with the increase of Ti 2N and TiN peak intensities. It was observed that the<br />
highest surface hardness of 1194.5 ± 11.81 HV 0.1 was obtained in this study when the microwave<br />
plasma method at 700°C for 5 hours was used. As a comparison, another study conducted by<br />
El-Hossary et al. (2006) utilizing the RF plasma method produced the hardness of nearly 600<br />
HV 0.1 at 725°C. Meanwhile, Yildiz et al. (2008) utilized the DC plasma method to produce a<br />
hardness of 1180 HV 0.1 at 700°C for 4 hours. Thus, it can be seen that the microwave plasma<br />
method is able to produce a high surface hardness of plasma nitrided Ti-6Al-4V at a comparable<br />
of process parameter. Also, it was observed that the increase in the surface hardness is in<br />
conjunction with the increase of the compound layer thickness. This is evident when looking<br />
at the SEM micrographs of the cross-sectioned samples (Fig.5) where the thickest compound<br />
layer observed for the sample nitrided at 700°C for 5 hour yielded the highest surface hardness<br />
of 1194.5 ± 11.81 HV 0.1.<br />
Generally, the case depth hardness is high at near surface area (
Y. Yusuf, J. M. Juoi, Z. M. Rosli, W. L. Kwan and Z. Mahamud<br />
In addition, the case depth profile is in agreement with the cross-sectioned plasma nitrided<br />
samples observed in the SEM micrograph (Fig.5). To make a comparison with the other<br />
method, Yildiz et al. (2008) who had utilized DC reported the case depth of 50 µm for the<br />
sample nitrided at 700°C for 1 hour. In this study, the case depth was found to be 100 µm for<br />
the sample nitrided at 700°C for 1 hour.<br />
CONCLUSION<br />
In the current work, the plasma nitriding process of Ti-6Al-4V alloy was conducted utilizing<br />
the microwave plasma technique. The following conclusions are made based on the findings<br />
of this study:<br />
1. The TiN and Ti 2N phases in the form of compound layer were observed for the sample<br />
nitrided at the temperature as low as 600°C for 1 hour. The thickness of this compound<br />
layer increased with the increases in the nitriding temperature and time.<br />
2. The surface hardness increased with process temperature and time and is related to the<br />
formation of the compound layer.<br />
3. The diffusion of nitrogen into the Ti-6Al-4V substrate produced a case depth up to 130<br />
µm. This contributes to the improvement of hardness value of near surface area and causes<br />
changes in the microstructure.<br />
4. The surface roughness of the plasma nitrided Ti-6Al-4V samples increases with the<br />
increases in process temperature and time.<br />
ACKNOWLEDGEMENTS<br />
This work was supported by PJP/2009/FKP (24A) S629 research grant from the Centre of<br />
Research and Innovation Management (CRIM), <strong>Universiti</strong> Teknikal Malaysia Melaka (UTeM).<br />
REFERENCES<br />
Bell, T. (1993). Engineering the surface to combat wear. Thin Films in Tribology, 25, 27-37.<br />
Chattopadhyay, R. (2004). Advanced thermally Assisted Surface Engineering process (pp. 149-155).<br />
Mumbai: Kluwer Academic Publishers.<br />
El-Hossary, F. M., Negm, N. Z., Khalil, S. M., & Raaif, M. (2006). Surface modification of titanium by<br />
radio frequency plasma nitriding. Thin Solid Films, 497, 196-202.<br />
Fouquet, V., Pichon, L., Drouet, M., & Straboni, A. (2004). Plasma assisted nitridation of Ti-6Al-4V.<br />
Applied Surface Science, 2<strong>21</strong>, 248-258.<br />
Holmberg, K., & Matthews, A. (2009). Coating Tribology properties, Mechanisms, Techniques and<br />
Applications in Surface Engineering, pp. 29-31 (2nd Edition), Amsterdam, Elseivier.<br />
Lakshmi, S. G. (2002). Surface modification and characterisation of Ti-Al-V alloys. Materials Chemistry<br />
and Physics, 76, 187-190.<br />
Ma, S., Xu, K., & Jie, W. (2004). Wear behaviour of the surface of Ti-6Al-4V alloy modified with pulsed<br />
D.C. plasma–duplex process. Surface and Coatings Technology, 185, 205-209.<br />
56 <strong>Pertanika</strong> J. Sci. & Technol. <strong>21</strong> (1): 283 - 298 (<strong>2013</strong>)
Effects of Process Temperature and Time on the Properties of Microwave Plasma Nitrided Ti-6Al-4V Alloy<br />
Raveh, A., Hansen, P. L., Avni, R., & Grill, A. (1989). Microstructure and composition of plasma nitride<br />
Ti-6Al-4V layers. Surface and Coatings Technology, 38, 339-351.<br />
Raaif, M., El-Hossary, F. M., Negm, N. Z., Khalil, S. M., & Schaaf, P. (2007). Surface treatment of Ti-<br />
6AL-4V alloy by rf plasma nitriding. <strong>Journal</strong> of Physics: Condensed Matter 19, 1-12.<br />
Yetim, A. F., Alsaran, A., Efeoglu, I., & Celik, A. (2008). A comparative study: The effect of surface<br />
treatments on the tribological properties of Ti-6Al-4V alloy. Surface and Coatings Technology, 202,<br />
2428-2432.<br />
Yetim, A. F., Yildiz, F., Vangolu, Y., Alsaran, A., & Celik, A. (2009). Several plasma diffusion processes<br />
for improving wear properties of Ti-6Al-4V alloy. Wear, 276, <strong>21</strong>79-<strong>21</strong>85.<br />
Yilbas, B. S., Sahin, A. Z., Al-Garni, A. Z., M.Said, S. A., Ahmed, Z., & Abdulaleem, B. J. (1996).<br />
Plasma nitriding of Ti-6Al-4V alloy to improve some tribological properties. Surface and Coatings<br />
Technology, 80, 287-292.<br />
Yildiz, F., Yetim, A. F., Alsaran, A., & Celik, A. (2008). Plasma nitriding behaviour of Ti-6Al-4V<br />
orthopeadic alloy. Surface and Coatings Technology, 202, 2471-2476.<br />
Zhecheva, A., Sha, W., Malinov, S., & Long, A. (2005). Enhancing the microstructure and properties<br />
of titanium alloys through nitriding and other surface engineering methods. Surface and Coatings<br />
Technology, 200, <strong>21</strong>92-2207.<br />
<strong>Pertanika</strong> J. Sci. & Technol. <strong>21</strong> (1): 283 - 298 (<strong>2013</strong>)<br />
57
ISSN: 0128-7680 © <strong>2013</strong> <strong>Universiti</strong> <strong>Putra</strong> Malaysia Press.<br />
<strong>Pertanika</strong> J. Sci. & Technol. <strong>21</strong> (1): 59 - 74 (<strong>2013</strong>)<br />
SCIENCE & TECHNOLOGY<br />
<strong>Journal</strong> homepage: http://www.pertanika.upm.edu.my/<br />
Modelling of Motion Resistance Ratios of Pneumatic and Rigid<br />
Bicycle Wheels<br />
Ahmad, D. 1 , Jamarei, O. 1 , Sulaiman, S. 1 , Fashina, A. B. 2 and Akande, F. B. 2 *<br />
1 Faculty of Engineering, <strong>Universiti</strong> <strong>Putra</strong> Malaysia, 43400 Serdang, Selangor, Malaysia<br />
2 Department of Agricultural Engineering, Ladoke Akintola University of Technology, Ogbomoso, Nigeria<br />
ABSTRACT<br />
The motion resistances of 660 mm pneumatic and rigid bicycle wheels of the same rim diameter were<br />
measured experimentally using the developed tractor-towed single non-lug narrow wheel motion<br />
resistance test rig for traction studies. The motion resistances measured were taken to be the towing forces<br />
determined in real time using Mecmesin Basic Force Gauge (BFG 2500). The test variables included two<br />
test surfaces [tilled and wet (mud) surfaces], the dynamic load and the towing velocity. The tyre inflation<br />
pressure of 414 kPa was chosen to make the surface synonymous with that of the rigid wheel. Motion<br />
resistance ratios of the two wheels were determined empirically and through semi-empirical approach. The<br />
motion resistances of the rigid wheel were found to be greater than those of the pneumatic wheel for both<br />
surfaces. Consequently, the motion resistance ratios of the rigid wheel were greater than those obtained<br />
from the pneumatic wheel. Analysis of variance showed that there were significant differences between<br />
the means of the motion resistance measured on the test surfaces, as well as between the two wheels<br />
and their interactions with the test surfaces. The motion resistance ratio exhibited a linear relationship<br />
with the towing velocity, while the relationship with the dynamic load was quadratic. However, such a<br />
relationship is either direct or inverse with the respective variables. The motion resistance ratio models<br />
for the pneumatic and rigid wheels showed that on different test conditions of the dynamic loads and<br />
the towing velocities, the relationships between the motion resistance ratio and the dynamic load, and<br />
motion resistance with dynamic load were also different.<br />
Keywords: Motion resistance, motion resistance ratio, pneumatic and rigid wheels, dynamic load, towing<br />
velocity, test surface, regression models<br />
Article history:<br />
Received: 26 April 2011<br />
Accepted: 24 June 2011<br />
E-mail addresses:<br />
desa@eng.upm.edu.my (Ahmad, D.),<br />
jamarei@eng.upm.edu.my (Jamarei, O.),<br />
suddin@eng.upm.edu.my (Sulaiman, S.),<br />
bola_fashina@yahoo.com (Fashina, A. B.),<br />
fbukkyakande@yahoo.com (Akande, F. B.)<br />
*Corresponding Author<br />
INTRODUCTION<br />
Motion resistance is defined as the force<br />
required to overcome the frictional force<br />
between the surface of the tyre and the terrain<br />
upon which it rolls in the direction of travel.<br />
It is also known as the towing force (Code
Ahmad, D., Jamarei, O., Sulaiman, S., Fashina, A. B. and Akande, F. B.<br />
2003, R2009; Arregoces, 1985; Elwaleed, 1999). The other pertinent measures of the tractive<br />
performance are net traction ratio, gross traction ratio and tractive efficiency (Elwaleed, 1999;<br />
Gheissari & Loghavi, 2010). Plackett (1985) presented the work of Bernstein (1913) and stated<br />
the relationship between tyre inflation pressure (p) and sinkage level (z) in the process of rut<br />
formation and with soil factor (n-an exponent of soil deformation) and the coefficient or the<br />
modulus of soil deformability (k), as stated in Equation 1. This relationship forms the basis of<br />
most research in mobility studies.<br />
n<br />
p = kz<br />
[1]<br />
Single wheel testers have been developed for both indoor and field mobility tests by a<br />
number of researchers, and each researcher has defined performance measure (Yahya et al.,<br />
2007; Pope, 1971; Gotteland & Benoit, 2006; Kawase, Nakashima, & Oida, 2006; Gheissari &<br />
Loghavi, 2010). All these devices measure at least the input parameter torque T, and rotational<br />
speed ω, as well as the output parameters, pulling force F p and the driven velocity v of the<br />
wheel (Schreiber & Kutzbach, 2007).<br />
Mathematical models were derived for predicting the mobility number, wheel numeric<br />
for cohesive soil and for sandy soils, motion resistance ratios, net traction ratio, and tractive<br />
efficiencies, with respect to a particular tyre and test surface or terrain. Table 1 summarises<br />
some of the existing models and the respective researchers. However, a singular model cannot<br />
be used to represent all types of agricultural tyres and test surfaces because of the variation in<br />
the tyre design parameters and the soil and the system parameters.<br />
TABLE 1: Existing wheel numeric, mobility number, and motion resistance ratio models<br />
S/N Measurement Parameters Models Source<br />
1 Mobility Number, M 1<br />
CIbd d 1 2<br />
Nc = ( )[ ]<br />
W h b<br />
1+<br />
2d<br />
Turnage (1972)<br />
2 Wheel Numeric /Refined<br />
Mobility No (rigid wheel),<br />
Cn<br />
CIbd<br />
Cn =<br />
W<br />
3 Brixius Mobility Number,<br />
d<br />
Bn 1+ 5<br />
CIbd<br />
Bn = [ h ]<br />
W b<br />
1+ 3<br />
d<br />
4 Motion Resistance Ratio 1 0.5<br />
M RR = 0.04 + +<br />
B B<br />
5 Coefficient of Rolling<br />
Resistance<br />
CRR<br />
0.287<br />
= 0.04+<br />
M<br />
n n<br />
60 <strong>Pertanika</strong> J. Sci. & Technol. <strong>21</strong> (1): 283 - 298 (<strong>2013</strong>)<br />
Wismer and Luth<br />
(1974)<br />
Brixius (1987)<br />
Brixius (1987)<br />
Gee-Clough et al.<br />
(1978)
Modelling of Motion Resistance Ratios of Pneumatic and Rigid Bicycle Wheels<br />
Researchers are interested in reducing motion resistance force so as to generate higher<br />
drawbar pull from the traction device of any agricultural vehicle (Plackett, 1985). The<br />
relationship between drawbar pull (P), net traction (H) and motion resistance (R) is stated in<br />
Equation 2 (Macmillan, 2002).<br />
P= H- R<br />
[2]<br />
Motion resistance ratio is preferred to motion resistance in the tractive performance of<br />
agricultural wheel or off-road traction and transport devices (Arregoces, 1985; Code, 2003,<br />
R2009) , and it is defined mathematically as the ratio of the motion resistance to the dynamic<br />
load acting on the wheel (see Equation 3). This relationship is found applicable in the empirical<br />
determination of the motion resistance ratio. With the measured motion resistance and the<br />
dynamic load on the wheel, the motion resistance ratio can be calculated using Equation 3,<br />
as follows:<br />
( ) MR<br />
MRR t = [3]<br />
W<br />
where MR is the motion resistance force suffered by the wheel and W is the normal load on<br />
the wheel. Saarilahti (2003) classified motion resistance ratios into good, fair and poor, as<br />
shown in Table 2.<br />
TABLE 2: Mobility classes based on motion resistance ratio<br />
Mobility and Trafficability Class Motion Resistance Ratio<br />
Good<br />
Fair<br />
Poor<br />
0.30<br />
<strong>Pertanika</strong> J. Sci. & Technol. <strong>21</strong> (1): 283 - 298 (<strong>2013</strong>)<br />
(Source: Saarilahti, 2003)<br />
The semi-empirical or the analytical prediction of motion resistance ratios involves the<br />
measurements of tyre design parameters such as tyre overall wheel diameter (d), tyre deflection<br />
(δ), tyre sectional width (b), and tyre sectional height (h). Dynamic load (W) is also measured<br />
as the system parameter and the main soil parameter is the soil resistance to penetration (cone<br />
index) (Wismer & Luth, 1974; Wong, 1984; Pandey & Tiwari, 2006). All these parameters<br />
are substituted into the existing models so as to get mobility numbers or wheel numeric. This<br />
mobility number or wheel numeric is further substituted into the existing motion resistance<br />
ratio models.<br />
Elwaleed (1999) developed motion resistance ratio, net traction ratio, and tractive<br />
efficiency for upland rice tyre. He found that the same model could not be used to generalise<br />
the tractive performance characteristics of all tyres. Other researchers also investigated the<br />
tractive performance of different agricultural tyre types. Each of these motion resistance<br />
models developed by Wismer and Luth (1974), and Brixius (1987), was derived for typical<br />
agricultural tyres.<br />
61
Ahmad, D., Jamarei, O., Sulaiman, S., Fashina, A. B. and Akande, F. B.<br />
Pneumatic wheel (tyre) is a structural vessel which holds a volume of air under pressure<br />
in order to support the vertical load imposed by a vehicle (Plackett, 1985). Unlike pneumatic<br />
wheels, rigid wheels do not have rubberised carcass materials and do not work under air<br />
pressure. Earlier research conducted has shown that the rigid wheels behave similarly to<br />
pneumatic wheels at high inflation pressures (Wang & Reece, 1984).<br />
The use of narrow bicycle wheels as traction members in the development of simple<br />
agricultural machines for low income farmers and rural dwellers is paramount. The motion<br />
resistance ratios predictions for the bicycle wheel will be useful in the design of such simple<br />
machines to boost their agricultural productivity. The objectives of this study were to compare<br />
the motion resistance and motion resistance ratios of both the pneumatic and rigid bicycle<br />
wheels on deformable surfaces using empirical and semi-empirical approaches. In addition,<br />
models for predicting the motion resistance ratios of towed pneumatic and rigid bicycle wheels<br />
on both the tilled and wet surfaces using the two methods were also derived. The effect of the<br />
towing velocity was also modelled on both wheels and test surfaces.<br />
MATERIALS AND METHOD<br />
The empirical and analytical prediction methods were used to obtain the motion resistance ratio<br />
data used for model development. The motion resistance ratios obtained from the experimental<br />
measurements of the towing force and the dynamic load were compared with those obtained<br />
from the analytical prediction. The coefficients of variation obtained between the two sets of<br />
data were used as multiplying factors to the Brixius’s (1987) motion resistance ration model<br />
to obtain a model for the pneumatic and rigid bicycle wheels.<br />
Tilled and wet surfaces were considered for this study and the models were developed with<br />
respect to the two test surfaces. The soil physico-mechanical properties of the test surfaces are<br />
presented in Table 3 according to ASTM (2005).<br />
TABLE 3: Some soil physico-mechanical properties of the tilled and wet Surfaces<br />
Soil Properties Values (Range of values) in Designated Unit<br />
Soil Textural Classification<br />
Sandy-clay-loam (60% sand, 32% clay, 8% silt).<br />
Soil Bulk Density<br />
Liquid Limit<br />
Plastic Limit<br />
Soil Moisture Contents range<br />
Cone Index (CI) range of the Tilled Surface<br />
Cone Index (CI) range of the Wet Surface<br />
Soil Strength<br />
1.48 kg/m 3 – 1.72 kg/m 3 (mean = 1.55 kg/m 3 db)<br />
28.06% db<br />
11.14% - 24.26% db (mean = 17.09%db)<br />
10.75% - 15.63% wb (Tilled Surface)<br />
35.7% - 45% wb (Wet Surface)<br />
0.6 MPa -1.8 MPa (mean CI = 1.15 Mpa)<br />
0.7 MPa – 1.4MPa (mean CI = 1.15 MPa)<br />
Tilled Surface: 63.5 kPa-65 kPa (mean= 64.42 kPa)<br />
Wet – surface: 20 kPa-30 kPa (mean = 24.75kPa)<br />
62 <strong>Pertanika</strong> J. Sci. & Technol. <strong>21</strong> (1): 283 - 298 (<strong>2013</strong>)
The Empirical Method<br />
Modelling of Motion Resistance Ratios of Pneumatic and Rigid Bicycle Wheels<br />
Fig.1 shows a complete test rig developed for motion resistance measurement as a subset of<br />
the traction studies on non-lug narrow wheel. The data acquisition system part of the test rig<br />
comprising of the Mecmesin Basic Force Gauge 2500 (BFG 2500) RS interfaced with the<br />
notebook PC is capable for real time data acquisition of the towing force (motion resistance).<br />
The Test Variables<br />
The test variables considered for this study were the test wheels (pneumatic and the rigid<br />
wheels), four levels of dynamic loads (98.1 N, 196.2 N, 392.4 N and 588.6 N), by taking into<br />
consideration the average weight of human being of 60kg (588.6 N) and the load bearing<br />
capacity of the selected tyre. Two test surfaces (tilled and the wet surfaces), and the three<br />
levels of towing velocities (4.44 km/h, 6.3 km/h and 8.28 km/h) were selected to investigate<br />
the effect of towing velocity on the motion resistance ratio, as shown in the subsequent section.<br />
The Effect of Towing Velocity<br />
Three levels of towing velocities of 4.44 km/h, 6.3 km/h and 8.28 km/h were selected. This is<br />
as a result of different agricultural operations requiring different operating velocities (speeds).<br />
The motion resistances and soil cone indices were taken with regard to the empirical and<br />
semi-empirical approaches for the determinations of the motion resistance ratios. The process<br />
was repeated three times and the average data were taken and recorded for each level of<br />
towing velocities for both the pneumatic and the rigid wheel. The tyre inflation pressure of<br />
5<br />
4<br />
1-Test wheel, 2-Load hanger, 3-Load, 4- The BFG, 5- Three-Point<br />
Hitch Frame, 6-connecting cable and 7- Notebook PC<br />
Fig.1: The complete Test Rig attached to the Towing Tractor<br />
<strong>Pertanika</strong> J. Sci. & Technol. <strong>21</strong> (1): 283 - 298 (<strong>2013</strong>)<br />
7<br />
6<br />
2<br />
3<br />
1<br />
63
Ahmad, D., Jamarei, O., Sulaiman, S., Fashina, A. B. and Akande, F. B.<br />
the pneumatic wheel was kept at a constant inflation pressure of 414 kPa, as this pressure was<br />
assumed to be equal to the tyre surface of the rigid wheel. Meanwhile, the inflation pressure<br />
of the tyre was continuously checked to ensure that it was constant throughout the study.<br />
Rigid Wheel Description<br />
The tyre and tube of the 660 mm diameter steel rim pneumatic wheel were removed. A length<br />
of 2075 mm of galvanised sheet plate (1.5 mm in thickness and 50 mm in width) was welded<br />
round the circumference of the rim. The 50 mm width tyre having the same thread pattern as<br />
the pneumatic wheel with equal length as the sheet metal plate was cut and glued onto the<br />
sheet metal covering the rim. For rigidity, the two materials were also joined at the edge by a<br />
number of bolts and nuts at an interval of 100 mm round the wheel. Fig.2 shows a schematic<br />
diagram of the rigid wheel.<br />
Test Surface Preparation<br />
The preparation for data acquisition on the different test surfaces was different. The tests were<br />
conducted in one direction only, with the aim to maintain the same test surface condition<br />
(slope) for all the tests.<br />
The undisturbed soil of 45 m x 20 m, located at Taman Pertanian <strong>Universiti</strong> (TPU-<br />
University Agricultural Park), was first ploughed and after 48 hours, the rotavator was used to<br />
break the large clods into smaller soil clods which were similar to soil bed preparation ready<br />
for planting operation. The tests conducted afterwards used the soil moisture probe that was<br />
attached to the Eijkelkamp (Netherlands) soil penetrologger series (series 06.15.SA) for in<br />
situ moisture content measurement. The average soil moisture content was then calculated<br />
and the range is as stated in Table 3. The field was re-prepared by using a rotavator to make<br />
Fig.2: The Constructed Rigid Bicycle Wheel<br />
64 <strong>Pertanika</strong> J. Sci. & Technol. <strong>21</strong> (1): 283 - 298 (<strong>2013</strong>)
Modelling of Motion Resistance Ratios of Pneumatic and Rigid Bicycle Wheels<br />
the soil surface even and loose to ensure uniform test conditions. The distance of tractor travel<br />
during the test from the starting to the end point was set at 35 m for all the tests conducted on<br />
the tilled surface.<br />
A bottom-opened box of a size of 20 m x 0.6 m x 0.2 m was installed in the same tilled field.<br />
The dimensions of the box, especially the width and the height, were chosen with reference to<br />
the test tractor chassis (wheel base and the height). For the tests conducted on the wet surface,<br />
the test distance was set at 20m, which is the length of the box. Prior to the test and in between<br />
the test, the box was flooded with water and mixed with the soil so as to get the desired wet<br />
surface condition. The average soil moisture contents recorded on the wet surface during the<br />
test are as stated in Table 3.<br />
Procedure for Data Acquisition<br />
The tractor towing the test rig was prepared to be in a very good condition for the test. The<br />
test rig was assembled (i.e. the test wheel was fixed to the test rig). The first level of an added<br />
dynamic load (dead weight) of 98.1 N (10kg) was screwed to the load hanger and the tyre<br />
inflation pressure of 414 kPa was maintained. The data acquisition system was put on to<br />
facilitate real-time data transfer to the Dataplot software installed on the notebook PC for<br />
data acquisition. The test distance (between the starting and ending points) was marked. The<br />
tractor was allowed to attain a steady velocity of 4.44 km/h for all the tests, except for the<br />
tests conducted to investigate the effects of towing velocities before the starting point, while<br />
the start icon on the Dataplot environment was also initiated. The real-time data acquisition<br />
to measure the towing force (N) against the time taken (seconds) in the form of Force –Time<br />
graph was taken progressively until the end point, i.e. when the stop icon was also clicked to<br />
stop the data transfer and the plot. The minimum, maximum and the average towing forces<br />
(motion resistance) were obtained from the dataplot. Each of the treatments was replicated three<br />
times and the average of at least 95% was taken of the measured data around the mean (µ ±2δ).<br />
The Analytical Prediction Method (Semi-empirical Approach)<br />
The mobility number models derived by Brixius (1987) were used for the prediction of the<br />
motion resistance ratio, which was also derived by Brixius (1987). Equations 4 and 5 present<br />
the Brixius (1987) models for mobility number and motion resistance ratio respectively.<br />
However, Equation 5 had been modified (as presented in Equation 6) as the slip component of<br />
that equation is zero (0) for the towed wheels (Gee-Clough et al., 1978; Naderi et al., 2008).<br />
M<br />
d<br />
1+ 5<br />
CIbd<br />
Bn = [ h ]<br />
W b<br />
1+ 3<br />
d<br />
RR<br />
<strong>Pertanika</strong> J. Sci. & Technol. <strong>21</strong> (1): 283 - 298 (<strong>2013</strong>)<br />
[4]<br />
1 0.5<br />
= 0.04 + + [5]<br />
B B<br />
n n<br />
65
Ahmad, D., Jamarei, O., Sulaiman, S., Fashina, A. B. and Akande, F. B.<br />
1<br />
= 0.04 + [6]<br />
B<br />
66 <strong>Pertanika</strong> J. Sci. & Technol. <strong>21</strong> (1): 283 - 298 (<strong>2013</strong>)<br />
M<br />
RR<br />
Equations 5 and 6 are dependent upon Equation 4; therefore, the mobility number was<br />
determined from Equation 4, and the value substituted into Equation 6 to determine the motion<br />
resistance ratio.<br />
Procedure for Data Acquisition for the Semi-empirical Approach Method<br />
These soil resistances to penetration were measured on the surfaces (path) where the motion<br />
resistances were already measured experimentally using the cone penetrologger. Three readings<br />
were taken as applicable to the empirical method and the average values were processed for<br />
the prediction of the mobility number and the motion resistance ratio.<br />
The procedure for the empirical measurement of the motion resistance on the wet surface<br />
was similar to that of the tilled surface. The cone indices were also measured in a similar way<br />
to those obtained for the tilled surface. However, the surface of the test wheel, which was in<br />
contact with the test surface, was cleaned after every test to ensure similar tyre surface. The test<br />
surface was regularly reconditioned to the original state by closing the rut formed during the<br />
test and disturbing the test surface and making the surface moist to give uniform test condition.<br />
The sectional width and the sectional height at 414 kPa tyre inflation pressure were<br />
measured using the Mitutoyo (UK) vernier calliper (series 573) with an accuracy of 0.01cm.<br />
The loaded and unloaded radii during the field tests were also measured using the meter rule.<br />
The difference is a measure of the tyre deflection, according to Equation 7.<br />
n<br />
d = UR- LR<br />
[7]<br />
U R is the unloaded radius, while L R is the loaded radius, and δ is the tyre deflection. The rigid<br />
wheel has a zero deflection.<br />
RESULTS AND DISCUSSION<br />
From the initial analysis of the experimental data, the analysis of variance showed that at<br />
20kg (196.2 N) added dynamic load, there were significant differences between the mean of<br />
the motion resistances measured at 414 kPa inflation pressure and at all levels of the dynamic<br />
loads. On this basis, the overall wheel diameter of 660 mm was chosen for this study at 196.2<br />
N added dynamic load and 414 kPa similar to the hard surface of the rigid wheel.<br />
The tyre design parameters, the average soil resistance to penetration, the various dynamic<br />
loads are recorded against the respective average moisture contents, as shown in Tables 4a<br />
and b. These parameters were substituted into Equation 4 so as to obtain the mobility number<br />
for each of the test combinations and these values were substituted into Equation 5 to get the<br />
motion resistance ratios. The motion resistance ratio (measured by the empirical methods)<br />
and the corresponding dynamic loads were also substituted into Equation 3 to determine the<br />
motion resistance ratios. The motion resistance ratios obtained from the two approaches at a<br />
constant towing velocity of 4.44 km/h and at varying dynamic loads are presented in Tables
Modelling of Motion Resistance Ratios of Pneumatic and Rigid Bicycle Wheels<br />
TABLE 4(a): Tyre parameters, soil parameters and dynamic loads on the tilled surface<br />
Test<br />
Combinations<br />
Total dynamic<br />
load (N)<br />
Motion<br />
resistance<br />
(N)<br />
Tyre design parameters Average<br />
CI (MPa)<br />
d, mm b, mm h, mm δ, mm<br />
5a and 5b. Table 6 shows the motion resistances of the pneumatic and the rigid bicycle wheels,<br />
with respect to dynamic loads.<br />
The motion resistances measured on the tilled and wet surface revealed that the rigid wheel<br />
had a higher motion resistance and motion resistance ratios than the pneumatic wheel. The<br />
motion resistance of the rigid wheel on the tilled surface was about 50% greater than those of the<br />
pneumatic wheel. However, on the wet surface, the motion resistances of the rigid wheel were<br />
greater than those of the pneumatic wheel by 11-37%. The motion resistance ratios predicted<br />
from the Brixius model were lower than those determined using the experimental approach<br />
on both the test surfaces. This result is not at variance with the findings of Gee-Clough et al.<br />
(1978), Perdok (1978), and Islam (1986). The motion resistances determined empirically for<br />
both wheels were found to have increased with the increase in the dynamic load, whereas the<br />
motion resistance ratios of both the wheels were shown to have decreased with the increase in<br />
the dynamic load on wet surfaces, and increased with the increase in the dynamic loads on the<br />
tilled surface. Nonetheless, the motion resistances ranged between good and fair according to<br />
the Saarilahti (2003) classifications, with the exception of the rigid wheel at lower additional<br />
<strong>Pertanika</strong> J. Sci. & Technol. <strong>21</strong> (1): 283 - 298 (<strong>2013</strong>)<br />
Average mc<br />
(%wb)<br />
D pL 1 3<strong>21</strong>.768 28.2374 660 49.3 42.5 5.00 0.60 5.70<br />
D pL 2 419.868 46.5037 660 49.3 42.5 7.00 0.83 6.00<br />
D pL 3 616.068 64.1054 660 49.3 42.5 10.00 0.90 11.00<br />
D pL 4 812.268 90.6656 660 49.3 42.5 13.00 1.20 11.00<br />
D RL 1 325.201 57.8055 580 49.5 4.0 0 1.23 14.00<br />
D RL 2 423.301 72.1290 580 49.5 4.0 0 1.43 12.00<br />
D RL 3 619.501 112.5968 580 49.5 4.0 0 1.10 7.00<br />
D RL 4 815.701 198.3133 580 49.5 4.0 0 0.90 14.00<br />
*D P-pneumatic wheel, D R- rigid wheel, L 1-4 –additional load (98.1N, 196.2 N, 392.4 N and 588.6N)<br />
TABLE 4(b): Tyre parameters, soil parameters and dynamic loads on the wet surface<br />
Test<br />
Combinations<br />
Total dynamic<br />
load (N)<br />
Motion<br />
resistance<br />
(N)<br />
Tyre design parameters Average<br />
CI (MPa)<br />
d, mm b, mm h, mm δ, mm<br />
Average mc<br />
(%wb)<br />
D pL 1 3<strong>21</strong>.768 81.7383 660 49.3 42.5 5.00 1.0333 42<br />
D pL 2 419.868 94.4724 660 49.3 42.5 7.00 1.2000 44<br />
D pL 3 616.068 143.6779 660 49.3 42.5 10.00 1.3000 43.7<br />
D pL 4 812.268 157.9837 660 49.3 42.5 13.00 1.2667 42.3<br />
D RL 1 325.201 103.4037 580 49.5 4.0 0 0.8000 37<br />
D RL 2 423.301 148.7016 580 49.5 4.0 0 0.9000 35.7<br />
D RL 3 619.501 161.3703 580 49.5 4.0 0 1.0333 41.3<br />
D RL 4 815.701 <strong>21</strong>5.0599 580 49.5 4.0 0 1.3000 45<br />
*D P-pneumatic wheel, D R- rigid wheel, L 1-4 –additional load (98.1N, 196.2 N, 392.4 N and 588.6N)<br />
67
Ahmad, D., Jamarei, O., Sulaiman, S., Fashina, A. B. and Akande, F. B.<br />
TABLE 5(a): Motion resistance ratios obtained from the empirical approach<br />
Added Dynamic<br />
Load (N)<br />
98.1<br />
196.2<br />
392.4<br />
588.6<br />
Tilled Surface Wet Surface<br />
Pneumatic Rigid Pneumatic Rigid<br />
0.0878 0.1778 0.2540 0.3180<br />
0.1108<br />
0.1041<br />
0.1116<br />
0.1704<br />
0.1818<br />
0.2431<br />
0.2250<br />
0.2332<br />
0.1945<br />
TABLE 5(b): Motion resistance ratios obtained from the analytical approach<br />
Added Dynamic<br />
Load (N)<br />
98.1<br />
196.2<br />
392.4<br />
588.6<br />
Tilled Surface Wet Surface<br />
dynamic loads which showed poor mobility.<br />
From the semi-empirical approach, it is difficult to conclude the nature of the relationships<br />
that existed between the motion resistance ratios and the dynamic loads. However, the motion<br />
resistance ratios predicted were directly proportional to the added dynamic load for both the<br />
wheels, except for the pneumatic wheel which exhibited an inverse relationship between the<br />
motion resistance ratio and the added dynamic load. The motion resistance ratios under this<br />
condition fell under a good mobility classification.<br />
Fig.3 and Fig.4 show the graphical relationships between the motion resistance ratios<br />
and the towing velocities of both the wheels on the tilled and wet surfaces, respectively,<br />
based on the empirical data. The mathematical relationships between the motion resistance<br />
ratio and their towing velocities are presented in Equations 8 to 11. On the tilled surface, the<br />
motion resistance ratios of both the wheels had direct relationships with the towing velocity.<br />
This could also be inferred from the equation having positive coefficient of towing velocity<br />
(v). The pneumatic wheel also showed a similar relationship on the wet surface with a higher<br />
coefficient of regression. As shown in Fig.4, when the towing velocities increased, the motion<br />
resistance ratio of the rigid wheel would decrease. This can also be seen in Equation 11, where<br />
68 <strong>Pertanika</strong> J. Sci. & Technol. <strong>21</strong> (1): 283 - 298 (<strong>2013</strong>)<br />
0.3513<br />
0.2605<br />
0.2637<br />
Pneumatic Rigid Pneumatic Rigid<br />
0.1091 0.1052 0.0903 0.1245<br />
0.1014<br />
0.0977<br />
0.1002<br />
0.1098<br />
0.1431<br />
0.1792<br />
0.0897<br />
0.0934<br />
0.0984<br />
TABLE 6: Motion resistances of pneumatic and rigid wheels measured empirically<br />
Added Dynamic<br />
Load (N)<br />
98.1<br />
196.2<br />
392.4<br />
588.6<br />
Tilled Surface Wet Surface<br />
0.1323<br />
0.1472<br />
0.1503<br />
Pneumatic Rigid Pneumatic Rigid<br />
28.2374 57.8055 81.7383 103.4037<br />
46.5073<br />
64.1054<br />
90.6656<br />
72.1290<br />
112.5968<br />
198.3133<br />
94.4724<br />
143.6779<br />
157.9837<br />
148.7016<br />
161.3703<br />
<strong>21</strong>5.0599
Modelling of Motion Resistance Ratios of Pneumatic and Rigid Bicycle Wheels<br />
Fig.3: A Comparison of the Motion Resistance Ratio of Pneumatic and Rigid Wheels on the Tilled<br />
Surface in terms of Towing Velocity<br />
Fig.4: A Comparison of the Motion Resistance Ratio of Pneumatic and Rigid Wheels on Wet Surface<br />
in terms of Towing Velocity<br />
the towing velocity, v, had a negative coefficient.<br />
Fig.5 and Fig.6, as well as Equations 12 to 15, present the relationships between the<br />
motion resistance ratios of both the wheels obtained from the semi-empirical approach on the<br />
tilled and wet surfaces. The relationships between the motion resistance ratios and the towing<br />
velocities from the two approaches were found to differ. In particular, the motion resistance<br />
ratio of the pneumatic wheel is indirectly proportional to the towing speed at 0.8943 coefficient<br />
of regression, while the rigid wheel shows a direct relationship at a very low coefficient of<br />
regression on the tilled surface. However, the relationship on the wet surface is similar to that<br />
obtained from the empirical method. The motion resistance ratio of the rigid wheel is indirectly<br />
proportional to the towing velocity, while the pneumatic wheel has a direct relationship. From<br />
these findings, it can be concluded that the rigid wheel is a better traction member on wet<br />
surfaces.<br />
<strong>Pertanika</strong> J. Sci. & Technol. <strong>21</strong> (1): 283 - 298 (<strong>2013</strong>)<br />
69
Ahmad, D., Jamarei, O., Sulaiman, S., Fashina, A. B. and Akande, F. B.<br />
Fig.5: A Comparison of the Motion Resistance Ratio of Pneumatic and Rigid Wheels on Tilled Surface<br />
in terms of Towing Velocity: the Analytical Approach<br />
Fig.6: A Comparison of the Motion Resistance Ratio of Pneumatic and Rigid Wheels on Wet Surface in<br />
terms of Towing Velocity: The Analytical Approach<br />
The motion resistance ratios, measured by the empirical and the semi-empirical methods,<br />
also differed. The motion resistance ratios predicted from the Brixius equation were found to<br />
be lower than those measured experimentally, and the main reason for this could be attributed<br />
to the size of the tyre used to derive the model. Therefore, a multiplying factor was used to<br />
derive the new motion resistance ratio models for the pneumatic and rigid bicycle wheels on<br />
two deformable terrains. The factors are stated in Tables 7 and 8, and the models are presented<br />
in Equations 16 to 19.<br />
From Brixius’ (1987) equation for bias-ply tractor tyres, the motion resistance ratio is as<br />
stated in Equation 5. Therefore, for the 660 mm pneumatic bicycle wheels at 414 kPa inflation<br />
pressure, the motion resistance ratio was derived, as follows:<br />
1<br />
MRR ( Bicycle ) = 2.0254. (0.04 + )<br />
B<br />
2.0254<br />
MRR ( Bicycle)<br />
= 0.0810+<br />
B<br />
70 <strong>Pertanika</strong> J. Sci. & Technol. <strong>21</strong> (1): 283 - 298 (<strong>2013</strong>)<br />
n<br />
n<br />
[16]
Modelling of Motion Resistance Ratios of Pneumatic and Rigid Bicycle Wheels<br />
TABLE 7: Determination of the factors between motion resistance ratio of the pneumatic wheel obtained<br />
by empirical and analytical methods at different dynamic loads and 414 kPa<br />
Dynamic Load<br />
(N)<br />
98.1<br />
196.2<br />
392.4<br />
A: MRR (Empirical) B: MRR (Analytical) C: Factors (A/B)<br />
Tilled wet Tilled Wet Tilled Wet<br />
0.0878 0.2540 0.0527 0.0474 1.6660 5.3586<br />
0.1108<br />
0.1041<br />
0.2250<br />
0.2332<br />
0.0504<br />
0.0518<br />
0.0472<br />
0.0482<br />
588.6 0.1116 0.1945 0.0501 0.0495 2.2275 3.9293<br />
Mean 2.0254 4.7233<br />
Coefficient of variation 12.758% 12.52%<br />
Inflation Pressure, P = 414 kPa and Overall Wheel Diameter (metallic rim), D = 660mm.<br />
Field Condition: Tilled Surface (Sandy-Clay-Loam Soil)<br />
Added Dynamic Load range: 98.1 – 588.6 N<br />
Field condition: Wet soil (sandy-clay-loam soil) surface<br />
Added dynamic load range: 98.1 – 588.6 N<br />
From Brixius’ (1987) equation for bias-ply tractor tyres, the motion resistance ratio is as<br />
stated in Equation 5. Therefore, for the 660 mm pneumatic bicycle wheels at 414 kPa inflation<br />
pressure, the motion resistance ratio was derived as follows:<br />
1<br />
MRR ( Bicycle ) = 4.7233 (0.04 + )<br />
B<br />
4.7233<br />
MRR( Bicycle)<br />
= 0.1889+<br />
B<br />
From Brixius’ (1987) equation for bias-ply tractor tyres, the motion resistance ratio is as<br />
stated in Equation 5. For the rigid bicycle wheel on tilled surface, the motion resistance ratio<br />
was therefore derived as follows:<br />
<strong>Pertanika</strong> J. Sci. & Technol. <strong>21</strong> (1): 283 - 298 (<strong>2013</strong>)<br />
n<br />
n<br />
2.1984<br />
2.0097<br />
4.7669<br />
4.8382<br />
TABLE 8: Determination of the factors between motion resistance ratio of the rigid wheel obtained by<br />
empirical and analytical methods at different dynamic loads<br />
Dynamic Load<br />
(N)<br />
98.1<br />
196.2<br />
392.4<br />
A: MRR (Empirical) B: MRR (Analytical) C: Factors (A/B)<br />
Tilled wet Tilled Wet Tilled Wet<br />
0.1778 0.3180 0.0515 0.0578 3.4524 5.5017<br />
0.1704<br />
0.1818<br />
0.3513<br />
0.2605<br />
0.0529<br />
0.0646<br />
0.0606<br />
0.0662<br />
3.2<strong>21</strong>2<br />
2.8142<br />
5.7970<br />
3.9350<br />
588.6 0.2431 0.2637 0.0797 0.0675 3.0502 3.9067<br />
Mean 3.1345 4.7851<br />
Coefficient of variation<br />
Field Condition: Tilled Surface (Sandy-Clay-Loam Soil)<br />
8.60% <strong>21</strong>%<br />
Added Dynamic Load range: 98.1 – 588.6 N<br />
[17]<br />
71
Ahmad, D., Jamarei, O., Sulaiman, S., Fashina, A. B. and Akande, F. B.<br />
1<br />
MRR ( Bicycle ) = 3.1345. (0.04 + )<br />
B<br />
3.1345<br />
MRR ( Bicycle)<br />
= 0.1254+<br />
B<br />
Field condition: Wet soil (sandy-clay-loam soil) surface<br />
Added dynamic load range: 98.1 – 588.6 N<br />
From Brixius’ (1987) equation for bias-ply tractor tyres, the motion resistance ratio is as<br />
stated in Equation 5. Therefore, for the rigid bicycle wheel, the motion resistance ratio was<br />
derived as follows:<br />
1<br />
MRR ( Bicycle ) = 4.7841. (0.04 + )<br />
Bn<br />
[19]<br />
4.7841<br />
MRR ( Bicycle)<br />
= 0.1914+<br />
B<br />
CONCLUSION<br />
In conclusion, the motion resistance and motion resistance ratios of 660 mm pneumatic and<br />
the rigid bicycle wheels were determined both empirically and analytically on tilled and<br />
wet surfaces. The motion resistances measured on the wet surface by both the wheels were<br />
greater than those obtained on the tilled surface with the rigid wheel leading in all the cases.<br />
The motion resistance ratios obtained through empirical methods were greater than those<br />
of the semi-empirical ones. Hence, different relationships between motion resistance ratios,<br />
the dynamic loads and the towing velocities exist on different surfaces with different wheel<br />
types. The rigid wheel is a better traction member on the wet surface at any forward velocity<br />
compared with its pneumatic counterpart. The semi-empirical approach under-predicted the<br />
motion resistance ratios compared to the empirical method. Based on this, a new set of motion<br />
resistance ratio models were derived for predicting motion resistance ratios of pneumatic and<br />
rigid bicycle wheels on deformable surfaces (tilled and wet surfaces).<br />
ACKNOWLEDGEMENTS<br />
This research project is classified under the Institute of Higher Learning, IHL (FRGS-<br />
Fundamental Research Grant Scheme) 1/ 2007 KOS 55235435.ihlrm7 IRPA Project No. 01-<br />
02-04. The authors are very grateful to the authority of <strong>Universiti</strong> <strong>Putra</strong> Malaysia for granting<br />
the fund for this research project.<br />
REFERENCES<br />
Arregoces, A. (1985). Rolling resistance of bicycle wheels: Measurement and trends investigation<br />
(Unpublished M.Sc. Thesis), Silsoe College.<br />
American Standard for Test and Measurements (ASTM) D. 4318(2005) Liquid Limit. Plastic Limit, and<br />
Plasticity Index of Soils. ASTM.<br />
72 <strong>Pertanika</strong> J. Sci. & Technol. <strong>21</strong> (1): 283 - 298 (<strong>2013</strong>)<br />
n<br />
n<br />
n<br />
[18]
Modelling of Motion Resistance Ratios of Pneumatic and Rigid Bicycle Wheels<br />
Bernstein, R. (1913): Problem Experimental Motorflugmech, 16.<br />
Brixius, W. W (1987). Traction prediction equations for bias ply tyres. ASAE Paper No 87-1662, ASAE,<br />
St. Joseph, MI.<br />
Code, O. (2003, R2009). General Terminology for Traction of Agricultural Traction and Transport<br />
Devices and Vehicles. ANSI/ASABE S296.5 (ASABE Standard), 1-5.<br />
Elwaleed, A. K. (1999). Motion resistance, Net traction ratio, and tractive efficiency of riceland type<br />
tyre (Unpublished M.Sc Thesis), Biological and Agricultural Engineering, Faculty of Engineering,<br />
<strong>Universiti</strong> <strong>Putra</strong> Malaysia, Serdang, Selangor.<br />
Gee-Clough, D., McAllister, M., Pearson, G., & Evernden, D. W. (1978). The empirical prediction of<br />
tractor-implement field performance. <strong>Journal</strong> of Terramechanics, 15(2), 81-94.<br />
Gheissari, M. H., & Loghavi, M. (2010). Evaluation of Agricultural Tire Traction Prediction Model Using<br />
a Single Wheel Tester (ASABE Paper No 1009100). Presented at the 2010 ASABE Annual Meeting,<br />
David Lawrence Convention centre, Pittsburgh, Pennsylvania. David L. Lawrence Convention Center,<br />
Pittsburgh, Pennsylvania: (ASABE Paper No. 1009100) St. Joseph, Mich. ASABE.<br />
Gotteland, P., & Benoit, O. (2006). Sinkage tests for mobility study, modelling and experimental<br />
validation. <strong>Journal</strong> of Terramechanics, 43(4), 451-467.<br />
Islam, M. S. (1986). Off-road performance of bicycle wheels: With special emphasis on Rolling<br />
Resistance. Silsoe College, England.<br />
Kawase, Y., Nakashima, H., & Oida, A. (2006). An indoor traction measurement system for agricultural<br />
tires. <strong>Journal</strong> of Terramechanics, 43(3), 317-327.<br />
Macmillan, R. H. (2002). Mechanics of tractor-implement performance; Theory and Worked examples.<br />
In A textbook for Students and Engineers. Place Published. Retrieved July 3, 2009 from http://www.<br />
eprints.unimelb.edu.au.<br />
Naderi, M., Alimardani, R., Abbaszadeh, R., & Ahmadi., H. (2008). Assessment of dynamic load<br />
equations through drive wheel slips measurement. American- Eurasian <strong>Journal</strong> of Agriculture and<br />
Environmental Sciences 3(5): 778-784.<br />
Pandey K. P., Tiwari, G. (2006). Rolling Resistance of Automobile Discarded Tyres for Use in Camel<br />
Carts in Sand. Paper read at 2006 Annual international meeting of ASABE, 9-12 July, 2006, at Oregon<br />
Conventional center Portland, oregon.<br />
Perdok U. D. (1978). A prediction model for the selection of tyres for towed vehicles on tilled soil.<br />
<strong>Journal</strong> of Agricultural Engineering Research 23(4), 369-383.<br />
Plackett, C. W. (1985). A review of force prediction methods for off-road wheels. <strong>Journal</strong> of Agricultural<br />
Engineering Research, 31(1), 1-29.<br />
Pope, R. G. (1971). The effect of wheel speed on rolling resistance. <strong>Journal</strong> of Terramechanics, 8(1), 5-5.<br />
Saarilahti, M. (2003). Soil interaction model. ECOWOOD studies made at the University of Helsinki.<br />
University of Helsinki, Faculty of Agriculture and Forestry, Department of Forest Resource<br />
Management Publication, 31, 2003-07.<br />
Schreiber, M., & Kutzbach H. D. (2007). Comparison of different zero-slip definitions and a proposal<br />
to standardize tire traction performance. <strong>Journal</strong> of Terramechanics, 44(1), 75-79.<br />
<strong>Pertanika</strong> J. Sci. & Technol. <strong>21</strong> (1): 283 - 298 (<strong>2013</strong>)<br />
73
Ahmad, D., Jamarei, O., Sulaiman, S., Fashina, A. B. and Akande, F. B.<br />
Turnage, G. W. (1972). Using dimensional prediction terms to describe off-road wheel vehicle<br />
performance. ASAE paper No. 72-634. St. Joseph, MI.49085.<br />
Wang Z., & Reece, A. R. (1984). The performance of free rolling rigid and flexible wheels on sand.<br />
<strong>Journal</strong> of Terramechanics, <strong>21</strong>(4), 347-360.<br />
Wismer, R. D., & Luth, H. J. (1974). Off-road traction prediction for wheeled vehicles. Transactions<br />
of the ASAE, 17(1), 8-10.<br />
Wong, J. Y. (1984). On the study of wheel-soil interaction. <strong>Journal</strong> of Terramechanics, <strong>21</strong>(2), 117-131.<br />
Yahya, A., Zohadie, M., Ahmad, D., Elwaleed, A. K., & Kheiralla, A. F. (2007). UPM indoor tyre traction<br />
testing facility. <strong>Journal</strong> of Terramechanics, 44(4), 293-301.<br />
74 <strong>Pertanika</strong> J. Sci. & Technol. <strong>21</strong> (1): 283 - 298 (<strong>2013</strong>)
ISSN: 0128-7680 © <strong>2013</strong> <strong>Universiti</strong> <strong>Putra</strong> Malaysia Press.<br />
<strong>Pertanika</strong> J. Sci. & Technol. <strong>21</strong> (1): 75 - 96 (<strong>2013</strong>)<br />
SCIENCE & TECHNOLOGY<br />
<strong>Journal</strong> homepage: http://www.pertanika.upm.edu.my/<br />
Assessment of Heavy Metal Pollution in the Straits of Johore by<br />
Using Transplanted Caged Mussel, Perna viridis<br />
Eugene Ng, Y. J. 1 , Yap, C. K. 1 *, Zakaria, M. P. 2 and Tan, S. G. 3<br />
1 Department of Biology, Faculty of Science, <strong>Universiti</strong> <strong>Putra</strong> Malaysia, 43400 Serdang, Selangor, Malaysia<br />
2 Department of Environmental Sciences, Faculty of Environmental Studies, <strong>Universiti</strong> <strong>Putra</strong> Malysia,<br />
43400 Serdang, Selangor, Malaysia<br />
3 Department of Cell and Molecular Biology, Faculty of Biotechnology and Biomolecular Science,<br />
<strong>Universiti</strong> <strong>Putra</strong> Malysia, 43400 Serdang, Selangor, Malaysia<br />
ABSTRACT<br />
In this study, a polluted site at Kg. Pasir Puteh was assessed for heavy metal pollution by using<br />
transplanted caged mussel (Perna viridis) from a relatively clean population, Sg. Melayu; both are located<br />
in the Strait of Johore. For control purposes, the P. viridis from Kg. Pasir Puteh were also simultaneously<br />
transplanted in Sg. Melayu at the same time. It was found that Zn was the metal which got accumulated<br />
fastest in the transplanted mussel while Cd was the slowest. This study indicated that the byssus of<br />
Perna viridis was most effective for biomonitoring of Cd, Ni, Pb and Zn, while the shell could be used<br />
for the biomonitoring of Cu, Ni and Pb and the total soft tissue for the biomonitoring of Ni since they<br />
were able to accumulate and eliminate the respective metals well. By using mussel as a biomonitor, the<br />
present study found that Kg. Pasir Puteh, which is located in the eastern part of the Strait of Johore, had<br />
significantly higher contamination and bioavailabilities of Cd, Cu, Fe, Ni, Pb and Zn. Therefore, the<br />
use of the transplanted caged mussels is very useful for heavy metal assessment purposes since it can<br />
increase the validity of data interpretation by minimizing ecological factors.<br />
Keywords: Heavy metal, Perna viridis, Strait of Johore, transplant<br />
Article history:<br />
Received: 27 April 2011<br />
Accepted: 22 November 2011<br />
E-mail addresses:<br />
enyj@msn.com (Eugene Ng, Y. J.),<br />
yapckong@hotmail.com (Yap, C. K.),<br />
mpauzi@env.upm.edu.my (Zakaria, M. P.),<br />
sgtan@biotech.upm.edu.my (Tan, S. G.)<br />
*Corresponding Author<br />
INTRODUCTION<br />
Anthropogenic activities have been increasing<br />
as the population of humans grows rapidly.<br />
The increase of anthropogenic activities<br />
has always caused heavy metal pollution in<br />
coastal waters. Monitoring of coastal waters<br />
which are exposed to chemical pollution due<br />
to industrial production and high urbanization
Eugene Ng, Y. J., Yap, C. K., Zakaria, M. P. and Tan, S. G.<br />
(Giarratano et al., 2010) by using mussels has been widely reported in the literature. However,<br />
a more efficient and practical approach for assessing heavy metal pollution is needed. Recently,<br />
to define the areas of metal pollution, caged or transplanted mussels have been employed in<br />
many coastal waters such as Ushuaia Bay, Argentina (Giarratano et al., 2010), North West of<br />
Mediterranean Sea (Faverney et al. 2010), Boston Harbour, United States (Hunt & Slone, 2010)<br />
and New Caledonia Lagoon in the South Pacific of France (Hedouin et al., 2011).<br />
The Johore Strait is a narrow strait that separates the Malaysian state of Johore from<br />
Singapore and it is separated into two distinct portions by a causeway which connects Peninsular<br />
Malaysia and Singapore. It is an important area for fishing and aquaculture activities (Yap et<br />
al., 2006; Zulkifli et al., 2010). Furthermore, the existence of mangrove, sea grass, coral and<br />
mudflat ecosystems also make the Johor Straits an important strait (Zulkifli et al., 2010). Oil<br />
pollution has been identified as the major contributor to the pollution of the water in the Straits of<br />
Johor (DOE, 1994; Moradi, 2001; Shahbazi et al., 2010). Shipping activities involving tankers<br />
and other vessels can easily be found in the Strait of Malacca, while land-based industrial and<br />
urban sources have been recognised as the sources of pollutants for the strait (Abdullah et<br />
al. 1996). The eastern part of the straits is more polluted than the western part since marina,<br />
petrochemical plants and port activities such as Pasir Gudang Port (ranked 82 nd in 2007 global<br />
TEU), Tanjung Pelepas Port (ranked 18 th in 2007 global TEU) and Tanjung Langsat Port (a<br />
new petrochemical port) are located on the eastern coast (Bayen et al., 2003; Yap et al., 2004,<br />
2006). Kg. Pasir Puteh, which is located in the eastern part, is reported as a highly polluted<br />
site, where large shipyard repair and construction facilities, fossil fuel fired electrical power<br />
plants and shipping dock activities can be found (Yap et al., 2003d, 2004; Zulkifli et al., 2010).<br />
On the other hand, Kg. Sg. Melayu in the western part is considered as a site with low human<br />
activities and the only activities which can be found there are fish and mussel aquaculture (Yap<br />
et al., 2006). Owing to its strategic location and ecological importance, the Johore Strait has<br />
become a hotspot for pollution studies (DOE, 2007; Shazili et al., 2006; Wood et al., 1997).<br />
Francesco and Enzo (1994) noted that the accumulations of Pb, Fe and Mn in the mussels,<br />
which were transplanted from a clean site to a heavy metal polluted environment, would reach<br />
a steady state only after 2 weeks. The results showed that mussels could easily equilibrate<br />
with polluted coastal waters. However, the time-integration capacity of mussels might vary for<br />
different metals. In fact, many important biological processes associated with metal exposures<br />
have generally been studied under laboratory conditions but not in field experiments (Regoli,<br />
1992; Yap et al., 2003a). In this respect, mussel transplantation is a more practical approach<br />
to be used in monitoring the metal accumulation of mussels at fixed sites.<br />
Marine mussels are suitable for transplantation experiments because they are cost effective<br />
and reliable (Farverney et al., 2010). In particular, P. viridis fulfils the necessary criteria which<br />
are sedentary lifestyle, enough tissues for metal analysis, suspension feeder, tolerant of high<br />
heavy metal concentrations (Yap et al. 2003a) and prone to bioaccumulate and magnify such<br />
metals (Yap et al. 2004) and of relatively low genetic differentiation (Yap et al., 2002a,b).<br />
The advantages of adopting transplantation are mainly due: (1) to the fact that the<br />
monitoring sites may be chosen independently of the presence of natural populations (Hedouin<br />
et al., 2011), (2) to access the status of bioaccumulation in hard-to-reach areas such as in<br />
different strata of the water column (Hunt & Slone, 2010; Giarratano et al., 2010), (3) it can<br />
76 <strong>Pertanika</strong> J. Sci. & Technol. <strong>21</strong> (1): 283 - 298 (<strong>2013</strong>)
Assessment of Heavy Metal Pollution in the Straits of Johore by Using Transplanted Caged Mussel, Perna viridis<br />
be site-specific, (4) control exposure times, depth of transplantation, age, size, stage of sexual<br />
maturity of mussels, which can interfere with and affect the accumulation rate (Alfonso et al.,<br />
2010), and (5) usually with low genetic variation and in the same phase of the reproductive cycle<br />
since they are abundant and easily available from commercial markets (Gorbi et al., 2007). The<br />
use of transplanted mussels has been proven to be a useful strategy for biomonitoring marine<br />
pollution (Nasci et al., 2002; Romeo et al., 2003; Regoli et al., 2004; Nigro et al., 2006).<br />
By using transplanted mussels, the effects of external and internal factors such as seasonal<br />
variations, size or age, which can cause bias in data comparison, are minimized (Regoli &<br />
Orlando, 1994; Hedouin et al., 2011). Since there has been no study which reported on heavy<br />
metals in transplanted mussels in Malaysia, the objective of this study was to assess the heavy<br />
metal pollution in the Strait of Johore by using transplanted mussels.<br />
MATERIALS AND METHODS<br />
Transplantation of Mussel Populations<br />
About 200 individuals of P. viridis were collected from a polluted site at Kg. Pasir Puteh and<br />
transplanted to a relatively unpolluted site at Sg. Melayu, in the Strait of Johore on 28 November<br />
2009. On the same day, the same amount of mussels were also collected from Sg. Melayu and<br />
transplanted to Kg Pasir Puteh. After the mussels had been collected, the whole cluster was<br />
rinsed 3 times using seawater to get rid of any visible sediment on the mussel shells. The mussels<br />
were then divided randomly into sub-groups of 40 individuals and each sub-group was placed<br />
in a polyethylene cage of 20 x 15 x 18 cm which permitted water circulation through it. Four<br />
cages were used per site and left suspended in the water column at an average depth of 1.5 m<br />
using a rope which was modified from Faverney et al. (2010). The samples of mussels were<br />
taken at the beginning of the experiment (t=0), at 2 (t=2), 6 (t=6) and 10 (t=10) weeks time of<br />
the exposure. The collected mussels had been rinsed with seawater before they were transported<br />
back to the laboratory in an ice compartment. However, at week 10, all the mussel samples<br />
died and no soft tissues were found. Thus, only byssus and shells were analysed at week 10.<br />
Seawater<br />
The physico-chemical readings of the seawater from Sg. Melayu and Kg. Pasir Puteh at around<br />
1.5 m depth were recorded in situ at the beginning of the experiment (t=0), at weeks 2 (t=2),<br />
6 (t=6) and 10 (t=10) for temperature (°C), specific conductivity (ms/cm), salinity (ppt) and<br />
dissolved oxygen (mg/L) during the transplantation experiment using YSI brand Physicochemical<br />
meter (PCM) model no. 556 MPS.<br />
Pre-treatment of the Samples<br />
Sediment samples at each site were also collected by using an Ekmen Grab (16 cm x 16 cm)<br />
and these samples were stored in polyethylene bags and transported in an ice compartment<br />
back to the laboratory. The samples were dried until constant weights at 105°C for at least 16<br />
hours (Tanner et al., 2000). The samples were then sieved through 63µm stainless steel aperture<br />
<strong>Pertanika</strong> J. Sci. & Technol. <strong>21</strong> (1): 283 - 298 (<strong>2013</strong>)<br />
77
Eugene Ng, Y. J., Yap, C. K., Zakaria, M. P. and Tan, S. G.<br />
Fig.1: Map showing the transplantation sites for Perna viridis<br />
Note: A- Sungai Melayu B- Kampung Pasir Puteh<br />
and vigorously shaken to produce homogeneity. All individuals of P. viridis were dissected<br />
into byssus, total soft tissue and shell. Half gram of the samples was digested in concentrated<br />
nitric acid (AnalaR grade, BDH 69%) in a hot-block digestor first at a low temperature (40°C)<br />
for 1 hour before the temperature was increased to 140°C for 3 hours. The digested samples<br />
were later diluted in 40ml double distilled water (DDW). The sample was then filtered through<br />
Whatman No. 1 filter paper and the filtrate was stored in an acid-washed pill box until metal<br />
determination. For the analyses of the total heavy metal concentrations in sediment samples, the<br />
open digestion method was used. About 1g of each dried sample was digested in a combination<br />
of concentrated nitric acid (AnalaR grade, BDH 69%) and perchloric acid (60%) in the ratio<br />
of 4:1. On top of that, the geochemical fractions of Cd, Cu, Fe, Ni, Pb and Zn in the sediments<br />
were obtained by using the modified Sequential extraction technique (SET), as described by<br />
Yap et al. (2002). The first fraction was EFLE (Easily, freely, leacheable or exchangeable).<br />
About 10g of the sample was continuously shaken for 3 hours with 50ml 1.0M ammonium<br />
acetate (NH 4CH 3COO) at pH 7.0 at room temperature for this fraction. The second fraction<br />
was ‘Acid-reducible’. The residue from fraction 1 was continuously shaken for 3 hours with<br />
50ml 0.25M hydroxylammonium chloride (NH 2OH.HCL) acidified to pH 2 with HCL at room<br />
temperature, and this was followed by the third fraction which was ‘Oxidisable-organic’.<br />
The residue from fraction 2 was first oxidized with 30% H 2O 2 in a water bath at 90–95°C.<br />
After cooling, the metal released from the organic complexes was continuously shaken for 3<br />
hours with 1.0M ammonium acetate (NH 4CH 3COO) acidified to pH 2.0 with HCL at room<br />
temperature. ‘Resistant’ was the last fraction where the residue from fraction 3 was digested<br />
in a combination of concentrated nitric acid (AnalaR grade, BDH 69%) and perchloric acid<br />
(AnalaR grade, BDH 60%), as performed in the open digestion method.<br />
78 <strong>Pertanika</strong> J. Sci. & Technol. <strong>21</strong> (1): 283 - 298 (<strong>2013</strong>)
TABLE 1: Size of mussels in average (mean ± SE, mm), condition index (CI) and physico-chemical characteristics of the water samples at different time<br />
intervals at Kg. Pasir Puteh<br />
Assessment of Heavy Metal Pollution in the Straits of Johore by Using Transplanted Caged Mussel, Perna viridis<br />
Sg. Melayu – Kg. Pasir Puteh<br />
Sizes of mussel (mean±SE, mm) PCM<br />
Temp SC Sal DO<br />
Week Length Width Height CI (°C) (ms/cm) (ppt) (mg/L) pH<br />
0 30.45 ± 2.64 9.07 ± 1.04 14.64 ± 1.54 <strong>21</strong>.53 29.26 45.17 29.11 4.57 7.52<br />
2 56.67 ± 3.68 16.77 ± 3.67 23.94 ± 3.19 23.54 30.01 38.61 24.42 3.14 7.15<br />
6 68.88 ± 4.51 20.67 ± 3.92 29.22 ± 2.06 <strong>21</strong>.19 30.61 44.47 28.56 7.59 7.68<br />
10 79.94 ± 6.37 24.38 ± 2.83 35.17 ± 3.17 20.61 29.96 39.90 25.33 13.82 7.03<br />
TABLE 2: Size of mussels in average (mean ± SE, mm), condition index (CI) and physico-chemical characteristics of the water samples at different time<br />
intervals at Sungai Melayu<br />
Kg. Pasir Puteh – Sg. Melayu<br />
Sizes of mussel (mean±SE, mm) PCM<br />
Temp SC Sal DO<br />
Week Length Width Height CI (°C) (ms/cm) (ppt) (mg/L) pH<br />
0 34.46 ± 1.33 10.22 ± 1.26 15.66 ± 2.37 26.18 30.04 41.54 26.49 3.88 7.15<br />
2 53.17 ± 3.14 16.96 ± 3.11 22.39 ± 3.88 24.22 29.06 46.31 29.94 5.85 7.16<br />
6 66.15 ± 4.57 19.37 ± 4.31 29.61 ± 4.32 <strong>21</strong>.39 29.06 46.31 29.94 5.74 7.16<br />
10 78.74 ± 5.39 23.41 ± 3.94 35.10 ± 4.16 17.45 29.97 41.59 26.53 4.22 7.15<br />
<strong>Pertanika</strong> J. Sci. & Technol. <strong>21</strong> (1): 283 - 298 (<strong>2013</strong>)<br />
79
TABLE 3: A comparison of heavy metal concentrations (µg/g dry weight) between measured values and certified values in the Certified Reference Materials<br />
(CRM) for dogfish liver DOLT-3<br />
Metals Certified values ( C ) Measured value (M) Percentage of recovery [(M/C) x 100]<br />
Cu 31.20 ± 1.00 26.81 ± 0.25 85.93<br />
Cd 19.40 ± 0.60 14.68 ± 0.34 75.67<br />
Fe 1484.00 ± 57.00 1<strong>21</strong>3.42 ± 10.67 81.77<br />
Eugene Ng, Y. J., Yap, C. K., Zakaria, M. P. and Tan, S. G.<br />
Ni 2.72 ± 0.35 3.37 ± 0.20 123.90<br />
Pb 37.38 ± 12.81 29.37 ± 0.33 78.56<br />
Zn 86.60 ± 2.40 76.12 ± 0.81 99.90<br />
TABLE 4: A comparison of heavy metal concentrations (µg/g dry weight) between measured values and certified values in the Certified Reference Materials<br />
(CRM) for Soil China (NSC DC73319)<br />
Metals Certified values ( C ) Measured value (M) Percentage of recovery [(M/C) x 100]<br />
Cu <strong>21</strong>.00 ± 2.00 18.28 ± 0.74 87.05<br />
Cd 4.30 ± 0.40 4.64 ± 0.14 107.91<br />
Ni 20.40 ± 1.80 17.16 ± 0.51 84.12<br />
Pb 98.00 ± 6.00 110.8 ± 9.39 113.06<br />
Zn 680.00 ± 25.00 566.76 ± 6.39 83.35<br />
80 <strong>Pertanika</strong> J. Sci. & Technol. <strong>21</strong> (1): 283 - 298 (<strong>2013</strong>)<br />
Note: CRM for Fe was not available.
Assessment of Heavy Metal Pollution in the Straits of Johore by Using Transplanted Caged Mussel, Perna viridis<br />
Metal Analysis<br />
After filtration, the samples were analysed for Cd, Cu, Fe, Ni, Pb and Zn using an air-acetylene<br />
flame atomic absorption spectrophotometer (AAS), Perkin-Elmer Model AAnalyst 800. The<br />
data are presented in µg.g -1 dry weight. To avoid possible contamination, all the glassware and<br />
equipment used were acid-washed and the accuracy of the analysis was checked against blanks.<br />
For data validation, Certified Reference Material (CRM) was checked with the samples for<br />
dogfish liver (DOLT-3, National Research Council Canada) and Soil China (NSC DC73319,<br />
China National Analysis Centre), as shown in Tables 3 and 4.<br />
Condition Index<br />
To examine the individual Condition Index (CI) of mussels, 5 specimens were taken at each<br />
exposure time to obtain an estimate of the ratio of weight of the soft parts to shell volume. Soft<br />
tissues were separated from the shell and dried at 60°C until constant weight was achieved.<br />
Condition index (g/cm 3 ) of each mussel was calculated according to Lares and Orians (1997):<br />
dry tissue weight (g)<br />
Condition index =<br />
x1000<br />
shell length (cm) x shell width (cm) x shell height (cm)<br />
Data Analysis<br />
The concentration factor (CF) was calculated according to Yap et al. (2003a).<br />
Metal level<br />
CF =<br />
Metal level<br />
end of metal accumulation<br />
The elimination factor (EF) was also calculated according to Yap et al. (2003a).<br />
Metal level<br />
EF =<br />
Metal level<br />
initial<br />
end of metal elimination<br />
The rate of metal accumulation was calculated according to a formula proposed by Yap et al.<br />
(2003a), as follows:<br />
initial<br />
Metal level -Metal<br />
level<br />
Rate of metals accumulation =<br />
Day(s) of metal exposure<br />
<strong>Pertanika</strong> J. Sci. & Technol. <strong>21</strong> (1): 283 - 298 (<strong>2013</strong>)<br />
exposed initial<br />
Meanwhile, the rate of metal elimination was calculated according to the following formula<br />
(Yap et al., 2003a):<br />
81
Eugene Ng, Y. J., Yap, C. K., Zakaria, M. P. and Tan, S. G.<br />
Metal level -Metal<br />
level<br />
Rate of metals elimination =<br />
Day(s) of metal elimination<br />
exposed initial<br />
Note: Metal level = heavy metals value at week 6 or week 10.<br />
end of metal accumulation<br />
Metal level end of metal elimination = heavy metals value at week 6 or week 10.<br />
Metal level initial = heavy metals value at week 0.<br />
Metal level = heavy metals value at weeks 2, 6 or 10.<br />
exposed<br />
Statistical Analysis<br />
The statistical analyses were done by using STATISTICA version 8.0 for Windows. In addition,<br />
analysis of variance (ANOVA) was applied to find the differences between the means of heavy<br />
metal concentrations in the different parts of the mussels during the transplantation. Students-<br />
Newman-Kuel was applied to compare the mean values of heavy metal concentrations between<br />
the different parts of the mussels. T-test was carried out to test between the means of the end of<br />
the metal exposures and the initial metal exposures. The mean differences between Kg. Pasir<br />
Puteh and Sg. Melayu were tested using the Mann-Whitney test (Zar, 1996).<br />
RESULTS AND DISCUSSION<br />
Physico-chemical Parameters and Sediment Data<br />
The physico-chemical parameters from Kg. Pasir Puteh and Sg. Melayu were found to be<br />
similar during the 10-week transplantation (see Tables 1 and 2), with ranges of 29.06-30.61°C<br />
for temperature, 38.61-46.78 ms/cm for specific conductivity, 24.42-30.24 ppt for salinity,<br />
3.14-13.82 mg/L for dissolved oxygen and 7.03-7.68 for pH. As for sediment, heavy metal<br />
concentrations in both the studies sites are presented in Table 5. For Kg Pasir Puteh, the<br />
concentrations (µg/g dry weight) for the sediment data ranged from Cd (2.73-3.24), Cu (105.71-<br />
112.71), Fe (1.83-2.00%), Ni (45.20-52.46), Pb (61.90-73.47) and Zn (225.83-289.61). On the<br />
other hand, the concentration ranges obtained from Sg. Melayu, (µg/g) for the sediment data<br />
were Cd (1.42-1.80), Cu (31.39-60.20), Fe (1.74-1.80%), Ni (26.27-37.19), Pb (31.97-42.<strong>21</strong>)<br />
and Zn (83.<strong>21</strong>-95.18).<br />
The sediment data obtained from Kg. Pasir Puteh in this study were generally higher,<br />
although not significantly, as compared to the sediment data reported by Yap et al. (2002) for<br />
Cd (1.45 µg/g), Cu (104 µg/g), Pb (70 µg/g) and Zn (170 µg/g) from the same sampling site<br />
of the sediments collected in 2002. All the metal concentrations (except for Fe) in Kg Pasir<br />
Puteh were significantly (Mann-Whitney Test, p< 0.05) higher than those of Sg. Melayu. This<br />
indicated that Kg. Pasir Puteh was more contaminated by metals than Sg. Melayu. The cause<br />
of the high availability of metals, especially Cu, Pb, Zn at Kg. Pasir Puteh, was probably due<br />
to the presence of shipyards which used biofouling paints (Bayen et al., 2003).<br />
82 <strong>Pertanika</strong> J. Sci. & Technol. <strong>21</strong> (1): 283 - 298 (<strong>2013</strong>)
TABLE 5: Heavy metal concentrations (µg/g dry weight) in the surface sediments collected from Sg. Melayu and Kg. Pasir Puteh<br />
Assessment of Heavy Metal Pollution in the Straits of Johore by Using Transplanted Caged Mussel, Perna viridis<br />
Cd Cu Fe Ni Pb Zn<br />
M-W<br />
Test<br />
Sg<br />
Melayu<br />
M-W<br />
Test P.Puteh<br />
Sg<br />
Melayu<br />
M-W<br />
Test P.Puteh<br />
Sg<br />
Melayu<br />
M-W<br />
Test P.Puteh<br />
Sg<br />
Melayu<br />
M-W<br />
Test P.Puteh<br />
Sg<br />
Melayu<br />
M-W<br />
Test P.Puteh<br />
Sg<br />
Melayu<br />
Weeks P.Puteh<br />
Aquaregia<br />
2.90 1.62 p>0.05 105.71 60.20 p0.05 46.62 27.57 p0.05 1.49 2.43 p>0.05 1.42 1.18 p>0.05 1.76 1.97 p>0.05 20.56 2.26 p< 0.05<br />
F2 0.72 0.57 p>0.05 0.18 0.33 p>0.05 0.08 0.13 p>0.05 1.36 2.02 p>0.05 2.33 2.98 p>0.05 78.90 2.12 p< 0.05<br />
F3 0.84 0.50 p>0.05 71.20 9.67 p0.05 27.27 13.87 p0.05 84.63 2.18 p< 0.05<br />
F3 0.99 0.47 p>0.05 91.87 20.24 p0.05 34.11 <strong>21</strong>.16 p0.05 23.19 13.00 p
Metal Accumulation in the Mussels<br />
Eugene Ng, Y. J., Yap, C. K., Zakaria, M. P. and Tan, S. G.<br />
During the 10-week duration of transplantation from Sg. Melayu to the sampling site at Kg.<br />
Pasir Puteh, all the metal concentrations were generally found to have increased from 1.49<br />
to 6.93 µg/g for Cd, 7.31 to 25.63 µg/g for Cu, 29.27 to 3150.06 µg/g for Fe, 17.13 to 33.98<br />
µg/g for Ni, 6.13 to 43.59 µg/g for Pb and 8.19 to 184.73 µg/g for Zn (see Fig.2 to Fig.7). In<br />
specific, the heavy metal concentrations for all the metals in Kg. Pasir Puteh were significantly<br />
higher than those in Sg. Melayu (independent t-test, p< 0.05). Meanwhile, Fe accumulated the<br />
highest in the byssus and the total soft tissue while Pb accumulated the highest in the shells<br />
of the mussels transplanted from Sg. Melayu to Kg. Pasir Puteh.<br />
As for Cd, significant differences (one-way ANOVA, SNK, p< 0.05) were registered<br />
between the tissues for the mussels transplanted from Sg. Melayu to Kg. Pasir Puteh for T 0 and<br />
T 2. However, starting from T 6, the total soft tissue and byssus were significantly different from<br />
the shell. For Cu, the shell and byssus were significantly different from the total soft tissues<br />
during the transplant period, i.e. from T 0 to T 10. Meanwhile, significant differences were found<br />
between byssus, shell and total soft tissues for Fe concentrations. The Ni concentrations did<br />
not register any significant difference between TST, byssus and shell. For both sites, significant<br />
differences (one-way ANOVA, SNK, p< 0.05) were registered between the shell and byssus<br />
from the total soft tissues for Pb concentrations from T 0 to T 10. On the other hand, the Zn levels<br />
of byssus and total soft tissue were significantly different (one-way ANOVA, SNK, p< 0.05)<br />
from the shell in both the transplanted mussels.<br />
Table 6 shows the rate of accumulation for all the metals in the different parts of the mussels<br />
transplanted from Sg. Melayu to Kg. Pasir Puteh according to weeks. The rates of the metal<br />
accumulation were fastest in all the mussel parts in week 2 (T=2) but these became slower in<br />
the following weeks and up to week 10 (T=10). During the first 6 weeks of transplantation, the<br />
total soft tissues showed the highest concentration factors (CF) in Cd (2.06), Cu (1.81) and Fe<br />
(2.04) but the lowest CF in Ni (1.11). Meanwhile, byssus showed the highest CF in Pb (2.28)<br />
and Zn (2.28), and the shell showed the highest CF in Ni (1.80). For the period of 10-week<br />
transplantation, the total soft tissues showed the highest concentration factorss (CF) in Cd<br />
(2.06), Cu (1.81) and Fe (2.22). Byssus showed the highest CF in Pb (3.17) and Zn (3.30), while<br />
the shell showed the highest CF in Ni (1.98). These indicated that TST accumulated the highest<br />
Cd and Cu concentrations, while byssus accumulated the highest Pb and Zn concentrations<br />
and the shell accumulated the highest Ni concentration.<br />
The concentrations of Cd in the shell and Ni in TST in the transplanted P. viridis at week<br />
10 reached the values similar to those measured in the initial P. viridis (T 0). Similar findings<br />
had previously been reported for Cu and Zn in the soft tissues of the mussel Mytilus edulis<br />
transplanted to a temperate polluted bay (Roesijadi et al., 1984) and Cr and Cu in Isognomon<br />
isognomon and Co, Ni and Zn in Gafrarium tumidum transplanted from a polluted site to a<br />
clean site in a New Caledonia lagoon (Hedouin et al., 2011). As for Ni in byssus, Fe in TST, Pb<br />
in byssus and shell and Zn in TST from the transplanted mussels (T 10), the levels significantly<br />
increased during the transplantation period but did not reach the values measured in the initial<br />
P. viridis (T 0). This could be due to the transplantation period being not long enough for the<br />
transplanted mussels to accumulate the metals completely. Comparable results had been<br />
84 <strong>Pertanika</strong> J. Sci. & Technol. <strong>21</strong> (1): 283 - 298 (<strong>2013</strong>)
Assessment of Heavy Metal Pollution in the Straits of Johore by Using Transplanted Caged Mussel, Perna viridis<br />
TABLE 6: Concentration factor (CF), rates of accumulation (µg/g per day) of Cd, Cu, Fe, Ni, Pb and<br />
Zn in byssus, total soft tissue and shell of transplanted P. viridis from Sg. Melayu to Kg. Pasir Puteh<br />
Week<br />
CF Rate of accumulation<br />
Parts 6 10 2 6 10<br />
Cd Byssus 1.114 1.134 0.010 0.009 0.006<br />
TST 1.815 2.060 0.033 0.029 0.023<br />
Shell 1.061 1.098 0.011 0.009 0.009<br />
Cu Byssus 1.443 1.498 0.161 0.090 0.061<br />
TST 1.666 1.807 0.316 0.225 0.164<br />
Shell 1.490 1.720 0.145 0.085 0.075<br />
Fe Byssus 1.742 1.898 48.662 29.330 <strong>21</strong>.286<br />
TST 2.041 2.<strong>21</strong>8 17.309 13.826 9.706<br />
Shell 1.295 1.535 0.379 0.205 0.224<br />
Ni Byssus 1.322 1.460 0.378 0.157 0.134<br />
TST 1.081 1.109 0.149 0.059 0.048<br />
Shell 1.802 1.984 0.774 0.327 0.241<br />
Pb Byssus 2.279 3.172 0.231 0.419 0.426<br />
TST 1.736 1.862 0.232 0.108 0.076<br />
Shell 1.187 1.345 0.196 0.120 0.133<br />
Zn Byssus 2.756 3.299 2.642 2.342 1.839<br />
TST 1.918 2.270 2.653 1.388 1.153<br />
Shell 1.518 1.867 0.134 0.101 0.102<br />
previously reported for the oyster Crassostrea rhizophorae (Wallner-Kersanach et al., 2000),<br />
as well as oyster Isognomon isognomon and clam Gafrarium tumidum from the New Caledonia<br />
lagoon (Hedouin et al., 2011). However, Cd in byssus did not show any significant increase<br />
during the transplantation from Sg. Melayu to Kg. Pasir Puteh. This corresponded with similar<br />
observations for the Cd and Zn concentrations in Crenomytilus grayanus after two months<br />
of transplantation (Shulkin et al., 2003). The lack of Cd accumulation in the transplanted P.<br />
viridis, as observed in the current study, suggested that this particular element was rather poorly<br />
bioavailable for them or that P. viridis had efficient regulation mechanisms preventing these<br />
metals from being accumulated (Hedouin et al., 2011).<br />
For the mussels transplanted from Sg. Melayu to Kg. Pasir Puteh, the metal levels in all<br />
<strong>Pertanika</strong> J. Sci. & Technol. <strong>21</strong> (1): 283 - 298 (<strong>2013</strong>)<br />
85
Eugene Ng, Y. J., Yap, C. K., Zakaria, M. P. and Tan, S. G.<br />
the parts had decreased. The high CF values in the metals (Table 6) showed that P. viridis was<br />
capable of accumulating these metals. In particular, TST was highly capable of accumulating<br />
Cd and Cu while the byssus was capable of accumulating Pb and Zn and the shell accumulated<br />
the highest Ni concentration. The total soft tissues of P. viridis showed the highest CF values<br />
for most of the metals, and this indicated that it is useful for monitoring metal contamination in<br />
coastal waters. The results obtained in the present study are also comparable to those of Yap et<br />
al. (2003a, 2004) which showed that P. viridis is a good accumulator for Cd, Pb and Zn. This<br />
test revealed the ability of P. viridis to accumulate and eliminate metals in short periods of<br />
time. Among the CF values for week 6 and week 10, Zn was the one which was accumulated<br />
the fastest while Cd was the slowest.<br />
Metal Elimination in Mussels<br />
Fig.2 to 7 show that all the metal concentrations in the mussels transplanted from Kg. Pasir<br />
Puteh to Sg. Melayu had decreased starting from T 0 to T 10. The Cd level decreased from 6.55<br />
to 2.3 µg/g, Cu from 37.81 to 2.84 µg/g, Fe from 2909.69 to 14.98 µg/g, Ni from 55.06 to<br />
13.64, Pb from 46.43 to 16.01 µg/g and Zn from 176.24 to 7.05 µg/g. Similar findings were<br />
also reported by Gabr and Gab-Alla (2008) for clams (Ruditapes decussatus and Venerupis<br />
pullastra) transplanted from a polluted site to a clean site.<br />
As for the mussels transplanted from Kg. Pasir Puteh to Sg. Melayu, there was no<br />
significant difference (one-way ANOVA, SNK, p< 0.05) observed for all the tissues in the<br />
Cd concentrations for T 0, starting from T 2, however, the shell was found to be significantly<br />
different from the total soft tissue and byssus. As for Cu, the total soft tissue and byssus were<br />
significantly different from the shell from T 0 to T 10. On the other hand, the total soft tissue<br />
and byssus were significantly different from the shell for the Fe concentration from T 0 to T 10.<br />
The rate of elimination (Table 7) for all the metals in the different parts of the transplanted<br />
mussels from Kg. Pasir Puteh to Sg. Melayu was the fastest in all the mussel parts in week<br />
2 (T=2) and this became slower in the subsequent weeks until week 10 (T=10). For byssus,<br />
the rate of elimination was 0.23(T=2), 0.084 (T=6) and 0.033 (T=10) in Cd. During the first 6<br />
weeks of transplantation, the elimination factor (EF) in byssus was the fastest for Cd (0.42) and<br />
Ni (0.49). Meanwhile, the EF in shell was the fastest in Cu (0.22) and Pb (0.35) and slowest<br />
in Cd (0.80). The EF in TST was the fastest for Cu (0.69), Fe (0.65), Pb (0.72) and Zn (0.74).<br />
During the 10-week transplantation, the elimination factor (EF) in byssus was the fastest for Cd<br />
(0.38), Ni (0.25) and Zn (0.37). Meanwhile, the EF in shell was fastest for Cu (0.19), Fe (0.42)<br />
and Pb (0.34) and the slowest for Cd (0.80). These results indicated that byssus eliminated Cd,<br />
Ni concentrations the fastest while shell eliminated Cu and Pb the fastest.<br />
At week 6, the concentrations of Cd in TST, Cu in byssus and TST, Ni in byssus and shell,<br />
Fe in byssus and TST, Pb in byssus and TST and Zn in byssus and TST were far from reaching<br />
the concentrations measured in the initial population (T 0). At week 10, only Cu, Fe, Pb and<br />
Zn in byssus and Ni in shell were far from reaching the concentrations measured in the initial<br />
population (T 0). Such findings had also been reported by several authors when organisms from<br />
polluted areas were transplanted to clean areas such as Zn in the mussel M. edulis (Roseijadi et<br />
al., 1984; Simpson, 1979), Cd and Cu in the oyster Crassostrea gigas (Geffard et al., 2002), Cr,<br />
86 <strong>Pertanika</strong> J. Sci. & Technol. <strong>21</strong> (1): 283 - 298 (<strong>2013</strong>)
Assessment of Heavy Metal Pollution in the Straits of Johore by Using Transplanted Caged Mussel, Perna viridis<br />
<strong>Pertanika</strong> J. Sci. & Technol. <strong>21</strong> (1): 283 - 298 (<strong>2013</strong>)<br />
Fig.3: Comparison of Cu concentrations (mean± SE, µg/g dw; N=3) for<br />
Perna viridis transplanted from Kg. Pasir Puteh to Sg. Melayu and from<br />
Sg. Melayu to Kg. Pasir Puteh<br />
Fig.2: Comparison of Cd concentrations (mean± SE, µg/g dw; N=3) for<br />
Perna viridis transplanted from Kg. Pasir Puteh to Sg. Melayu and from<br />
Sg. Melayu to Kg. Pasir Puteh<br />
*0= Initial, 2=2 weeks, 6= 6 weeks, 10= 10 weeks.<br />
Note: TST= Total soft tissue<br />
*0= Initial, 2=2 weeks, 6= 6 weeks, 10= 10 weeks.<br />
Note: TST= Total soft tissue<br />
87
Eugene Ng, Y. J., Yap, C. K., Zakaria, M. P. and Tan, S. G.<br />
88 <strong>Pertanika</strong> J. Sci. & Technol. <strong>21</strong> (1): 283 - 298 (<strong>2013</strong>)<br />
Fig.5: Comparison of Fe concentrations (mean± SE, µg/g dw; N=3) for<br />
Perna viridis transplanted from Kg. Pasir Puteh to Sg. Melayu and from<br />
Sg. Melayu to Kg. Pasir Puteh<br />
Fig.4: Comparison of Ni concentrations (mean± SE, µg/g dw; N=3) for<br />
Perna viridis transplanted from Kg. Pasir Puteh to Sg. Melayu and from<br />
Sg. Melayu to Kg. Pasir Puteh<br />
*0= Initial, 2=2 weeks, 6= 6 weeks, 10= 10 weeks.<br />
Note: TST= Total soft tissue<br />
*0= Initial, 2=2 weeks, 6= 6 weeks, 10= 10 weeks.<br />
Note: TST= Total soft tissue
Assessment of Heavy Metal Pollution in the Straits of Johore by Using Transplanted Caged Mussel, Perna viridis<br />
<strong>Pertanika</strong> J. Sci. & Technol. <strong>21</strong> (1): 283 - 298 (<strong>2013</strong>)<br />
Fig.7: Comparison of Zn concentrations (mean± SE, µg/g dw; N=3) for<br />
Perna viridis transplanted from Kg. Pasir Puteh to Sg. Melayu and from<br />
Sg. Melayu to Kg. Pasir Puteh<br />
Fig. 6: Comparison of Pb concentrations (mean± SE, µg/g dw; N=3) for<br />
Perna viridis transplanted from Kg. Pasir Puteh to Sg. Melayu and from<br />
Sg. Melayu to Kg. Pasir Puteh<br />
*0= Initial, 2=2 weeks, 6= 6 weeks, 10= 10 weeks.<br />
Note: TST= Total soft tissue<br />
*0= Initial, 2=2 weeks, 6= 6 weeks, 10= 10 weeks.<br />
Note: TST= Total soft tissue<br />
89
Eugene Ng, Y. J., Yap, C. K., Zakaria, M. P. and Tan, S. G.<br />
TABLE 7: Elimination factor (EF), rates of elimination (µg/g per day) of Cd, Cu, Fe, Ni, Pb and Zn in<br />
byssus, total soft tissue and shell of transplanted P. viridis from Kg. Pasir Puteh to Sg. Melayu<br />
Week<br />
EF Rate of elimination<br />
Parts 6 10 2 6 10<br />
Cd Byssus 0.4177 0.383 0.2298 0.084 0.0331<br />
TST 0.7954 NC 0.0307 0.0231 NC<br />
Shell 0.7969 0.8 0.0843 0.0317 0.0749<br />
Cu Byssus 0.4612 0.3663 1.0724 0.4851 0.1979<br />
TST 0.69 NC 0.1779 0.2374 NC<br />
Shell 0.<strong>21</strong>7 0.192 0.7303 0.2758 0.0406<br />
Fe Byssus 0.6417 0.5844 28.6902 24.8251 24.2906<br />
TST 0.6531 NC 23.1779 15.4255 NC<br />
Shell 0.4868 0.4235 0.4982 0.4323 0.<strong>21</strong>4<br />
Ni Byssus 0.4931 0.2477 1.4939 0.6646 0.1949<br />
TST 0.868 NC 0.1629 0.1124 NC<br />
Shell 0.9275 0.7044 0.1141 0.0818 0.4771<br />
Pb Byssus 0.4558 0.4118 1.4579 0.5843 0.2653<br />
TST 0.7202 NC 0.1036 0.1007 NC<br />
Shell 0.3519 0.3448 1.4182 0.7165 0.2287<br />
Zn Byssus 0.6309 0.3653 2.8325 1.5489 0.9196<br />
TST 0.736 NC 1.53<strong>21</strong> 1.0367 NC<br />
Shell 0.4846 0.4543 0.4734 0.1904 0.1007<br />
Note: TST = total soft tissue, NA = reading is not available because mussels samples had died.<br />
Cu and Zn in the clam Mercenaria mercenaria (Behrens & Duedall, 1981), Ag, Co and Ni in the<br />
oyster Isognomon isognomon (Hedouin et al., 2011). When a comparison was made between<br />
weeks 6 and 10, more metals in week 6 were far from reaching the concentrations measured<br />
in the initial population (T 0) due to the accumulation being dependent on the transplantation<br />
period (Hedouin et al., 2011). This indicated that the eliminations of the metals were not<br />
complete throughout the 10-week period of transplantation for P. viridis. Other studies (e.g.,<br />
Andres et al., 1999; Hickey et al., 1995; Martincic et al., 1992; Wallner-Kersanach et al., 2000)<br />
found that the equilibration of the trace metals in bivalves with their environment could range<br />
between 30 days to 77 days and even longer for some other species. Such a wide range in the<br />
equilibration times among the species could be due to previous exposure histories, different<br />
90 <strong>Pertanika</strong> J. Sci. & Technol. <strong>21</strong> (1): 283 - 298 (<strong>2013</strong>)
Assessment of Heavy Metal Pollution in the Straits of Johore by Using Transplanted Caged Mussel, Perna viridis<br />
life stages of bivalve, associated metabolic activities with adjustments to a new environment,<br />
temperature changes, and food availability (Burt et al., 2007).<br />
On the other hand, for the mussels transplanted from Kg. Pasir Puteh to Sg. Melayu, the<br />
metal levels in all the parts showed decreases in heavy metal levels. During the transplantation,<br />
the accumulation rate and the elimination rate were the highest at T 2, which later decreased<br />
from T 2 to T 10. According to Yap et al. (2003a), the rates of accumulation and elimination were<br />
higher during the initial period due to detoxification process. After that, the mussels had slower<br />
rates of accumulation and elimination after 2 weeks, which could be caused by some tightly<br />
bound compartments, such as metallothionein and lysosomes for Pb. According to Amiard<br />
et al. (2006), Marigómez et al. (2002) and Viarengo et al. (2003), metallothionein plays an<br />
important role in the elimination of metals in mussels. The high rates of accumulation and<br />
elimination were also found in byssus at both sites, indicating that this organ could act as an<br />
excretion route for Pb, as reported by Yap et al. (2003b,c). The low EF value in the metals<br />
(Table 7) showed that P. viridis was capable of eliminating these metals. The EF for 6 weeks<br />
and 10 weeks showed that byssus was good at eliminating Cd and Ni, while shell was capable<br />
of eliminating Cu and Pb in the shortest time. The EF value indicated that Ni was the metal<br />
which was eliminated the fastest at week 6, while Cd was eliminated the fastest in week 10.<br />
However, Cu was eliminated the slowest in both week 6 and week 10.<br />
Levels of Metals in the Different Parts of P. viridis after the Transplantation<br />
Similar patterns of accumulation and elimination of metals found in both total soft tissue and<br />
byssus suggested that the metal levels in these parts of P. viridis were mainly due to metabolic<br />
pathways rather than the direct contact with the surrounding seawater. This finding is on par<br />
with the results reported by Ikuta (1986a), Szefer (1999) and Yap et al. (2003b) for the byssus<br />
of M. edulis and P. viridis, especially the high EF values in Fe and Zn for byssus. When the<br />
heavy metal levels in the soft tissue were high, these metals would be transferred metabolically<br />
to the byssus (Ikuta, 1986b; Yap et al., 2003b) due to the metal level regulation in the soft<br />
tissue. Regulation and sequestration are important mechanisms (Phillips & Rainbow, 1989;<br />
Rainbow, 1997; Phillips, 1995) to minimize the harmful effects of high levels of these metals.<br />
The high metal accumulation found in the byssus could also be due to the material for byssus<br />
formation. The byssus was secreted from a byssal gland in the foot and is composed of a<br />
protein component, collagen. These protein components contain some potential metal binding<br />
sites, largely composed of glycine and proline amino acid residues (Szefer et al., 1999; Yap<br />
et al., 2003b).<br />
The highest level of Pb was accumulated in the transplanted mussel shell. This result is<br />
comparable with those of Yap et al. (2003a) and it could be due to the chemical composition<br />
of the shells. The present study revealed that the shells of bivalves were accumulative of nonessential<br />
metals such as Cd, Ni and Pb. The results obtained by Yap et al. (2004) showed that<br />
the metals found in the shells of gastropod could be due to the substitution of the calcium ions<br />
in the crystalline phase of the shell or were associated with the organic matrix of the shell. In<br />
particular, shells accumulated higher concentrations of metals initially due to surface adsorption.<br />
According to Wang (2010), uptake of perfluorinated compounds by shell starts with adsorption<br />
<strong>Pertanika</strong> J. Sci. & Technol. <strong>21</strong> (1): 283 - 298 (<strong>2013</strong>)<br />
91
Eugene Ng, Y. J., Yap, C. K., Zakaria, M. P. and Tan, S. G.<br />
or passive deposition of the target chemicals to the shell organic matrix, and this is followed<br />
by a biomineralisation process. Therefore, the contaminants bound to the organic matrix in<br />
the shell microstructure were sequestrated and hard to release. Meanwhile, the high levels of<br />
metals accumulated in the total soft tissue could also be due to the synthesis of metallothionein<br />
(Yap et al., 2004). This is the reason why the mussels eaten could be a source of metals and<br />
why mussels can survive and accumulate high level of metals in their soft tissues in highly<br />
contaminate sites.<br />
High levels of Cu and Zn accumulations were found in the TST of the transplanted mussels.<br />
These results are similar with those of Yap et al. (2011) for Anadara granosa. The soft tissues of<br />
bivalves were found to be able to induce metallothionein-like protein production at high metal<br />
concentrations (Chan et al., 2002). The secretion of metallothionein was to counteract metal<br />
toxicity at high metal concentrations (Phillips & Rainbow, 1993). MT is generally accepted<br />
to be involved in the regulation of essential metals such as Cu and Zn for cell growth and<br />
development, although their functions are still not fully understood (Mackay et al., 1993). On<br />
the other hand, Cu and Zn are also known as essential metals for metabolic functions (Mackay<br />
et al., 1993) and they can be regulated in bivalves (Yap et al., 2003a). This could explain why<br />
the concentrations of Cu and Zn were high in the TST.<br />
CONCLUSION<br />
The data reported in this paper clearly demonstrated that Kg. Pasir Puteh was a more polluted<br />
site than Sg. Melayu based on the sediment and P. viridis samples for all the six metals. Among<br />
the six metals, Zn was the one which was accumulated at the fastest rate, while Cd was the<br />
slowest. As for elimination, Ni was the fastest at week 6, while Cd was the fastest at week 10<br />
and Cu was the one with the slowest elimination rate at both weeks 6 and 10. The byssus of<br />
P. viridis could be used as a good monitor for Cd, Ni, Pb and Zn, while shell could be used<br />
to monitor Cu, Ni and Pb. However, to get more accurate levels of heavy metal pollutions in<br />
coastal waters, studies with longer transplantation periods should be carried out since some of<br />
the metals needed longer time periods for elimination and to reach equilibrium levels.<br />
ACKNOWLEDGEMENTS<br />
The authors wish to acknowledge the financial support provided through a Research University<br />
Grant Scheme (RUGS), [Vot no: 91986], by <strong>Universiti</strong> <strong>Putra</strong> Malaysia.<br />
REFERENCES<br />
Abdullah, A. R., Woon, W. C., & Bakar, R. A. (1996). Distribution of Oil and Grease and Petroleum<br />
Hydrocarbons in the Straits of Johor, Peninsular Malaysia. Bulletin of Environmental Contamination<br />
and Toxicology, 57, 155-162.<br />
Alfonso, S., Giulia, R., Francois, G., Bruno, A., Marina, A., Pierpaolo, G., Josep, C., Monica, C.,<br />
Juan, A.C., Jose, B.A., Alessandro, C., Samir, B., Cherif, S., Salud, D., Mostefa, B., & Franco, G.<br />
(2010). Western Mediterranean coastal waters—Monitoring PCBs and pesticides accumulation in<br />
Mytilus galloprovincialis by active mussel watching: the Mytilus project. <strong>Journal</strong> of Environmental<br />
Monitoring, 12, 924-935.<br />
92 <strong>Pertanika</strong> J. Sci. & Technol. <strong>21</strong> (1): 283 - 298 (<strong>2013</strong>)
Assessment of Heavy Metal Pollution in the Straits of Johore by Using Transplanted Caged Mussel, Perna viridis<br />
Amiard, J. C., Amiard-Triquet, C., Barka, S., Pellerin, J., & Rainbow, P. S. (2006). Metallothioneins in<br />
aquatic invertebrates: their role in metal detoxification and their use as biomarkers. Aquatic Toxicology,<br />
76, 160–202.<br />
Andres, S., Baudrimont, M., Lapaquellerie, Y., Ribeyre, F., Maillet, N., Latouche, C., & Boudou, A.<br />
(1999). Field transplantation of the freshwater bivalve Corbicula fluminea along a polymetallic<br />
contamination gradient (River Lot, France): I. Geochemical characteristics of the sampling sites and<br />
cadmium and zinc bioaccumulation kinetics. Environmental Toxicology and Chemistry, 18, 2462-2471.<br />
Bayen, S., Thomas, G. O., Lee, H. K., & Jeffrey, P. O. (2003). Organochlorine, pesticides and heavy<br />
metals in green-lipped mussel, Perna viridis in Singapore. Water, Air, and Soil Pollution, 155, 103-116.<br />
Behrens, W. J. & Duedall, I. W. (1981). The behaviour of heavy metals in transplanted hard clams,<br />
Mercenaria mercenaria. <strong>Journal</strong> du Conseil International pour l’Exploitation de la Mer, 39, 223-230.<br />
Burt, A., Maher, W., Roach, A., Krikowa, F., Honkoop, P., & Bayne, B. (2007). The accumulation of<br />
Zn, Se, Cd, and Pb and physiological condition of Anadara trapezia transplanted to a contamination<br />
gradient in Lake Macquarie, New South Wales, Australia. Marine Environmental Research, 64, 54–78.<br />
Chan, M. K., Othman, R., Zubir, D., & Salmijah, S. (2002). Induction of a putative metallothionein<br />
gene in the blood cockle, Anadara granosa, exposed to cadmium. Comparative Biochemistry and<br />
Physiology Part C, 131, 123-132.<br />
Department of Environment (1994). Environmental quality report, 1994. Ministry of Science, Technology<br />
and the Environment, Malaysia.<br />
Department of Environment (2007). Annual Report 2006. Ministry of Science, Technology and the<br />
Environment, Malaysia.<br />
Faverney, C. R., Guibbolini-Sabatier, M. E., & Francour, P. (2010). An ecotoxicological approach with<br />
transplanted mussels (Mytilus galloprovincialis) for assessing the impact of tyre reefs immersed along<br />
the NW Mediterranean Sea. Marine Environmental Research, 70, 87-94.<br />
Francesco, R., & Enzo, O. (1994). Acumulation and subcellular distribution of metals (Cu, Fe, Mn, Pb<br />
and Zn) in the Mediterranean mussel Mytilus galloprovincialis during a field transplant experiment.<br />
Marine Pollution Bulletin, 28(10), 592-600.<br />
Gabr, H. R., & Gab-Alla, A. A-F. A (2008). Effect of transplantation on heavy metal concentrations in<br />
commercial clams of Lake Timsah, Suez Canal, Egypt. Oceanologia, 50(1), 83-93.<br />
Giarratano, E., Duarte, C. A., & Amin, O. A. (2010). Biomarkers and heavy metal bioaccumulation in<br />
mussels transplanted to coastal waters of the Beagle Channel. Ecotoxicology and Environmental<br />
Safety, 73, 270-279.<br />
Goh, B. P. L., & Chou, L. M. (1997). Heavy metal levels in marine sediments of Singapore. Environmental<br />
Monitoring and Assessment, 44, 67–80.<br />
Gorbi, S., Lamberti, C. V., Notti, A., Benedetti, M., Fattorini, D., Moltedo, G., & Regoli, F. (2007). An<br />
ecotoxicological protocol with caged mussels, Mytilus galloprovincialis, for monitoring the impact<br />
of an offshore platform in the Adriatic Sea. Marine Environmental Research 65, 34–49.<br />
Hedouin, L., Pringault, L., Bustamante, P., Fichez, R., & Warnau, M. (2011). Validation of two tropical<br />
marine bivalves as bioindicators of mining contamination in the New Caledonia lagoon: Field<br />
transplantation experiments. Water Research, 45, 483-496.<br />
<strong>Pertanika</strong> J. Sci. & Technol. <strong>21</strong> (1): 283 - 298 (<strong>2013</strong>)<br />
93
Eugene Ng, Y. J., Yap, C. K., Zakaria, M. P. and Tan, S. G.<br />
Hickey, C. W., Roper, D. S., & Buckland, S. J. (1995). Metal concentrations of resident and transplanted<br />
freshwater mussels Hyridella menziesi (Unionacea: Hyriidae) and sediments in the Waikato River,<br />
New Zealand. Science of the Total Environment, 175, 163–177.<br />
Hunt, C. D., & Slone, E. (2010). Long-term monitoring using resident and caged mussels in Boston<br />
Harbor yield similar spatial and temporal trends in chemical contamination. Marine Environmental<br />
Research, 70, 343-357.<br />
Ikuta, K. (1986a). Metal concentrations in byssuses and soft bodies of bivalves. Bulletin Faculty<br />
Agriculture Miyazaki University, 33, 255–264.<br />
Ikuta, K. (1986b). Correlations between ratios of metal concentrations in byssuses to those in soft bodies<br />
and metal concentrations in soft bodies of bivalves. Bulletin Faculty Agriculture Miyazaki University,<br />
33, 265– 273.<br />
Lares, M. L., & Orians, K. J. (1997). Natural Cd and Pb variations in Mytilus californianus during the<br />
upwelling season. Science of The Total Environment, 197, 177-195.<br />
Mackay, E. A., Overnell, J., & Dunbar, B. (1993). Complete amino acid sequences of five dimeric and<br />
four monomeric forms of metallothionein from the edible mussel, Mytilus edulis. European <strong>Journal</strong><br />
of Biochemistry, <strong>21</strong>8, 183-194.<br />
Marigómez, I., Soto, M., Cajaraville, P. M., Angulo, E., & Giamberini, L. (2002). Cellular and subcellular<br />
distribution of metals in molluscs. Microscopy Research and Technique, 56, 358–392.<br />
Martincic, D., Kwokal, Z., Peharec, Z., Margus, D., & Branica, M. (1992). Distribution of Zn, Pb, Cd<br />
and Cu between seawater and transplanted mussels (Mytilus galloprovicialis). The Science of the<br />
Total Environment, 119, <strong>21</strong>1–230.<br />
Moradi, M. A. (2001). The kinetics of uptake and release of polycyclic aromatic hydrocarbons in the<br />
green-lipped mussel (Perna viridis) for biomonitoring of marine pollution (Ph. D Thesis dissertation).<br />
<strong>Universiti</strong> <strong>Putra</strong> Malaysia, Serdang, Selangor, Malaysia.<br />
Nasci, C., Nesto, N., Monteduro, R. A., & Da Ros, L. (2002). Field application of biochemical markers<br />
and a physiological index in the mussel, Mytilus galloprovincialis: transplantation and biomonitoring<br />
in the Lagoon of Venice (NE Italy). Marine Environmental Research, 54, 811–816.<br />
Nigro, M., Falleni, A., Barga, I. D., Scancelli, V., Lucchesi, P., Regoli, F., & Frenzilli, G. (2006). Cellular<br />
biomarkers for monitoring estuarine environments: transplanted versus native mussels. Aquatic<br />
Toxicology, 77, 339–347.<br />
Phillips, D. J. H. (1995). The chemistries and environmental fates of trace metals and organchlorines in<br />
aquatic ecosystems. Marine Pollution Bulletin, 31, 193– 200.<br />
Phillips, D. J. H., & Rainbow, P. S. (1989). Strategies of trace metals sequestration in aquatic organisms.<br />
Marine Environmental Research, 28, 207–10.<br />
Phillips, D. J. H., & Rainbow, P. S. (1993). Biomonitoring of Trace Aquatic Contaminants. London:<br />
Elsevier Science Publishers.<br />
Phillips, D. J. H., & Segar, D. A. (1986). Use of bioindicators in monitoring conservative contaminants:<br />
programme design imperatives. Marine Pollution Bulletin, 17, 10-17.<br />
Rainbow, P. S. (1997). Trace metal accumulation in marine invertebrates: marine biology or marine<br />
chemistry. <strong>Journal</strong> of the Marine Biological Association of the United Kingdom, 77, 195– <strong>21</strong>0.<br />
94 <strong>Pertanika</strong> J. Sci. & Technol. <strong>21</strong> (1): 283 - 298 (<strong>2013</strong>)
Assessment of Heavy Metal Pollution in the Straits of Johore by Using Transplanted Caged Mussel, Perna viridis<br />
Regoli, F. (1992). Lysosomal responses as a sensitive stress index in biomonitoring heavy metal pollution.<br />
Marine Ecology Progress Series, 84, 63-69.<br />
Regoli, F., Frenzilli, G., Bocchetti, R., Annarumma, F., Scancelli, V., Fattorini, D., & Nigro, M. (2004).<br />
Time-course variations of oxyradical metabolism, DNA integrity and lysosomal stability in mussels,<br />
Mytilus galloprovincialis, during a field translocation experiment. Aquatic Toxicology, 68, 167–178.<br />
Regoli, F., & Orlando, E. (1994). Seasonal variation of trace metal concentrations (Cu, Fe, Mn, Pb, Zn)<br />
in the digestive gland of the Mediterranean mussel Mytilus galloprovincialis: comparison between a<br />
polluted and a non polluted site. Archives of Environmental Contamination and Toxicology, 27, 36-43.<br />
Romeo, M., Hoarau, P., Garello, G., Gnassia-Barelli, M., & Girare, J. P. (2003). Mussel transplantation<br />
and biomarkers as useful tools for assessing water quality in the NW Mediterranean. Environmental<br />
Pollution, 122, 369–378.<br />
Roseijadi, G., Young, J. S., Drum, A. S., & Gurtisen, J. M. (1984). Behaviour of trace metals in Mytilus<br />
edulis during a reciprocal transplant field experiment. Marine Ecology Progress Series, 18, 155-170.<br />
Shahbazi, A., Zakaria, M. P., Yap, C. K., Tan, S. G., Surif, S., Mohamed, A. R., Sakari, M., Bakhtiari,<br />
A. R., Bahry, P. S., Chandru, K., & Mirsadeghi, S. A. (2010). Use of different tissues of Perna viridis<br />
as biomonitors of polycyclic aromatic hydrocarbons in the coastal water of Peninsular Malaysia.<br />
Environmental Forensics, 11, 248-263.<br />
Shazili, N. A. M., Yunus, K., Ahmad, A. S., Abdullah, N., & Rashid, M. K. A. (2006). Heavy metal<br />
pollution status in the Malaysian aquatic environment. Aquatic Ecosystem Health, 9, 137–145.<br />
Shulkin, V. M., Presley, B. J., & Kavun, V. I. (2003). Metal concentrations in mussel Crenomytilus<br />
grayanus and oyster Crassostrea gigas in relation to contamination of ambient sediments. Environment<br />
International, 29(4), 493-502.<br />
Simpson, R. D. (1979). Uptake and loss of zinc and lead by mussels (Mytilus edulis) and relationships<br />
with body weight and reproductive cycle. Marine Pollution Bulletin, 10(3), 74-78.<br />
Szefer, P., Ikuta, K., Frelek, K., Zdrojewska, I., & Nabrzyski, M. (1999). Mercury and other trace metals<br />
(Ag, Cr, Co, and Ni) in soft tissue and byssus of Mytilus edulis from the east coast of Kyushu Island,<br />
Japan. The Science of the Total Environment, 229, 227-234.<br />
Tanner, P., Leong, L. S., & Pan, S. M. (2000). Contamination of heavy metals in marine sediment cores<br />
from Victoria Harbour, Hong Kong. Marine Pollution Bulletin, 40, 769-779.<br />
Viarengo, A., Palmero, S., Zanicchi, G., Capelli, R., Vaissiere, R., & Orunesu, M. (2003). Role of<br />
metallothioneins in Cu and Cd accumulation and elimination in the gill and digestive gland cells of<br />
Mytilus galloprovincialis (Lam.). Marine Environmental Research, 16, 23-36.<br />
Wallner-Kersanach, M., Theede, H., Eversberg, U., & Lobo, S. (2000). Accumulation and Elimination of<br />
trace metals in a transplantation experiment with Crassostrea rhizophorae. Archives of Environmental<br />
Contamination and Toxicology, 38, 40–45.<br />
Wang, L. (2010). Can shells be biomonitor of contaminants in the environment: an investigation study<br />
of perfluorinated compounds in bivalve shells of China. Geophysical Research Abstracts, 12.<br />
Wood, A. K., Ahmad, Z., Shazili, N. A. M., Yaakob, R., & Carpenter, R. (1997). Geochemistry of<br />
sediments in Johor Strait between Malaysia and Singapore. Continental Shelf Research, 17, 1207–1228.<br />
<strong>Pertanika</strong> J. Sci. & Technol. <strong>21</strong> (1): 283 - 298 (<strong>2013</strong>)<br />
95
Eugene Ng, Y. J., Yap, C. K., Zakaria, M. P. and Tan, S. G.<br />
Yap, C. K., Ismail, A., & Tan, S.G. (2003d). Background concentrations of Cd, Cu, Pb and Zn in the<br />
green-lipped mussel Perna viridis (Linnaeus) from Peninsular Malaysia. Marine Pollution Bulletin<br />
46, 1035-1048.<br />
Yap, C. K., Ismail, A., Edward, F. B., Tan, S. G., & Siraj, S.S. (2006). Use of different soft tissues of<br />
Perna viridis as biomonitors of bioavailability and contamination by heavy metals (Cd, Cu, Fe, Pb,<br />
Ni, and Zn) in a semi-enclosed intertidal water, the Johore Straits. Toxicological & Environmental<br />
Chemistry, 88(4), 683–695.<br />
Yap, C. K., Ismail, A., Omar, H., & Tan, S. G. (2003a). Accumulation, depuration and distribution of<br />
cadmium and zinc in the green-lipped mussel Perna viridis (Linnaeus) under laboratory condition.<br />
Hydrobiologia, 498, 151-160.<br />
Yap, C. K., Ismail, A., Tan, S. G., & Ismail, A. R. (2004). Assesment of different soft tissues of the greenlipped<br />
mussel Perna viridis (Linnaeus) as biomonitoring agents of Pb: Field and laboratory studies.<br />
Water, Air and Soil Pollution, 153, 253-268.<br />
Yap, C. K., Ismail, A., Tan, S. G., & Omar, H. (2002). Correlations between speciation of Cd, Cu, Pb<br />
and Zn in sediment and their concentrations in total soft tissue of green-lipped mussel Perna viridis<br />
from the west coast of Peninsular Malaysia. Environmental International, 28, 117-126.<br />
Yap, C. K., Ismail, A., Tan, S. G., & Rahim I. A. (2003b). Can the byssus of green-lipped mussel Perna<br />
viridis (Linnaeus) from the west coast of Peninsular Malaysia be a biomonitoring organ for Cd, Pb<br />
and Zn? Field and laboratory studies. Environmental International, 29, 5<strong>21</strong>-528.<br />
Yap, C. K., Muhamad Azlan, A. G., Cheng, W. H., & Tan, S. G. (2011). Accumulation and Depuration of<br />
Cu and Zn in the Blood Cockle Anadara granosa (Linnaeus) under Laboratory Conditions. <strong>Pertanika</strong><br />
<strong>Journal</strong> of Tropical Agricultural Science, 34(1), 75 – 82.<br />
Yap, C. K., Tan, S. G., Ismail, A., & Omar, H. (2002). Genetic variation of green-lipped mussel Perna<br />
viridis (Linnaeus) from the west coast of Peninsular Malaysia. Zoological Studies 41(1), 376-387.<br />
Zar, J. H. (1996). Biostatistical Analysis (3rd Ed.). Upper Saddle River, New Jersey: Prentice-Hall, pp.<br />
662.<br />
Zulkifli, S. Z., Ismail, A., Mohamat-Yusuff, F., Arai, T., & Miyazaki, N. (2010). Johor Strait as a Hotspot<br />
for Trace Elements Contamination in Peninsular Malaysia. Bulletin of Environmental Contamination<br />
and Toxicology, 84, 568-573.<br />
96 <strong>Pertanika</strong> J. Sci. & Technol. <strong>21</strong> (1): 283 - 298 (<strong>2013</strong>)
ISSN: 0128-7680 © <strong>2013</strong> <strong>Universiti</strong> <strong>Putra</strong> Malaysia Press.<br />
<strong>Pertanika</strong> J. Sci. & Technol. <strong>21</strong> (1): 97 - 110 (<strong>2013</strong>)<br />
SCIENCE & TECHNOLOGY<br />
<strong>Journal</strong> homepage: http://www.pertanika.upm.edu.my/<br />
Physico-Chemical and Electrical Properties of Bismuth Chromate<br />
Solid Solutions<br />
Wong Y. C. 1,2 and Tan Y. P. 1,2 *<br />
1 Centre of Excellence for Catalysis Science and Technology, <strong>Universiti</strong> <strong>Putra</strong> Malysia, 43400 Serdang,<br />
Selangor, Malaysia<br />
2 Department of Chemistry, Faculty of Science, <strong>Universiti</strong> <strong>Putra</strong> Malysia, 43400 Serdang, Selangor,<br />
Malaysia<br />
ABSTRACT<br />
Bismuth chromium solid solutions, with a general formula Bi 6-xCr 2O δ, where -1 ≤ x ≤ 2, were successfully<br />
synthesized via the conventional solid state method. The phases of the synthesized samples were<br />
determined by X-ray diffraction (XRD) analysis. The properties of single-phase compounds were<br />
characterized by using differential thermal analysis (DTA), thermal gravimetric analysis (TGA), AC<br />
impedance spectroscopy, and inductively coupled plasma-atomic emission spectroscopy (ICP-AES). The<br />
occurrence of phase transitions was confirmed by DTA and TGA, where a thermal event was observed<br />
by DTA at around 800 o C. In addition, TGA studies also showed that there was a weight loss at around<br />
800 o C. Elemental analysis of Bi 6Cr 2O 15 and its solid solutions by ICP-AES showed a good agreement<br />
between the expected value and the experimental value on the compositions, with no evidence of any<br />
systematic deviation from stoichiometric. Electrical properties of Bi 6Cr 2O 15 and its solid solutions were<br />
investigated by using AC impedance spectroscopy from 300 o C to 650 o C. Ionic conductivity increased<br />
with the increasing temperature and bismuth content, and the best ionic conductivity was observed for<br />
Bi 7Cr 2O 16.5. The activation energy (E a) of Bi 6Cr 2O 15 and its solid solutions were in the range of 1.22-<br />
1.32 eV.<br />
Keywords: Bismuth oxide, Chromium oxide, Impedance spectroscopy<br />
Article history:<br />
Received: 18 May 2011<br />
Accepted: <strong>21</strong> December 2011<br />
E-mail addresses:<br />
stevenwongyc@hotmail.com (Wong Y. C.),<br />
yptan@science.upm.edu.my (Tan Y. P.),<br />
*Corresponding Author<br />
INTRODUCTION<br />
Magneto-electric materials, in which magnetic<br />
and ferroelectric orders coexist, are currently<br />
attracting more and more attention owing to<br />
their potential applications and intriguing<br />
physics. Bi-based 3d-transition metal oxides<br />
with distorted perovskite structures, such as<br />
BiMnO 3 and BiFeO 3, are important magneto-
Wong Y. C. and Tan Y. P.<br />
electric materials (Chi et al., 2007; Li et al., 2006; Selbach et al., 2010; Yang et al., 2007). It is<br />
believed that the lone-pair electrons of Bi play a crucial role in ferroelectricity. The Bi 2O 3–Cr 2O 3<br />
system was investigated to explore novel magneto-electric compounds.<br />
The phase diagram of the Bi 2O 3-Cr 2O 3 system consisted of three compounds which were<br />
synthesized by solid-state reactions: Bi 18CrO 30 (tetragonal, a = b = 7.74 Å, c = 5.72 Å), Bi 6Cr 2O 15<br />
(orthorhombic, a = 5.55 Å, b = 5.76 Å, c = 5.50 Å), and BiCrO 3 (orthorhombic, a = 10.52 Å, b =<br />
17.63 Å, c = 9.995 Å) (Liu et al., 2008). Later, the phase diagram of the pseudo-binary system<br />
Bi 2O 3-Cr 2O 3 was reconstructed based on the x-ray diffraction measurement and differential<br />
thermal analysis by Liu et al. (2008). Four intermediate phases were determined in this system,<br />
namely, Bi 14CrO 24-based solid solutions (space group I4Im), Bi 10Cr 2O <strong>21</strong>-based high temperature<br />
solid solutions (orthorhombic symmetry), a new compound Bi 2CrO 6 (monoclinic symmetry)<br />
and the stoichiometric compound Bi 6Cr 2O 15 (orthorhombic symmetry, with unit cell parameters,<br />
a = 12.3018 Å, b = 19.8749 Å, and c = 5.8816 Å and space group Ccc2) (Liu et al., 2008).<br />
In term of ionic conductivity, the compound Bi 6Cr 2O 15 could be expected to be a good<br />
oxygen ion conductor, in view of its structural similarity to the solid solution Bi(Bi 12-xTe xO 14)<br />
Mo 4-xV 1+xO 20 (0 ≤ x ≤ 2.5), which exhibits a conductivity as high as σ = 8.0 x 10 -3 (Ω cm) -1 at<br />
750 o C (x = 1) with an activation energy, E a = 0.84 eV. It is, however, found to be considerably<br />
modest oxygen ion conductor. It is speculative to attribute this to any structural difference<br />
between the phases, but it seems to imply that the high oxygen ion mobility in the column<br />
phases is not provided solely by the presence of the column, but also significantly depends on<br />
the atoms and the arrangement between the columns (Grins et al., 2002).<br />
Previously, the thermogravimetric analyses done by Esmaeilzadeh et. al. (2001) showed<br />
that upon heating mixtures of Bi 2O 3 and Cr 2O 3 in air, an irreversible increase in weight began<br />
at 450-500 o C and reached, depending on the Cr concentration, a plateau at 650 to 900 o C. The<br />
weight increase corresponded well to that of a complete oxidation of Cr 3+ to Cr 6+ . This oxidative<br />
behaviour is quite unusual for Cr-containing materials in air, at normal pressure, and these<br />
high temperatures. Magnetic susceptibility measurements confirmed an oxidation state of +6<br />
for Cr, as no or only very weak paramagnetic signals were observed (Colmont et al., 2010).<br />
In this work, the focus was placed on synthesizing Bi 6Cr 2O 15 and its solid solutions, as<br />
well as investigating their physico-chemical and electrical properties.<br />
EXPERIMENTAL<br />
Powder sample of bismuth chromate (Bi 6Cr 2O 15) and its solid solutions were prepared via solid<br />
state reactions using Bi 2O 3 (Aldrich, 99.999%) and Cr 2O 3 [Johnson Matthey (JM), 99.999%] as<br />
starting materials. The samples were heat-treated at 600 o C for 48-72 hours with intermediate<br />
grindings. The phase identity and purity of the synthesized samples were determined by X-ray<br />
diffraction (XRD) analysis (Shimadzu diffractometer XRD-6000), which was equipped with<br />
a diffracted-beam graphite monochromator using CuKα radiation. The morphology of the<br />
samples was studied using scanning electron microscopy (LEO 1455 VP SEM).<br />
The thermal properties of the samples were determined by using the differential thermal<br />
analysis, DTA (Perkin-Elmer instrument, model DTA 7) and thermal gravimetric analysis, TGA<br />
(Mettler Toledo Star SW 7.01). Inductively coupled plasma-atomic emission spectroscopy (ICP-<br />
98 <strong>Pertanika</strong> J. Sci. & Technol. <strong>21</strong> (1): 283 - 298 (<strong>2013</strong>)
Physico-Chemical and Electrical Properties of Bismuth Chromate Solid Solutions<br />
AES) (Perkin-Elmer P1000) was used to carry out the elemental analysis. Fourier-transform<br />
infrared (FT-IR) spectrometer (Perkin-Elmer model 1725x), with the wavenumber range in<br />
the region of 4000 and 400 cm -1 , was used for the structural analysis. The electrical properties<br />
of the pelleted samples were studied by using AC impedance analyzer (Hewlett-Packard<br />
Impedance Analyzer HP 4192A). The frequency range of 5 Hz to 13 MHz with an applied<br />
voltage of 100 mV was used. The measurements were made between 300 o C and 650 o C by<br />
increment steps of 50 o C with 30 minutes stabilization time. The measurements were carried<br />
out on heat-cool thermal cycles.<br />
RESULTS AND DISCUSSION<br />
XRD and SEM Results<br />
Fig.1 shows the XRD pattern of Bi 6Cr 2O 15 and its solid solutions prepared via conventional<br />
solid state method. Bi 6Cr 2O 15 and its solid solutions were indexed using the orthorhombic<br />
system with lattice parameters: a = 12.30184 Å, b = 19.87492 Å, c = 5.88162 Å, and in space<br />
group of Ccc2 (Grins et al., 2002; Liu et al., 2008). From the results obtained, the limit of<br />
the solid solutions in Bi 2O 3-Cr 2O 3 system was in the range 4 to 7. The four single phase solid<br />
solutions that crystallized in orthorhombic system were Bi 4Cr 2O 12, Bi 5Cr 2O 13.5, Bi 6Cr 2O 15<br />
and Bi 7Cr 2O 16.5. As for Bi 3Cr 2O 10.5, two extra peaks were observed at 24.5 o and 33.6 o . These<br />
two peaks were due to the formation of chromium oxide (ICDD card number, 01-070-<br />
3765). Meanwhile, there were seven extra peaks observed in Bi 8Cr 2O 18, in the positions of<br />
31.0778 o , 32.6381 o , 45.4703 o , 46.5948 o , 53.<strong>21</strong>93 o , 54.6160 o , and 55.2515 o . All these peaks<br />
were attributed to the formation of δ-bismuth oxide (δ-Bi 2O 3) (ICDD card number: 01-074-<br />
1633, 00-027-0052, 00-051-1161).<br />
As the composition varies, the solid solutions may undergo a small contraction or<br />
expansion. According to Vegard’s law, unit-cell parameters should change linearly with the<br />
composition. The evolution of the unit-cell parameters versus composition was plotted and is<br />
shown in Fig.2 to Fig.4. All the parameters a, b and c underwent a regular increase from x =<br />
4 to x = 7. This general increase of all unit-cell parameters can be expected, since a smaller<br />
cation, Cr (ionic radius = 0.51 Å), is being substituted for by a larger Bi (ionic radius = 1.20<br />
Å) (Bëguë et al., 2002).<br />
Fig.5(a), (b), (c), and (d) show the scanning electron microscopy (SEM) images of the<br />
samples. All the samples have displayed a similar morphology where the microstructures were<br />
homogeneously distributed in the lattice. No secondary phase was observed in the structure,<br />
and therefore, the samples synthesized were in the single phase. Some pores were also observed<br />
in the inter-granular area, indicating a moderate connection between the grains.<br />
Structural Analysis<br />
The IR absorption spectra of the single-phase orthorhombic structure compounds, Bi xCr 2O δ, 4<br />
≤ x ≤ 7, have similar patterns as shown in Fig.6. A broad, diffuse band was observed at ~850<br />
cm -1 and ~792 cm -1 in the IR spectra of all the compounds. This may be due to the Cr-O-Cr<br />
bond vibration and Cr-O stretching (Brown et al., 1967; Jezowska-Trzebiatowska et al., 1968).<br />
<strong>Pertanika</strong> J. Sci. & Technol. <strong>21</strong> (1): 283 - 298 (<strong>2013</strong>)<br />
99
Intensity ( arbritary unit )<br />
(f)<br />
(e)<br />
(d)<br />
(c)<br />
(b)<br />
(a)<br />
Wong Y. C. and Tan Y. P.<br />
10 20 30 40 50 60<br />
2 Θ (degrees)<br />
100 <strong>Pertanika</strong> J. Sci. & Technol. <strong>21</strong> (1): 283 - 298 (<strong>2013</strong>)<br />
*<br />
#<br />
*<br />
#<br />
#<br />
#<br />
* Cr 2 O 3<br />
# Bi 2 O 3<br />
Fig.1: The XRD patterns of (a) Bi 3Cr 2O 10.5, (b)Bi 4Cr 2O 12, (c) Bi 5Cr 2O 13.5, (d) Bi 6Cr 2O 15, (e) Bi 7Cr 2O 16.5,<br />
and (f) Bi 8Cr 2O 18 prepared at 600 o C<br />
Fig.2: Variation of the lattice parameter, a, with composition, x, in Bi xCr 2O δ, 4 ≤ x ≤ 7<br />
#<br />
#<br />
#
Physico-Chemical and Electrical Properties of Bismuth Chromate Solid Solutions<br />
Fig.3: Variation of the lattice parameter, b, with composition, x, in Bi xCr 2O δ, 4 ≤ x ≤ 7<br />
Fig.4: Variation of the lattice parameter, c, with composition, x, in Bi xCr 2O δ, 4 ≤ x ≤ 7<br />
<strong>Pertanika</strong> J. Sci. & Technol. <strong>21</strong> (1): 283 - 298 (<strong>2013</strong>)<br />
101
Wong Y. C. and Tan Y. P.<br />
a b<br />
c d<br />
Fig.5: The SEM image for (a) Bi 4Cr 2O 12, (b) Bi 5Cr 2O 13.5, (c) Bi 6Cr 2O 15, and (d) Bi 7Cr 2O 16.5, sintered at<br />
600 o C<br />
Fig.6: The FT-IR spectra of (a) Bi 4Cr 2O 12, (b) Bi 5Cr 2O 13.5, (c) Bi 6Cr 2O 15, and (d) Bi 7Cr 2O 16.5<br />
102 <strong>Pertanika</strong> J. Sci. & Technol. <strong>21</strong> (1): 283 - 298 (<strong>2013</strong>)
Physico-Chemical and Electrical Properties of Bismuth Chromate Solid Solutions<br />
Arbritary weight ( percentage )<br />
(d)<br />
(c)<br />
(b)<br />
(a)<br />
Fig.7: DTA thermogram of Bi 6Cr 2O 15<br />
100 200 300 400 500 600 700 800<br />
Temperature ( o C )<br />
However, no shift was observed in the wavenumbers of Cr-O-Cr bond vibration, as well as Cr-O<br />
stretching with the variation of the Cr content. The band of ~ 587 cm -1 and ~ 467 cm -1 in the<br />
IR spectra was attributed to the vibration of Bi-O and Bi-O-Bi vibrations of [BiO 6] octahedral<br />
units, respectively (Cheng et al., 2006; Rico-Fuentes et al., 2005).<br />
The atomic weight of Bi is about four times larger than that of Cr. Moreover, the ionic radius<br />
of Bi 3+ (1.20 Å) is larger than that of Cr 3+ (0.69 Å). Thus, Bi-O bond length is expected to be<br />
longer and weaker compared to Cr-O bond. This may lead to the lowering of wavenumber (υ)<br />
at 587 cm -1 and 467 cm -1 . The Bi contents for the compounds Bi xCr 2O δ, 4 ≤ x ≤ 7 are different<br />
and it is expected that υ would decrease with increasing Bi content. However, from the IR<br />
spectra obtained, the υ does not decrease with the increasing Bi content. It may due to Bi-O<br />
<strong>Pertanika</strong> J. Sci. & Technol. <strong>21</strong> (1): 283 - 298 (<strong>2013</strong>)<br />
1.02 %<br />
0.89 %<br />
0.96 %<br />
0.77 %<br />
Fig.8: The TGA thermographs of (a) Bi 4Cr 2O 12, (b) Bi 5Cr 2O 13.5, (c) Bi 6Cr 2O 15, and (d) Bi 7Cr 2O 16.5 with<br />
their respective percentage weight loss<br />
103
Wong Y. C. and Tan Y. P.<br />
bond existed in the form of [BiO 6] octahedral units which restricted its vibration (Ardelean<br />
et al., 2008).<br />
Thermal Properties<br />
The DTA thermograms of all solid solutions exhibited a similar pattern. Here, only the<br />
thermogram of Bi 6Cr 2O 15 (Fig.7) is shown for discussion. The endothermic peak around 600 o C<br />
was due to the oxidation of Cr 3+ into Cr 6+ , which began at 450 o C to 600 o C (Esmaeilzadeh et<br />
al., 2001). Besides, an endothermic peak was also observed at the temperature around 800 o C<br />
on the heating cycle, which ascribed to the transformation of orthorhombic Bi 6Cr 2O 15 into the<br />
high temperature solid solution, face-centred orthorhombic Bi 10Cr 2O <strong>21</strong>. It was an irreversible<br />
transformation, where the face-centred orthorhombic Bi 10Cr 2O <strong>21</strong>, once formed at 800 o C, could<br />
not be transformed back into the orthorhombic Bi 6Cr 2O 15 on cooling (Liu et al., 2008).<br />
All the solid solutions showed a similar TGA thermograph pattern (Fig.8). In particular,<br />
Thermogravimetric measurements did not show any weight loss when the samples were heated<br />
up until 700 o C. After 700 o C, a weight loss was observed, indicating Bi 6Cr 2O 15 and its solid<br />
solutions had undergone phase transition from orthorhombic to face-centred orthorhombic<br />
structure (Liu et al., 2008). It further confirmed the DTA results that the phase transition<br />
occurred at high temperature.<br />
Elemental Analysis<br />
The compositions of the solid solutions were examined by using ICP-AES and the data are<br />
shown in Table 1. With the increasing chromium content in the order of Bi 7Cr 2O 16.5 to Bi 4Cr 2O 12,<br />
both Bi 4Cr 2O 12 and Bi 5Cr 2O 13.5 were unable to dissolve either in concentrated hydrochloric<br />
acid (HCl) or hydrofluoric acid (HF). Therefore, the elemental analysis for the chromium<br />
content in these two samples was ignored. These two samples were tested only for bismuth<br />
composition. In general, the experimental values for the composition are in good agreement with<br />
the calculated values, with no evidence of any systematic deviation from the stoichiometric.<br />
Thus, the stoichiometric compositions of the single phase materials were confirmed.<br />
TABLE 1: Composition determination of solid solutions in the Bi 2O 3-Cr 2O 3 system<br />
Sample Elements Atomic %<br />
Calculated Experimental<br />
Bi 4Cr 2O 12 Bi 73.85 76.78 ± 0.56<br />
Cr - -<br />
O - -<br />
Bi 5Cr 2O 13.5 Bi 76.56 76.57 ± 0.60<br />
Cr - -<br />
O - -<br />
104 <strong>Pertanika</strong> J. Sci. & Technol. <strong>21</strong> (1): 283 - 298 (<strong>2013</strong>)
TABLE 1: (continued)<br />
Physico-Chemical and Electrical Properties of Bismuth Chromate Solid Solutions<br />
Bi 6Cr 2O 15 Bi 78.47 78.70 ± 0.19<br />
Cr 6.51 6.34 ± 0.48<br />
O 15.02 14.96<br />
Bi 7Cr 2O 16.5 Bi 79.90 81.93 ± 0.72<br />
Electrical Properties<br />
Cr 5.68 5.54 ± 0.61<br />
O 14.42 12.53<br />
The conductivity values of the materials were extracted from complex plane plots. In general,<br />
the complex plane plots of the four solid solutions were similar, and therefore, the parent<br />
compound (Bi 6Cr 2O 15) was selected for the discussion. The conductivity measurements of<br />
solid solutions were reproducible on heating and cooling. The complex plane plot of Bi 6Cr 2O 15<br />
at 450 o C (Fig.9) showed that the resistance (R) of the material was 2.3871 x 10 5 ohm cm.<br />
Thus, the semicircle has an associated capacitance (C b) (calculated from ωRC = 1, where ω<br />
is the frequency of maximum loss) of 6.67 x 10 -12 F cm -1 , which is a typical value for bulk<br />
component. The conductivity of the material at 450 o C was 4.189 x 10 -6 Ω -1 cm -1 . The moderate<br />
ionic conductivity of the samples was due to the moderate connection between the grains, as<br />
a result of the presence of pore in the inter-granular area, as shown in the SEM image (Fig.5).<br />
As the temperature increased, the intercept at the real component of impedance, Z’ (resistive)<br />
axis shifted towards lower value and gave the lower resistance value. Hence, the conductivity<br />
Fig.9: A complex plane plot of Bi 6Cr 2O 15 at 450 o C<br />
<strong>Pertanika</strong> J. Sci. & Technol. <strong>21</strong> (1): 283 - 298 (<strong>2013</strong>)<br />
105
Wong Y. C. and Tan Y. P.<br />
increased with the increasing temperature. The optimum conductivity of Bi 6Cr 2O 15 was observed<br />
at 650 o C with a conductivity value of 4.456 x 10 -4 Ω -1 cm -1 .<br />
The homogeneity of the materials can be observed from the complex plane plots. A single<br />
semicircle observed indicated that this material was homogeneous. The homogeneity of the<br />
materials can also be determined from the combined spectroscopic plots of electric modulus,<br />
M”, and the imaginary components of impedance, -Z” versus log f (where f was frequency).<br />
Fig.10 shows the combined spectroscopic plots of M”, -Z” versus log f of Bi 6Cr 2O 15 at 450 o C.<br />
It showed a single peak and the frequency maxima of Z” and M” coincided at a higher<br />
frequency, where the full width at half maximum (FWHM) of the Z” peaks was approximately<br />
1.4 decade. Thus, this material can be considered as homogeneous and the conductivity was<br />
purely attributed by bulk.<br />
Ionic conductivity is temperature dependence and is related by the Arrhenius equation:<br />
s = Aexp( - E / RT )<br />
(1)<br />
where σ is ionic conductivity, A is pre-exponential factor, E is activation energy, R is constant<br />
and T is temperature. When the temperature increases, the mobility of ions also increases and<br />
thus the ionic conductivity increases.<br />
Fig.11 shows the combination of the Arrhenius plots of all pure phase solid solutions in<br />
Bi 2O 3-Cr 2O 3 system. The conductivity behaviour is similar for all materials studied and is<br />
temperature dependence. The conductivity increased in the order of Bi 4Cr 2O 12 < Bi 5Cr 2O 13.5 ~<br />
Bi 6Cr 2O 15 < Bi 7Cr 2O 16.5. The conductivity increased with the increasing bismuth content in the<br />
stoichiometric equation. Meanwhile, the ionic radius of bismuth is larger than chromium, and<br />
therefore enlarging the cell volume of the materials and making the passage of charge carriers<br />
through more feasible cells (Galy et al., 2003).<br />
A linear straight line was observed from 400 o C up to 650 o C. Below 400 o C, a curvature was<br />
observed. The curvature in the plot may be due to a temperature dependence of the activation<br />
energy (e.g., E a = E a0 - E a1.T 2 ) or to different conduction mechanisms dominating at lower and<br />
higher temperatures (Grins et al., 2002). Deviation at high temperature can correlate to the<br />
phase transformation from Bi 6Cr 2O 15 to face-centred orthorhombic Bi 10Cr 2O <strong>21</strong> and monoclinic<br />
Bi 2CrO 6 above 650 o C (Liu et al., 2008). From the linear range of the plot, the activation<br />
energies (E a) calculated were in the range within 1.22 eV to 1.32 eV. The best ionic solid has<br />
an activation energy of 1 eV (96 kJ mole -1 ) or lower. For example, Bi 5NbO 10 and Bi 26Mo 10O δ,<br />
which are good ionic conductors, have E a of 0.94 eV and 0.47 eV, respectively (Hou et al.,<br />
2010; Begue et al., 1998). Hence, solid solutions in Bi 2O 3-Cr 2O 3 system were considered as<br />
moderate oxide ion conductors.<br />
106 <strong>Pertanika</strong> J. Sci. & Technol. <strong>21</strong> (1): 283 - 298 (<strong>2013</strong>)
Physico-Chemical and Electrical Properties of Bismuth Chromate Solid Solutions<br />
Fig.10: The modulus spectroscopic plot of M”, -Z” versus log f of Bi 6Cr 2O 15 at 450 o C<br />
CONCLUSION<br />
Fig.11: The Arrhenius conductivity plots of Bi xCr 2O δ (4 ≤ x ≤ 7)<br />
The solid solutions in the Bi 2O 3 – Cr 2O 3 system have been successfully synthesized via<br />
conventional solid state method. Among the compounds synthesized in which Bi:Cr ratio range<br />
from 1.5:1 to 4:1 and as determined from the X-ray diffraction (XRD) analyses, only four<br />
were in the pure phase with the orthorhombic structure, i.e. Bi 4Cr 2O 12, Bi 5Cr 2O 13.5, Bi 6Cr 2O 15<br />
and Bi 7Cr 2O 16.5. The SEM image showed a homogeneous dispersion of microstructure and<br />
the presence of pores in the inter-granular area. The occurrence of the phase transitions at<br />
high temperatures was confirmed by the thermal analyses. The thermal analyses showed an<br />
irreversible endothermic peak at temperature ~ 800 o C on heating cycle. Besides, the TGA<br />
results showed that there is a weight loss after 700 o C.<br />
The activation energy for the solid solution in Bi 2O 3-Cr 2O 3 system is in the range 1.22<br />
eV- 1.32 eV. The moderate ionic conductivity of the samples can be related to the moderate<br />
<strong>Pertanika</strong> J. Sci. & Technol. <strong>21</strong> (1): 283 - 298 (<strong>2013</strong>)<br />
107
Wong Y. C. and Tan Y. P.<br />
connection between the grains, which is due to the presence of pores in the inter-granular area.<br />
However, conductivity increases with the increasing temperature and bismuth content. The<br />
conductivity of the solid solutions increased in the order of: Bi 4Cr 2O 12 < Bi 5Cr 2O 13.5 ~ Bi 6Cr 2O 15<br />
< Bi 7Cr 2O 16.5. Among the solid solutions, Bi 7Cr 2O 16.5 is the best ionic conductor and has the<br />
highest conductivity. From the results of the electrical measurement, the solid solutions for<br />
Bi 2O 3-Cr 2O 3 system can be concluded as moderate oxide ion conductors at the temperature<br />
above 350 o C.<br />
ACKNOWLEDGEMENTS<br />
The authors are grateful for the financial support given by the Ministry of Science, Technology,<br />
and Innovation (MOSTI) via Science Fund.<br />
REFERENCES<br />
Ardelean, I., Cora, S., & Rusu, D. (2008). EPR and FT-IR spectroscopic studies of Bi 2O 3–B 2O 3– CuO<br />
glasses. Physica B, 403, 3682– 3685.<br />
Begue, P, Rojo, J. M., Enjalbert, R., Galy, J., & Castro, A. (1998). Ionic conductivity of the new oxide<br />
family Bi[Bi 12-xTe xO 14]Mo 4-xV 1+xO 20. Solid State Ionics, 112, 275–280.<br />
Bëguë, P., Rojo, J.M., Iglesias, J. E., & Castro, A. (2002). Different [Bi 12O 14] n columnar structural types<br />
in the Bi-Mo-Cr-O system: synthesis, structure, and electrical properties of the solid solution Bi 26Mo 10xCr<br />
xO 69. <strong>Journal</strong> of Solid State Chemistry, 166, 7-14.<br />
Brown, D. A., Cunningham, D., & Glass, W. K. (1967). The infrared and Raman spectra of chromium<br />
(III) oxide. Spectrochimita Acta Part A: Molecular Spectroscopy, 24, 965- 968.<br />
Cheng, Y., Xiao, H. N., Guo, W. M., & Guo, W. M. (2006). Structure and crystallization kinetics of<br />
Bi 2O 3–B 2O 3 glasses. Thermochimica Acta, 444, 173–178.<br />
Chi, Z. H., Yang, H., Feng, S. M., Li, F. Y., Yu, R. C., & Jin, C. Q. (2007). Room-temperature ferroelectric<br />
polarization in multiferroic BiMnO 3. <strong>Journal</strong> of Magnetism and Magnetic Materials, 310, e358-e360.<br />
Colmont, M., Drache, M., & Roussel, P. (2010). Synthesis and characterization of Bi 31Cr 5O 61.5, a new<br />
bismuth chromium oxide, potential mixed-ionic-electronic conductor for solid oxide fuel cells. <strong>Journal</strong><br />
of Power Sources, 195, 7207-7<strong>21</strong>2.<br />
Esmaeilzadeh, S., Lundgren, S., Haslenius, U., & Grins, J. (2001). Bi 1-xCr xO 1.5+1.5x, 0.05 ≤ x ≤ 0.15: A<br />
new high-temperature solid solution with a three-dimensional incommensurate modulation. <strong>Journal</strong><br />
of Solid State Chemistry, 156, 168-180.<br />
Galy, J., Enjalbert, R., Rozier, P., & Millet, P. (2003). Lone pair stereoactivity versus anionic conductivity.<br />
Columnar structures in the Bi 2O 3–MoO 3 system. Solid State Sciences, 5, 165-174.<br />
Grins, J., Esmaeilzadeh, S., & Hull, S. (2002). Structure and ionic conductivity of Bi 6Cr 2O 15, a new<br />
structure type containing (Bi 12O 14) 8n+ n columns and CrO 2- 4 tetrahedra. <strong>Journal</strong> of Solid State Chemistry,<br />
163, 144–150.<br />
Hou, J. G., Vaisha, R., Qu, Y. F., Krsmanovic, D., Varma, K. B. R., & Kumar, R. V. (2010). Dielectric<br />
relaxation and electrical conductivity in Bi 5NbO 10 oxygen ion conductors prepared by a modified<br />
sol–gel process. <strong>Journal</strong> of Power Source, 195, 2613-2618.<br />
108 <strong>Pertanika</strong> J. Sci. & Technol. <strong>21</strong> (1): 283 - 298 (<strong>2013</strong>)
Physico-Chemical and Electrical Properties of Bismuth Chromate Solid Solutions<br />
Jezowska-Trzebiatowska, B., Hanuza, J., Wojciechowski, W., & Nawojska, J. (1968). Spectroscopic<br />
studies and structural chemistry of Cr III /Cr VI compounds in the solid state. Inorganica Chimica Acta,<br />
2, 202-207.<br />
Li, M.C., Judith, D., Liu, L. H., & Zhao, L. C. (2006). The phase transition and phase stability of<br />
magnetoelectric BiFeO3. Materials Science and Engineering A., 438-440, 346-349.<br />
Liu, Y. H., Li, J. B., Liang, J. K., Luo, J., Ji, L. N., Zhang, J. Y., & Rao, G. H. (2008) Phase diagram of<br />
the Bi 2O 3-Cr 2O 3 system. Materials Chemistry and Physics, 112, 239–243.<br />
Rico-Fuentes, O., Sanchez-Aguilera, E., Velasquez, C., Ortega-Alvarado, R., Alonso, J. C., & Ortiz, A.<br />
(2005). Characterization of spray deposited bismuth oxide thin films and their thermal conversion to<br />
bismuth silicate. Thin Solid Films, 478, 96– 102.<br />
Selbach, S. M., Tybell, T., Einarsrud, M-A., & Grande, T. (2010). Phase transitions, electrical conductivity<br />
and chemical stability of BiFeO 3 at high temperatures. <strong>Journal</strong> of Solid State Chemistry, 183, 1205-<br />
1208.<br />
Yang, C. H., Koo, T. Y., & Jeong, Y. H. (2007). Orbital order, magnetism, and ferroelectricity of<br />
multiferroic BiMnO 3. <strong>Journal</strong> of Magnetism and Magnetic Materials, 310, 1168–1170.<br />
<strong>Pertanika</strong> J. Sci. & Technol. <strong>21</strong> (1): 283 - 298 (<strong>2013</strong>)<br />
109
ISSN: 0128-7680 © <strong>2013</strong> <strong>Universiti</strong> <strong>Putra</strong> Malaysia Press.<br />
<strong>Pertanika</strong> J. Sci. & Technol. <strong>21</strong> (1): 111 - 118 (<strong>2013</strong>)<br />
SCIENCE & TECHNOLOGY<br />
<strong>Journal</strong> homepage: http://www.pertanika.upm.edu.my/<br />
Application of Computer Vision in the Detection of Chilling Injury<br />
in Bananas<br />
Norhashila Hashim 1,2 *, Rimfiel B. <strong>Jan</strong>ius 1 , Russly Abdul Rahman 3 , Azizah Osman 3 ,<br />
Mahendran Shitan 4 and Manuela Zude 2<br />
1 Department of Biological and Agricultural Engineering, Faculty of Engineering, <strong>Universiti</strong> <strong>Putra</strong><br />
Malaysia, 43400 Serdang, Selangor, Malaysia<br />
2 Department Horticultural Engineering, Leibniz Institute for Agricultural Engineering Potsdam-Bornim<br />
(ATB), Max-Eyth-Allee 100, 14469 Potsdam-Bornim, Germany<br />
3 Faculty of Food Science and Technology, <strong>Universiti</strong> <strong>Putra</strong> Malysia, 43400 Serdang, Selangor, Malaysia<br />
4 Faculty of Science, <strong>Universiti</strong> <strong>Putra</strong> Malaysia, 43400 Serdang, Selangor, Malaysia<br />
ABSTRACT<br />
Bananas were chilled at 6 o C and the appearance of brown spots when exposed to ambient air, a<br />
phenomenon known as chilling injury (CI), was detected using computer vision. The system consisted<br />
of a digital colour camera for acquiring images, an illumination set-up for uniform lighting, a computer<br />
for receiving, storing and displaying of images and software for analyzing the images. The RGB colour<br />
space values of the images were transformed into that of HSI colour space which is intuitive to human<br />
vision. Visual assessment of CI by means of a browning scale was used as a reference and correlation<br />
between this reference values and hue was investigated. Results of the computer vision study successfully<br />
demonstrate the potential of the system in substituting visual assessment in the evaluation of CI in bananas.<br />
The results indicate significant influence, at α=0.05, of treatment days and temperature on hue. A strong<br />
correlation was also found between hue and visual assessment with R>0.85.<br />
Keywords: Computer vision, imaging, chilling injury, banana, hue<br />
Article history:<br />
Received: 20 May 2011<br />
Accepted: 4 October 2011<br />
E-mail addresses:<br />
shila@eng.upm.edu.my (Norhashila Hashim),<br />
janius@eng.upm.edu.my (Rimfiel B. <strong>Jan</strong>ius),<br />
russly@putra.upm.edu.my (Russly Abdul Rahman)<br />
azosman@putra.upm.edu.my (Azizah Osman)<br />
mahendran@science.upm.edu.my (Mahendran Shitan),<br />
zude@atb-potsdam.de (Manuela Zude)<br />
*Corresponding Author<br />
INTRODUCTION<br />
The computer vision system (CVS) has been<br />
used increasingly for inspection and grading<br />
of agricultural produce in recent years.<br />
Articles regarding the feasibilities of the<br />
system and their reviews have been published<br />
by researchers since a decade ago (Tillet,<br />
1991; Gunasekaran, 1996; Chen et al., 2002;<br />
Brosnan & Sun, 2004; Du & Sun, 2004). The
Norhashila Hashim et al.<br />
effectiveness of the system has been shown on many kinds of fresh produce and food such as<br />
cherries (Beyer et al., 2002), tomatoes (Lana et al. 2006), mangoes (Kang et al., 2008), bananas<br />
(Roberto et al. 2009), pizzas (Du & Sun, 2005) and salmon fillets (Quevedo et al., 2010).<br />
A digital colour camera in the CVS system generates RGB (red-green-blue) images that<br />
are device dependent (Yam & Papadakis, 2004; Mendoza et al., 2006; Cubero et al., 2011).<br />
To overcome this problem, the colours are transformed to other colour space such as the HSI<br />
(hue-saturation-intensity) and the L*a*b*. Hue is a commonly used colour coordinate in<br />
image processing because it is more intuitive to human vision (Cheng et al., 2001; Du & Sun,<br />
2005). Generally, hue is considered as the angle between the reference line and the colour<br />
point in RGB space. The hue value varies from 0° to 360°, reflecting colours ranging from<br />
blue, yellow, green to magenta (Cheng et al., 2001). The method of using hue coordinates for<br />
colour evaluation is highly effective with more than 90% accuracy achieved in the inspection of<br />
potatoes and apples (Tao et al., 1995) and bell peppers (Shearer & Payne, 1990). Meanwhile,<br />
an accuracy of 96.7% was achieved in pizza classification (Du & Sun, 2005) and average error<br />
of approximately 2° in colour measurement was obtained in different curvatures of mangoes<br />
(Kang et al., 2008).<br />
The application of computer vision in the detection of chilling injury (CI) in bananas is,<br />
however, still limited. CI is one of the physiological disorders that can appear if an agricultural<br />
produce is stored at low temperatures and the banana is one of the chilling sensitive produce<br />
that may show CI symptoms when exposed to a temperature below 10°C (Murata, 1969; Abd<br />
El-Wahab & Nawwar, 1977; Broughton & Wu, 1979; Nguyen et al., 2003). The symptoms<br />
may appear most severe at 6°C (Nguyen et al., 2003) but can tolerate well to a temperature<br />
range of 13-14°C (Zhang et al., 2010).<br />
The most common visual symptom of CI is colour change. The quantification and<br />
characterization processes which are usually made by visual inspection may lead to considerable<br />
variation in results due to the differences in human evaluation, perception and human error.<br />
This has encouraged scientists to look for various ways of quantifying colour changes involving<br />
computer-based techniques.<br />
Hence, the application of computer vision to replace the conventional method is investigated<br />
and subsequently suggested. The objectives of this paper are: i) to investigate colour changes<br />
due to CI in bananas using computer vision; and ii) to compare the performance of hue against<br />
visual assessment as a CI indicator.<br />
MATERIALS AND METHODS<br />
Materials<br />
A batch of good quality hands of ripe bananas (Musa Cavendish) were obtained from a local<br />
market in Potsdam, Germany. The bananas were then transported to the laboratory at Leibniz<br />
Institute of Agricultural Engineering Potsdam-Bornim, Germany. Sixteen fingers of bananas<br />
were selected for the experiment. Images of the bananas were taken and visual assessment<br />
was also immediately carried out before storage (i.e. beginning of day 1). Then, eight bananas<br />
were allowed to ripen in a control temperature at 13°C, while another eight were stored at 6°C<br />
(rH 90-95%) for 2 days to induce CI. At the end of day 2 (i.e. beginning of day 3), the bananas<br />
112 <strong>Pertanika</strong> J. Sci. & Technol. <strong>21</strong> (1): 283 - 298 (<strong>2013</strong>)
Computer Vision of Chilling Injury in Bananas<br />
were taken out and their images were taken and visual assessment carried out immediately<br />
upon exposure to ambient temperature (15-20°C). This was repeated after one day of exposure<br />
to ambient temperature (i.e. beginning of day 4).<br />
Visual Assessment<br />
Visual assessment was conducted immediately after image acquisition. The assessment was<br />
based on browning scale as described by Nguyen et al. (2003). The browning scale was rated<br />
as follows: 1 = no chilling injury symptoms appear; 2 = mild chilling injury symptoms in which<br />
the injury can be found in between the epidermal tissues; 3 = moderate chilling injury symptoms<br />
in which the brown patches begin to become visible, larger and darker; 4 = severe chilling<br />
injury symptoms in which the brown patches are visible, larger and darker than at scale 3; 5 =<br />
very severe chilling injury symptoms in which the patches are relatively large on the surface.<br />
Computer Vision System<br />
A computer vision system developed by the Institute of Agricultural Engineering, Potsdam,<br />
Germany with CCD camera JVC KY-F50E (zoom lens F2.5 and focal lengths of 18-108 mm)<br />
was used to capture the images of bananas. The size of the captured image was 720x576 pixels<br />
by 24 bits. The bananas were illuminated using four fluorescent lamps arranged as front lighting<br />
at a height of 35cm above the samples in the form of a square for uniform effect. The angle<br />
between the camera lens axis and the lamps was 45° since diffused reflections responsible for<br />
colour occurred at 45° from the incident light. Optimas grabber board (Bioscan Inc., USA)<br />
software was used to acquire the images directly on the computer display and store them in<br />
the computer in bmp format.<br />
All the acquired images were processed and analysed using Matlab software. The overall<br />
process is as presented in Fig.1.<br />
A segmentation process was applied to separate the part of interest (the true image of a<br />
banana) from the background. This process is critical in image processing and it is done to<br />
eliminate the influence of the background pixel information on the RGB value of the banana.<br />
The threshold value used was obtained from a histogram of the gray-scale image (Fig.2),<br />
which is the conversion image of the original image of the banana. Morphological dilation<br />
was performed to remove background noise, and this was followed by a mask operation to get<br />
back the original colour of the segmented image resulting in a binary image and finally the<br />
true image of the bananas (Fig.3). The RGB values were then extracted from the image and<br />
converted to hue value using the following transformation:<br />
ìï ìï 1 [( R G) ( R B)]<br />
üï<br />
ï -<br />
2p cos ï - + - ï<br />
ï - , B> G<br />
ï<br />
í ý<br />
ï 2<br />
2 ( R G) ( R B)( G B)<br />
ï<br />
ï ï<br />
- + - - ïþ<br />
H = ï î<br />
í<br />
ï ìï -1<br />
[( R G) ( R B)]<br />
üï<br />
ï ï - + - ï<br />
ïcos ï ï<br />
ï í ý,<br />
otherwise<br />
2<br />
ï ï<br />
ï2 ( R- G) + ( R-B)( G-B) ï<br />
ïïî ïî<br />
ïïþ<br />
[Equation 1]<br />
<strong>Pertanika</strong> J. Sci. & Technol. <strong>21</strong> (1): 283 - 298 (<strong>2013</strong>)<br />
113
Statistical Analysis<br />
Norhashila Hashim et al.<br />
Statistical analysis was performed using the SAS statistical software. Meanwhile, the analysis<br />
of variance (ANOVA) was used to compare the mean values of the sample hues at different<br />
treatment factors (treatment days and temperature). Then, the mean comparison test using<br />
Least Significant Difference (LSD) was conducted to compare the treatment group means after<br />
the ANOVA results had been shown to be significant. Finally, a correlation analysis between<br />
the hue and visual assessment values was conducted to find the relationship between them.<br />
RESULTS AND DISCUSSION<br />
Colour Change<br />
Fig.1: A schematic representation of the colour transformation process<br />
12000<br />
10000<br />
8000<br />
6000<br />
4000<br />
2000<br />
Background Foreground<br />
Thresholded at 200 gray levels<br />
0<br />
0 50 100 150 200 250<br />
Fig.2: Histogram of gray-scale image<br />
The colour of bananas stored at 6°C changed from bright yellow at the beginning of the<br />
experiment to brown after being exposed to ambient temperature. The change in the colour<br />
was parallel to the change in the hue values (Fig.4).<br />
114 <strong>Pertanika</strong> J. Sci. & Technol. <strong>21</strong> (1): 283 - 298 (<strong>2013</strong>)
Computer Vision of Chilling Injury in Bananas<br />
(a) (b) (c)<br />
Fig.3: Banana images: (a) an original image, (b) a binary image and (c) a true image of the banana<br />
Hue<br />
70<br />
68<br />
66<br />
64<br />
62<br />
60<br />
58<br />
0 1 2 3 4 5<br />
Beginning of Treatment Days<br />
The change became severe when the exposure was prolonged. This is illustrated by the<br />
steep slope of the plot between the beginning of day 3 and day 4. At the beginning of day 4,<br />
i.e. after one day of exposure to ambient temperature, the hue value dropped to below 60°,<br />
which corresponded to brown in the HSI colour chart. Meanwhile, no change was observed<br />
on the control samples. The slight decrease that was shown in the hue value on the control<br />
samples was basically due to the normal ripening process.<br />
The results of ANOVA revealed that the individual main effects, i.e., treatment days and<br />
temperature were statistically significant at α = 0.05 (Table 1). In agreement with Skog (1998),<br />
the results also showed that there was a significant interaction (p
Norhashila Hashim et al.<br />
Post-hoc analysis showed that both the levels of temperature were statistically different (Table<br />
3). This means that each level of temperature gives different effects to the CI symptoms.<br />
Bananas stored at 6°C were severely affected by CI, while bananas stored at 13°C were not<br />
affected and ripened normally.<br />
TABLE 1: ANOVA of CI factors<br />
Source DF Mean Square F Value Pr > F<br />
Treatment Days 2 134.5183099 138.71
CONCLUSION<br />
Computer Vision of Chilling Injury in Bananas<br />
The results of this study have successfully demonstrated the potential of applying computer<br />
vision in the detection of CI in bananas. In particular, treatment days and temperature level are<br />
important factors affecting the severity of the CI symptoms. The correlation between hue and<br />
visual assessment values indicates a high potential for the system to replace the conventional<br />
method and to offer objectivity in and automation possibility to the sorting process.<br />
ACKNOWLEDGMENTS<br />
The authors are grateful for the financial support received from the Ministry of Higher Education<br />
Malaysia, <strong>Universiti</strong> <strong>Putra</strong> Malaysia and Leibniz Institute for Agricultural Engineering Potsdam-<br />
Bornim (ATB), Germany, for this project.<br />
REFERENCES<br />
Hue<br />
70<br />
68<br />
66<br />
64<br />
62<br />
60<br />
58<br />
Abd El-Wahab, F. K., & Nawwar, M. A. M. (1977). Physiological and biochemical studies on chillinginjury<br />
of banana. Scientia Hoticulturae, 7(4), 373-376.<br />
Beyer, M., Hahn, R., Peschel, S., Harz, M., & Knoche, M. (2002). Analysing Fruit Shape in Sweet Cherry<br />
(Prunus avium L.). Scientia Horticulturae, 96(1-4), 139–150.<br />
Brosnan, T., & Sun, D.-W. (2004). Improving Quality Inspection of Food Products by Computer Vision-a<br />
Review. <strong>Journal</strong> of Food Engineering, 61, 3-16.<br />
Broughton, W. J., & Wu, K. F. (1979). Storage condition and ripening of two cultivars of banana. Scientia<br />
Horticulturae, 10(1), 83-93.<br />
Chen, Y. R., Chao, K., & Kim, M. S. (2002). Machine Vision Technology for Agricultural Applications.<br />
Computers and Electronics in Agriculture, 36, 173-191.<br />
Cheng, H. D., Jiang, X. H., Sun, Y., & Wang, J. (2001). Color Image Segmentation: Advances and<br />
Prospects. Pattern Recognition, 34(12), 2259-2281.<br />
<strong>Pertanika</strong> J. Sci. & Technol. <strong>21</strong> (1): 283 - 298 (<strong>2013</strong>)<br />
R = 0.852<br />
56<br />
0 1 2 3 4 5<br />
Visual Assessment (Browning Scale)<br />
Fig.5: The correlation between hue values and visual assessment<br />
117
Norhashila Hashim et al.<br />
Cubero, S., Aleixos, N., Moltó, E., Gómez-Sanchis, J., & Blasco, J. (2011). Advances in Machine Vision<br />
Applications for Automatic Inspection and Quality Evaluation of Fruits and Vegetables. Food and<br />
Bioprocess Technology, 4(4), 487-504.<br />
Du, C. –J., & Sun, D. –W. (2004). Recent Developments in the Applications of Image Processing<br />
Techniques for Food Quality Evaluation. Trends in Food Science and Technology, 15(5), 230-249.<br />
Du, C. -J., & Sun, D. -W. (2005). Comparison of three methods for classification of pizza topping using<br />
different colour space transformations. <strong>Journal</strong> of Food Engineering, 68(3), 277–287.<br />
Gunasekaran, S. (1996). Computer Vision Technology for Food Quality Assurance. Trends in Food<br />
Science and Technology, 7(8), 245-256.<br />
Kang, S. P., East, A. R., & Trujillo, F. J. (2008). Colour Vision System Evaluation of Bicolour Fruit: A<br />
Case Study with ‘B74’ Mango. Postharvest Biology and Technology, 49(1), 77-85.<br />
Lana, M. M., Tijskens, L. M. M., & van Kooten, O. (2006). Effects of storage temperature and stage of<br />
ripening on RGB colour aspects of fresh-cut tomato pericarp using video image analysis. <strong>Journal</strong> of<br />
Food Engineering, 77(4), 871–879.<br />
Mendoza, F., Dejmek, P., & Aguilera, J. M. (2006). Calibrated Colour Measurements of Agricultural<br />
Foods Using Image Analysis,” Postharvest Biology and Technology, 41(3), 285-295.<br />
Murata, T. (1969). Physiological and biochemical studies of chilling injury in bananas. Physiologia<br />
Plantarum, 22(2), 401–411.<br />
Nguyen, T. B. T., Ketsa, S. & van Doorn, W. G. V. (2003). Relationship between browning and the<br />
activities of polyphenol oxidase and phenylalanine ammonia lyase in banana peel during low<br />
temperature storage. Postharvest Biology and Technology, 30(2), 187-193.<br />
Quevedo, R. A., Aguilera, J. M., & Pedreshi, F. (2010). Color of Salmon Fillets By Computer Vision<br />
and Sensory Panel. Food and Bioprocess Technology, 3, 637-643.<br />
Roberto, Q., Oscar, D., Betty, R., Franco, P., & Jose, M. G. (2009). Description of the kinetic enzymatic<br />
browning in banana (Musa cavendish) slices using non-uniform color information from digital images.<br />
Food Research International, 42(9), 1309–1314.<br />
Shearer, S. A., & Payne, F. A. (1990). Color and Defect Sorting of Bell Peppers Using Machine Vision.<br />
Transactions of the ASAE, 33, 2045–2050.<br />
Skog, L. J. (1998). Factsheet: Chilling injury of horticultural crops. Horticultural Research Institute of<br />
Ontaria, University of Guelph.<br />
Tao, Y., Heinemann, P. H., Varghese, Z., Morrow, C. T., & Sommer III, H. J. (1995). Machine Vision<br />
for Color Inspection of Potatoes and Apples. Transactions of the American Society of Agricultural<br />
Engineers, 38(5), 1555-1561.<br />
Tillet, R. D. (1991). Image Analysis for Agricultural Processes: A Review of Potential Opportunities. J.<br />
Agric. Engng. Res., 5, 247-258.<br />
Yam, K. L., & Papadakis, S. E. (2004). A Simple Digital Imaging Method for Measuring and Analyzing<br />
Color of Food Surfaces. <strong>Journal</strong> of Food Engineering, 61(1), 137-142.<br />
Zhang, H., Yang, S., Joyce, D. C., Jiang, Y., Qu, H., & Duan, X. (2010). Physiology and Quality Response<br />
of Harvested Banana Fruit to Cold Shock. Postharvest Biology and Technology, 55(3), 154-159.<br />
118 <strong>Pertanika</strong> J. Sci. & Technol. <strong>21</strong> (1): 283 - 298 (<strong>2013</strong>)
ISSN: 0128-7680 © <strong>2013</strong> <strong>Universiti</strong> <strong>Putra</strong> Malaysia Press.<br />
<strong>Pertanika</strong> J. Sci. & Technol. <strong>21</strong> (1): 119 - 126 (<strong>2013</strong>)<br />
SCIENCE & TECHNOLOGY<br />
<strong>Journal</strong> homepage: http://www.pertanika.upm.edu.my/<br />
On the Integral Solutions of the Diophantine Equation x 4 + y 4 = z 3<br />
S. Ismail* and K. A. Mohd Atan<br />
Institute for Mathematical Research, <strong>Universiti</strong> <strong>Putra</strong> Malaysia,43400 Serdang, Selangor, Malaysia<br />
ABSTRACT<br />
This paper is concerned with the existence, types and the cardinality of the integral solutions for<br />
4 4 3<br />
diophantine equation x + y = z where x , y and z are integers. The aim of this paper was to<br />
develop methods to be used in finding all solutions to this equation. Results of the study show the<br />
existence of infinitely many solutions to this type of diophantine equation in the ring of integers<br />
for both cases, x= y and x¹ y . For the case when x= y , the form of solutions is given by<br />
3 3 4<br />
( xyz , , ) = (4 n,4 n,8 n)<br />
, while for the case when x¹ y , the form of solutions is given by<br />
3k-1 3k-1 4k-1 ( x, y, z) = ( un , vn , n ) . The main result obtained is a formulation of a generalized method to find<br />
all the solutions for both types of diophantine equations.<br />
Keywords: Integral solutions, diophantine equation, hyperbolic equation, prime power decomposition,<br />
coprime integers<br />
INTRODUCTION<br />
Hyperbolic equation has been studied since ancient times; one of which was started as early<br />
4 4 2 4 4 4<br />
as 350 years ago by Fermat who showed that the equations x + y = z and x + y = z<br />
have no solution in integers by using the method of proof of infinite descent (for example,<br />
refer to Dudley, 1978). Nonetheless, much of work has been done to examine various kinds<br />
of hyperbolic equations until the present time and since the variation of these equations exists,<br />
this activity will be continued into the future.<br />
4 4 4<br />
Cross (1993) studied the diophantine equation a + b ¹ g in Gaussian integers. In<br />
his paper, the author used cyclotomic integers by considering the special case n = 3 of the<br />
Fermat’s Last Theorem to prove that no triplet ( abg , , ) of the non-zero members of Gaussian<br />
Article history:<br />
Received: 5 March 2012<br />
Accepted: 3 May 2012<br />
E-mail addresses:<br />
sha_fulica@yahoo.com.my (S. Ismail),<br />
kamel@putra.edu.my (K. A. Mohd Atan)<br />
*Corresponding Author<br />
integers exists, with gcd ( ab , ) = 1 such<br />
4 4 4<br />
that ± a ± b =± g . The proof given<br />
by the author is a version of Fermat’s method<br />
of infinite descent.<br />
Similarly, Dieulefait (2005) also proved<br />
that with p a prime, p ≢ 1 (mod 8) and
S. Ismail and K. A. Mohd Atan<br />
4 4 p<br />
p > 13, the diophantine equation x + y = z has no solutions xyz , , with ( xy= , ) 1<br />
and ( xy¹ , ) 1.<br />
In the same publication, the author proved that if p is a prime, p ³ <strong>21</strong>1,<br />
the<br />
4 4 p<br />
equation x + y = z would have no primitive solution in non-zero integers. Later on,<br />
the author generalized the form of equation studied and considered the following equation,<br />
4 4 p<br />
x + y = qz . He gave a method to solve this equation for some prime values of q and every<br />
4 4 p<br />
prime p bigger than 13. The author proved that the diophantine equation, x + y = qz ,<br />
does not have any primitive solutions for q = 73,89 and 113 and p > 13.<br />
4 4 4<br />
Grigorov and Rizov (1998) studied the diophantine equation, x + y = cz . In their<br />
paper, the authors gave a precise explicit estimates for the difference of the Weil height and the<br />
2 3<br />
Neron Tate height on the elliptic curve, v = u - cu . They later applied this to prove that<br />
2 3<br />
if c > 2 is a fourth power free integer and the rank of v = u - cu is 1, the diophantine<br />
4 4 4<br />
equation x + y = cz would have no non-zero solution in integers.<br />
n n m<br />
In his publication, Poonen (1998) proved that the equation x + y = z has no nontrivial<br />
primitive solution for n ³ 4 . At the same time, by assuming the Shimura-Taniyama<br />
n n 3<br />
conjecture, he also proved that the equation x + y = z has no non-trivial primitive solution<br />
for n ³ 3.<br />
Motivated by the works on the equation of Fermat’s equation of degree four and its<br />
4 4 3<br />
variations, this research was undertaken to study the equation x + y = z and to find its<br />
solutions in the ring of integers. Our quest here was to determine whether the infinitely many<br />
4 4 3<br />
solutions to the equation x + y = z do exist, and to solve this diophantine equation in<br />
the integer domain.<br />
The cases of non-existence of solutions for this equation have been discussed earlier by<br />
some authors. For examples, Cohen (2002) gave an assertion as stated in Lemma 1.1. It<br />
4 4 3<br />
is easy to show that the solution set of the equation x + y = z is non-empty whenever<br />
gcd( xyx> , , ) 1.<br />
For example, ( xyx= , , ) (4, 4,8),(289,578, 4913) is in the solution set.<br />
Theorem 1.1 gives a general proof of this particular assertion. Since the solution set is nonempty,<br />
we are interested to know the form of integers that satisfies this equation. However, the<br />
general forms of the solutions for such equation have not been discussed extensively. Hence,<br />
using the elementary methods in this study, we determined some explicit forms of solutions<br />
4 4 3<br />
to the equation x + y = z when gcd( xyx> , , ) 1.<br />
RESULTS AND DISCUSSION<br />
This paper is outlined as follows. There are three theorems discussed. Theorem 1.1 shows that<br />
4 4 3<br />
the solution set of x + y = z is always non-empty whenever gcd( xyx> , , ) 1.<br />
Theorem 1.2<br />
deals with the case when x= y and gcd( xyx> , , ) 1, while Theorem 1.3 deals with the case<br />
when x¹ y and gcd( xyx> , , ) 1.<br />
We reproduced an assertion of Cohen (2002) in Lemma<br />
4 4 3<br />
1.1, which deals with the equation x + y = z , whereby gcd( xyx= , , ) 1.<br />
In addition, two<br />
corollaries are also discussed in this paper. Corollary 1.1 gives the forms of solutions for the<br />
4 4<br />
triplet ( abc , , ) when n= u + v for a pair of integers u and v is a cube in which there<br />
4 4 3<br />
exist infinitely many solutions to the equation x + y = z . Also, Corollary 1.2 in this paper<br />
k<br />
c<br />
gives the form of solutions for ( abc , , ) , when w= n , where w = , and n and<br />
gcd( abc , , )<br />
k are positive integers.<br />
120 <strong>Pertanika</strong> J. Sci. & Technol. <strong>21</strong> (1): 283 - 298 (<strong>2013</strong>)
Integral Solutions of x 4 + y 4 = z 3<br />
We will show that the solution set of the equation in which gcd( xyx> , , ) 1 is always<br />
non-empty in the following theorem. It shows that a solution set can always be constructed<br />
from a given pair of integers.<br />
Theorem 1.1<br />
4 4<br />
Suppose u and v are integers and n= u + v . Let k be an integer such that k º 2(mod 3).<br />
Then,<br />
Proof:<br />
k<br />
a un<br />
= , k<br />
4k+ 1<br />
3<br />
b = vn and c= n is in the solution set of the equation<br />
By multiplying both sides of the equation<br />
or<br />
4 4<br />
n= u + v with<br />
4k 4k 4 4k 4<br />
n × n= ( n × u ) + ( n × v )<br />
+<br />
n = ( nu) + ( nv)<br />
4k 1 k 4 k 4<br />
Since k º 2(mod 3), we have 4k + 1º 0(mod 3) .<br />
Thus, there exists integer m such that 4k+ 1= 3m.<br />
It follows that<br />
or<br />
n = ( nu) + ( nv)<br />
3m k 4 k 4<br />
( n ) = ( nu) + ( nv)<br />
m 3 k 4 k 4<br />
k<br />
k<br />
m<br />
Hence, a = un , b = vn and c= n satisfy the equation<br />
4k+ 1<br />
assertion by putting m = .<br />
3<br />
<strong>Pertanika</strong> J. Sci. & Technol. <strong>21</strong> (1): 283 - 298 (<strong>2013</strong>)<br />
4 4 3<br />
x + y = z .<br />
4k<br />
n , the following is obtained:<br />
4 4 3<br />
x + y = z . We obtain the<br />
A corollary obtained from the above theorem is as shown below. The forms of solutions<br />
for the triplet ( abc , , ) are obtainable when n is a cube in which case there exist infinitely<br />
4 4 3<br />
many solutions to the following equation, x + y = z .<br />
Corollary 1.1<br />
Suppose u and v are integers and<br />
Let k be a positive integer. Then<br />
4 4 3<br />
x + y = z .<br />
Proof:<br />
4 4<br />
n= u + v . Suppose<br />
k<br />
k<br />
a = un , b = vn and<br />
From the proof of Theorem 1.1, it can be shown that:<br />
+<br />
n = ( nu) + ( nv)<br />
4k 1 k 4 k 4<br />
Let<br />
3<br />
n= r , then the following will be obtained:<br />
+<br />
( r ) = ( nu) + ( nv)<br />
4k 1 3 k 4 k 4<br />
Hence,<br />
cube.<br />
k<br />
k<br />
a = un , b = vn and<br />
4k+ 1<br />
3<br />
n r<br />
c= n is in the solution set of<br />
3<br />
= for some integer, r .<br />
4k+ 1<br />
3<br />
c= n is in the solution set of<br />
4 4 3<br />
x + y = z , if n is a<br />
1<strong>21</strong>
S. Ismail and K. A. Mohd Atan<br />
The following theorem gives the form of solutions to the following equation, when<br />
= and gcd( abc , , ) > 1 .<br />
x y<br />
Theorem 1.2:<br />
Suppose the triplet ( abc , , ) in which a= b and gcd( abc , , ) > 1 is a non-trivial solution to<br />
3<br />
4<br />
gcd( abc , , ) > 1 . Then abc , , is of the form a= b= 4n<br />
and c= 8n<br />
for some integer, n .<br />
Proof:<br />
First, suppose that the triplet ( abc , , ) is a solution in which a= b.<br />
Then, the equation will<br />
become:<br />
Clearly<br />
4 3<br />
2a = c<br />
3<br />
2|c which implies that c is even.<br />
122 <strong>Pertanika</strong> J. Sci. & Technol. <strong>21</strong> (1): 283 - 298 (<strong>2013</strong>)<br />
(1.1)<br />
Hence, there exists q j in the prime power decomposition of such that q j = 2.<br />
Rearranging the prime power decomposition of c , let q 1 = 2 , we will have the following:<br />
f m f<br />
1<br />
j<br />
c= 2 Õ q<br />
j=<br />
2 j where j<br />
q are odd primes and 1<br />
f j ³ for 1£ j£ m<br />
Similarly, let p 1 = 2 in the prime power decomposition of a . Then, the following will be<br />
obtained:<br />
ei<br />
e l<br />
1 a 2 p<br />
i=<br />
2 i<br />
= Õ in which j<br />
q are odd primes, e 1 ³ 0 , e ³ 0 for 2 £ i£ l<br />
Substituting the above expression for a and c into (1.1), the following will be obtained:<br />
4 3<br />
1 1 4 3 1<br />
2 2<br />
j<br />
i<br />
e + l e f m f<br />
p<br />
i i = q<br />
= j=<br />
j<br />
2 ( ) 2 ( )<br />
i<br />
Õ Õ (1.2)<br />
By uniqueness of the prime power decomposition of a and c , we will have for each i ,<br />
the integer j in such a way that pi = qj<br />
and vice versa for 2 £ i£ l,<br />
2 £ j£ m,<br />
and<br />
l= m.<br />
4e1 1 3f1<br />
Also, we will have 2 2<br />
+<br />
= , which implies that 4e1+ 1= 3f1<br />
3 f +- ( 4) e = 1<br />
or 1 1<br />
Since gcd(3, - 4) = 1,<br />
many integral solutions to this equation do exist.<br />
Meanwhile, we can see that e 1 = 1,<br />
and f 1 = 3 is a particular solution that satisfies this<br />
equation.<br />
Thus, all the solutions for this equation are given by:<br />
where t is the integer.<br />
1<br />
e = 2- 3t<br />
1 1<br />
Since e 1 and 1 f are positive integers, t 1 £ 0 .<br />
f = 3- 4t<br />
(1.3)<br />
and 1 1
Integral Solutions of x 4 + y 4 = z 3<br />
Now for each t 1 < 0 , the integer s 1 > 0 exists in such a way that t1=- s1.<br />
Thus, from<br />
(1.3), we will obtain the following:<br />
e = 2+ 3s<br />
and f1= 3+ 4s1<br />
1 1<br />
Similarly from (1.2), by uniqueness of prime power decomposition of a and c , we<br />
will have by considering the odd prime factors of a and c that l , pi = q and 4e = 3f<br />
j<br />
for some i and j , where i, j= 2,3,... m.<br />
From here, we can see that 4|3f j and 3|4e i .<br />
Since gcd(4,3) = 1,<br />
the integers j<br />
It follows that<br />
si = rj.<br />
r and i<br />
<strong>Pertanika</strong> J. Sci. & Technol. <strong>21</strong> (1): 283 - 298 (<strong>2013</strong>)<br />
j j<br />
i j<br />
s exist in such a way that f = 4r<br />
and e = 3s<br />
.<br />
Then, the prime power decomposition of a , b and c will respectively be:<br />
Õ Õ<br />
2+ 3s l<br />
1 3si 2 s l<br />
1<br />
3si<br />
3<br />
i= 2 i i=<br />
2 i<br />
a= b= 2 p = 2 (2 p )<br />
and<br />
Õ Õ<br />
3+ 4s l<br />
1 4si<br />
3 s l<br />
1<br />
si<br />
4<br />
i= 2 i i=<br />
2 i<br />
c= 2 p = 2 (2 p )<br />
l s<br />
i=<br />
2 i<br />
s1<br />
i<br />
Let n= 2 Õ p in this case.<br />
3<br />
Thus, a= b= 4n<br />
and c 8n<br />
4<br />
= could be obtained as asserted, where n is an integer.<br />
Now if t 1 = 0 , we will obtain e 1 = 2 and f 1 = 3 from (1.3).<br />
Then, the prime power decomposition of a , b and c will respectively be as follows:<br />
Õ Õ<br />
2 l 3s 2 l<br />
i 3si<br />
3<br />
i= 2 i i=<br />
2 i<br />
a= b= 2 p = 2( p )<br />
and<br />
Õ Õ<br />
3 l 4s<br />
3 l<br />
i si<br />
4<br />
i= 2 i i=<br />
2 i<br />
c= 2 p = 2( p )<br />
=Õ in this case.<br />
l si<br />
Let n p<br />
i=<br />
2 i<br />
3<br />
Thus, a= b= 4n<br />
and c 8n<br />
Hence, the triplet<br />
x= y .<br />
4<br />
= could be obtained as asserted, where n is an integer.<br />
3 3 4<br />
(4 n ,4 n ,8 n ) is a solution to the equation<br />
4 4 3<br />
x + y = z , when<br />
i i<br />
k k 3<br />
In Theorem 1.1 (i.e. where the solutions are of the form ( abc , , ) = ( un, vn, n ) and in<br />
3 3 4<br />
Theorem 1.2 [where the solutions of this equation in which x= y is ( abc , , ) = (4 n, 4 n,8 n)],<br />
it is clear that gcd( abc , , ) > 1 . The subsequent Theorem 1.3 gives the forms of integral<br />
4 4 3<br />
solution to the equation x + y = z , in which x¹ y and gcd( abc , , ) > 1 also. The<br />
cases in which gcd( xyz= , , ) 1 have been discussed by a number of earlier authors. For<br />
example, Cohen (2002) showed that non-trivial integral solutions did not exist in such cases.<br />
Thus, this assertion was reproduced in the following Lemma 1.1, the proof of which could be<br />
found in Cohen (2002).<br />
4k+ 1<br />
123
Lemma 1.1<br />
The equation<br />
S. Ismail and K. A. Mohd Atan<br />
4 4 3<br />
x ± y = z has no solutions in the non-zero coprime integers, xyx. , ,<br />
The following theorem gives the form of solutions to the equation<br />
4 4 3<br />
x + y = z in cases when gcd( abc , , ) > 1 and x¹ y in terms of n , where<br />
4 4<br />
æ x ö æ y ö<br />
n = ç<br />
÷ + ç ÷<br />
ç<br />
ç<br />
çègcd( xyz , , )<br />
÷ ø ç çègcd(<br />
xyz , , )<br />
÷ ø and<br />
3k1 gcd( xyz , , ) n -<br />
= , where k is a positive<br />
integer with k ³ 1 .<br />
Theorem 1.3:<br />
Suppose the triplet ( abc , , ) with a¹ b and gcd = ( abc , , ) = d is a solution to the<br />
equation,<br />
4 4 3<br />
x + y = z . Let<br />
a b<br />
u = , v = and<br />
d d<br />
3k1 integer. If d n -<br />
3k1 = , then a un -<br />
3k1 = , b vn -<br />
4k1 = and c n -<br />
= .<br />
Proof:<br />
Since a = du , b = dv and<br />
From the following equation<br />
d n -<br />
3k-1 4 3k-1 4 3<br />
( un ) + ( un ) = c or<br />
Since,<br />
4 4<br />
n= u + v , we have<br />
which implies that<br />
4k1 c n -<br />
=<br />
3k1 = , we have clearly<br />
4 4 3<br />
a + b = c , it follows that:<br />
( n ) c<br />
4k- 1 3 3<br />
=<br />
4 4<br />
n= u + v . Let k be a positive<br />
a un -<br />
( n )( u + v ) = c<br />
3k-1 4 4 3<br />
3k1 = and<br />
3k1 Hence, a un -<br />
3k1 = , b vn -<br />
4k1 = and c n -<br />
3k1 = if d n -<br />
= , where<br />
124 <strong>Pertanika</strong> J. Sci. & Technol. <strong>21</strong> (1): 283 - 298 (<strong>2013</strong>)<br />
b vn -<br />
3k1 = .<br />
4 4<br />
n= u + v<br />
A corollary was obtained from the above theorem, as shown below. The forms of solution<br />
for the triplet ( abc , , )<br />
k<br />
are obtainable when<br />
c<br />
w= = n .<br />
d<br />
Corollary 1.2<br />
Suppose the triplet ( abc , , ) with a¹ b and gcd = ( abc , , ) = d is the solution to the<br />
4 4 3 a b<br />
equation x + y = z . Let u = , v = ,<br />
d d<br />
3k1 then a un -<br />
3k1 = , b vn -<br />
4k1 = and c n -<br />
= .<br />
Proof:<br />
From the equation, we have<br />
4 4 3<br />
a + b = c .<br />
4 4 4 3 3k<br />
It follows that d( u + v) = dn .<br />
c<br />
w = and<br />
d<br />
4 4<br />
n= u + v . If<br />
k<br />
w= n ,
Since<br />
Integral Solutions of x 4 + y 4 = z 3<br />
4 4<br />
u + v = n,<br />
we will have the following:<br />
3k<br />
dn = n or<br />
3k1 d n -<br />
=<br />
3k1 From Theorem 1.3, we have then a un -<br />
3k1 = , b vn -<br />
4k1 = and c n -<br />
= since<br />
<strong>Pertanika</strong> J. Sci. & Technol. <strong>21</strong> (1): 283 - 298 (<strong>2013</strong>)<br />
3k1 d n .<br />
-<br />
=<br />
3k-1 3k-1 4k-1 Table 1 below shows some example solutions ( abc , , ) = ( un , vn , n ) that were<br />
obtained for Theorem 1.3 for various values of k .<br />
TABLE 1: Some examples of the integer solutions for the diophantine equation<br />
x¹ y and gcd( xyz> , , ) 1 for various values of k .<br />
3k1 k<br />
a un -<br />
=<br />
1 2<br />
a = un<br />
2 5<br />
a = un<br />
3 8<br />
a = un<br />
4 11<br />
a = un<br />
5 14<br />
a = un<br />
3k1 b vn -<br />
=<br />
2<br />
b = vn<br />
5<br />
b = vn<br />
8<br />
b = vn<br />
11<br />
b = vn<br />
14<br />
b = vn<br />
4k1 c n -<br />
=<br />
3<br />
c= n<br />
7<br />
c= n<br />
11<br />
c= n<br />
15<br />
c= n<br />
19<br />
c= n<br />
<br />
3k1 d n -<br />
=<br />
2<br />
d = n<br />
5<br />
d = n<br />
8<br />
d = n<br />
11<br />
d = n<br />
14<br />
d = n<br />
4 4 3<br />
x + y = z when<br />
3k1 Note: The solution set obtained from Theorem 1.3, where d n -<br />
= with k ³ 1 as represented in<br />
Table 1 is also the solution set obtainable from the forms of solutions in Theorem 1.1, in which<br />
k º 2(mod 3) . In this study, the assertions of Theorem 1.1, Theorem 1.2 and Theorem 1.3 have been<br />
illustrated by showing the actual solutions for the integers ( xyz , , ) , as in Table 2 that satisfy this<br />
equation using the C language in integer domain.<br />
TABLE 2: Some examples of the integer solutions generated by the C language for the diophantine<br />
equation<br />
4 4 3<br />
¹ .<br />
x + y = z when x= y and x y<br />
x y z<br />
4 4 8<br />
32 32 128<br />
108 108 648<br />
256 256 2048<br />
578 4913<br />
500 500 5000<br />
4000 4000 80000<br />
6724 20172 551368<br />
18818 28227 912673<br />
391876 1959380 245314376<br />
8<strong>21</strong>762 2054405 2633747<strong>21</strong><br />
340707 454276 38272753<br />
66049 264196 16974593<br />
125
CONCLUSION<br />
S. Ismail and K. A. Mohd Atan<br />
From the discussion above, the non-trivial integral solutions for the diophantine equation<br />
4 4 3<br />
x + y = z was shown to exist when gcd( xyz> , , ) 1.<br />
Suppose u and v are the integers<br />
4 4<br />
k<br />
and n= u + v and k are the integer in such that k º 2(mod 3) . Then, a = un ,<br />
4k+ 1<br />
k<br />
b = vn and c= n 3 are the solutions to this equation. Also, suppose u and v are<br />
4 4<br />
k<br />
the integers and n= u + v . If n is a cube, the many solutions of the forms a = un ,<br />
=<br />
k<br />
and c n<br />
4k+ 1<br />
3<br />
3 3 4<br />
b vn = would infinitely exist. As for the case when x= y , the triplet<br />
( xyz , , ) = (4 n,4 n,8 n)<br />
where n is any integer is a solution to this equation. For the case<br />
3k1 when x¹ y , we have x un -<br />
3k1 = , y vn -<br />
4k1 = and z n -<br />
4 4<br />
= , where n= u + v and<br />
3k1 d n -<br />
= . This work points towards a future direction in the determination of solutions to a<br />
4 4 k 3<br />
more generalized equation x+ y = pz , where p is a prime and k is any positive integer.<br />
ACKNOWLEDGEMENTS<br />
The authors would like to acknowledge the Laboratory of Theoretical Studies, Institute of<br />
Mathematical Research (INSPEM), <strong>Universiti</strong> <strong>Putra</strong> Malaysia for supporting this research.<br />
REFERENCES<br />
Cohen, H. (2002). The Super-Fermat Equation. In Graduate Texts in Mathematics: Number Theory,<br />
<strong>Vol</strong>ume II: Analytic and Modern Tools (6 th Edn.), 463-477. New York: Springer-Verlag, Chapter 6.<br />
Cross, J. T. (1993). In the Gaussian Integers<br />
4 4 4<br />
a + b ¹ g . Mathematics Magazine, 66(2), 105-108.<br />
Dieulefait, L. V. (2005). Modular congruences, Q-curves, and the diophantine equation<br />
Bull. Belg. Math. Soc. Simon Stevin., 12(13), 363-369.<br />
Dieulefait, L. V. (2005). Solving diophantine equations<br />
126 <strong>Pertanika</strong> J. Sci. & Technol. <strong>21</strong> (1): 283 - 298 (<strong>2013</strong>)<br />
4 4 p<br />
x + y = z .<br />
4 4 p<br />
x + y = qz . Acta Arith, 117(3), 207-<strong>21</strong>1.<br />
Dudley, U. (1978). Elementary Number Theory (2 nd Edn.) San Francisco: W. H. Freeman and Company.<br />
4 4 4<br />
Grigorov, G., & Rizov, J. (1998). Heights on elliptic curves and the diophantine equation x + y = cz .<br />
1-9.<br />
Poonen, B. (1998). Some diophantine equations of the form<br />
193-205.<br />
n n m<br />
x + y = z . Acta Arith, LXXXVI, 3,
ISSN: 0128-7680 © <strong>2013</strong> <strong>Universiti</strong> <strong>Putra</strong> Malaysia Press.<br />
<strong>Pertanika</strong> J. Sci. & Technol. <strong>21</strong> (1): 127 - 134 (<strong>2013</strong>)<br />
SCIENCE & TECHNOLOGY<br />
<strong>Journal</strong> homepage: http://www.pertanika.upm.edu.my/<br />
Radiation-Induced Formation of Acrylated Palm Oil Nanoparticle<br />
Using Pluronic F-127 Microemulsion System<br />
Tajau, R. 1 *, Wan Yunus, W. M. Z. 2 , Mohd Dahlan, K. Z. 3 , Mahmood, M. H. 1 ,<br />
Hashim, K. 4 , Ismail, M. 5 , Salleh, M. 1 and Che Ismail, R. 1<br />
1 Synthesis and Radiation Curing Group, Division of Radiation Processing Technology (BTS), Malaysian<br />
Nuclear Agency, Bangi, 43000 Kajang, Selangor, Malaysia<br />
2 Department of Chemistry, Centre For Defence Foundation Studies, National Defence University Malaysia,<br />
57000 Sungai Besi Camp, Kuala Lumpur, Malaysia<br />
3 Division Director’s Office, Division of Radiation Processing Technology (BTS), Malaysian Nuclear<br />
Agency, Bangi, 43000 Kajang, Selangor, Malaysia<br />
4 Polymer Modification Radiation Group, Division of Radiation Processing Technology (BTS), Malaysian<br />
Nuclear Agency, Bangi, 43000 Kajang, Selangor, Malaysia<br />
5 Laboratory of Molecular Biomedicine, Institute of Bioscience, <strong>Universiti</strong> <strong>Putra</strong> Malaysia, 43400 Serdang,<br />
Selangor, Malaysia<br />
ABSTRACT<br />
This study demonstrated the utilization of radiation-induced initiator methods for the formation of<br />
nanoparticles of Acrylated Palm Oil (APO) using aqueous Pluronic F-127 (PF-127) microemulsion<br />
system. This microemulsion system was subjected to gamma irradiation to form the crosslinked APO<br />
nanoparticles. Dynamic light scattering (DLS), Fourier Transform Infrared (FTIR) spectroscopy and<br />
Transmission Electron Microscopy (TEM) were used to characterize the size and the chemical structure<br />
of the nanoparticles. As a result, the size of the APO nanoparticle was decreased when the irradiation<br />
dose increased. The decrease in size might be due to the effects of intermolecular crosslinking and<br />
intramolecular crosslinking reactions of the APO nanoparticles during irradiation process. The size of the<br />
nanoparticle is in the range of 98 to 200 nanometer (nm) after irradiation using gamma irradiator. This<br />
Article history:<br />
Received: 28 July 2011<br />
Accepted: 13 <strong>Jan</strong>uary 2012<br />
E-mail addresses:<br />
rida@nuclearmalaysia.gov.my (Tajau, R.),<br />
wanmdzin@gmail.com (Wan Yunus, W. M. Z.),<br />
khairul@nuclearmalaysia.gov.my (Mohd Dahlan, K. Z.)<br />
hilmi@nuclearmalaysia.gov.my (Mahmood, M. H.),<br />
kbhashim@nuclearmalaysia.gov.my (Hashim, K.),<br />
maznah@medic.upm.edu.my (Ismail, M.),<br />
mekzah@nuclearmalayisa.gov.my (Salleh, M.),<br />
rosley@nuclearmalaysia.gov.my (Che Ismail, R.)<br />
*Corresponding Author<br />
radiation-induced method provides a free initiator<br />
induced and easy to control process as compared<br />
to the classical or chemical initiator process. The<br />
study has shown that radiation-induced initiator<br />
methods, namely, polymerization and crosslinking<br />
in the microemulsion, were promising for the<br />
synthesis of nanoparticles.<br />
Keywords: Acrylated palm oil, nanoparticle,<br />
radiation crosslinking, ionizing radiation
INTRODUCTION<br />
Tajau, R. et al.<br />
A high energy radiation, i.e. gamma-rays (γ-rays), provides in principle an ideal initiator<br />
for emulsion polymerization because of its high degree of penetration (Stannett & Stahel,<br />
1991). The radiation-induced polymerization method offers more benefits as compared to<br />
the thermal decomposition of chemical initiators method due to its (gamma-ray) ability to<br />
induce polymerization, which can be controlled more easily when the homogenously γ-ray<br />
irradiation is penetrating through the sample. The system is independence of temperature and<br />
no additional component has been introduced in the system that might influence the reaction<br />
(Chen & Zhang, 2007).<br />
There are studies which have reported that the nanogels and microgels (nanoparticle and<br />
microparticle) can be synthesized by combination of polymerization and cross-linking process,<br />
usually in the emulsion system (e.g., Ravi Kumar et al., 2004; Rosiak et al., 2003; Ulanski et<br />
al., 2002). Ulanski and co-workers (1998) reported that the nanogels and microgels produced<br />
using the radiation technique are suited for biomedical applications. In more specific, they<br />
described that this method or process is free of initiators, monomers and any other additives<br />
and it can be used to produce a drug carrier for controlled drug delivery system. Besides that,<br />
this method is able to control the size and composition of the microscopic polymer structure<br />
through a proper selection of the polymer concentration, type of the irradiation and dose rate<br />
(Rosiak et al., 2003).<br />
Furthermore, natural polymers, such as vegetable oils, have been used in developing<br />
nanoparticles as a carrier for controlled drug delivery. The microemulsion-based plant and<br />
vegetable oil formulations have been found promising in a number of drug delivery applications<br />
(Corswant et al., 1998). In this work, Acrylated Palm Oil (APO) microemulsion mainly<br />
contains the water, while modified palm oil and the PF-127 were used to produce the APO<br />
nanoparticle. The microemulsion system was chosen to formulate this APO nanoparticle due to<br />
its unique characteristic, whereby its dispersed phase consists of small droplets with a diameter<br />
in the range of 100-1000 Armstrong (A o ) (Sharma & Shah, 1985). Besides that, miniemulsion<br />
system using water as the dispersed phase is a plentiful, nontoxic, environmental friendly and<br />
inexpensive system (Wang et al., 2007).<br />
Thus, in the present study, the focus of research was to develop nanoparticle of Acrylated<br />
Palm Oil (APO) that could sustainably be used as drug carriers through the radiation-induced<br />
initiator method. The work includes examining the effects of concentration of polymer and<br />
radiation dose on the size, microstructure and the physiochemical structure of nanoparticles.<br />
MATERIALS AND METHODS<br />
Materials<br />
An APO was produced in the Radiation Technology Division, Malaysian Nuclear Agency<br />
(Nuclear Malaysia) Bangi, 43000 Kajang, Selangor, Malaysia and PF-127 purchased from<br />
Sigma Aldrich was used as a surfactant. Double distilled and deionized water prepared at<br />
Nuclear Malaysia was used to prepare the microemulsion.<br />
128 <strong>Pertanika</strong> J. Sci. & Technol. <strong>21</strong> (1): 283 - 298 (<strong>2013</strong>)
Preparation of the APO Nanoparticles<br />
Radiation-Induced Formation of Acrylated Palm Oil Nanoparticle<br />
A standard microemulsion system consisting of three components [water, oil (APO) and<br />
non-ionic surfactant (PF-127)] was developed to formulate the APO nano-droplets. One<br />
concentration of PF-127 surfactant at 0.00039M was used to develop the micellar. Then, two<br />
volumes of APO (i.e. 0.18% and 1.8%) were added to the micellar system, respectively. The<br />
samples were stirred for one hour at 400 rpm using a magnetic stirrer. Then, they were stirred<br />
continuously using a high speed mechanical stirrer (Dispermat, VMA-Getzmann GMBH) for<br />
at least one hour at 3000 rpm. The vessels were closed tightly using Para film and degassed for<br />
30 minutes using nitrogen gas. After degassing, the vessel was screwed capped immediately.<br />
The samples were then irradiated at 0.36, 0.5, 1, 5, 10, 15 and 25 kiloGray (kGy) using gamma<br />
irradiation for fabrication of nanoparticles of the cross-linked APO.<br />
Characterization of the Nanoparticles<br />
The samples were ultrafiltered using a disposable polytetrafluoroethylene (PTFE) teflon filter<br />
for removing suspended materials or impurity. The filtrates were collected to determine their<br />
size. The filtrates were placed in 1 cm quartz cell before the measurement was done. The mean<br />
diameter of the samples was determined by photon cross correlation spectroscopy (PCCS) using<br />
a dynamic light scattering (Sympatec Nanophox). The wavelength for this PCCS was at 632<br />
nm. Infra-red spectrum was performed using Fourier Transform Infrared (FTIR) spectroscopy<br />
(Perkin Elmer). The FTIR spectroscopy was used to characterize the carbon double bond (C=C)<br />
crosslinking transformation of the sample. The Perkin Elmer Spectrophotometer was set-up at<br />
spectra in the range of 4000 cm -1 to 500 cm -1 . The dried samples were analyzed using Attenuated<br />
Total Reflectance (ATR) method. The Transmission Electron Microscopy (TEM) images were<br />
obtained using a Zeiss microscope (JEOL, Japan) and analyzed at the voltage range of 80-120<br />
kilovolt (kV). The dried samples were placed on a copper grid prior to analysis.<br />
RESULT AND DISCUSSIONS<br />
Formation of APO Nanoparticles<br />
Table 1 tabulated the size of the APO nanoparticle before and after irradiation, as characterized<br />
by the dynamic light scattering (DLS). This study found that the size of the APO nanoparticle<br />
decreased when increasing the irradiation dose. This was due to the intraparticle crosslinking<br />
of the radicals and the hampered diffusion of monomer molecules to the structure (Ulanski<br />
& Rosiak, 2004). The intermolecular crosslinking of the nanoparticles was dominant at<br />
irradiation process of 1 kGy or lower of the irradiation dose. However, above 1 kGy, the<br />
crosslingking reaction of the particles might involve both intermolecular and intramolecular<br />
crosslinking proceses. This study revealed that the sample underwent crosslinking, leading<br />
to the formation of smaller size of the APO nanoparticles (see Table 1). After the sample had<br />
been exposed to the gamma irradiation, the water molecule underwent hydrolysis. As a result,<br />
initial reactive intermediates were formed, such as hydroxyl radicals ( • OH), H-atoms (H • ) and<br />
hydrated electrons (Equation 1). Then, the OH radicals and the H atoms reacted with APO<br />
macromolecules by hydrogen abstraction. As a result of this process, a radical was formed on<br />
<strong>Pertanika</strong> J. Sci. & Technol. <strong>21</strong> (1): 283 - 298 (<strong>2013</strong>)<br />
129
Tajau, R. et al.<br />
the acrylate’s carbon double bond of the APO macromolecule C=C-C- •C-C-C- (Equation<br />
2). Afterward in the APO molecular structure, these radicals •C-C-C- underwent crosslinking<br />
reaction and this resulted in the formation of networking between the APO chains after being<br />
subjected to the maximum dose of gamma irradiation (Equation 3). In this study, the maximum<br />
dose for the APO nanoparticle to undergo the crosslinking was approximately between 10 to 25<br />
kGy using gamma irradiation. Ulanski and Rosiak (1999) reported that the nanogel dimensions<br />
became smaller as compared to the parent (origin) polymer because of the shrinkage of the<br />
initial loose and mobile polymer coils into a more tightly bound entities. In this study, the<br />
smallest size of the APO particle formation was approximately 98.70 nm at 25 kGy in the<br />
0.18% of the APO/PF-127 system. Besides that, the study also showed that the higher APO<br />
content sample produced bigger particle size, as shown in Table 1.<br />
TABLE 1: Size of the PF127/APO nanoparticles upon irradiation<br />
Dose (kGy)<br />
Particle Size, nm<br />
0.18% APO 1.8% APO<br />
0 184.74 <strong>21</strong>9.45<br />
0.36 172.94 192.72<br />
0.50 122.29 173.48<br />
1 115.36 132.36<br />
5 114.99 132.35<br />
10 99.37 130.65<br />
15 99.45 133.05<br />
25 98.70 141.80<br />
*kGy-kiloGray, nm-nanometer<br />
H 2O<br />
γ<br />
OH, H , e- aq , H + , OH- . . , H2O2 , H<br />
[Equation 1]<br />
2<br />
“radical generation”<br />
130 <strong>Pertanika</strong> J. Sci. & Technol. <strong>21</strong> (1): 283 - 298 (<strong>2013</strong>)<br />
[Equation 2]
Radiation-Induced Formation of Acrylated Palm Oil Nanoparticle<br />
“crosslinking”<br />
Fourier Transform Infra-red (FTIR) Spectra Analysis<br />
<strong>Pertanika</strong> J. Sci. & Technol. <strong>21</strong> (1): 283 - 298 (<strong>2013</strong>)<br />
[Equation 3]<br />
Fig.1 shows the spectrum of the APO nanoparticle before and after irradiation. The spectrum<br />
clearly showed that the IR peaks of the APO nanoparticle underwent transition schematically<br />
from 0 kGy, 1 kGy, until the 25 kGy. As detected by the IR spectrum in Fig.1 (see the spectrum<br />
before irradiation at 0 kGy), it was demonstrated that the peaks at 29<strong>21</strong> -2856 cm -1 represented<br />
-CH stretching from the PF-127 and the APO mixture, whereby these peaks consequently<br />
illustrated the existence of the microemulsion hydrocarbon or the micellar core. Furthermore,<br />
the peaks of 3432, 1741, 1638, 1404, 985, 810 and 1282-1243 cm -1 represent the APO’s<br />
functional groups such as -OH (alcohol), C=O (carbonyl), C=C (acrylate’s carbon-carbon<br />
Fig.1: FTIR spectra of the APO/PF127 nanoparticle, before (at 0 kGy) and after irradiation at 1 kGy<br />
and 25 kGy, respectively.<br />
131
Tajau, R. et al.<br />
double bond) and COOH (carboxylic). The bands at 1146 to 1060 cm -1 were due to the presence<br />
of PO (propylene oxide) chains (C-O-C) of hydrocarbon chains of the PF-127.<br />
After irradiation, the peaks slowly underwent transition at 1 kGy (see Fig.1, spectrum<br />
at 1 kGy). When the irradiation dose increased to 25kGy, the carbon double bond (C=C)<br />
peaks disappeared at 1638, 1404, 985 and 810 cm -1 , confirming that the APO nanoparticle<br />
was completely crosslinked (see Fig.1, spectrum at 25 kGy). Besides that, the height peak of<br />
-OH at 3434 cm -1 was increasing and becoming broader due to the increasing amount of APO<br />
networking chains. The occurrence of the interaction between the hydrocarbons chains of PO<br />
and APO was illustrated by the appearances of the broad and single -CH stretching peaks at 2867<br />
cm -1 . Meanwhile, the existence of C-O-C of the PO group was demonstrated by the appearance<br />
of the single and broad peak at 1101 cm -1 . Furthermore, the C=O and COOH peaks were also<br />
shown to be smaller and broader at 1743 cm -1 and 1308-1249 cm -1 , respectively. This study<br />
revealed that the polymerization and the crosslinking process to form the APO nanoparticle<br />
seemed to be completed at 25 kGy.<br />
120 kV, magnification: 5000<br />
(a) Before irradiation<br />
80 kV, magnification:20 000<br />
(c) After irradiation at 1kGy<br />
120 kV, magnification: 10 000<br />
(b) Before irradiation<br />
120kV, magnification:10 000<br />
(d) After irradiation at 25kGy<br />
Fig.2: The TEM images of the APO/PF-127 nanoparticles formulated with 1.8% w/v EPOLA in 0.00039<br />
M PF-127, before (a,b at 0 kGy) and after irradiation (c at 1 kGy and d at 25 kGy)<br />
132 <strong>Pertanika</strong> J. Sci. & Technol. <strong>21</strong> (1): 283 - 298 (<strong>2013</strong>)
Radiation-Induced Formation of Acrylated Palm Oil Nanoparticle<br />
Transmission Electron Microscopy (TEM) Images<br />
Fig.2 shows images of the APO nanoparticle before and after irradiation. As illustrated in the<br />
figure, the size of the nanoparticle was approximately in the range of 44-57 nm (Fig.2b) for the<br />
before irradiation, 35-51 nm (Fig. 2c) and 108-144 nm (Fig.2d) for the after irradiation at 1 and<br />
25 kGy, respectively. The shape of the APO nanoparticle was spherical and its size distribution<br />
was not uniform. The main factor of the particle size enlargement after irradiation at 25 kGy<br />
(Fig. 2d) was due to the diffusion of the hydrophobic core of PO and APO, in addition to the<br />
growth of C=C crosslinked chains in the nanoparticle.<br />
CONCLUSION<br />
This study has shown that the APO nanoparticles were successfully developed by using<br />
the radiation-induced initiator method in the microemulsion system. The results obtained<br />
revealed that the size of the APO nanoparticle produced in this study was in the nanometer<br />
and submicron, which was below 200 nm particle size after irradiation using gamma-rays.<br />
The size of the APO nanoparticles depended upon the irradiation doses and the microemulsion<br />
formulations.<br />
ACKNOWLEDGMENTS<br />
The authors are indebted to the Government of Malaysia through the Ministry of Science,<br />
Technology and Innovation (MOSTI) and the Public Service Department (JPA) for their financial<br />
(SCIENCEFUND: 03-03-01-SF0052 and HLP) and technical supports in implementing this<br />
study. In particular, the author gratefully acknowledged the grants (HCD Fund-RMK9) provided<br />
by the Malaysian Nuclear Agency (Nuclear Malaysia) for the project (MINT R&D 05-025-01).<br />
REFERENCES<br />
Chen, J., & Zhang, Z. C. (2007). Radiation-induced polymerization of methyl methacrylate in<br />
microemulsion with high monomer content. <strong>Journal</strong> of European Polymer, 43, 1188-1194.<br />
Corswant, C. V., Thorean, P., & Engstrom, S. (1998). Triglyceride-based microemulsion for intravenous<br />
administration of sparingly soluble substances. <strong>Journal</strong> of Pharmaceutical Sciences, 87(2), 200-208.<br />
Ravi Kumar, M. N. V., Sameti, M., Kneuer, C., Lamprecht, A., & Lehr, C. M. (2004). Polymeric<br />
Nanoparticles for Drug and Gene Delivery. Encyclopedia of Nanoscience And Nanotechnology, 9, 1-9.<br />
Rosiak, J. M., <strong>Jan</strong>ik, I., Kadlubowski, S., Kozicki, M., Kujawa, P., Stasica, P., & Ulanski, P. (2003).<br />
Nano-, Micro- And Macroscopic Hydrogels Synthesized By Radiation Technique. Nuclear Instruments<br />
and Methods in Physics Research B, 208, 325-330.<br />
Sharma, M. K., & Shah, D. O. (1985). Macro- and Microemulsions: Theory and Applications.<br />
Washington: American Chemical Society.<br />
Stannett, V. T., & Stahel, E. P. (1991). Radiation Processing (An Overview in Radiation Processing of<br />
Polymers). New York: Hanser Publishers.<br />
Ulanski, P., <strong>Jan</strong>ik, I., & Rosiak, J. M. (1998). Radiation Formation of Polymeric Nanogels. Radiation<br />
Physics and Chemistry, 52, 1-6.<br />
<strong>Pertanika</strong> J. Sci. & Technol. <strong>21</strong> (1): 283 - 298 (<strong>2013</strong>)<br />
133
Tajau, R. et al.<br />
Ulanski, P., & Rosiak, J. M. (1999). The use of radiation technique in the synthesis of polymeric nanogels,<br />
<strong>Journal</strong> of Nuclear Instruments and Methods in Physics Research (B), 151, 356-360.<br />
Ulanski, P., Kadlubowski, S., & Rosiak, J. M. (2002). Synthesis of Poly (acrylic acid) Nanogels by<br />
Preparative Pulse Radiolysis. Radiation Physics and Chemistry, 63, 533-537.<br />
Ulanski, P., & Rosiak, J. M. (2004). Polymeric Nano/Microgels. Encyclopedia of Nanoscience and<br />
Nanotechnology, X, 1-26.<br />
Wang, S., Wang, X., & Zhang, Z. (2007). Preparation of polystyrene particles with narrow particle<br />
size distribution by γ–ray initiated miniemulsion polymerization stabilized by polymeric surfactant.<br />
<strong>Journal</strong> of European Polymer, 43, 178-184.<br />
134 <strong>Pertanika</strong> J. Sci. & Technol. <strong>21</strong> (1): 283 - 298 (<strong>2013</strong>)
ISSN: 0128-7680 © <strong>2013</strong> <strong>Universiti</strong> <strong>Putra</strong> Malaysia Press.<br />
<strong>Pertanika</strong> J. Sci. & Technol. <strong>21</strong> (1): 135 - 140 (<strong>2013</strong>)<br />
SCIENCE & TECHNOLOGY<br />
<strong>Journal</strong> homepage: http://www.pertanika.upm.edu.my/<br />
Induced Tensile Properties With EB- Cross Linking of Hybridized<br />
Kenaf/Palf Reinforced HDPE Composite<br />
Aji, I. S. 1 *, Zinudin, E. S. 2 , Khairul, M. Z. 3 , Abdan, K. 4 and S. M. Sapuan 1<br />
1 Department of Mechanical and Manufacturing Engineering, Faculty of Engineering, <strong>Universiti</strong> <strong>Putra</strong><br />
Malysia, 43400 Serdang, Selangor, Malaysia<br />
2 Institute of Tropical Forestry and Forest Products, Laboratory of Biocomposite technology, <strong>Universiti</strong><br />
<strong>Putra</strong> Malysia, 43400 Serdang, Selangor, Malaysia<br />
3 Polymer and Radiation Division, Malaysian Nuclear Agency, Bangi, 43000 Kajang, Selangor, Malaysia<br />
4 Department of Biological and Agricultural Engineering, <strong>Universiti</strong> <strong>Putra</strong> Malaysia, 43400 Serdang,<br />
Selangor, Malaysia<br />
ABSTRACT<br />
Electron beam irradiation, without any addition of cross-linking agents, was investigated at varying<br />
doses of EB-Irradiation to develop an environmentally friendly hybridized kenaf (bast)/ pineapple leaf<br />
fibre (PALF) bio-composites. Improvement in tensile property of the hybrid was achieved with the result<br />
showing a direct proportionality relationship between tensile properties and increasing radiation dose.<br />
Statistical analysis software (SAS) was employed to validate the result. HDPE has been shown to have<br />
self-cross-linked, enabling interesting tensile properties with irradiation. Statistical analysis validated<br />
the results obtained and also showed that adequate mixing of fibres and matrix had taken place at 95%<br />
confidence level. Hybridization and subsequent irradiation increased the tensile strength and modulus<br />
of HDPE up to 31 and 185%, respectively, at about 100kGy. Meanwhile, SEM was used to view the<br />
interaction between the fibres and matrix.<br />
Keywords: Hybrid, cross linking, EB-irradiation, tensile properties, statistical analysis<br />
Article history:<br />
Received: 23 July 2011<br />
Accepted: 13 <strong>Jan</strong>uary 2012<br />
E-mail addresses:<br />
suleimanaji@yahoo.com (Aji, I. S.),<br />
edisyam@gmail.com (Zinudin, E. S.),<br />
khairul@nuclearmalaysia.gov.my (Khairul, M. Z.),<br />
khalina@eng.upm.edu.my (Abdan, K.),<br />
sapuan@eng.upm.edu.my S. M. Sapuan)<br />
*Corresponding Author<br />
INTRODUCTION<br />
For many years, research has been carried out<br />
on the use of natural fibres for both automobile<br />
and structural applications. This has helped to<br />
reduce the use of synthetic materials for the<br />
sake of our environment. Nowadays, natural<br />
fibres are used to reinforce polymers that<br />
serve as matrix. Several factors have aided the
Aji, I. S., Zinudin, E. S., Khairul, M. Z., Abdan, K. and S. M. Sapuan<br />
use of these natural fibres, including low cost, light weight, environmental friendliness, ease<br />
of formulation, availability in most countries, specific strength, relative non-abrasiveness to<br />
processing equipments (George et al., 2001; Lee et al., 2005; Li et al., 2008; Aji et al., 2009),<br />
just to mention a few. Meanwhile, some marketable reasons in replacing synthetic fibres with<br />
natural ones include low cost (~1/3 of glass fibres), lower density (~1/2 of glass), as well as<br />
acceptable specific strength properties and enhance energy recovery, CO 2 sequesterization and<br />
its natural tendency to degrade (Kim et al., 2007).<br />
Electron beam irradiation (EBI) technique is gaining increased attention as a surface<br />
modifier and properties enhancer of various polymers, natural and synthetic fibre composites.<br />
This is because the process is devoid of wet conditions, while its clean and cold process gives<br />
rise to energy saving and high-speed enhancement of properties.<br />
It has been reported by Han et al. (2006) that the presence of inner pore structure of natural<br />
fibril can be maintained by the use of EBI treatment unlike its destruction when fibres undergo<br />
alkali treatment. These pore structures can serve as insulators and collision absorbers when<br />
such composites are used in automobile and structural part. Similarly, to achieve superior<br />
strength in natural fibre composite, there is a basic need to improve fibre/matrix adhesion,<br />
and the use of adequate coupling agents and EB-Irradiation is one of the ways to achieve this<br />
(Czvikovszky, 1996). However, hybridization has been shown to be one of the ways to achieve<br />
this objective (Aji et al., 2011).<br />
This work presents the response of Hybridized Kenaf/PALF reinforced HDPE Composite’s<br />
tensile properties to EB-Irradiation without the addition of cross linking agents to develop an<br />
environmentally friendly bio-composite.<br />
MATERIALS AND METHOD<br />
Materials<br />
Pineapple leaf (Ananas comosus) was bought from Perniagaan Benang Serat Nanas M&Z,<br />
with the source from Johor pineapple plantation, Malaysia. It was manually decorticated from<br />
the PALF variety of “Josephine”. Kenaf (Hibiscus cannabinus) of variety V36, which was<br />
purchased from KEFI Malaysia Sdn. Bhd., was utilized in this research. These fibres were<br />
reinforced with high density polyethylene, which was also purchased from KEFI Malaysia.<br />
The tensile strength and modulus of HDPE used as tested by us using ASTM D-638 was 29.44<br />
MPa and 287.70 MPa, with a melting point of 180 – 240 o C, in addition to a melt mass flow<br />
rate of 0.10/10min (190 o C/2.16 kg) and a density of 0.95 g/cm 3 .<br />
Preparation of the Composite<br />
The fibres of Kenaf and PALF (at a ratio of 1:1) and the fibre length of 0.25 mm were utilized<br />
for this particular experiment. The fibres were carefully and thoroughly mixed together in<br />
a Brabender Plasticod at a fibre loading of 50%, in 190 o C, at 40 rpm processing speed and<br />
for 25 minutes operating (Aji et al., 2011). The mixed composite obtained from the internal<br />
mixer was cut into pellets and compressed in a compression-moulding machine set at 170 o C,<br />
with 7 min preheat, 5 min full press, 10 seconds of venting process, and 5 min cooling of the<br />
136 <strong>Pertanika</strong> J. Sci. & Technol. <strong>21</strong> (1): 283 - 298 (<strong>2013</strong>)
Induced Tensile Properties With EB- Cross Linking of Hybridized Kenaf/Palf Reinforced HDPE Composite<br />
compressed hybrid composite sheet. Thereafter, a Dog-bone tensile specimen of 10 mm X 1.5<br />
mm X 1 mm was cut out using a pneumatic tensile sample cutter. The test specimens were<br />
conditioned in an oven for <strong>21</strong> hrs at 105 o C prior to the tensile test.<br />
Electron Beam Irradiation<br />
The tensile specimens produced as described earlier were irradiated using an electron beam (EB)<br />
accelerator EPS Model-3000 at a dose range of 10–100 kGy in the sequence of 10, 20, 30, 40,<br />
60, 80 and 100 kGy at 10 kGy per pass. All the samples were irradiated at room temperature,<br />
with accelerator energy of 2 MeV, beam current of 2 mA, and conveyor speed of 1.88 m/m.<br />
Tensile Testing<br />
The tensile measurement of the hybrid composite specimen was conducted using a 5 kN Bluehill<br />
INSTRON universal testing machine according to ASTM D638 as the test condition. 2 mm/<br />
min crosshead speed was used to run the machine.<br />
RESULT AND DISCUSSIONS<br />
The effect of radiation on the hybrid composite produced without the addition of cross-linkers<br />
is shown in Fig.1. It is clear that the tensile strength and modulus of the composite increased<br />
with the increase in the radiation dose. Although the strength of the composite dropped as<br />
compared to pure HDPE, it increased after exposure to radiation at 10 kGy and above. The<br />
increases of the tensile strength and the modulus of the hybrid composite upon irradiation<br />
are due to the fact that HDPE is a radiation cross-linkable polymer (Wilson & Burton, 1974;<br />
Singh & Silverman, 1992a; Singh, 2001). The EB irradiation of agro-fibres has been shown to<br />
induce formation of radicals that may undergo subsequence radical-radical reactions that lead<br />
to chemical bonding or may undergo radical induced chain scission that leads to degradation<br />
upon exposure to high energy radiation (Singh & Silverman, 1992b). In the current system, the<br />
radical formation of HDPE and agro-fibres led to the cross-linking between the two materials<br />
and contributed to the enhancement of the properties at lower dose of about 10 kGy. However,<br />
at higher doses, the competition between cross-linking and degradation, in particular for agrofibres,<br />
is prominent and hence there is no significant increase in the properties of the hybrid<br />
composites between 20 kGy and 100 kGy.<br />
SAS was used to analyze the tensile properties obtained so that statistical validation of<br />
the results can be obtained. This can help to see if adequate mixing of the hybrid has been<br />
achieved because it is the pre-requisite to achieving optimum mechanical properties. The GLM<br />
procedure and Duncan multiple range test results are shown in Table 1 for both strength and<br />
modulus. It is clear that an adequate mixing of fibres and matrix had taken place although at a<br />
probability of 5%, the replication of the specimen produced and tested is significant at lower<br />
doses. Increasing the radiation dose on the hybrid has also shown to significantly assist in<br />
improving the tensile property of the hybrid, especially in terms of the hybrid’s modulus. The<br />
results have also shown that for tensile modulus, even at a probability of 1%, increasing the<br />
amount of irradiation dose is very significant in improving hybrid’s modulus. Duncan’s grouping<br />
<strong>Pertanika</strong> J. Sci. & Technol. <strong>21</strong> (1): 283 - 298 (<strong>2013</strong>)<br />
137
Aji, I. S., Zinudin, E. S., Khairul, M. Z., Abdan, K. and S. M. Sapuan<br />
Fig.1: Variation in the tensile properties of hybridized composite<br />
has also shown that lower dosed hybrid is closely interacting with each other. This meant that<br />
the dose applied to the hybrid was not significantly different between 10 and 40 kGy until<br />
about 60 kGy onward, where significant formation of the radicals that underwent subsequence<br />
radical-radical reactions led to increase chemical bonding, leading to greater improvement in<br />
properties, especially that of the hybrid’s modulus. Hybridization and subsequent irradiation<br />
increased the tensile strength and modulus of HDPE to 31 and 185%, respectively, at about<br />
100 kGy.<br />
Fig.2 and Fig.3 show that this close interaction took place within the composite at lower<br />
and higher doses. This must have been the reason why there was a direct proportionality<br />
relationship between the amount of dose and the tensile properties obtained in the hybrid<br />
composite produced. It is clear that there is a tendency for higher tensile properties with the<br />
increase in dose that can be received by this kind of hybrid.<br />
Fig.2: Tensile specimen at 10kGy without cross<br />
linking<br />
Fig.3: Tensile specimen at 100kGy without cross<br />
linking<br />
138 <strong>Pertanika</strong> J. Sci. & Technol. <strong>21</strong> (1): 283 - 298 (<strong>2013</strong>)
Induced Tensile Properties With EB- Cross Linking of Hybridized Kenaf/Palf Reinforced HDPE Composite<br />
TABLE 1: The SAS analysis for Tensile strength and Modulus: Means with the same letter are not<br />
significantly different (alpha = 0.5)<br />
Dependent Variable: TStrength (Alpha = 0.5)<br />
Sum of<br />
Source DF Squares Mean Square F Value Pr > F<br />
Model 12 497.709442 41.475787 2.05 0.0605<br />
Error 26 524.918198 20.189161<br />
Corrected Total 38 1022.627640<br />
R-Square Coeff Var Root MSE TStrength Mean<br />
.486697 14.03633 4.493235 32.01146<br />
Source DF Type I SS Mean Square F Value Pr > F<br />
Rep 4 115.6834183 28.9208546 1.43 0.2514<br />
Trt 8 382.0260238 47.7532530 2.37 0.0463<br />
Duncan Grouping Mean N Trt<br />
A 38.099 3 100kGy<br />
B A 36.124 4 80kGy<br />
B A C 33.916 5 60kGy<br />
B A C 32.870 4 40kGy<br />
B A C 31.899 4 10kGy<br />
B A C 31.041 5 20kGy<br />
B C 30.369 4 30kGy<br />
B C 29.445 5 Neat HDPE<br />
C 27.419 5 Un-irradiated Hybrid<br />
TModulus Sum of<br />
Source DF Squares Mean Square F Value Pr > F<br />
Model 12 1060713.996 88392.833 9.30 F<br />
Rep 4 6<strong>21</strong>40.6451 15535.1613 1.63 0.1956<br />
Trt 8 998573.3508 1248<strong>21</strong>.6689 13.13
CONCLUSION<br />
Aji, I. S., Zinudin, E. S., Khairul, M. Z., Abdan, K. and S. M. Sapuan<br />
In the current study, electron beam irradiation, without the addition of any cross linking agents,<br />
was investigated at varying doses of EB-Irradiation to develop environmentally friendly biocomposites.<br />
Improvement in the tensile properties of the hybrid was achieved, with the result<br />
showing a direct proportionality relationship between tensile properties and increased radiation<br />
dose. In particular, HDPE has been shown to be self-cross-linked, enabling interesting tensile<br />
properties with irradiation. Meanwhile, the statistical analysis conducted validated the results<br />
obtained and showed that an adequate mixing of fibres and matrix had taken place at very<br />
significant level in tensile modulus of the hybrid.<br />
REFERENCES<br />
Aji, I. S., S. M. Sapuan, E. S. Zainudin, & K. Abdan. (2009). Kenaf fibres as reinforcement for polymeric<br />
composites: a review. International <strong>Journal</strong> of Mechanical and Materials Engineering (IJMME), 4,<br />
239–248.<br />
Aji, I. S., E. S. Zainuddin, A. Khalina, & S. M. Sapuan. (2011). Optimizing Processing Parameters for<br />
Hybridized Kenaf/PALF Reinforced HDPE Composite. Key Engineering Materials, 471, 674–679.<br />
Aji, I. S., E. S. Zainudin, A. Khalina, S. M. Sapuan, & M. D. Khairul. (2011). Studying the effect of<br />
fiber size and fiber loading on the mechanical properties of hybridized kenaf/PALF-reinforced HDPE<br />
composite. <strong>Journal</strong> of Reinforced Plastics and Composites, 30, 546 -553.<br />
Czvikovszky, T. (1996). Electron-beam processing of wood fiber reinforced polypropylene. Radiation<br />
Physics and Chemistry, 47, 425–430.<br />
George, J., Sreekala, M. S., & Thomas, S. (2001). A review on interface modification and characterization<br />
of natural fiber reinforced plastic composites. Polymer Engineering & Science, 41, 1471-1485.<br />
Han, Y. H., Han, S. O. Cho, D., & Kim, H. I. (2006). Henequen/unsaturated polyester biocomposites:<br />
electron beam irradiation treatment and alkali treatment effects on the henequen fiber. Macromolecular<br />
Symposia, 245-246, 539–548.<br />
Kim, S. W., Oh, S., & Lee, K. (2007). Variation of mechanical and thermal properties of the thermoplastics<br />
reinforced with natural fibers by electron beam processing. Radiation Physics and Chemistry, 76,<br />
1711–1714.<br />
Lee, S. M., Cho, D., Park, W. H., Lee, S. G., Han, S. O., & Drzal, L. T. (2005). Novel silk/poly (butylene<br />
succinate) biocomposites: the effect of short fibre content on their mechanical and thermal properties.<br />
Composites Science and Technology, 65, 647–657.<br />
Li, Y., Hu, C., & Yu, Y. (2008). Interfacial studies of sisal fiber reinforced high density polyethylene<br />
(HDPE) composites. Composites Part A, 39, 570–578.<br />
Singh, A. (2001). Irradiation of polymer blends containing a polyolefin. Radiation Physics and Chemistry,<br />
60, 453–459.<br />
Singh, A., & Silverman, J. (1992a). Radiation processing of polymers. Hanser Munich.<br />
Singh, A., & Silverman, J. (1992b). Radiation processing of polymers. Hanser Munich.<br />
Wilson, J. E., & Burton, M. (1974). Radiation chemistry of monomers, polymers, and plastics. Physics<br />
Today, 27, 50.<br />
140 <strong>Pertanika</strong> J. Sci. & Technol. <strong>21</strong> (1): 283 - 298 (<strong>2013</strong>)
ISSN: 0128-7680 © <strong>2013</strong> <strong>Universiti</strong> <strong>Putra</strong> Malaysia Press.<br />
<strong>Pertanika</strong> J. Sci. & Technol. <strong>21</strong> (1): 141 - 150 (<strong>2013</strong>)<br />
SCIENCE & TECHNOLOGY<br />
<strong>Journal</strong> homepage: http://www.pertanika.upm.edu.my/<br />
Thermal Properties of Alkali-Treated Sugar Palm Fibre Reinforced<br />
High Impact Polystyrene Composites<br />
D. Bachtiar 1 *, S. M. Sapuan 1 , E. S. Zainudin 2 , A. Khalina 3 and K. Z. H. M. Dahlan<br />
1 Department of Mechanical and Manufacturing Engineering, Faculty of Engineering, <strong>Universiti</strong> <strong>Putra</strong><br />
Malysia, 43400 Serdang, Selangor, Malaysia<br />
2 Institute of Tropical Forest and Forest Products, <strong>Universiti</strong> <strong>Putra</strong> Malaysia, 43400 Serdang, Selangor,<br />
Malaysia<br />
3 Department of Biological and Agricultural Engineering, Faculty of Engineering, <strong>Universiti</strong> <strong>Putra</strong><br />
Malaysia, 43400 Serdang, Selangor, Malaysia<br />
4 Radiation Processing Division, Malaysian Nuclear Agency, Bangi, 40300 Kajang, Selangor, Malaysia<br />
ABSTRACT<br />
Thermal characterization of sugar palm fibre (SPF), reinforced high impact polystyrene (HIPS)<br />
composites, was studied by means of thermogravimetric analysis. The effects of alkaline treatment and<br />
compatibilizing agent on the thermal stability of the composites were evaluated. Alkaline treatment was<br />
carried out by soaking the fibres in 4 and 6% of NaOH solution, while treatment with compatibilizing<br />
agent was employed by adding 2 and 3% maleic anhydride-graft-polystyrene (MA-g-PS) to the<br />
composites. Both the treatments were aimed to improve the mechanical performance of the composites.<br />
From the study, the thermal stability of the treated composites was found to be higher than that of<br />
untreated composites. It is shown that the incorporation of sugar palm fibre influences the degree of<br />
thermal stability of the composites. The treatments on composites also contributed to shifting the peak<br />
temperature of degradation of the composites. In other words, there are strong chemical reactions between<br />
the components of the treated composites. The thermal stability of the composites, with alkaline treatment<br />
and compatibilizing agent, was found to be better as compared to those of the untreated composites.<br />
Keywords: Thermal stability, sugar palm fibre, high impact polystyrene, thermogravimetry<br />
Article history:<br />
Received: 28 July 2011<br />
Accepted: 13 <strong>Jan</strong>uary 2012<br />
E-mail addresses:<br />
dandibachtiar@gmail.com (D. Bachtiar),<br />
sapuan@eng.upm.edu.my (S. M. Sapuan),<br />
edisyam@gmail.com (E. S. Zainudin),<br />
khalina@eng.upm.edu.my (A. Khalina),<br />
khairul@nuclearmalaysia.gov.my (K. Z. H. M. Dahlan)<br />
*Corresponding Author<br />
INTRODUCTION<br />
The application of natural fibres in the<br />
production of thermoplastic composites is<br />
highly beneficial as these materials have been<br />
shown to improve toughness, stiffness and<br />
strength of plastic. Moreover, these materials<br />
are cheap, biodegradable and also flexible. As
D. Bachtiar, S. M. Sapuan, E. S. Zainudin, A. Khalina and K. Z. H. M. Dahlan<br />
a substitute for glass fibre materials, they also reduce the wear of machinery. They are of low<br />
density and produce environmentally friendly goods (Bledzki & Gassan, 1999; George et al.,<br />
2001). Various types of natural fibres have been widely recognized in the study of reinforcement<br />
of thermoplastics such as sisal, abaca, kenaf, sugar palm, pineapple leaf, jute, flax, hemp, and<br />
sugarcane fibres (John & Thomas, 2008; Bledzki et al., 2007; Malkapuram et al., 2009; Joffe<br />
& Andersons, 2008).<br />
Although natural fibre based reinforcement of thermoplastics has shown satisfactory results<br />
in some aspects, there are still problems at the interface between the fibre and matrix. They<br />
are not fully integrated due to the fact that natural fibres are hydrophilic and thermoplastics<br />
are hydrophobic. This caused poor adhesion, and thereby, stress is not fully transferred at the<br />
interface when loading takes place onto the material. In order to overcome this drawback, some<br />
treatments were usually applied. Mercerization was one famous treatment on the surface of<br />
natural fibres. Many studies by researchers everywhere have been reported on the improvement<br />
on the mechanical properties of the natural fibre composites after mercerization or alkaline<br />
treatment (Li et al., 2007). Another common treatment used to enhance the performance of<br />
natural fibre composites was the application of a compatibilizing agent such as maleic-anhydride<br />
to the thermoplastics matrix. The difference of this with that of the alkaline treatment is that<br />
maleic anhydride is not only used to modify the surface of fibre but also the thermoplastic<br />
matrix so as to achieve better interfacial bonding and mechanical properties in composites<br />
(Joseph et al., 2003). Meanwhile, dispersion of the fibres in polymer matrix was enhanced<br />
by this compatibilizing agent, and it also improved the quality of interfacial interaction that<br />
promoted adhesion of fibres and polymeric matrix.<br />
Recently, the authors reported on the tensile properties (Bachtiar et al., 2011) of short<br />
sugar palm fibre reinforced high impact polystyrene composites. However, no work has<br />
reported on the thermal properties of these composites. Thermal analysis is an important<br />
analytical method in understanding the structure–property relationships and thermal stability of<br />
composite materials. Thermal analysis can be used to determine moisture content and volatile<br />
component present in composites. Since moisture content and volatile components have<br />
deteriorating effects on the properties of the composite, these studies are of great importance.<br />
Thermogravimetric (TG) analysis is one of the common methods used in assessing thermal<br />
properties of polymeric materials. The data indicate a number of stages of thermal breakdown,<br />
weight loss of the material in each stage and threshold temperature. Both TG and derivative<br />
thermogravimetry (DTG) provide information about the degree of degradation of the material<br />
(Joseph et al., 2003).<br />
In the present paper, the results report on the present studies on the thermal properties<br />
of short sugar palm fibre reinforced high impact polystyrene composites under TG analysis<br />
after alkaline treatment and treatment with compatibilizing agent. The objective of the study<br />
was to look at the effects of the alkaline treatment and compatibilizing agent on the thermal<br />
stability of the composites.<br />
142 <strong>Pertanika</strong> J. Sci. & Technol. <strong>21</strong> (1): 283 - 298 (<strong>2013</strong>)
Thermal Properties of Alkali-Treated Sugar Palm Fibre Reinforced High Impact Polystyrene Composites<br />
MATERIALS AND METHOD<br />
Materials<br />
The high impact polystyrene (HIPS) used as the matrix polymer was Idemitsu PS HT 50,<br />
supplied by the Petrochemical (M) Sdn. Bhd., Pasir Gudang, Johor, Malaysia. The sugar palm<br />
fibre (SPF) was obtained from a traditional market in Aceh, Indonesia. The fibres were crushed<br />
with a pulverisette machine for shortening and sieved through 30 and 50 mesh screens. There<br />
were two types of treatment used in this study: (1) mercerization using an alkali solution and<br />
(2) polystyrene-block-poly(ethylene-ran-butylene)-block-poly(styrene-graft-maleic-anhydride)<br />
which was as a compatibilizing agent. NaOH and the MA-g-PS compatibilizing agent were<br />
supplied by Aldrich Chemical Company, Malaysia.<br />
Treatment Processing<br />
The first treatment was mercerization or alkali treatment. It was carried out by immersing<br />
the short fibres in NaOH solution for 1 hour at room temperature. Four and 6% NaOH were<br />
used as soaking solutions for the modification of the surface of the fibres. The fibre/solution<br />
ratio used was 1:20 (w/v). The treated fibres were then washed with distilled water to remove<br />
residual NaOH thoroughly. The drying process of the fibres was done using an oven at 100°C<br />
for 2 days. The second treatment included applying two different weight concentrations (2<br />
and 3 wt. %) of the compatibilizing agent.<br />
Composite Processing<br />
The sugar palm fibres (40 wt. %) were mixed with the HIPS matrix using a common method<br />
as previously reported (Bachtiar et al., 2011). The HIPS (58 wt. % and 57 wt. %) and<br />
compatibilizing agent (2 wt. % and 3 wt. %) were first premixed at room temperature for 3<br />
minutes. The HIPS and the compatibilizing agent were then placed in a mixing chamber for<br />
about 2 minutes at 50 rpm, followed by the addition of the SPF for another 10 min. of mixing.<br />
The resulting material was then compressed in the mould using a Carver laboratory press<br />
with a metal frame size of 150 mm x 150 mm x 1mm at 100 bars and 165°C of temperature.<br />
Thereafter, it was subjected to a process of pre-heating for 5 minutes and full press-heating<br />
for 5 minutes. The processing pressure is 100 kg/cm 2 . This was followed by cooling for 5<br />
minutes using circulated water in a temperature of 20 o C, and the final resulting composite was<br />
formed into sheets. The same technique was also applied for the alkali-treated sugar palm<br />
fibres, with a mixing composition of 40 wt. % alkali-treated fibre and 60 wt. % HIPS matrix.<br />
Thermogravimetric Analysis<br />
Thermogravimetric (TG) analysis is a common method used in understanding the relationship<br />
between the structure-property and thermal stability of composite materials. This testing was<br />
carried out on the specimens to calculate the degradability of weight in relation to change in<br />
the temperature. A TGA/SDTA 851 e Mettler Toledo device was used. The specimens were<br />
observed from 30 to 600 o C at a heating rate of 20 deg. C/min. and the nitrogen gas flow was<br />
50 mL min. The weight of the samples varied from 6 mg to 20 mg.<br />
<strong>Pertanika</strong> J. Sci. & Technol. <strong>21</strong> (1): 283 - 298 (<strong>2013</strong>)<br />
143
D. Bachtiar, S. M. Sapuan, E. S. Zainudin, A. Khalina and K. Z. H. M. Dahlan<br />
RESULTS AND DISCUSSION<br />
The TG analysis of sugar palm fibre, HIPS polymeric matrix, untreated SPF-HIPS composites<br />
and treated SPF-HIPS composites were studied as a function of % weight loss with the increase<br />
in temperature. Fig.1 and Fig.2 show the TG and Derivative TG curves of sugar palm fibre,<br />
neat HIPS and the untreated SPF-HIPS composites, respectively. The degradation level of<br />
sugar palm fibre was almost similar to that of other natural fibres. It was differentiated by<br />
the variability of three main natural fibre components, namely, hemicelluloses, cellulose and<br />
lignin, while sugar palm fibre was subjected to the heating decomposition of each component<br />
that takes place in three steps. The first one was initial weight loss at 56 to 165°C, known<br />
as moisture evaporation and the loss of volatile extractives. Kim et al. (2004) reported that<br />
the initial mass loss took place from 50 to 150°C for natural fibre from rice husk and wood<br />
fibre. Meanwhile, Ishak et al. (2011) found that the range for this step was 45 to 123°C and<br />
Zainudin et al. (2009) stated their findings at 35 to 115°C for banana pseudo-stem fibre. These<br />
differences occurred due to the diversity of water and volatile extractive content in the fibres.<br />
The TG analysis data showed that at 56°C, the initial mass loss was at 99.7% weight and<br />
at 165°C, the weight was 89%. These findings indicated that 10.7% moisture and volatile<br />
extractive content had been removed from the fibre.<br />
The second step was the decomposition of hemicelluloses components at temperature<br />
ranging from 238 to 306°C, and the peak temperature for this phase was 287.4°C. This result<br />
was almost similar to that of Yang et al. (2007) who reported that the temperature ranging<br />
from 220 to 318°C and peak temperature was at 281°C for hemicelluloses component. The<br />
degradation of the cellulose component started from 306°C and ended at 387.4°C, with a peak<br />
temperature of 344.46°C. The lignin degradation was not clearly seen in this curve. Yang et<br />
al. (2007) reported in their work that lignin is tough and the degradation of lignin takes place<br />
from 165°C up to 900°C. It was difficult to show the peak temperature for lignin degradation<br />
because the maximum mass loss rate was less (i.e. about 0.1 %/min.). From this study, it is<br />
worth saying that lignin starts to decompose at about 238°C, whereas hemicelluloses starts to<br />
degrade at 238°C. The degradation of lignin gradually takes place during the heating process<br />
Fig.1: TGA curve of sugar palm fibre, HIPS polymer matrix and SPF-HIPS composites.<br />
144 <strong>Pertanika</strong> J. Sci. & Technol. <strong>21</strong> (1): 283 - 298 (<strong>2013</strong>)
Thermal Properties of Alkali-Treated Sugar Palm Fibre Reinforced High Impact Polystyrene Composites<br />
Fig.2: Derivative TG curve of sugar palm fibre, HIPS polymer matrix, and SPF-HIPS composites.<br />
until the end at 600°C. The degradation of lignin was unidentifiable as an individual peak in<br />
the DTG curve, and this was probably because it had overlapped with the hemicelluloses and<br />
cellulose decomposition (Reed & Williams, 2004).<br />
Thermal decomposition of HIPS matrix takes place in one single stage between 365°C and<br />
500°C, when the polymeric chains break down and evolve into the gaseous phase (see Fig.1<br />
and Fig.2). Almost similar results were also exhibited by other researchers (see Siregar et<br />
al., 2011; Vilaplana et al., 2007; Agung et al., 2011). The peak of thermogram indicating the<br />
temperature of the maximum decomposition rate appears at around 437.86°C. Vilaplana et al.<br />
(2007) studied the degradation of several recycle HIPS polymer. The onset (initial) temperature<br />
of the thermal decomposition has similar values for all the HIPS materials at around 365°C.<br />
Meanwhile, the temperature of the maximum decomposition rate appears at around 430°C for<br />
all the samples (Vilaplana et al., 2007). A summary of all the decomposition stages for sugar<br />
palm fibre, HIPS matrix and the composites is shown in Table 1.<br />
TABLE 1: Decomposition stages of sugar palm fibre, HIPS matrix and untreated SPF-HIPS composites.<br />
Stage Temperature<br />
1<br />
2<br />
3<br />
Sugar Palm Fibre,<br />
in °C<br />
Neat HIPS,<br />
in °C<br />
Initial weight loss, T i 56 - 42<br />
Final weight loss, T f 165 - 146<br />
Temp. at max. degrad., T m 109.3 - 79.5<br />
Initial weight loss, T i 238 - 266.8<br />
Final weight loss, T f 306 - 3<strong>21</strong><br />
Temp. at max. degrad., T m 287.4 - 291<br />
Initial weight loss, T i 306 - 329.97<br />
Final weight loss, T f 387.4 - 387.5<br />
Temp. at max. degrad., T m 344.46 - 356.25<br />
<strong>Pertanika</strong> J. Sci. & Technol. <strong>21</strong> (1): 283 - 298 (<strong>2013</strong>)<br />
Untreated SPF-HIPS<br />
composites (40%wt.),<br />
in °C<br />
145
TABLE 1: (continue)<br />
4<br />
D. Bachtiar, S. M. Sapuan, E. S. Zainudin, A. Khalina and K. Z. H. M. Dahlan<br />
Initial weight loss, T i - 365 405.4<br />
Final weight loss, T f - 500 510<br />
Temp. at max. degrad., T m - 437.86 439.74<br />
The degradation temperatures for the natural fibre reinforced composites usually fall<br />
between the degradation temperatures for the matrix and the fibres (Singha & Thakur, 2008).<br />
The same behaviour is also exhibited by the untreated sugar palm fibre reinforced with high<br />
impact polystyrene composites. It has been observed that for composites that the initial<br />
decomposition temperature is at 42°C and the final decomposition of the composite at 600°C,<br />
indicating that the presence of cellulose fibres does affect the degradation process. The whole<br />
degradation of the untreated composites occurs in four stages. The first stage is the moisture<br />
evaporation which starts at 42°C and ends at 146°C, with the peak temperature at 79.6°C. In<br />
this step, it can be seen that the moisture content was less, as indicated by a tiny peak at DTG<br />
curve. The second stage of weight loss occurred at 266.8°C to 3<strong>21</strong>°C, with the peak of this<br />
transition at 291°C. This step of degradation indicated the decomposition of hemicelluloses<br />
content in the composites. The third step indicated the degradation of cellulose that occurred<br />
from 329.97 to 387.5°C, with the temperature at the maximum degradation at 356.25°C. The<br />
fourth step indicated the degradation of the HIPS polymer part in the composites that occurred<br />
from 405.4 to 510°C and the peak of this transition was observed at 439.74°C. The value is<br />
slightly higher than the peak transition of neat HIPS matrix. Hence, it can be stated that the<br />
thermal stability of SPF-HIPS composites is better than the neat HIPS.<br />
TGA/DTG for the Treated SPF-HIPS Composites<br />
Fig.3 represents the TG analysis of the SPF-HIPS composites after the treatments, while Fig.4<br />
depicts the DTG thermogram. The compatibilizing agent and alkali-treated SPF fibre on the<br />
composites slightly influence the characteristics of the thermal degradation of the composites.<br />
For 2% MA-g-PS and 3% MA-g-PS composites, the degradation occurs in three stages,<br />
as also shown by the degradation of the untreated composites. The first stage is believed to be<br />
the decomposition of the hemicellulose component, with an initial decomposition temperature<br />
at 260°C and the final temperature at 320°C, while the peak of transition occurs at 291°C. The<br />
second stage is the decomposition of cellulose component ranging from 331°C to 417°C, and<br />
the peak was observed at about 359.38°C and 359.46°C for 2%MA-g-PS and 3%MA-g-PS<br />
composites, respectively. The last stage is the degradation of HIPS polymer in the composites<br />
that occurs initially at 416°C to 500°C, and the peak of transition temperature occurs at about<br />
444°C. Meanwhile, at the peak temperature transition for the untreated composites (439°C),<br />
it was clearly seen that the TG curve of the compatibilizing agent modified composites was<br />
higher as compared to the untreated composites.<br />
The compatibilizer was found to improve the thermal resistance of the composites due to<br />
the good interaction between the natural fibre and the polymer matrix that was caused by the<br />
formation of a covalent bond at the interface (Doan et al., 2007).<br />
146 <strong>Pertanika</strong> J. Sci. & Technol. <strong>21</strong> (1): 283 - 298 (<strong>2013</strong>)
Thermal Properties of Alkali-Treated Sugar Palm Fibre Reinforced High Impact Polystyrene Composites<br />
Fig.3: The TG analyses of the untreated and treated SPF-HIPS composites<br />
Fig.4: The DTG curve of the untreated and treated SPF-HIPS composites<br />
The TG and DTG thermograms of the thermal decomposition treated fibre composites,<br />
with 4% and 6% of NaOH, showed different curves as compared to the TG and DTG curves<br />
of the untreated and compatibilizing agent treated composites. Only two stages appeared in<br />
the DTG curve during the degradation of the composites process. In general, this treatment<br />
removed natural and artificial impurities, produced a rough surface topography and made<br />
fibre fibrillation (Alawar et al., 2009). Moreover, the alkali treatment changes the structure<br />
of the fibres, removes weak amorphous components (hemicellulose and lignin) so that the<br />
<strong>Pertanika</strong> J. Sci. & Technol. <strong>21</strong> (1): 283 - 298 (<strong>2013</strong>)<br />
147
D. Bachtiar, S. M. Sapuan, E. S. Zainudin, A. Khalina and K. Z. H. M. Dahlan<br />
fibre retains crystalline components (cellulose) (Reddy et al., 2012). It was believed that<br />
the structure change in the sugar palm interior due to the DTG curve exhibits the single step<br />
for degradation of hemicellulose and cellulose components. The initial degradation of this<br />
transition was at about 261°C to the final transition temperature at about 360°C, and the peak<br />
transition temperature occurred at about 311°C. It showed a lower value than the peak transition<br />
temperature of the untreated and Ma-g-PS treated composites for the degradation of cellulose<br />
component. Otherwise, the peak transition temperature in the next step is for the HIPS matrix<br />
component in the composites which shows an almost similar value to the Ma-g-PS treated<br />
composites which was about 442°C. However, all the peak transition temperatures of the<br />
treated composites at the degradation step of the HIPS component in the composites show a<br />
higher value than the untreated composites. It was worth noting that the thermal stability of the<br />
treated composites with alkali and compatibilizing agent was higher than that of the untreated<br />
composites. The degree of thermal stability was also exhibited by the residue that remained<br />
after the heating process. Table 2 represents the percentage weight of the sample at several<br />
temperature processes. Meanwhile, Table 3 represents the residue content of the samples at<br />
600°C. On each temperature, it can be seen that the percentage weight of the treated samples<br />
has higher values than those of the untreated composites.<br />
TABLE 2: Weight percentage of the samples at various temperatures<br />
Samples 200 0 C (%wt.) 300 0 C (%wt.) 400 0 C (%wt.) 500 0 C (%wt.)<br />
Untreated composites 96.2 90.5 71.6 15.3<br />
2%MA-g-PS composites 97.09 92.2 75.1 15.8<br />
3%MA-g-PS composites 97.37 93.2 78 13.8<br />
4%NaOH composites 97.26 92 80.5 14.6<br />
6%NaOH composites 97.15 92.4 81.9 12.52<br />
TABLE 3: Residue of the samples as the TG analysis results<br />
Samples Residue at 600°C (% wt.)<br />
Sugar Palm Fibre 14.4<br />
Neat HIPS matrix 0.39<br />
Untreated composites (40%wt.SPF) 11.27<br />
2% MA-g-PS composites 13.89<br />
3% MA-g-PS composites 12.48<br />
4% NaOH composites 13.73<br />
6% NaOH composites 11.82<br />
148 <strong>Pertanika</strong> J. Sci. & Technol. <strong>21</strong> (1): 283 - 298 (<strong>2013</strong>)
Thermal Properties of Alkali-Treated Sugar Palm Fibre Reinforced High Impact Polystyrene Composites<br />
CONCLUSION<br />
The effects of alkaline treatment and compatibilizing agent on the thermal degradation of sugar<br />
palm fibre reinforced high impact polystyrene composites were studied in the current work.<br />
The modification of the SPF-HIPS composites, using the compatibilizing agent with different<br />
weight concentrations of polystyrene-block-poly(ethylene-ran-butylene)-blockpoly(styrenegraft-maleic<br />
anhydride) and the fibres treated with alkali, has brought a slight improvement to<br />
the peak temperature of decomposition of composites. It can be stated that the addition of sugar<br />
palm fibre and the modification of the composites with alkaline treatment and compatibilizing<br />
agent on the high impact polystyrene composites resulted in a higher thermal stability of the<br />
composites than the high impact polystyrene polymer alone.<br />
ACKNOWLEDGEMENTS<br />
The authors wish to express their thanks to the Ministry of Agriculture and Agro-Based Industry,<br />
Malaysia, for funding the research through the Science Fund Agriculture grant number 05-01-<br />
04SF1114. The authors would also like to thank <strong>Universiti</strong> <strong>Putra</strong> Malaysia for the financial<br />
assistance through the Graduate Research Fellowship for the principal author. Special thanks<br />
also go to Mr. Ahmed Ali for proof reading the manuscript.<br />
REFERENCES<br />
Agung, E. H., Sapuan, S. M., Hamdan, M. M., Zaman, H. M. D. K., & Mustofa, U. (2011). Study on abaca<br />
(Musa textilis Nee) fibre reinforced high impact polystyrene (HIPS) composites by thermogravimetric<br />
analysis (TGA). International <strong>Journal</strong> of the Physical Sciences, 6(8), <strong>21</strong>00-<strong>21</strong>06.<br />
Alawar, A., Hamed, A. M., & Al-Kaabi, K. (2009). Characterization of treated palm tree fibre as<br />
composites reinforcement. Composites: Part B, 40, 601-606.<br />
Bachtiar, D., Sapuan, S. M., Zainudin, E. S., Khalina, A., & Dahlan, K. Z. H. M. (2011). Effects of<br />
alkaline treatment and compatibilizing agent on tensile properties of sugar palm fibre reinforced high<br />
impact polystyrene composites. Bioresources, 6(4), 4815-4823.<br />
Bledzki, A. K., & Gassan, J. (1999). Composites reinforced with cellulose based fibres. Progress in<br />
Polymer Science, 24(2), 2<strong>21</strong>-274.<br />
Bledzki, A. K., Mamun, A. A., & Faruk, O. (2007). Abaca fibre reinforced PP composites and comparison<br />
with jute and flax fibre PP composites. eXPRESS Polymer Letter, 1, 755-762.<br />
Doan, T. T. L., Brodowsky, H., & Mader, E. (2007). Jute fibre/polypropylene composites II. Thermal<br />
hydrothermal and dynamic mechanical behaviour. Composites Science and Technology, 67, 2707-2714.<br />
George, J., Sreekala, M. S., & Thomas, S. (2001). A review on interface modification and characterization<br />
of natural fibre reinforced plastic composites. Polymer Engineering & Science, 41(9), 1471-1485.<br />
Ishak, M. R., Sapuan, S. M., Leman, Z., Rahman, M. Z. A., & Azwar, U. M. K. (2011) Characterization<br />
of sugar palm (Arenga pinnata) fibres: tensile and thermal properties. <strong>Journal</strong> of Thermal Analysis<br />
and Calorimetry, DOI 10.1007/s10973-011-1785-1.<br />
Joffe, R., & Andersons, J. (2008). Mechanical performance of thermoplastic matrix natural-fibre<br />
composites. In Kim, & L. Pickering (Eds.), Properties and performance of natural-fibre composites<br />
(p. 402-459). England: Woodhead Publishing Limited.<br />
<strong>Pertanika</strong> J. Sci. & Technol. <strong>21</strong> (1): 283 - 298 (<strong>2013</strong>)<br />
149
D. Bachtiar, S. M. Sapuan, E. S. Zainudin, A. Khalina and K. Z. H. M. Dahlan<br />
John, M. J., & Thomas, S. (2008). Biofibres and biocomposites. Carbohydrate Polymers, 71(3), 343-364.<br />
Joseph, P. V., Joseph, K., Thomas, S., Pillai, C. K. S., Prasad, V. S., Groeninckx, G., & Sarkissova, M.<br />
(2003). The thermal and crystallization studies of short sisal fibre reinforced polypropylene composites.<br />
Composites Part A: Applied Science and Manufacturing, 34(3), 253.<br />
Kim, H. S., Yang, H. S., Kim, H. J., & Park, H. J. (2004). Thermogravimetric analysis of rice husk<br />
flour filled thermoplastic polymer composites. <strong>Journal</strong> of Thermal Analysis and Calorimetry, 76(2),<br />
395-404.<br />
Li, X., Tabil, L. G., & Panighari, S. (2007). Chemical treatments of natural fibre for use in natural fibrereinforced<br />
composites: a review. <strong>Journal</strong> of Polymer and Environment, 15, 25–33.<br />
Malkapuram, R., Kumar, V., & Negi, Y. S. (2009). Recent development in natural fibre reinforced<br />
polypropylene composites. J. Reinforced Plastic and Composites, 28, 1169-1189.<br />
Reed, A. R., & Williams, P. T. (2004) Thermal processing of biomass natural fibre wastes by pyrolysis.<br />
International <strong>Journal</strong> of Energy Research, 28, 131-145.<br />
Reddy, K. O., Maheswari, C. U., Shukla, M., & Rajulu, A. V. (2012) Chemical composition and structural<br />
characterization of Napier grass fibres. Materials Letters, 67, 35–38.<br />
Singha, A. S., & Thakur, V. K. (2008) Mechanical properties of natural fibre reinforced polymer<br />
composites. Bulletin of Materials Science, 31(5), 791-799.<br />
Siregar, J. P., Sapuan, S. M., Rahman, M. Z. A., & Dahlan, K. Z. H. M. (2011) Thermogravimetric<br />
analysis (TGA) and differential scanning calorimetric (DSC) analysis of pineapple leaf fibre (PALF)<br />
reinforced high impact polystyrene (HIPS) composites. <strong>Pertanika</strong> <strong>Journal</strong> Science & Technology,<br />
19(1), 161-170.<br />
Vilaplana, F., Ribes-Greus, A., & Karlsson, S. (2007) Analytical strategies for the quality assessment of<br />
recycled high-impact polystyrene: A combination of thermal analysis, vibrational spectroscopy, and<br />
chromatography. Analytica Chimica Acta, 604(1), 18-28.<br />
Yang, H., Yan, R., Chen, H., Dong, H. L., & Zheng, C. (2007) Characteristics of hemicellulose, cellulose<br />
and lignin pyrolysis. Fuel, 86, 1781–1788.<br />
Zainudin, E. S., Sapuan, S. M., Abdan, K., & Mohamad, M. T. M. (2009). Thermal degradation of banana<br />
pseudo-stem filled unplasticized polyvinyl chloride (UPVC) composites. Materials & Design, 30(3),<br />
557-562.<br />
150 <strong>Pertanika</strong> J. Sci. & Technol. <strong>21</strong> (1): 283 - 298 (<strong>2013</strong>)
ISSN: 0128-7680 © <strong>2013</strong> <strong>Universiti</strong> <strong>Putra</strong> Malaysia Press.<br />
<strong>Pertanika</strong> J. Sci. & Technol. <strong>21</strong> (1): 151 - 160 (<strong>2013</strong>)<br />
SCIENCE & TECHNOLOGY<br />
<strong>Journal</strong> homepage: http://www.pertanika.upm.edu.my/<br />
FTIR and TGA Analysis of Biodegradable Poly(Lactic Acid)/<br />
Treated Kenaf Bast Fibre: Effect of Plasticizers<br />
N. Maizatul 1 *, I. Norazowa 2 , W. M. Z. W. Yunus 3 , A. Khalina 2 and K. Khalisanni 4<br />
1 Department of Polymer Engineering, School of Materials Engineering, <strong>Universiti</strong> Malaysia Perlis, 02600<br />
Jejawi, Perlis, Malaysia<br />
2 Laboratory of Biocomposites Technology, Institute of Tropical Forestry and Forest Product, <strong>Universiti</strong><br />
<strong>Putra</strong> Malaysia, 43400 Serdang, Malaysia<br />
3 Department of Chemistry, Faculty of Science, <strong>Universiti</strong> <strong>Putra</strong> Malaysia, 43400 Serdang, Selangor,<br />
Malaysia<br />
4 Department of Chemistry, Faculty of Science, University of Malaya, 50603, Kuala Lumpur, Malaysia<br />
ABSTRACT<br />
A biodegradable composite (PLA/KBF blends) was prepared using melt blending technique in a brabender<br />
mixer and characterized with FTIR and TGA analyzer. Five percent of triacetin and glycerol contents<br />
were used as plasticizers to plasticise PLA matrix. KBF was treated with 4% NaOH solution, while 30<br />
wt% of fibre loading was used constantly for all the composite samples. From the FTIR analysis, the<br />
additions of triacetin and glycerol to PLA composites did not produce any significant difference, and there<br />
were no chemical changes in both the plasticized PLA with the treated and untreated KBF, respectively.<br />
Observation done on the TGA analysis revealed that both plasticizers did improve the thermal stability<br />
of the composites, and this might be due to the modification on the fibre surfaces, which further led to<br />
the delay in the degradation of the PLA matrix and to significant stabilization effect.<br />
Keywords: Polylactic acid, kenaf bast fibre, triacetin, glycerol, TGA, FTIR analysis<br />
Article history:<br />
Received: 4 August 2011<br />
Accepted: 13 <strong>Jan</strong>uary 2012<br />
E-mail addresses:<br />
maizatulnisa@unimap.edu.my (N. Maizatul),<br />
norazowa@science.upm.edu.my (I. Norazowa),<br />
wanzin@science.upm.edu.my (W. M. Z. W. Yunus),<br />
khalina@eng.upm.edu.my (A. Khalina),<br />
k.khalid@um.edu.my (K. Khalisanni)<br />
*Corresponding Author<br />
INTRODUCTION<br />
In the recent years, attention has been focused<br />
on the development of technologies that utilise<br />
composite materials. However, combining<br />
biofibers with a biodegradable and renewable<br />
resource-based polymer offers additional<br />
sustainability benefits. Kenaf bast fibre<br />
(KBF) (Nina et al., 2009) has received<br />
considerable interest as an environmentalfriendly<br />
alternative to glass fibre in polymer
N. Maizatul, I. Norazowa, W. M. Z. W. Yunus, A. Khalina and K. Khalisanni<br />
composites for excellent mechanical properties, especially when low density and price are<br />
taken into account. Undeniably, it has high strength and modulus to weight ratio, as well as<br />
fatigue and corrosion resistance (Islam et al., 2010). Hence, great attention has been given to<br />
KBF composites, such as KBF reinforced poly(lactic acid) (PLA) composites, in which the<br />
effects of triacetin (Mingkang et al., 2010; Yijun et al., 2007) and glycerol (Caroline et al.,<br />
2009) were studied.<br />
Triacetin is a renewable resource-based plasticizer compared to glycerol which is a multiple<br />
plasticizer. These plasticizers are extensively used in the polymer industry and research has<br />
shown that they have the potential to improve the properties of PLA (Caroline et al., 2010;<br />
Lima et al., 2008; Oksman et al., 2003). The use of triacetine to plasticize PLA has successfully<br />
been found to lower the melting point (Tm) and glass transition (Tg) temperature by 10°C<br />
at 25 wt%, after which phase separation occurred and the melting temperature increased. In<br />
this phenomenon, triacetine-plasticized PLA films underwent crystallization, and plasticizer<br />
molecules migrated towards the surface with storage time due to their low molecular weight<br />
resulting in improvement of the elastic properties at the cost of tensile strength (Rahul et al.,<br />
2010) and high percentage of nominal strain at break (Marius et al., 2008).<br />
In contrast, glycerol is nearly and systematically incorporated in most of the hydrocolloid<br />
films because it lowers Tg and Tm and increases elongation at break (Maharana et al., 2009).<br />
It is indeed a highly hygroscopic molecule that is generally added to film-forming solutions<br />
to prevent film brittleness. However, as a compromise between film mechanical resistance<br />
and flexibility to maintain low solubility and swelling in water, the use of 5–10% glycerol in<br />
the finishing cross-linking step was recommended. Concentrations lower than 3% glycerol<br />
produced brittle films, while phase separation was observed on the film surface when<br />
concentrations higher than 12% glycerol were used (Melissa et al., 2011).<br />
In this study, treated KBF was combined with PLA and impact modifier (plasticizers), a<br />
bio-based plastic which is commercially available. These renewable materials can be referred<br />
to as biocomposites due to their superior sustainability profile from the perspective of Industrial<br />
Ecology, such as calculated using the tools of life cycle analysis (Harding et al., 2007; Martin<br />
et al., 2007). Thus, the objective of this study was to determine the effects of triacetin and<br />
glycerol on treated KBF reinforced poly(lactic acid) composites.<br />
MATERIALS AND METHODS<br />
Long KBF, with the V36 variety, was obtained from Lembaga Kenaf - Tembakau Negara<br />
(LTN) in Kelantan. Meanwhile, the Kenaf stem was chipped before flaking to reduce the size<br />
of the kenaf fibre. The KBF used in this study was ground to 75-150µm. After that, the KBF<br />
was dried in an oven at 60ºC to a constant weight. This lignocellulosic fibre consists of 65%<br />
cellulose and 19% lignin. Triacetin and glycerol (1.158g/cm 3 and 1.262g/cm 3 , respectively)<br />
were purchased from Sigma Aldrich Chemie GmbH, Steinheim, Germany. Meanwhile,<br />
sodium hydroxide pellet grade UN 1823 Pro Analysis consisting of 40g/mol was obtained<br />
from MERCK, Germany.<br />
Poly(lactic acid) (PLA) (NatureWorks TM PLA 4060D) in the pellet form was obtained from<br />
Natureworks ® LLC, Minnetonka, Minnesota. It is important to note that PLA has a specific<br />
152 <strong>Pertanika</strong> J. Sci. & Technol. <strong>21</strong> (1): 283 - 298 (<strong>2013</strong>)
FTIR and TGA Analysis of Biodegradable Poly(Lactic Acid)/Treated Kenaf Bast Fibre: Effect of Plasticizers<br />
gravity of 1.25 and a melt flow index of around 15 g/10 min (190°C/2.16 Kg). Its Tg is 52°C<br />
and the melting temperature is 135°C, while its density is 1.24g/cm 3 .<br />
Preparation of the Kenaf Treatment<br />
The concentrations of NaOH used were 2, 4, 6 and 8%, respectively. All the solutions of<br />
sodium hydroxide (NaOH) were prepared using the pellets of NaOH in deionised water and<br />
a stirrer. The fibres were then placed in these solutions for 3 hours at 25ºC. Later, the fibres<br />
were washed with distilled water until all the alkali was removed from their surface. After<br />
that, the fibres were tested for neutralisation using pH paper to confirm that there was no more<br />
alkalinity occurrence. The filter paper was placed under a sieve to avoid the fibres from leaking<br />
and being flushed out. After washing, the KBF was dried in air (ambient temperature) for two<br />
days. Next, the treated fibres were left to dry in an oven at 60°C for 24 hours.<br />
Preparation of the PLA/Treated KBF with Triacetin and Glycerol<br />
Prior to blending, the polymer and fibres were kept in an oven at 60˚C for 24h. PLA was<br />
premixed with several percentages of triacetin and glycerol, respectively, before they were<br />
mixed with 30 wt% of the treated KBF content. These mixtures were prepared using the<br />
Brabender internal mixer at 170˚C for 10 min at 50rpm. Pure PP was also processed in the<br />
same way to obtain a reference material. The blended materials were processed using a hot<br />
press to produce sheets of about 1mm thickness. The moulding process was carried out at the<br />
moulding temperature of 150˚C, with a 15 minute-preheat time and a pressing at full pressure<br />
for 5 minutes, followed by 8 minutes of cooling time at 827.37 kPa.<br />
TABLE 1: The compositions at different triacetin and glycerol contents<br />
Fourier Transform Infrared Spectroscopy (FTIR)<br />
The Fourier Transform Infra Red (FTIR) spectroscopy was carried out using the Perkin Elmer<br />
Model 1750x FT-IR spectrometer and KBr method. The transmission of the infrared spectra<br />
was obtained in the range between 400 cm -1 to 4000 cm -1 at room temperature. The difference<br />
between the FTIR spectra was studied to find any new form of bond or interaction.<br />
<strong>Pertanika</strong> J. Sci. & Technol. <strong>21</strong> (1): 283 - 298 (<strong>2013</strong>)<br />
153
N. Maizatul, I. Norazowa, W. M. Z. W. Yunus, A. Khalina and K. Khalisanni<br />
Thermogravimetric Analysis (TGA)<br />
The thermo-stability property of the composite prepared was analysed using the Mettler Toledo<br />
TGA/SDTA 851º thermogravimetry analyser. About 10mg of the sample was used for the<br />
analysis and was heated from -50ºC to 500ºC at the rate of 10ºC/min, using about 20-25mg<br />
of the samples with a nitrogen gas flow rate of 50mL/min. The weight and percentage of the<br />
residue were recorded to determine the weight losses of the sample after heating.<br />
RESULTS AND DISCUSSIONS<br />
Characterization Analysis<br />
The infrared spectra for the treated KBF, untreated KBF, plasticized PLA (triacetin), with treated<br />
and untreated KBF, are presented in Fig.1, while the results for the treated KBF reinforced<br />
plasticized PLA with triacetin (tri) and glycerol (gly) obtained using an FTIR spectrometer<br />
are shown in Fig.2.<br />
In the alkali treatment process, the presence of Na + in fibre changes the hydrophilic to<br />
the hydrophobic fibre properties. Fig.1 shows peak at 3350 cm -1 for the untreated and treated<br />
KBF, indicating the presence of hydroxyl group. A large band at 3500-3000 cm -1 and a small<br />
absorption at 2950 cm -1 are mainly related to the hydroxyl groups and the bonded O-H stretching<br />
vibration present in carbohydrate (Bilba et al., 2007). Meanwhile, the decreased intensity<br />
of the OH peak at 3350 cm -1 on the treated KBF compared to the untreated KBF could be<br />
clearly seen, which was assigned to the hydroxyl group and reduced due to the removal of the<br />
hemicellulose component (Ghazanfari et al., 2008). However, there were no chemical changes<br />
in both the plasticized PLA with the treated and untreated KBF, respectively.<br />
As depicted in Fig.2, both the plasticized PLA with the treated KBF samples showed that<br />
the characteristics of asorption of hydroxyl group around 3500-3200 cm -1 were reduced due<br />
to the removal of the hemicellulose component. Due to the alcohol group of cellulose OH<br />
deformation, another peak appeared at 1310 cm -1 , and this was also observed to have been<br />
decreased by the alkaline treatment.<br />
The peaks located at 3000-2800 cm -1 were attributed to the CH group and this band had<br />
a higher absorption of the plasticized PLA composites with the treatment as compared to the<br />
untreated spectrum, which was rather expected since the PLA led to -CH 2- and –CH group<br />
formation (Ogata et al., 1997). As for the plasticized PLA composites with the untreated and<br />
treated samples, all the samples showed the absorption band of carbonyl stretching at 1700cm -<br />
1 , which corresponded to the hemicelluloses, and this absorption seemed to be smaller for the<br />
treated KBF composite samples as compared to the untreated KBF composite samples. The<br />
asorption band in the range of 1600-1400 cm -1 region in all the composite spectra might be<br />
attributed to the presence of aromatic or benzene ring in lignin, whereas the aliphatic or aromatic<br />
(C-H) in plane deformation vibration of methyl and methoxy groups in fibres could be seen<br />
near 1400-1300 cm -1 . The research by Mubarak et al. (1993) suggested that the band in the<br />
region of 1300-1000 cm -1 represented the C-O stretching vibration of aliphatic primary and<br />
secondary alcohols in cellulose, hemicelluloses, lignin and primary and secondary aromatic<br />
alcohols in lignin. It was observed that there was no absorption peak at 1245 cm -1 for the treated<br />
154 <strong>Pertanika</strong> J. Sci. & Technol. <strong>21</strong> (1): 283 - 298 (<strong>2013</strong>)
FTIR and TGA Analysis of Biodegradable Poly(Lactic Acid)/Treated Kenaf Bast Fibre: Effect of Plasticizers<br />
Fig.1: IR spectra for the treated KBF, untreated KBF, and plasticized PLA (tri), with treated and<br />
untreated KBF<br />
Fig.2: IR spectra of treated KBF reinforced plasticized PLA with Triacetin (tri) and glycerol (gly)<br />
KBF for both types of plasticized PLA composite samples. This happened in the process of<br />
the surface modification as the alkaline removed the waxy epidermis tissue, adhesive pectins<br />
and hemicelluloses, which bound the fibre bundles together. The C-O-C symmetry glycocidic,<br />
stretched at 1100 cm -1 , arose from the polysaccharide components that were largely cellulose,<br />
and the asorption band widely appeared for the untreated and treated fibre composite systems<br />
as compared to the PLA single system.<br />
Thermal Stability Analysis<br />
One of the advantages of the surface modification treatment of KBF is that it makes KBF<br />
hydrophobic instead of hydrophilic. Polypropylene (PP) acts as reference to the modified<br />
composites. The thermograms depicted in Fig.3 and Fig.4 show only about 2% weight loss at<br />
<strong>Pertanika</strong> J. Sci. & Technol. <strong>21</strong> (1): 283 - 298 (<strong>2013</strong>)<br />
155
N. Maizatul, I. Norazowa, W. M. Z. W. Yunus, A. Khalina and K. Khalisanni<br />
the temperature below 100°C, indicating that there was less water absorbed in the plasticized<br />
PLA (tri)/ treated KBF and plasticized PLA (gly)/treated KBF composite samples as compared<br />
to the plasticized PLA/untreated KBF composite sample and pure PLA. Meanwhile, Fig.3<br />
shows the degradation of plasticized PLA with the untreated KBF that occurred between 250°C<br />
and 300°C, whereas the degradation of plasticized PLA (tri) with the treated KBF occurred<br />
between 350°C and 450°C, leading to a weight loss of 85.5%. The PP sample was used as a<br />
reference to the modified composites. The degradation temperature of PP was about at 360ºC.<br />
The plasticized PLA, with the treated KBF, provided a higher decomposition temperature<br />
as the addition of the plasticizer had improved the adhesion between the PLA and fibres and<br />
prevented the migration and leaching of the plasticizer molecules from the PLA matrix at the<br />
same time. This finding is similar to that of Murariu et al. (2007), who also found that the<br />
decomposition temperature was increased by adding plasticizer to PLA.<br />
The differential gravimetric analysis (DTG curve) indicated that there were<br />
decomposition peaks for the plasticized PLA treated KBF with triacetin and glycerol. The<br />
first decomposition peak, i.e. at about 300°C to 430°C, is due to thermal depolymerisation of<br />
hemicelluloses and the glycosidic linkages of cellulose, as well as α-cellulose decomposition.<br />
Lignin degraded first and at a slower rate than other constituents. The second peak occurred at<br />
about 450°C, it might also be due to the late degradation of the plasticized PLA with glycerol.<br />
The area under the peak at 270°C for the plasticized PLA with the untreated KBF was<br />
found to be greater than both types of the plasticized PLA with the treated KBF. A possible<br />
explanation for this is that because of the treatment, which is, part of the lignin was removed<br />
from the fibre (Claudia et al., 2004). Hence, this caused a better adhesion between PLA and<br />
the treated KBF, and thus influenced the decomposition temperature.<br />
As shown in Fig.4, the thermal stability of the plasticized PLA/ treated KBF with triacetin<br />
and glycerol also improved as compared to that of the pure PLA. The increase in the thermal<br />
stability in the plasticized PLA with the treated KBF might be due to the modification done<br />
on the fibre surfaces, which delayed the degradation of the PLA matrix and to significant<br />
stabilization effect.<br />
This can be quite well-distinguished in the interval of temperature 340-420°C in Fig.4.<br />
The thermogravimetry analysis (TGA) in Fig.4 showed that the weight loss was due to the<br />
volatilization of the plasticizers, and the degradation of the materials monitored as a function<br />
of temperature. As compared to pure PP, the thermal stability of both types of plasticized PLA/<br />
treated KBF increased dramatically. The additions of 5% glycerol and triacetin to PLA and<br />
the treated KBF were found to have shifted the thermal stability of the composites.<br />
CONCLUSION<br />
The FTIR analysis of the plasticized PLA composites with the untreated and treated samples<br />
showed the absorption band of carbonyl stretching at 1700cm -1 , which corresponded to the<br />
hemicelluloses, and this absorption seemed to be smaller for the treated KBF composite samples<br />
as compared to the untreated KBF composite samples. Meanwhile, the additions of triacetin<br />
and glycerol to the PLA composites did not produce any significant different, and there were no<br />
chemical changes in both the plasticized PLA with the treated and untreated KBF, respectively<br />
156 <strong>Pertanika</strong> J. Sci. & Technol. <strong>21</strong> (1): 283 - 298 (<strong>2013</strong>)
FTIR and TGA Analysis of Biodegradable Poly(Lactic Acid)/Treated Kenaf Bast Fibre: Effect of Plasticizers<br />
Fig.3: The DTG curves of PP, PLA, plasticized PLA/untreated KBF, and plasticized PLA/treated KBF<br />
with triacetin and glycerol<br />
Fig.4: The TGA curves of PP, PLA, plasticized PLA/untreated KBF, and plasticized PLA/treated KBF<br />
with triacetin (tri) and glycerol (gly)<br />
Based on the thermogravimetry analysis, an increment was observed in the thermal<br />
stability for both the samples of plasticized PLA composites and this was due to the fibre<br />
treatment, which further led to the delay in the degradation of the PLA matrix and to significant<br />
stabilization effect of the composites.<br />
ACKNOWLEDGEMENTS<br />
The authors would like to acknowledge the Ministry of Science, Technology and Innovation<br />
(MOSTI), Malaysia, UPM and UNIMAP for providing the research grant and facilities for<br />
the current study.<br />
<strong>Pertanika</strong> J. Sci. & Technol. <strong>21</strong> (1): 283 - 298 (<strong>2013</strong>)<br />
157
REFERENCES<br />
N. Maizatul, I. Norazowa, W. M. Z. W. Yunus, A. Khalina and K. Khalisanni<br />
Bilba, K., Arseme, M. A., & Ouensanga, A. (2007). Study of banana and coconut fibers: botanical<br />
composition, thermal degradation and textural observation. Bioresources Technol, 98(1), 58-68.<br />
Caroline, A., Rosemary, A., Carvalho, C., & Grosso, R. F. (2009). Effect of hydrophobic plasticizers on<br />
functional properties of gelatin-based films. Food Research International, 42, 1113–11<strong>21</strong>.<br />
Caroline, A., Rosemary, A., Carvalho, C., & Grosso, R. F. (2010). Gelatin-based films containing<br />
hydrophobic plasticizers and saponin from Yucca schidigera as the surfactant. Food Research<br />
International, 43, 1710–1718.<br />
Claudia, V., Jose, M.K., Analia, V., & Vivian, P. C. (2004). Effect of chemical treatment of starch-based<br />
blends reinforced with sisal fiber. <strong>Journal</strong> Composite Materials, 38, 1387-1392.<br />
Ghazanfari, A., Emami, S., Panigrahi, S., & Tabil, L. G. (2008). Thermal and mechanical properties<br />
of blends and composites from HDPE and date pits particles. <strong>Journal</strong> of Composites Materials, 42,<br />
3452-3459.<br />
Harding, K. G., Dennis, J. S., Blottnitz, H. V., & Harrison, S. T. L. (2007). Environmental analysis of<br />
plastic production processes: Comparing petroleum-based polypropylene and polyethylene with<br />
biologically-based poly-hydroxybutyric acid using life cycle analysis. <strong>Journal</strong> of Biotechnology,<br />
130, 57–66.<br />
Islam, M. S., Pickering, K. L., & Foreman, N. J. (2010). Influence of accelerated ageing on the physicomechanical<br />
properties of alkali-treated industrial hemp fibre reinforced poly(lactic acid) (PLA)<br />
composites. Polymer Degradation and Stability, 95, 59-65.<br />
Lima, L. -T., Auras, R., & Rubino, M. (2008). Processing technologies for poly(lactic acid). Progress<br />
in Polymer Science, 33, 820–852.<br />
Maharana, T., Mohanty, B., & Negi, Y. S. (2009). Melt–solid polycondensation of lactic acid and its<br />
biodegradability. Progress in Polymer Science, 34, 99–124.<br />
Marius, M., Amália, D. S. F., Miroslaw, P., Leila, B., Michaël, A., & Philippe, D. (2008). Polylactide<br />
(PLA)–CaSO 4 composites toughened with low molecular weight and polymeric ester-like plasticizers<br />
and related performances. European Polymer <strong>Journal</strong>, 44, 3842–3852.<br />
Martin, W., Martin, P., Hermann, H., & Stefan, B. (2007). Applying distance-to-target weighing<br />
methodology to evaluate the environmental performance of bio-based energy, fuels, and materials.<br />
Resources, Conservation and Recycling, 50, 260–281.<br />
Melissa, G. A. V., Mariana, A. D. S., Lucielen, O. D. S., & Marisa, M. B. (2011). Natural-based plasticizers<br />
and biopolymer films: A review. European Polymer <strong>Journal</strong>, 47, 254–263.<br />
Mingkang, J., Shaoyang, L., Xin, D., & Yifen, W. (2010). Physical properties and internal microstructures<br />
of films made from catfish skin gelatin and triacetin mixtures. Food Hydrocolloids, 24, 105–110.<br />
Mubarak, A. K., Idris, A. K., & Basu, S. C. (1993). IR Studies of wood plastic composites. <strong>Journal</strong> of<br />
Applied Polymer Science, 49, 1547-1551.<br />
Murariu, M., Da Silva, F. A., Degee, P. H., Alexandre, M., & Dubois, P. H. (2007). Polylactide<br />
compositions, Part I: Effect of filler content and size on mechanical properties of PLA/calcium sulphate<br />
composites. <strong>Journal</strong> Polymer, 48, 2613-2618.<br />
158 <strong>Pertanika</strong> J. Sci. & Technol. <strong>21</strong> (1): 283 - 298 (<strong>2013</strong>)
FTIR and TGA Analysis of Biodegradable Poly(Lactic Acid)/Treated Kenaf Bast Fibre: Effect of Plasticizers<br />
Nina, G., Axel, S. H., & Jörg, M. (2009). Natural and man-made cellulose fibre-reinforced poly(lactic<br />
acid) (PLA) composites: An overview about mechanical characteristics and application areas.<br />
Composites: Part A, 40, 810–8<strong>21</strong>.<br />
Ogata, N., Jimenez, G., Kawai, H., & Ogihara, T. J. (1997). Structure and thermal/<br />
mechanical properties of poly(l-lactide)-clay blend. <strong>Journal</strong> of Applied Polymer<br />
Science, 12, 584-590.<br />
Oksman, K., Skrifvars, M., & Selin, J. -F. (2003). Natural fibres as reinforcement<br />
in polylactic acid (PLA) composites. Composites Science and Technology, 63,<br />
1317–1324.<br />
Rahul, M. R., Amol, V. J., & Douglas, E. H. (2010). Poly(lactic acid) modifications.<br />
Progress in Polymer Science, 35, 338–356.<br />
Yijun, L., Edgar, L., James, G., Goodwin, Jr., & Changqing, Lu. (2007).<br />
Transesterification of triacetin using solid Brønsted bases. <strong>Journal</strong> of Catalysis,<br />
246, 428–433.<br />
<strong>Pertanika</strong> J. Sci. & Technol. <strong>21</strong> (1): 283 - 298 (<strong>2013</strong>)<br />
159
ISSN: 0128-7680 © <strong>2013</strong> <strong>Universiti</strong> <strong>Putra</strong> Malaysia Press.<br />
<strong>Pertanika</strong> J. Sci. & Technol. <strong>21</strong> (1): 161 - 168 (<strong>2013</strong>)<br />
SCIENCE & TECHNOLOGY<br />
<strong>Journal</strong> homepage: http://www.pertanika.upm.edu.my/<br />
Content-based Image Retrieval Using Colour and Shape Fused<br />
Features<br />
Mas Rina Mustaffa*, Fatimah Ahmad, Ramlan Mahmod and Shyamala<br />
Doraisamy<br />
Department of Multimedia, Faculty of Computer Science and Information Technology, <strong>Universiti</strong> <strong>Putra</strong><br />
Malaysia, 43400 Serdang, Selangor, Malaysia<br />
ABSTRACT<br />
Multi-feature methods are able to contribute to a more effective method compared to single-feature<br />
methods since feature fusion methods will be able to close the gap that exists in the single-feature<br />
methods. This paper presents a feature fusion method, which focuses on extracting colour and shape<br />
features for content-based image retrieval (CBIR). The colour feature is extracted based on the proposed<br />
Multi-resolution Joint Auto Correlograms (MJAC), while the shape information is obtained through the<br />
proposed Extended Generalised Ridgelet-Fourier (EGRF). These features are fused together through<br />
a proposed integrated scheme. The feature fusion method has been tested on the SIMPLIcity image<br />
database, where several retrieval measurements are utilised to compare the effectiveness of the proposed<br />
method with few other comparable methods. The retrieval results show that the proposed Integrated<br />
Colour-shape (ICS) descriptor has successfully obtained the best overall retrieval performance in all<br />
the retrieval measurements as compared to the benchmark methods, which include precision (53.50%),<br />
precision at 11 standard recall levels (52.48%), and rank (17.40).<br />
Keywords: CBIR, colour, feature fusion, and shape<br />
INTRODUCTION<br />
Content-based Image Retrieval (CBIR) is developing amazingly due to the increase needs to<br />
show, share, organise, search, and retrieve digital imagery. The CBIR technology has been useful<br />
Article history:<br />
Received: 31 March 2012<br />
Accepted: 31 August 2012<br />
E-mail addresses:<br />
masrina@fsktm.upm.edu.my (Mas Rina Mustaffa),<br />
fatimah@fsktm.upm.edu.my (Fatimah Ahmad),<br />
ramlan@fsktm.upm.edu.my (Ramlan Mahmod),<br />
shyamala@fsktm.upm.edu.my (Shyamala Doraisamy)<br />
*Corresponding Author<br />
in many areas, such as crime prevention,<br />
medicine, law, science, fashion and interior<br />
design, and a few others. As compared to<br />
conventional image retrieval techniques that<br />
use image annotations or keywords, CBIR<br />
has been able to reduce the many problems<br />
associated with retrieving images based on
Mas Rina Mustaffa, Fatimah Ahmad, Ramlan Mahmod and Shyamala Doraisamy<br />
text, such as manual image annotations, differences in perceptions and interpretations, and<br />
language barrier, where image annotations are usually presented in one language, by retrieving<br />
images on the basis of automatically derived low-level features, middle-level features, or<br />
high-level features (Datta et al., 2008; Vassilieva, 2009; Veltkamp & Tanase, 2002). Among<br />
these features, the low-level features are the most popular due to their simplicity compared to<br />
the other levels of features plus automatic object recognition and classification which are still<br />
among the most difficult problems in image understanding and computer vision.<br />
Apart from utilising the low-level features separately, they can also be integrated whereby<br />
in most cases, a single feature will not be suffice to represent the pictorial content of an image<br />
and fusing the low-level features will lead to a better performance. According to Forczmański<br />
and Frejlichowski (2007), the fusing features can be done either through the sequential approach<br />
or parallel approach. Based on the sequential approach, an image will first be processed by<br />
one feature descriptor and the output will then be used as the input for the following feature<br />
descriptor, and so on until a final feature vector is obtained. The parallel approach, on the other<br />
hand, works by allowing an image to be processed by different feature descriptors separately,<br />
where each of these descriptors will generate its respective coefficients and these coefficients<br />
will be integrated based on a certain scheme to produce the final integrated feature vectors. The<br />
sequential approach allows for a filtering procedure, where images which are depicted as very<br />
dissimilar by the first feature descriptor, can be omitted for subsequent steps. This can lead to<br />
a decrease in future computation time and computation complexity. However, allowing for<br />
images to be filtered out at the initial stage may result in false elimination of similar images,<br />
thus influencing the end result as well as the effectiveness of the approach. On the contrary,<br />
the parallel approach allows for computation time reduction where different methods can be<br />
calculated at the same time independently. The integration of the features is usually performed<br />
at the final stage where equal or different weights are assigned to each feature. Determining<br />
the best weight for the respective feature can be a complex task. However, assigning different<br />
weights to each feature will allow a method to stress the contribution of one set of features<br />
which may be considered as more important in the application than the rest. Weight distribution<br />
is definitely easier to be done in a parallel-based approach. Unlike the sequential-based feature<br />
fusion, to stress out a feature is to modify the process flow all together. The sequential and<br />
parallel approaches have their own strengths and weaknesses. In practice, the selection between<br />
a sequential-based or a parallel-based approach is very much dependent upon the application<br />
needs and requirements. There are quite a number of efforts done related to the feature fusion<br />
in CBIR to overcome the shortcomings associated with the single-feature methods. Some of<br />
the many works can be found in the following references (see Choraś et al., 2007; Lee & Yin,<br />
2009; Prasad et al., 2001; Schaefer, 2004; J.Y. Wang & Zhu, 2010; Yue et al., 2011).<br />
Therefore, this paper aims to contribute to a parallel-based feature fusion method, namely<br />
ICS descriptor, which combines colour and shape features to improve the performance of a<br />
CBIR system. The remainder of the paper is organised as follows: The methods to extract<br />
the respective colour and shape features are first described. Then, the combining strategy is<br />
explained following by the description on the experimental setting and discussion of results.<br />
Conclusions and future works can be found at the end of the paper.<br />
162 <strong>Pertanika</strong> J. Sci. & Technol. <strong>21</strong> (1): 283 - 298 (<strong>2013</strong>)
CBIR Using Colour and Shape Fused Features<br />
COLOUR FEATURE BASED ON MJAC<br />
The proposed MJAC is an improved framework by adopting ideas from three previous works in<br />
CAC including those by Huang et al. (1997), Moghaddam et al. (2005) and Williams and Yoon<br />
(2007) by implementing the Joint Auto Correlograms in a multi-level resolution. This provides<br />
an enhanced method which allows for pixels correlation of several local image features, such<br />
as colour, gradient magnitude, rank, and texturedness to be captured at different image scales<br />
in the frequency domain. At the beginning, the collected images will go through an extraction<br />
process to separate the RGB colour space and the grey-scale colour space. This is followed by<br />
the implementation of the Ridgelet transform on both of the RGB colour space and the greyscale<br />
colour space by first calculating the Radon transform, followed by the implementation of<br />
the one-dimensional discrete Wavelet transform on the Radon transform coefficients up to four<br />
sub-bands. Next, focusing only on scale-3 and scale-4 of the one-dimensional discrete Wavelet<br />
transform coefficients, the local image features such as colour, gradient magnitude, rank, and<br />
texturedness are extracted, where each of the local image features is treated independently.<br />
The colour feature is extracted in the RGB colour space, while the gradient magnitude, rank,<br />
and texturedness are extracted in the grey-scale colour space. In order to reduce the feature<br />
dimension, a compact representation, as well as ease of coefficient management, these local<br />
image features is then quantised. Auto correlogram is then performed on each of the quantised<br />
local image features. At the end of this process, feature vectors are generated to represent the<br />
images, which are stored in the feature database. The similarity between the query image and<br />
the images in the database are measured by comparing the feature vectors of the query image<br />
with the feature vectors of all the images in the database using the L 1-norm distance function.<br />
SHAPE FEATURE BASED ON ENRF<br />
ENRF is an extension and improvement to the work done by Chen et al. (2006), where the<br />
extended descriptor is now resulting in a rotation, scaling, and translation invariant Ridgelet<br />
transform for images of various sizes. The first step is by putting the collected images through<br />
an initialisation process. During this process, all the images in the collection are assigned with<br />
certain constraints. The images will then be made translation and scaling invariant. Only pixels<br />
of the translation and scaling invariant images that fall within the ellipse template centred<br />
at (M/2, N/2) are considered for the next steps (note that M and N represents the width and<br />
height of an image, respectively). A template option is made available after implementing<br />
the ellipse template setting, where it allows the algorithm to provide an option in choosing<br />
between proceeding with the ellipse template or considering the square template instead<br />
when processing the translated and scaled pixels of an image. A square template is used if the<br />
percentage of the pixels of the translation and scaling invariant image that fall outside of the<br />
ellipse area is more than the threshold value. Otherwise, the ellipse template is utilised. Radon<br />
transform is then performed on the shape that has been processed according to the suitable<br />
template using 128 points for both the number of samples taken on each radial line as well as<br />
the number of orientations. After normalising the Radon transform, the next step is to apply the<br />
one-dimensional Discrete Wavelet transform on each of the Radon slices to obtain the Ridgelet<br />
<strong>Pertanika</strong> J. Sci. & Technol. <strong>21</strong> (1): 283 - 298 (<strong>2013</strong>)<br />
163
Mas Rina Mustaffa, Fatimah Ahmad, Ramlan Mahmod and Shyamala Doraisamy<br />
coefficients. In order to make the descriptor invariant to rotation, the one-dimensional Discrete<br />
Fourier transform is performed along the angular direction of the scale 3 and scale 4 of the<br />
wavelet decomposition levels. For each of the mentioned wavelet decomposition levels, only<br />
15 Fourier magnitude spectrums are captured to represent the shape. These coefficients will<br />
be used as the feature vectors for the image which is stored in the feature database. As for the<br />
distance function, the L 1-norm is utilised.<br />
SIMILARITY MEASURE<br />
Fig.1 shows the scheme to combine the colour and shape features. According to the L 1- norm<br />
distance function concept, the smaller the similarity value between an image and the query<br />
image, the more similar the image is to the query image. Meanwhile, between the similarity<br />
values generated for both the colour and shape features, it is easier to identify whether an image<br />
is similar or not to a query image based on the shape feature similarity values rather than the<br />
colour feature similarity values since the shape feature similarity values are in wider range.<br />
Due to this reason, the shape feature is being made the benchmark in determining the initial<br />
similarity as shown in ‘Line 1’ of Fig.1 below.<br />
As shown in ‘Line 1’ of Fig.1, the shape feature similarity values are being multiplied<br />
with a threshold value, Threshold_Value. The Threshold_Value is used to identify the limit<br />
of which the Shape_Similarity_Value is small enough to make it noteworthy to be retained.<br />
Through the experiments, it has been identified that the best Threshold_Value is 3000. If the<br />
Shape_Similarity_Value multiplied by 3000 is below the value of 1, the Shape_Similarity_<br />
Value is noteworthy enough to be retained. The retention process is done by multiplying the<br />
Shape_Similarity_Value (range 0.000248 to 0.761901) with the Colour_Similarity_Value (range<br />
1.195548 to 9.146877). Since the range of the Colour_Similarity_Value is more than 1, when<br />
it is multiplied with the Shape_Similarity_Value of less than 1, it will always return a sum<br />
of less than 1, and hence retaining the small similarity value. If the Shape_Similarity_Value<br />
multiplied by 3000 is more than the value of 1, the similarity value is no longer noteworthy<br />
to be retained, hence an addition is performed.<br />
Based on the literature review, the colour feature is usually superior in image representation<br />
compared to other features. Due to this reason, more weights are given to the colour feature<br />
compared to the shape feature, as shown in ‘Line 2’ and ‘Line 4’ of Fig.1 above. A weight of<br />
0.2 is given to the shape feature while a weight of 0.8 is given to the colour feature (a + b =<br />
1). These weights are obtained experimentally.<br />
Line 1: If (Shape_Similarity_Value * Threshold_Value) < 1<br />
Line 2: (a * Shape_Similarity_Value) * (b * Colour_Similarity_Value)<br />
Line 3: Else<br />
Line 4: (a * Shape_Similarity_Value) + (b * Colour_Similarity_Value)<br />
Line 5: End If<br />
Fig.1: Algorithm for Combining the Colour and Shape Features<br />
164 <strong>Pertanika</strong> J. Sci. & Technol. <strong>21</strong> (1): 283 - 298 (<strong>2013</strong>)
CBIR Using Colour and Shape Fused Features<br />
EVALUATION AND ANALYSIS OF THE RESULTS<br />
The objective of this experiment was to evaluate the retrieval effectiveness of the proposed<br />
feature fusion descriptor, namely, ICS compared to the proposed colour-only descriptor (MJAC)<br />
and the proposed shape-only descriptor (ENRF) based on several retrieval measurements. The<br />
retrieval experiments were conducted on an Intel Pentium Dual-Core 2.5 GHz desktop. These<br />
methods were tested on 100 SIMPLIcity image dataset where the first 10 images from each of<br />
the image classes made up the 100 images (for example, the images labelled 0-9 for the first<br />
class, 100-109 for the second class, 200-209 for the third class, etc.) (Wang et al., 2001). For<br />
each class, all of the 10 images were selected as image queries. In total, there were 100 query<br />
images. There are 10 similar images in each image class, which provide the ground truth. The<br />
Query-by-Example (QBE) paradigm is employed. Samples of the SIMPLICITY image dataset<br />
is shown in Fig.2.<br />
The retrieval effectiveness of the MJAC, ENRF, and ICS was evaluated using three<br />
different retrieval measurements, which were the precision at 10, 11 standard precision-recall<br />
at 10, and rank at 100.<br />
Table 1 shows a summary of the overall average retrieval effectiveness of the proposed<br />
MJAC, ENRF, and ICS for 100 SIMPLIcity image dataset based on three retrieval measurements.<br />
It should be highlighted that the proposed feature fusion descriptor (ICS) is able to achieve the<br />
best overall performance for all the retrieval measurements. This indicates that the proposed<br />
ICS is better in differentiating between similar and dissimilar images when given a query image<br />
as well as able to retrieve similar images at higher rank compared to the colour-only MJAC<br />
and the shape-only ENRF. The best overall retrieval performance achieved by the ICS in all<br />
three retrieval measurements indicates its capability to maintain a good performance across<br />
different retrieval measurements compared to the benchmark methods. The consideration of<br />
colour and shape information in one descriptor allows or the ICS to perform better compared<br />
to the colour-only descriptor and shape-only descriptor. It is common where one feature may<br />
not be enough to represent an image since different images may contain colour information but<br />
not shapes, and vice versa. Generally, by taking a few features together, they can complement<br />
each other, hence contributing to a better descriptor rather than a single feature descriptor.<br />
Africans Beaches Buildings Buses Dinosaurs<br />
Elephants Flowers Horses Mountains Food<br />
Fig.2: Samples of the SIMPLIcity image dataset<br />
<strong>Pertanika</strong> J. Sci. & Technol. <strong>21</strong> (1): 283 - 298 (<strong>2013</strong>)<br />
165
Mas Rina Mustaffa, Fatimah Ahmad, Ramlan Mahmod and Shyamala Doraisamy<br />
This work has successfully integrated the colour and shape features and the retrieval results<br />
have shown the implication of the proposed feature fusion descriptor (ICS) in improving the<br />
retrieval effectiveness.<br />
TABLE 1: Retrieval effectiveness summary between the ICS and its benchmark methods based on<br />
various retrieval measurements<br />
Method<br />
Average Precision<br />
(p-10)<br />
Average 11 Standard<br />
Precision-Recall<br />
(p-10)<br />
Average Rank<br />
(p-100)<br />
MJAC 0.508000 0.491669 18.409000<br />
ENRF 0.312000 0.325884 36.790000<br />
ICS 0.535000 0.524829 17.403000<br />
From Table 1, it can be concluded that the proposed MJAC is suitable for images that have<br />
various colour information with inadequate shape characteristics, while the ENRF performs<br />
better on images with obvious shapes or regions but less colour variations. On the contrary, ICS<br />
is able to achieve higher precision rate for images with obvious colour and shape information. In<br />
general, the SIMPLIcity image dataset contains images with complex shapes and backgrounds.<br />
Therefore, it can be observed that the proposed shape descriptor is not able to perform equally<br />
to that of the proposed colour descriptor since colour information is definitely more obvious<br />
in such images. This has led to a relatively big gap in retrieval performance between the<br />
proposed colour and shape descriptors. Since the feature fusion method makes use of these<br />
two descriptors, the proposed ICS will generally hold a retrieval rate which gives a balance<br />
between these two descriptors. Nevertheless, it can be said that the proposed feature fusion<br />
method has successfully achieved a reasonable precision rate for all image classes with either<br />
achieving the highest precision rate or the second highest (with mostly achieving small gaps<br />
compared to the highest precision rate) in most of the image classes.<br />
CONCLUSION AND FUTURE SUGGESTIONS FOR WORK<br />
In this paper, a new feature fusion approach is proposed. The proposed ICS integrates colour<br />
and shape features, where the colour feature is extracted based on the MJAC while the shape<br />
information is obtained through the ENRF. These features are combined through a proposed<br />
integrated strategy. The feature fusion method is introduced to boost the retrieval performance<br />
compared to single-only methods. The results have shown that retrieval effectiveness has been<br />
improved by integrating features for image representation. Based on 100 SIMPLIcity images,<br />
where all 100 images have been chosen as query images, ICS has successfully obtained the<br />
best overall retrieval performance in three different retrieval measurements, which include<br />
precision at 10 with 53.50%, 11 standard precision-recall at 10 with 52.48%, and rank at<br />
100 with 17.40. This has proven that the proposed integrated descriptor, which combines the<br />
colour and shape features, has contributed to a better retrieval and rank of similar images.<br />
Achieving the best overall retrieval performance in all three different retrieval measurements<br />
166 <strong>Pertanika</strong> J. Sci. & Technol. <strong>21</strong> (1): 283 - 298 (<strong>2013</strong>)
CBIR Using Colour and Shape Fused Features<br />
has also proven the capability of the proposed ICS to maintain a good performance across<br />
different retrieval measurements as compared to the benchmark methods. Future work will<br />
include providing relevance feedback as well as combining the colour-shape methods with<br />
other features such as texture.<br />
ACKNOWLEDGMENTS<br />
Financial support provided by the Ministry of higher Education, Malaysia and <strong>Universiti</strong> <strong>Putra</strong><br />
Malaysia during the duration of this research is gratefully acknowledged.<br />
REFERENCES<br />
Chen, G. Y., Bui, T. D., & Krzyżak, A. (2006). Rotation invariant feature extraction using Ridgelet and<br />
Fourier transforms. Pattern Analysis and Applications, 9(1), 83-93.<br />
Choraś, R. S., Andrysiak, T., & Choraś, M. (2007). Integrated colour, texture, and shape information for<br />
content-based image retrieval. Pattern Analysis and Applications, 10(4), 333-343.<br />
Datta, R., Joshi, D., Li, J., & Wang, J. Z. (2008). Image retrieval: Ideas, influences, and trends of the<br />
new age. ACM Computing Surveys, 40(2), 1-60.<br />
Forczmański, P., & Frejlichowski, D. (2007). Strategies of shape and colour fusions for content-based<br />
image retrieval. Computer Recognition Systems, 2, 3-10.<br />
Huang, J., Kumar, S. R., Mitra, M., Zhu, W. J., & Zabih, R. (1997). Image indexing using colour<br />
correlograms. In Proceedings of the 1997 Conference on Computer Vision and Pattern Recognition<br />
(CVPR ‘97) (pp. 762-768). Washington, DC, USA: IEEE Computer Society.<br />
Lee, X. F., & Yin, Q. (2009). Combining colour and shape features for image retrieval. In Universal<br />
Access in HCI, Part III, HCII 2009, 5616 of LNCS (pp. 569-576).<br />
Moghaddam, H. A., Khajoie, T. T., Rouhi, A. H., & Tarzjan, M. S. (2005). Wavelet correlogram: A new<br />
approach for image indexing and retrieval. Pattern Recognition, 38(12), 2506-2518.<br />
Prasad, B. G., Biswas, K. K., & Gupta, S. K. (2001). Colour and shape index for region-based image<br />
retrieval. In Arcelli, C., Cordella, L. P., & Di Baja, G. S. (Eds.), Proceedings of the 4th. International<br />
Workshop on Visual Form (IWVF-4), 28-30 May 2001, Capri, Italy (716-725). London, UK: Springer-<br />
Verlag.<br />
Schaefer, G. (2004). CVPIC colour/shape histograms for compressed domain image retrieval. In DAGM<br />
2004, 3175 of LNCS, Tubingen, Germany (pp. 424-431).<br />
Vassilieva, N. S. (2009). Content-based image retrieval methods. Programming and Computing Software,<br />
35(3), 158-180.<br />
Veltkamp, R. C., & Tanase, M. (2002). Content-based image Retrieval Systems: A Survey. Technical<br />
Report UU-CS-2000-34, Institute of Information and Computing Sciences, Utrecht University.<br />
Wang, J. Y., & Zhu, Z. (2010). Image retrieval system based on multi-feature fusion and relevance<br />
feedback. In Proceedings of the Ninth International Conference on Machine Learning and Cybernetics,<br />
11-14 July 2010, Qingdao (pp. 2053-2058).<br />
Wang, J. Z., Li, J., & Wiederhold, G. (2001). SIMPLIcity: Semantics-sensitive integrated matching for<br />
picture libraries. IEEE Transactions on Pattern Analysis and Machine Intelligence, 23(9), 947-963.<br />
<strong>Pertanika</strong> J. Sci. & Technol. <strong>21</strong> (1): 283 - 298 (<strong>2013</strong>)<br />
167
Mas Rina Mustaffa, Fatimah Ahmad, Ramlan Mahmod and Shyamala Doraisamy<br />
Williams, A., & Yoon, P. (2007). Content-based image retrieval using joint correlograms. Multimedia<br />
Tools and Applications, 34(2), 239-248.<br />
Yue, J., Li, Z., Liu, L., & Fu, Z. (2011). Content-based image retrieval using colour and texture fused<br />
features. Mathematical and Computer Modelling, 54(3-4), 11<strong>21</strong>-1127.<br />
168 <strong>Pertanika</strong> J. Sci. & Technol. <strong>21</strong> (1): 283 - 298 (<strong>2013</strong>)
ISSN: 0128-7680 © <strong>2013</strong> <strong>Universiti</strong> <strong>Putra</strong> Malaysia Press.<br />
<strong>Pertanika</strong> J. Sci. & Technol. <strong>21</strong> (1): 169 - 182 (<strong>2013</strong>)<br />
SCIENCE & TECHNOLOGY<br />
<strong>Journal</strong> homepage: http://www.pertanika.upm.edu.my/<br />
Toward Automatic Semantic Annotating and Pattern Mining for<br />
Domain Knowledge Acquisition<br />
Tianyong Hao 1 * and Yingying Qu 2<br />
1 School of Computer Science and Engineering, University of New South Wales, Australia<br />
2 Faculty of the Built Environment, University of New South Wales, Australia<br />
ABSTRACT<br />
Due to the high complexity of natural language, acquisition of high quality knowledge for the purpose<br />
of fine-grained data processing still mainly relies on manual labour at present, which is extremely<br />
laborious and time consuming. In this paper, a new automatic approach using semantic annotating and<br />
pattern mining is proposed to assist engineers for domain knowledge acquisition. This approach uses<br />
Minipar to label sentences processed from domain texts. Based on the dependency relations, structural<br />
patterns are extracted and semantic bank is applied to annotate and represent concepts with semantic<br />
labels considering sentence contexts. The approach further learns and assigns relations to previously<br />
extracted concepts by pattern matching. The involved concepts and semantic labels with learned relations<br />
together, as extracted knowledge, enrich domain knowledge base. Preliminary experiments on Yahoo!<br />
Data in “heart diseases” category showed that the proposed approach is feasible for automatic domain<br />
knowledge acquisition.<br />
Keywords: Knowledge acquisition, semantic annotation, semantic bank, structural pattern,<br />
transformation rule<br />
INTRODUCTION<br />
With the mass production of digital information over the web, extracting and snatching<br />
knowledge with effectiveness, efficiency and accuracy have become an urgent and challenging<br />
tasks (Wang et al., 2006). In recent years, knowledge acquisition from texts has become one<br />
Article history:<br />
Received: 31 March 2012<br />
Accepted: 31 August 2012<br />
E-mail addresses:<br />
haotianyong@gmail.com (Tianyong Hao),<br />
yingyinqu2@gmail.com (Yingying Qu)<br />
*Corresponding Author<br />
of hot research fields in Artificial Intelligence<br />
(Tanaka & Jatowt, 2010; Tanaka & Jatowt,<br />
2010; Deng & Han, 2012; Carayannis, 2012;<br />
Fan et al., 2012). The task of knowledge<br />
acquisition is to extract knowledge for an<br />
information system or expert system by setting<br />
up sound, perfect, effective knowledge base.
Tianyong Hao and Yingying Qu<br />
In the past several decades, a number of these methods were followed with Cognitive Science<br />
and other disciplines.<br />
Due to the high complexity of natural language, i.e. with the huge amount of concepts<br />
and relations in free texts being too complicated to be formalized by automatic methods, the<br />
acquisition of high quality knowledge for the purpose of fine-grained data processing is still<br />
mainly relying on the costly manual labour at present.<br />
In the field of medical informatics, there is a high demand for domain knowledge within<br />
a formally specified framework and knowledge based is getting more and more accepted<br />
(Campbell et al., 1994; Hull & Gomez, 1999; Cao, 2001; Dawoud et al., 2012). It requires<br />
medical knowledge to be expressed in a sound and consistent manner. Knowledge engineering<br />
in an ontologically coherent (sub) domain makes use of existing knowledge compilations, such<br />
as ICD-10, SNOMED, MESH, UMLS, as much as possible. Due to the insufficiency of formal<br />
specification and levels of granularity, only a limited amount of the knowledge can be reused<br />
even if they are judged transferable in principle (Carenini & Moore, 1993; Firdaus et al., 2012).<br />
Most knowledge is contained in a large collection of unstructured textual documents.<br />
Ordinary approaches are to acquire knowledge from the documents manually and then formalize<br />
the knowledge at the conceptual level. However, this acquisition procedure mainly relies on a<br />
large number of knowledge engineers’ manual efforts, which is rather labour intensive, time<br />
consuming and troublesome. Moreover, the huge amounts of concepts and relations in domain<br />
texts are extremely complicated to be formalized by knowledge engineers. Thus, automated or<br />
semi-automated knowledge acquisition techniques are urgently required (Wang et al., 2006;<br />
Firdaus et al., 2012).<br />
In this paper, a novel automatic method is proposed for domain knowledge acquisition<br />
from domain text corpus by semantic annotating and pattern mining. After pre-processing the<br />
corpus by splitting into sentences and removing the noise data, the proposed method analyzes<br />
the corpus by using Minipar to label sentences. The nouns and noun phrases, regarded as the<br />
concepts, are extracted along with structural patterns. In order to improve matching and learning<br />
efficiency, frequent patterns are mined based on these structural patterns using a sequence-based<br />
Apriori algorithm. The concepts are then annotated with semantic labels by WordNet and a<br />
further defined semantic bank containing unit annotations and context annotations.<br />
With regard to training on annotated data, the method can generate structural patterns to<br />
match with a group of frequent patterns previously extracted. The concepts and their annotated<br />
relations in each pattern can be applied into the sentences with the same matched frequent<br />
pattern to derive more concepts with similar relations, or to learn more relations with the<br />
same concepts. The automatically extracted concepts, semantic labels and relations can thus<br />
dramatically enrich domain knowledge bases.<br />
We used Yahoo! Answers (2012) corpus as of 10/25/2007 as an experimental dataset. It<br />
contained 4,483,032 questions and their correct answers, which are reliable domain text sources<br />
as the answers were rated by human users. Furthermore, the dataset contained a small amount<br />
of metadata such as best answers on human selection. Finally, 19,622 questions were extracted<br />
with their best answers in the “heart diseases” category as the domain corpus. By proposing<br />
a number of knowledge transformation rules, the preliminary experiments showed that the<br />
annotations could be transformed to standard knowledge representation formats such as OWL<br />
170 <strong>Pertanika</strong> J. Sci. & Technol. <strong>21</strong> (1): 283 - 298 (<strong>2013</strong>)
Toward Automatic Semantic Annotating and Pattern Mining for Domain Knowledge Acquisition<br />
accurately and stably. Therefore, the method is feasible for domain knowledge acquisition<br />
aiming at knowledge sharing.<br />
The rest of this paper is organized as follows: Section 2 introduces the proposed framework<br />
of automatic knowledge acquisition. Section 3 presents sentence labelling and pattern mining.<br />
Section 4 describes semantic annotating of the concepts and relation learning by pattern<br />
matching. In Section 5, preliminary experiments with knowledge transformation rules are<br />
discussed, and Section 6 summarizes this paper and discusses future work.<br />
THE FRAMEWORK OF DOMAIN KNOWLEDGE ACQUISITION<br />
Admittedly, human-based knowledge acquisition can ensure the high quality of extracted<br />
knowledge. However, it is a long-term laborious work with high cost. Thus, automatic<br />
acquisition methods are more preferable, especially for quick acquisition demand. In this<br />
paper, an automatic method was proposed to extract domain knowledge based on semantic<br />
annotating and frequent pattern mining.<br />
Through this method, domain corpus was firstly pre-processed to separate the text<br />
paragraphs into sentences and to remove noisy data such as Mathematics formulas. Sentences<br />
were then analyzed and labelled by Minipar to extract nouns, noun phrases and structural<br />
patterns. By using the sequence-based Apriori algorithm, the frequent patterns were mined<br />
from those extracted structural patterns to improve learning efficiency. Regarding those nouns<br />
or noun phrases as concepts, these concepts were then annotated by WordNet and a semantic<br />
bank which contained unit annotations and context annotations, as a semantic label annotation<br />
technique. After that, the patterns with their conceptual relations, learned from annotated<br />
training resources, were matched with the mined frequent patterns. According to the matched<br />
parts, the corresponding relations could be applied to the concepts associated with the mined<br />
frequent patterns. With defined knowledge transformation rules, these concepts and relations<br />
can be further transformed into standard knowledge representation formats such as OWL thus<br />
to enrich domain knowledge bases. The related framework is shown Fig.1.<br />
The automatic knowledge acquisition method contains seven main steps, which are shown<br />
in the fig.1:<br />
Step 1: Pre-processing a domain corpus by formatting, removing noisy data, and splitting<br />
text paragraphs into sentences;<br />
Step 2: Labelling all sentences to extract all nouns, noun phrases, and structural patterns;<br />
Step 3: Mining frequent patterns from the structural patterns using a sequence-based<br />
frequent pattern mining algorithm;<br />
Step 4: Annotating all the concepts with semantic labels based on WordNet and a semantic<br />
bank-based annotation method;<br />
Step 5: Training annotated resources to match with the frequent patterns;<br />
Step 6: Assigning relations extracted from matched patterns to the previously extracted<br />
concepts;<br />
Step 7: Presenting all the concepts and relations using OWL or RDF, aided by knowledge<br />
transformation rules to enrich domain knowledge bases.<br />
<strong>Pertanika</strong> J. Sci. & Technol. <strong>21</strong> (1): 283 - 298 (<strong>2013</strong>)<br />
171
MiniPar<br />
Tianyong Hao and Yingying Qu<br />
With the previous processing steps, the framework can discover concepts with their<br />
relations, which are then transformed to be formal knowledge representations. Furthermore,<br />
this framework can be extended to more corpora or web documents to extract a large amount<br />
of knowledge automatically.<br />
SENTENCE LABELING AND FREQUENT PATTERN MINING<br />
The pre-processed sentences from domain corpus are used for sentence structure labelling and<br />
frequent structural pattern mining. A pattern is defined as the core structure of a sentence, which<br />
can then be extended as the generalization of similar sentences that shares the similar structure.<br />
Sentence Labeling<br />
Domain corpus<br />
Preprocessing<br />
Sentence<br />
labeling<br />
Frequent pattern<br />
mining<br />
Concepts<br />
patterns<br />
Semantic<br />
bank<br />
Concept<br />
annotating<br />
WordNet<br />
Relations<br />
extracting<br />
Pattern<br />
matching<br />
Relations<br />
Fig.1: A framework of the automatic domain knowledge acquisition<br />
Knowledge<br />
transforming<br />
There are many syntax analysis tools, such as TreeTagger (2012) and OpenNLP (2012), to label<br />
sentences by identifying nouns and verbs. However, most of these tools parse sentences by<br />
part-of-speech tagging without considering the relations between the objects in the sentences,<br />
making it difficult to find the core structures. Dependency Grammar (2012) is a class of<br />
syntactic theories developed by Lucien Tesnière. Sentence structure is determined by the<br />
relations between a word (a head) and its dependents, which are distinct from phrase structure<br />
grammars. The dependency relationship in this model is an asymmetric relationship between<br />
a word called head (governor) and another one called modifier. This kind of relationship can<br />
be used to analyze the dependency thus to acquire the main structure and nouns of a sentence<br />
effectively.<br />
172 <strong>Pertanika</strong> J. Sci. & Technol. <strong>21</strong> (1): 283 - 298 (<strong>2013</strong>)<br />
Pattern<br />
database<br />
Knowledge<br />
base
Toward Automatic Semantic Annotating and Pattern Mining for Domain Knowledge Acquisition<br />
In this study, Minpar was used as a dependency parser tool to analyze sentence relationship<br />
in the paper. Minipar is a principle-based broad-coverage parser for the English language<br />
(Berwick et al., 1991). Like Principar, Minipar represents its grammar as a network where<br />
nodes represent grammatical categories and links represent types of syntactic (dependency)<br />
relationships. The output of Minipar is a dependency tree. The links in the diagram represent<br />
dependency relationships. The direction of a link is from the head to the modifier in the<br />
relationship. Labels associated with the links represent the types of dependency relations.<br />
Furthermore, according to the evaluation with the SUSANNE corpus, Minpar achieves about<br />
88% precision and 80% recall, in relation to dependency relationships (2012). The reliable<br />
performance ensures the quality of sentence labelling work.<br />
By using Minipar, the sentences in corpus can be labelled with part-of-speech and<br />
dependency relations. Therefore, the core sentence structure, which includes nouns, verbs<br />
and other meaningful terms, could be extracted. For example, the sentence “what are the risks<br />
of plugging a hole in the heart?” was analyzed by using Minipar and the result is shown in<br />
Table 1 below.<br />
TABLE 1: Minipar output on the example sentence<br />
E1 (() fin C * )<br />
1 (what ~ N E1 whn (gov fin))<br />
2 (are be VBE E1 i (gov fin))<br />
E4 (() what N 4 subj (gov risk)<br />
3 (the ~ Det 4 det (gov risk))<br />
4 (risks risk N 2 pred (gov be))<br />
5 (of ~ Prep 4 mod (gov risk))<br />
E0 (() vpsc C 5 pcomp-c (gov of))<br />
E2 (() ~ N E0 s (gov vpsc))<br />
6 (plugging plug V E0 i (gov vpsc))<br />
E5 (() ~ N 6 subj (gov plug)<br />
7 (a ~ Det 8 det (gov hole))<br />
8 (hole ~ N 6 obj (gov plug))<br />
9 (in ~ Prep 8 mod (gov hole))<br />
10 (the ~ Det 11 det (gov heart))<br />
11 (heart ~ N 9 pcomp-n (gov in))<br />
12 (? ~ U * punc)<br />
In order to facilitate high speed pattern extraction, the output of Minipar is firstly converted<br />
into XML format. The nodes in XML are aligned with hierarchical structure, which can<br />
dramatically speed up pattern extraction. The XML format of the example is shown in Fig.2.<br />
After the analysis, a group of nouns such as “risk”, “hole” and “heart”, as well as noun<br />
phrases, could be obtained. With the tagged relations, “risk” has the relation of “gov” to “be”,<br />
“hole” has the relation of “gov” to “plug”, and “heart” has the relation of “gov” to “in”. Since<br />
“gov” means the actual word that it refers to, the structural patterns can be acquired level by<br />
<strong>Pertanika</strong> J. Sci. & Technol. <strong>21</strong> (1): 283 - 298 (<strong>2013</strong>)<br />
173
Tianyong Hao and Yingying Qu<br />
Fig.2: The Minipar output of the example in XML format<br />
level. In each level, incremental part, which is the content extended compared with the previous<br />
pattern, is judged if it contains a noun or noun phrase. Only the patterns that fulfil constraints<br />
are regarded as qualified structural patterns. On the same example, all the extracted structural<br />
patterns and their related concepts are shown in Table 2.<br />
TABLE 2: The extracted patterns and their related concepts on the same example<br />
Structural patterns Concepts<br />
what(gov fin) be(gov fin) [N1](gov be) risk<br />
what(gov fin) be(gov fin) [N1](gov be) of(gov N1) plug(gov vpsc)<br />
[N2](gov plug)<br />
risk; hole<br />
what(gov fin) be(gov fin) [N1](gov be) of(gov N1) plug(gov vpsc)<br />
[N2](gov plug) in(gov N2) [N3](gov in)<br />
risk; hole; heart<br />
Frequent Pattern Mining<br />
Since a single structural pattern may be specific, to improve the performance of matching<br />
and learning, frequent patterns are more appropriate to be used for efficient knowledge<br />
acquisition. Apriori, as a classic association rule mining method, is applied to mine possible<br />
frequent patterns. It is an algorithm for learning association rules and was designed to operate<br />
on databases containing transactions (for example, collections of items bought by customers,<br />
or details of a website frequentation).<br />
Given a set of item sets (for instance, sets of retail transactions, each listing individual<br />
items purchased), Apriori algorithm attempts to find subsets which are common to at least a<br />
174 <strong>Pertanika</strong> J. Sci. & Technol. <strong>21</strong> (1): 283 - 298 (<strong>2013</strong>)
Toward Automatic Semantic Annotating and Pattern Mining for Domain Knowledge Acquisition<br />
minimum number C of the item sets. Apriori uses a “bottom up” approach, where frequent<br />
subsets are extended one item at a time (a step known as candidate generation), and groups<br />
of candidates are tested against the data. The algorithm terminates when no further successful<br />
extensions are found. Apriori uses breadth-first search and a tree structure to count candidate<br />
item sets efficiently. It generates candidate item sets of length k from the item sets of length<br />
k-1. Then, it prunes the candidates which have an infrequent sub pattern. According to the<br />
downward closure lemma, the candidate set contains all frequent k-length item sets. After<br />
that, it scans the transaction database to determine frequent item sets among the candidates.<br />
In this paper, threshold support for a pattern candidate p is defined as the number of pattern<br />
candidates that contain p.<br />
In frequent pattern learning, those candidates whose occurrences are lower the support<br />
threshold are removed. Furthermore, two corollaries are applied to reduce calculation<br />
complexity. Let X, Y, Z be any three pattern candidates, and observe that if X ⊆ Y and Y ⊆ Z,<br />
then support(X) ≥ support(Y) ≥ support(Z), which leads to the following two corollaries: 1) If<br />
Z is frequent, then any subset X or Y is also frequent; 2) If X is not frequent, then any superset<br />
Y or Z cannot be frequent.<br />
Regarding a structural pattern as an item set, a pattern can be split into several items thus<br />
can be sent to Apriori for mining. However, the sequences, as order information between<br />
items, need be fully considered. After sequence-based Apriori algorithm, the patterns whose<br />
recorded occurrence values larger than a threshold are mined as frequent patterns, which are<br />
further used in the next section.<br />
SEMANTIC ANNOTATING AND RELATIONS LEARNING<br />
Semantic Annotating<br />
There are a large amount of nouns and noun phrases acquired from corpus labelling.<br />
Regarding them as concepts here, it is an essential step to annotate these concepts for semantic<br />
representation. In order to annotate them, semantic labels were used as annotation labels based<br />
on WordNet (2012), which provides a large database of English lexical items available online.<br />
A semantic label here is defined as [Concept1] \ [Concept2], where these two concepts<br />
(Concept1 and Concept2) have a relation with Sub(Concept2, Concept1), which means<br />
Concept2 is the sub concept of Concept1. The purpose is to assign a label with a super concept<br />
label as constraint to reduce potential ambiguities. In this semantic label definition, concepts<br />
can be retrieved and labelled using WordNet. For instance, in the following sentence “What is<br />
the exact relationship between pulse rate and systolic pressure?”, “pulse rate” have two senses,<br />
and thus the super con cepts are: 1) “vital sign”, “sign”, “evidence”, “information”, and so on;<br />
and 2) “rate”, “magnitude relation”, “relation”, and so on. Hence, the semantic labels of the<br />
“pulse rate” are tagged as “[sign\ vital sign]” and “[magnitude relation \rate]” finally.<br />
The annotated concepts with semantic labels are important sources to enrich or even<br />
construct the basis of domain knowledge base. To improve annotation efficiency and label<br />
concepts in a complex context, these annotated concepts are represented in the form of semantic<br />
bank, which can be transferred into knowledge format directly as described in the following<br />
section. The idea of semantic bank is from one of our research work (Hao et al., 2009). The<br />
<strong>Pertanika</strong> J. Sci. & Technol. <strong>21</strong> (1): 283 - 298 (<strong>2013</strong>)<br />
175
Tianyong Hao and Yingying Qu<br />
semantic bank is a kind of database to store concepts, corresponding semantic labels, and<br />
context annotation data. It consists of two parts: 1) unit annotation; and 2) context annotation.<br />
The unit annotation part contains single concepts with their semantic labels. For example,<br />
the concept “pulse rate” is tagged as “[sign\ vital sign]” and “[magnitude relation \rate]”. The<br />
format of the unit concept is represented as follows:<br />
[Concept] HAVING [Semantic labels]<br />
The context annotation is a type of representation of unit annotation and occurrences in a<br />
specific context. For example, the concept “pulse rate” has two semantic labels. However, in<br />
the example sentence, the semantic label of “systolic pressure” was identified as “[vital sign\<br />
blood pressure]”. In this context, the “pulse rate” was assigned with the semantic label “[sign\<br />
vital sign]”. The format of context annotation is represented as follows:<br />
([Term1] HAVING [Semantic labels 1] WITH [Term2] HAVING<br />
[Semantic labels 2]): Occurrence<br />
The Semantic labels in [Semantic labels] can be modified and the Occurrence can be<br />
increased and updated when there are new semantic labels used for the current concepts. An<br />
example of the context annotation is shown in Table 3, in which “pulse rate” has two different<br />
labels in different sentence contexts. From the context annotation, the probability model can<br />
be used to calculate the possible semantic senses in certain context.<br />
TABLE 3: An example of context annotation<br />
Concept 1 with label Concept 2 with label Occurrence<br />
pulse rate HAVING<br />
[sign\vital sign]<br />
pulse rate HAVING<br />
[magnitude relation\rate]<br />
systolic pressure HAVING<br />
[vital sign\blood pressure]<br />
valve HAVING<br />
[body part\structure]<br />
With the semantic bank, the concordance of concepts and their semantic labels are recorded<br />
with occurrences. When the data are large enough, they can be used to determine the semantic<br />
labels for a given new sentence. A naïve Bayesian formulation was used with the hypothesis<br />
that each word in a sentence was thought to be independently distributed to determine the<br />
semantic label. The probability of the semantic label for each concept can be calculated by<br />
using the following equation:<br />
P ( label | c ) =<br />
P ( label ) P ( c | label )<br />
ci n ci j n<br />
j≠i cin ∏ j<br />
j≠i Pc ( c )<br />
i ∏ j<br />
j≠i 176 <strong>Pertanika</strong> J. Sci. & Technol. <strong>21</strong> (1): 283 - 298 (<strong>2013</strong>)<br />
∏<br />
1<br />
2<br />
(2)
Toward Automatic Semantic Annotating and Pattern Mining for Domain Knowledge Acquisition<br />
where the left part denotes that the probability of concept ci is distinguished by the semantic<br />
label label n on the condition that i c co-occurs with c j . Pc ( label )<br />
i n is the prior probability of<br />
c i , which is distinguished by semantic label label n . The denominator means the probability<br />
of i c co-occurs with each j c and Pc ( c | n )<br />
i j label gives the probability of appearing j c when<br />
c i is labeled by label n . Noting that the denominator remains constant when i c and label n are<br />
fixed, as a result, we only need to calculate the product of each Pc ( c | )<br />
i j label n and Pc ( label )<br />
i n<br />
to determine the semantic label of i c using the following equation:<br />
label = Max arg[ Pc ( labeln) ∏ Pc ( c j | labeln)]<br />
(3)<br />
i i<br />
n j≠i The concept annotation method based on the semantic bank is further implemented in our<br />
system, which can analyze a sentence and annotate concepts with semantic labels automatically.<br />
Relation Learning<br />
Since the acquired frequent patterns have a larger coverage of sentences than normal structural<br />
patterns, and they can be used to extract more concepts having similar relationship theoretically.<br />
With annotated and validated training data, our method can learn the patterns and their relations<br />
so as to be applied into the extraction of more concepts extracted from the original domain<br />
corpus. The detailed method is as follows:<br />
Given an annotated sentence with knowledge representation as a training sentence s t, the<br />
method first analyzes the sentence by Minipar to acquire structural patterns p t and corresponding<br />
relation r t. After that, the pattern is matched with each pattern in the frequent pattern set. If<br />
there is a pattern p f matched, the r t is then applied to the relation representation of all nouns<br />
extracted from p f. The detailed equation for this purpose is shown in the following:<br />
2×<br />
MS MS<br />
MScore( pt<br />
) =<br />
MS + MS<br />
p p<br />
t f<br />
p p<br />
t f<br />
pt and pf are firstly split into items MS and p MS and these items are then used to match<br />
t<br />
p f<br />
with each other. The matching score, as MScore for the pattern pt, is calculated based on<br />
the counting matched items with all the items.<br />
From Equation (4), the frequent pattern matched best to the current structural pattern was<br />
obtained compared with a matching threshold. If there is no frequent pattern fulfils the current<br />
structural pattern still can be applied to pattern learning though its question matching coverage<br />
is less than the frequent patterns.<br />
For example, there is training sentence “the signs of a heart attack are chest discomfort,<br />
discomfort in other areas of the upper body, shortness of breath, and other symptoms”. Its<br />
annotation is shown in the following:<br />
<strong>Pertanika</strong> J. Sci. & Technol. <strong>21</strong> (1): 283 - 298 (<strong>2013</strong>)<br />
(4)<br />
177
Tianyong Hao and Yingying Qu<br />
<br />
<br />
<br />
The structural pattern of the example sentence is “the(gov [N1]) [N1](gov be) of(gov N1)<br />
[N2](gov N1) be(gov fin) [N3](gov be)”. Therefore, the pattern can be matched with the whole<br />
pattern set. Suppose there is a frequent pattern matched and its covered sentences include<br />
“The benefits of red wine are reducing coronary heart diseases, maintains the immune system,<br />
polyphenols, resveratrol, flavonoids, anti-bacterial activity, anti-stress”. The relation is then<br />
applied in the sentence, and thus, a relation is learned automatically, as follows:<br />
<br />
<br />
<br />
By this way, all the possible relations related to the concepts in our domain sentences could<br />
be acquired, especially using the previous semantic bank. Therefore, the semantic annotations<br />
of concepts with their relations can be used to enrich or built a domain specific knowledge base.<br />
PRELIMINARY EXPERIMENTS<br />
In this study, the automatic knowledge acquisition method was implemented in a Windowsform<br />
application. The domain was selected as “heart diseases” from Yahoo! Answers (2012)<br />
as of 10/25/2007, which was used as corpus since it contained huge amount of data (4,483,032<br />
items) and also tagged with rated answers. These human-based answers are favourable domain<br />
text source. Furthermore, the dataset contained a large amount of metadata, i.e., which answer<br />
was selected as the best answer, as well as the category and sub-category that were assigned<br />
to this question. Therefore, the questions with their best answers were selected in the “Heart<br />
Diseases” category as our domain dataset, containing 19,622 items in total. The example data<br />
in the domain are shown in Fig.3.<br />
After pre-processing the corpus into sentences, Minipar was applied to automatically<br />
identify the concepts and dependency relations. In this experiment, the focus was mainly<br />
placed on recognizing nouns and noun phrases, in which the latter has higher priority since the<br />
noun phrases can convey more specific semantic information. After that, the system extracted<br />
all the possible structural patterns. With the sequence-based Apriori algorithm, the frequent<br />
patterns are mined and extracted. WordNet is further applied to annotate the nouns and nouns<br />
phrases as the format of unit annotation and context annotation. In order to annotate a sentence<br />
more accurately, all the semantic labels and items were recorded with their occurrences into a<br />
semantic bank. These statistical data were further used to assist annotation on specific sentences.<br />
178 <strong>Pertanika</strong> J. Sci. & Technol. <strong>21</strong> (1): 283 - 298 (<strong>2013</strong>)
Toward Automatic Semantic Annotating and Pattern Mining for Domain Knowledge Acquisition<br />
Fig. 3: Question Examples in “Heart Diseases” category<br />
Fig.4: The extracted frequent patterns by different support values<br />
From a total of 19,622 question items, 10.3 words were allocated for each question on<br />
average. Using the proposed pattern extraction method, 56,118 structural patterns were finally<br />
extracted in total, indicating that 2.86 patterns for each sentence on average. With different<br />
values of the support threshold, the number of the extracted frequent patterns changed<br />
dramatically, and the distribution is shown in Fig. 4.<br />
Since it was difficult to find annotated knowledge resources in this domain as the training<br />
data, 100 sentences were randomly selected from the domain dataset and they were also<br />
manually annotated for this preliminary experiment. On these training data, the structural<br />
patterns and concepts were firstly extracted automatically by sentence labelling. After that, all<br />
the concepts and related semantic labels that are automatically annotated by the semantic bank<br />
and WordNet were randomly selected. The relations in the training data were also annotated<br />
and applied into the sentences where the matched patterns had been generated from. Based<br />
on the training data, there were a total of 272 structural patterns extracted. With regard to the<br />
pattern matching on all the other sentences in the whole dataset, 1,929 new concepts and 632<br />
relations were finally acquired in total, and the results are shown in Table 4. The preliminary<br />
<strong>Pertanika</strong> J. Sci. & Technol. <strong>21</strong> (1): 283 - 298 (<strong>2013</strong>)<br />
179
Tianyong Hao and Yingying Qu<br />
experiment showed that the proposed method could effectively extract knowledge by using<br />
the proposed semantic annotating and pattern mining method. With more training sentences<br />
involved, the number of knowledge pieces extracted from domain dataset could dramatically<br />
increase so as to enrich or even build a new domain knowledge base.<br />
TABLE 4: Extracted concepts and relations based on 100 training data<br />
Patterns extracted Sentences matched Concepts extracted Relations extracted<br />
272 1,297 1,929 632<br />
With relation learning based on the training data, the annotated relations and semantic<br />
bank are potentially desirable to be added into knowledge base. To represent them in a standard<br />
knowledge format, two formal knowledge representations - Resource Description Framework<br />
(RDF) and Web Ontology Language (OWL) - are applied. RDF is a family of World Wide Web<br />
Consortium (W3C) specifications, which were originally designed as a metadata model. It has<br />
come to be used as a general method for conceptual description or modelling of information.<br />
OWL is a family of knowledge representation languages for authoring ontologies, and is<br />
endorsed by W3C (Smith et al., 2004). In this study, the OWL Full was used as our knowledge<br />
representation method since it provides compatibility with RDF Schema.<br />
The annotated data, either in semantic bank or other relation representation ways, need to<br />
be transformed into OWL format. Therefore, a set of knowledge transformation rules (KTR)<br />
was defined for this purpose. KTR is an intermediate description logic language, which can<br />
be transformed into first-order logic. The involved semantic labels are converted using the<br />
following rule and the SubClassOf relation is then represented in OWL, as follows:<br />
KTR<br />
∀x, there exist [ x / concept ] →SubClassOf<br />
( concept , x)<br />
1 1<br />
OWL format <br />
<br />
<br />
In the same way, the unit annotation in semantic bank can be converted by the following<br />
rule into OWL. It is important to mention that the relation inside a semantic label is already<br />
converted using the previous rule. Therefore, the following rule only considers the sub-class<br />
outside the semantic labels.<br />
KTR<br />
∀y,<br />
there exist [ y HAVING concept / concept ]<br />
→ SubClassOf ( y, concept )<br />
1 2<br />
OWL format <br />
<br />
<br />
180 <strong>Pertanika</strong> J. Sci. & Technol. <strong>21</strong> (1): 283 - 298 (<strong>2013</strong>)<br />
2
Toward Automatic Semantic Annotating and Pattern Mining for Domain Knowledge Acquisition<br />
The context annotation in semantic bank is more complicated since the words inside a<br />
sentence are concordant. Thus, “restriction” was used to represent and the corresponding KTR<br />
was defined as follows:<br />
KTR<br />
OWL<br />
format<br />
∀∀ x y, there exist [ x HAVING concept / concept ]<br />
WITH [ y HAVING concept / concept ]<br />
3 4<br />
1 2<br />
→ SubClassOf ( x, concept ) with constraint : SubClassOf ( y, concept )<br />
...<br />
2 4<br />
<br />
<br />
<br />
<br />
<br />
<br />
<br />
Similarly, the relations can also be transformed into knowledge representation format. In<br />
this way, the extracted knowledge can be represented in a standard way automatically and can<br />
be applied to enrich domain knowledge base directly.<br />
CONCLUSION AND FUTURE WORK<br />
A novel method for automatic knowledge acquisition from domain texts is proposed in this<br />
paper. Taking “heart disperses” from Yahoo! Answers as the source domain corpus, this method<br />
makes use of Minipar to label sentences and extract structural patterns. A semantic bank is<br />
further proposed to annotate concepts regarding to sentence context based on WordNet to<br />
enhance the semantic representation. With regard to the pattern matching, the relations extracted<br />
from training data were applied to the previously extracted concepts. Thus, the concepts,<br />
annotated labels, and relations can be converted by knowledge transformation rules to enrich<br />
domain knowledge base automatically. As for further development, more experiments with<br />
larger dataset and evaluation/comparison of the performances of knowledge extraction will<br />
be taken into consideration in the future.<br />
REFERENCES<br />
Berwick, R. C., Abney, S. P., & Tenny, C. (1991). Principle-Based Parsing: Computation and<br />
Psycholinguistics. Kluwer Academic Publishers.<br />
Campbell, K., Das, A., & Musen, M. (1994). A Logical Foundation for Representation of Clinical Data.<br />
<strong>Journal</strong> of the American Medical Informatics Association, 1(3), <strong>21</strong>8-232.<br />
Cao, C. G. (2001). Medical Knowledge Acquisition From Encyclopedic Texts. LNCS, <strong>21</strong>01, 268-271.<br />
Berlin.<br />
<strong>Pertanika</strong> J. Sci. & Technol. <strong>21</strong> (1): 283 - 298 (<strong>2013</strong>)<br />
181
Tianyong Hao and Yingying Qu<br />
Carayannis, E. G. (2012). Knowledge Arbitrage, Serendipity, and Acquisition Formality: Their Effects<br />
on Sustainable Entrepreneurial Activity in Regions. IEEE Transactions on Engineering Management,<br />
58(3), 546-577.<br />
Carenini, G., & Moore, J. (1993). Using the UMLS Semantic Network as a Basis for Constructing a<br />
Terminological Knowledge Base: a preliminary report. In Proceedings of Annual Symposium on<br />
Computer Applica-tions in Medical Care, pp. 725-729.<br />
Dawoud, K., Qabaja, A., Shang Gao, Alhajj, R., & Rokne, J. (2012). Identifying Cancer Biomarkers by<br />
Knowledge Discovery From Medical Literature. In Proceeedings of IEEE International Conference<br />
on Computational Advances in Bio and Medical Sciences.<br />
Deng, H., & Han, J. (2012). Uncertainty Reduction for Knowledge Discovery and Information Extraction<br />
on the World Wide Web. Proceedings of the IEEE, <strong>Vol</strong>. 100, Issue: 9, pp. 2658-2674.<br />
Dependency grammar. (2012). Retrieved from http://en.wikipedia.org/wiki/Dependency_grammar/.<br />
Fan, J., Kalyanpur, A., Gondek, D. C., & Ferrucci, D. A. (2012). Automatic Knowledge Extraction From<br />
Documents. IBM <strong>Journal</strong> of Research and Development, 56(3.4), 5:1- 5:10.<br />
Firdaus, O. M., Suryadi, K., Govindaraju, R., & Samadhi, T. M. A. A. (2012). Medical Knowledge<br />
Sharing Guideline: A Conceptual Model. In Proceedings of International Conference on ICT and<br />
Knowledge Engineering, pp. 22- 26.<br />
Hao, T. Y., Ni, X. L., Quan, X. J., & Liu, W. Y. (2009). Automatic Construction of Semantic Dictionary<br />
for Question Categorization. <strong>Journal</strong> of Systemics, Cybernetics and Informatics, 7(6), 86-90.<br />
Hull, R., & Gomez, F. (1999). Automatic Acquisition of Biographic Knowledge From Encyclopedic<br />
Texts. Expert Systems with Applications, 16(3), 261-270.<br />
Minpar Evaluation. (2012). http://www.cs.ualberta.ca/~lindek/downloads.htm.<br />
OpenNLP. (2012). http://opennlp.sourceforge.net/projects.html.<br />
Smith, M. K., Welty, C., & McGuinness, D. L. (2004). OWL Web Ontology Language Guide. W3C.<br />
Tanaka, K., & Jatowt, A. (2010). Automatic Knowledge Acquisition from Historical Document Archives:<br />
Historiographical Perspective. LNCS, 6259, 161-172.<br />
TreeTagger. (2012). Retrieved from http://www.ims.uni-stuttgart.de/projekte/corplex/TreeTagger/.<br />
Wang, Y. M., Johanna, V., & Haase, P. (2006). Towards Semi-automatic Ontology Building Supported<br />
by Large-scale Knowledge Acquisition. In AAAI Fall Symposium On Semantic Web for Collaborative<br />
Knowledge Acquisition, <strong>Vol</strong>. FS-06-06, pp.70-77.<br />
WordNet. (2012). Retrieved from http://wordnet.princeton.edu/.<br />
Yahoo! Answers. (2012). Retrieved from http://answers.yahoo.com/.<br />
182 <strong>Pertanika</strong> J. Sci. & Technol. <strong>21</strong> (1): 283 - 298 (<strong>2013</strong>)
ISSN: 0128-7680 © <strong>2013</strong> <strong>Universiti</strong> <strong>Putra</strong> Malaysia Press.<br />
<strong>Pertanika</strong> J. Sci. & Technol. <strong>21</strong> (1): 183 - 192 (<strong>2013</strong>)<br />
SCIENCE & TECHNOLOGY<br />
<strong>Journal</strong> homepage: http://www.pertanika.upm.edu.my/<br />
Issues on Trust Management in Wireless Environment<br />
Abubakr Sirageldin*, Baharum Baharudin and Low Tang Jung<br />
Computer and Information Science Department, University Technology Petronas, Bandar Seri Iskandar,<br />
31750 Tronoh, Perak, Malaysia<br />
ABSTRACT<br />
Developing a trust management scheme in mobile computing environment is increasingly important,<br />
and the effective trust management model is a challenging task. Business, education, military, and<br />
entertainment have motivated the growth of ubiquitous and pervasive computing environments, which<br />
are always available due to the widespread of portable and embedded devices. Wireless and mobile<br />
computing are good example of ubiquitous and pervasive computing environments. Due to the uncertainty<br />
and mobility in such environments, the issue of trust has been regarded as an important security problem.<br />
Malicious nodes are a major threat to these networks; the trust system can monitor the behaviour of<br />
nodes and accordingly rewards well-behaved nodes and punishes misbehaving ones. At present, there<br />
are a lot of endeavours on the trust model of the pervasive computing environment. In this paper, a trust<br />
management framework for mobile computing is presented. The hybrid framework is based on a fusion<br />
of the support vector machine (SVM) and fuzzy logic system. From the results, it can be stated that the<br />
framework is effective, dynamic, lightweight, and applicable.<br />
Keywords: Trust management, support vector machine, fuzzy logic, membership, interaction, pervasive,<br />
recommendation, central node, relationship<br />
INTRODUCTION<br />
Due to the rapid growth in network and communication technology, and the widespread of various<br />
types of computing devices, and the constant availability of services, security, confidentiality<br />
and the reliability are required in such an environment. Devices interact, collect and transfer<br />
Article history:<br />
Received: 31 March 2012<br />
Accepted: 31 August 2012<br />
E-mail addresses:<br />
abubakrsirag@gmail.com (Abubakr Sirageldin),<br />
baharbh@petronas.com.my (Baharum Baharudin),<br />
lowtanjung@petronas.com.my (Low Tang Jung)<br />
*Corresponding Author<br />
information with simplicity, and minimal<br />
technical expertise without being previously<br />
introduced to each other. This necessitates a<br />
certain concept of security such as trust. In<br />
order to maintain a secure, dependable, and<br />
reliable environment, a smart security system<br />
without or with the least human participation is
Abubakr Sirageldin, Baharum Baharudin and Low Tang Jung<br />
needed. Therefore, both privacy and security challenges are confronting security professionals,<br />
because in such environments, a chance is available for bad intent entities to launch attacks to<br />
others easily (Mieso et al., 2010). The traditional security models are based on the integration<br />
of, authentication, authorization, and access control to provide a secure environment. These<br />
traditional solutions can be useful in wired infrastructures. However, they are not efficient in<br />
pervasive and wireless infrastructures due to the dynamic topology of the wireless network that<br />
changes quickly, and the scalability of the wireless networks needs to be considered as well<br />
(Boukerche et al., 2008). Many studies have been conducted in this field. The previous works<br />
used different methods to achieve the objectives of the trust management system, and these<br />
can be briefly summarized as the trust models based on Bayesian approach and probabilistic<br />
theory (Almenarez et al., 2011), and trust models based on fuzzy logic (Wenshuan et al., 2007),<br />
trust model based on Dempster-Shafer and the theory of evidence (Zeng et al., 2010), and some<br />
approaches based on game theory. Despite these previous efforts, the optimum solution has not<br />
been reached. In this paper, a combination of two methods is proposed to recover the limitations<br />
of the existing ones. In particular, a trust management scheme is proposed by implementing a<br />
fusion of support vector machine (SVM) and fuzzy logic. The main motivation of the proposed<br />
scheme in using SVM is to predict the optimal relationship values for approximation purpose.<br />
Those approximated values will then relate the fuzzy basis functions for uncertainty resolving<br />
purpose, and the inference rules are invited for evaluating the trustworthiness of the devices.<br />
The Previous Work<br />
Trust in pervasive computing environments has obtained wide attention and become a<br />
challenge, with both wireless and mobile networks growing in a complex way. Many solutions<br />
have been proposed to solve the issue. Among other, Wenshuan et al. (2007) proposed a trust<br />
framework for pervasive computing using statistical distribution. The framework is composed<br />
of three models, namely, trust, security, and a risk model to resolve the uncertainty problem.<br />
Meanwhile, Boukerche et al. (2008) proposed a security system based on the trust management<br />
model using linear functions. The model assigns credentials to nodes, updates private keys,<br />
calculates trustworthiness for a node, as well as presents authority policy and access rights.<br />
Dong et al. (2010) presented a lightweight multilevel trust management framework based on<br />
the Bayesian formalization to produce trust assessments based on direct and recommended<br />
interaction. Mieso et al. (2010) investigated their previous probabilistic trust management<br />
scheme, and identified the possibility of a device to choose another for interaction by assessing<br />
its trustworthiness according to the current interaction and recommendations. Similarly, Shuai<br />
et al. (2010) proposed a dynamic trust model using the Dempster-Shafer for the set hypothesis<br />
on trust evaluation based on the accumulation of evidence. The model expresses the relationship<br />
between entities as direct, indirect, and integrated trust. Using their model, anonymous object<br />
can participate in the interaction with other trusted parties without any central security control.<br />
Denko et al. (2008) proposed a model which utilizes probability distribution. The trust value<br />
is a probability of satisfactory interactions between any two neighbours. The distributed model<br />
uses filtering methods for recommendations. The weighting method is used for measuring the<br />
effect of time on the current behaviour of the devices. Wu (2011) proposed a Stable Group-<br />
184 <strong>Pertanika</strong> J. Sci. & Technol. <strong>21</strong> (1): 283 - 298 (<strong>2013</strong>)
Issues on Trust Management in Wireless Environment<br />
based trust Management Scheme by considering geographic position, analysing the mobility<br />
patterns of nodes, and evaluating the trustworthiness without relying on any specific networking<br />
architecture. Meanwhile, Rhymend et al. (2010) proposed an approach that utilizes fuzzy logic<br />
for different trust characteristic’s integration, whereby the trust values are calculated based<br />
on the interaction of the devices with the environment, and the model also uses a global data<br />
store point. Nonetheless, some drawbacks have been observed in the existing approaches;<br />
these include assuming transitivity of the trust, ignorance of the vagueness and uncertainty, and<br />
ignorance of the network traffic nature. Despite these previous efforts, an optimum solution has<br />
not been reached yet. In this work, a combination of two approaches is made using SVM to<br />
cope with network traffic nature and fuzzy logic as well as to cope with uncertainty problem.<br />
Accordingly, the model has shown the expected results.<br />
Trust Concept<br />
Trust concept occurs in many fields. The meaning of trust is tailored to its specific use in a<br />
particular application domain (Walt Yao, 2004). In computing, trust is an essential foundation<br />
for information security, where the security is concerned with the correct operations of<br />
software and hardware. The challenge of exploiting trust in computing lies in extending the<br />
use of trust based solutions. First to artificial entities such as software agents or subsystems,<br />
then to the human user’s subconscious choice (Punam et al., 2008). In Social, trust is often<br />
used by people in a very broad sense. Its interpretation depends on many issues such as past<br />
experiences, associated risks, recommendations from other parties, the reputation of the trusted<br />
parties, or even cultural background (Walt Yao, 2004 ). The basis of this form of trust lies in<br />
familiarity, bonds of friendship and common faith and values. In networks, the relationships<br />
among participating entities are extremely needed for reliability and security of the collaborative<br />
environment. In this context, trust is defined as a set of relations among entities that participate<br />
in a protocol. These relations are based on the evidence generated by the previous interactions<br />
of entities Jin-Hee et al. (2011). Based on the above discussions, some sources that assist the<br />
establishment of trust are discussed.<br />
Experience: The past record provides a good indication of future interactions. Depending<br />
on the knowledge recorded from the previous interactions, the degree of trust may either<br />
increase or decrease. Experiences can involve some trusted parties, and they may be as useful<br />
in recommendations.<br />
Recommendation: It is a third party evaluation, and it depends on its source. In real life,<br />
a recommendation is employed to assist decision-making in daily situations. It helps decision<br />
makers by providing evaluations from others.<br />
Reputation: is another popular mechanism that people employ to deal with unfamiliar<br />
parties. Similar to the recommendation, it does not require any prior experience with the party<br />
for a reputation to be used to infer trustworthiness (Walt Yao , 2004). Some previous research<br />
mentioned some features of trust such as exist on uncertain and risky environment, context<br />
dependent, requires previous knowledge and experience, quantitative, based on reputation and<br />
opinion, subjective, not necessarily transitive, asymmetric, and dynamic.<br />
<strong>Pertanika</strong> J. Sci. & Technol. <strong>21</strong> (1): 283 - 298 (<strong>2013</strong>)<br />
185
THE APPROACH AND METHODS<br />
Abubakr Sirageldin, Baharum Baharudin and Low Tang Jung<br />
In our approach, a centralized environment is considered. Each centre operates autonomously and<br />
collaborates with another centre, and takes the responsibility of disconnecting or establishing a<br />
connection, and evaluates the trustworthiness of each node. We have two types of trust, namely,<br />
direct trust (the history of interactions in the environment as motivated by Sanjeev et al., 2010)<br />
and others) and indirect trust (or recommendations, as motivated by Zhong et al. (2010), Trcek<br />
(2011) and others. In order to understand the model architecture in a simple way, let us consider<br />
the relationship between two nodes, namely, A and B. The trust of A to B is V A, B and the trust<br />
of B to A is V B, A, as shown in Fig.1. If A sends to B, and B sends to A, then the relationship is<br />
established, and values initiated. Each node has (N-1) relationships with the others. The total<br />
number of the relationships in the network is N*(N-1) relationship.<br />
Direct Trust Computation<br />
The previous interactions are taken under consideration in the context, such as the history<br />
of interactions H AB between A and B is computed numerically in the range [0, 1], based on<br />
satisfactory/ unsatisfactory interactions, and good/bad packets sent. Let Ps be the number of<br />
good packets, Pu is number of bad packets, S is the number of satisfactory interactions, and U<br />
is the number of satisfactory interactions, while S and U are calculated as:<br />
S<br />
P<br />
P P<br />
s =<br />
+<br />
(1)<br />
s u<br />
The history of interaction value, H, is:<br />
H =<br />
number of Satisfactory Interactions<br />
Total Number of Interactions<br />
For each node, the average of interactions {H1, H2, H3…Hm} with another node where m is<br />
the number of previous interactions that is computed as:<br />
m<br />
H = å H<br />
(3)<br />
average i=<br />
1 i<br />
Fig.1: The simple trust relation between nodes<br />
186 <strong>Pertanika</strong> J. Sci. & Technol. <strong>21</strong> (1): 283 - 298 (<strong>2013</strong>)<br />
(2)
Issues on Trust Management in Wireless Environment<br />
The average value then forms the relationship value. In a network of N nodes, each node<br />
has (N-1) relationships, the total number of relationships in the network is N*(N-1). Now, these<br />
relationships are forming an NxN matrix of real number. The rows are the values given to other<br />
nodes in the environment by node i, and the columns are the values given to node i by others.<br />
Where H i j denotes the history of interaction value for node i to node j, and the diagonal of the<br />
matrix H i i is the accumulated interaction values for the node, i.<br />
Indirect Trust Computation<br />
In fact, the recommendation is the history of interaction of a node in other environments. In<br />
this study, the average value of recommendations is used. Let R= {R 1, R 2, R 3…R k} be the set<br />
of K’s centre recommendations, then:<br />
R<br />
average<br />
=<br />
k<br />
∑ i=<br />
1<br />
k<br />
R<br />
i<br />
The average recommendation is the accumulated relationship value from outside the<br />
environment.<br />
The Hybrid Computation<br />
The previously mentioned matrix, which constructed by N*(N-1) relationships, is now the kernel<br />
trick matrix. The matrix is fed into the support vector machine for prediction purpose based on<br />
the relationship values. A suitable kernel trick function such as k(x,y)=() is used.<br />
Where the input data are the relationship values forming the kernel matrix. The SVM<br />
technique approximates the total value for each node according to the relationship values in<br />
the kernel matrix. The expensive calculations can be reduced by using a suitable kernel trick<br />
decision formula.<br />
n ⎡<br />
⎤<br />
f ( x)<br />
= sgn⎢∑<br />
yiαi.<br />
k(<br />
x,<br />
y)<br />
⎥<br />
⎣ i=<br />
1 ⎦<br />
The output results in a vector of N elements describe the predicted value for each node,<br />
and this vector contains values range in an interval [0 1]. These values imply fuzziness and<br />
uncertainty expression for evaluating trustworthiness of a node. Among the various fuzzy<br />
logic (MFs), the simple trapezoid MF is used to reduce execution overhead in order to make<br />
a lightweight model. The fuzzy sets designed for this model are VU, UT, TW, and VW, which<br />
represent Very Untrustworthy, Untrustworthy, Trustworthy, and Very Trustworthy, respectively.<br />
Therefore, there are a total of four MFs, as shown in Fig.2.<br />
<strong>Pertanika</strong> J. Sci. & Technol. <strong>21</strong> (1): 283 - 298 (<strong>2013</strong>)<br />
(4)<br />
(5)<br />
187
Crisp values<br />
Crisp values<br />
Abubakr Sirageldin, Baharum Baharudin and Low Tang Jung<br />
.5<br />
VU UT TW VW<br />
Input trust values Input trust values<br />
The trapezoid MF is described by four numerical parameters (a, b, c, and d), with d-c<br />
shoulder which is expressed by the following formula:<br />
⎧ ⎛ f ( x)<br />
− a d − f ( x)<br />
⎞<br />
f ( x,<br />
a,<br />
b,<br />
c,<br />
d)<br />
= max⎨min⎜<br />
, 1,<br />
⎟,<br />
0<br />
⎩ ⎝ b − a d − c ⎠<br />
The MF expression generates two crisp values in different MFs. The first value denoted as<br />
lower bound MF and the second denoted as upper bound MF. If the upper bound MF value is<br />
greater than the threshold value, the decision will then be upper bound MF, or else, the decision<br />
is the lower bound MF. The inference rules are playing a role in the final decision manifesto.<br />
Performance Evaluation<br />
In this section, the performance of the hybrid scheme SVM-Fuzzy is tested. In particular, the<br />
dynamic characteristic of the model is examined, while the values are collected perfectly. The<br />
data type is a real number, and the values are in a range [0 1]. Any connection request managed<br />
by the centre and all well-trusted nodes participate in the interaction without any obvious<br />
involvement of the centre. The completely new node implies constructing a new record on the<br />
environment, so the new identified node is verified by retrieving its record as recommendations<br />
from the other centres. In fact, the recommendation is the past interaction history of the new<br />
node in these environments. The centre will then validate the retrieved data for the purpose of<br />
establishing a connection with another node. The established connection is confirmed by that<br />
destination node. The values are dynamic and updated each time the record is altered.<br />
Parameter Setup: In the experimental zone, three parameters are used, namely, the<br />
relationship values, the recommended values, and the number of nodes in the network.<br />
Performance Metrics: The model used five metrics. The average relationship value H<br />
represents the statistical mean of relationship values, and the predicted value f(x) of kernel trick.<br />
The crisp value represents the trapezoid MF expression f(a,b,c,d), average recommendations,<br />
R, and the threshold value, T.<br />
The Results of the Experiments<br />
Fig.2: Trapezoid Fuzzy set membership functions<br />
The effective of SVM: the model is tested offline, and due to this circumstance, the data are<br />
arbitrary initiated in a range between 0 and 1. The number of nodes and the values of α are<br />
varied in order to study the performance of SVM.<br />
188 <strong>Pertanika</strong> J. Sci. & Technol. <strong>21</strong> (1): 283 - 298 (<strong>2013</strong>)<br />
⎫<br />
⎬<br />
⎭<br />
(6)
Trust Value<br />
MF-ID<br />
1<br />
0.8<br />
0.6<br />
0.4<br />
0.2<br />
0<br />
5<br />
4<br />
3<br />
2<br />
1<br />
0<br />
Issues on Trust Management in Wireless Environment<br />
Node-no<br />
<strong>Pertanika</strong> J. Sci. & Technol. <strong>21</strong> (1): 283 - 298 (<strong>2013</strong>)<br />
Average<br />
SVM<br />
Fig.3: The performance of SVM against basic Statistics (average)<br />
Node-no<br />
SVM-Fuzzy<br />
Fuzzy<br />
Fig.4: Comparison of SVM-Fuzzy against Fuzzy, the vertical axis 1, 2, 3, 4 represent the four MFs<br />
VU, UT, TW, VW, respectively.<br />
189
Abubakr Sirageldin, Baharum Baharudin and Low Tang Jung<br />
The significance of threshold value: In this experiment, the effectiveness of the fuzzy logic<br />
performance under different threshold values is argued.<br />
MF-ID<br />
6<br />
5<br />
4<br />
3<br />
2<br />
1<br />
0<br />
RESULTS AND DISCUSSION<br />
Node-no<br />
Fig.5: Fuzzy logic Performance<br />
190 <strong>Pertanika</strong> J. Sci. & Technol. <strong>21</strong> (1): 283 - 298 (<strong>2013</strong>)<br />
T=0.3<br />
T=0.5<br />
T=0.7<br />
The experiment went as expected without unusual input data that would have introduced errors.<br />
The input data were the real values in a range between 0 and 1. The type of the statistical method<br />
used has enforced the interaction observations to be in the above-mentioned range. Carefully, the<br />
SVM parameters were initialized, and the Gaussian function which led to the predicted values<br />
was used to avoid the the execution overhead of the kernel trick. Only one α was assumed for<br />
each data-range in the kernel matrix and the graph depicted in Fig.4 reveals the differences.<br />
Fig.3 shows the the performance of SVM and the modified values. This modification is almost<br />
under the general rules of the trust management policy. The adjustment was done to enhance<br />
the average calculation of the interaction history with a single node. In this study, an acceptable<br />
rate was chosen due to the relationship values. The result shows a good performance of SVM<br />
compared to the statistical average. As a part of this experiment, the predicted values were<br />
the input of the fuzzy expression, and the crisp values were accordingly calculated for each<br />
node. In this calculation, the values were assumed to be couple according to the trapezoid MF<br />
expression. The inference rules were applied to the couple under a predefined threshold value.<br />
The comparison between SVM-Fuzzy and Fuzzy (see Fig.5) is exactly different. In Fig.4, the<br />
vertical axes 1, 2, 3, 4 represent the four MFs VU, UT, TW, and VW, respectively. The results<br />
of the combined SVM-Fuzzy have been studied by comparing them with the performance of<br />
the Fuzzy logic alone under a threshold value T=0.5 before the optimization process.
Issues on Trust Management in Wireless Environment<br />
The threshold value is an administrative issue, and it should have been specified previously<br />
due to the policy. Fig.5 shows the results of different threshold values (T=0.3, T=0.5, T=0.7).<br />
Note that the threshold value is defined according to the trust policy in the entire network.<br />
Errors may arise when the relationship values are out of the range, and this indicates that the<br />
optimized value may not be precise for the entire range.<br />
Contributions<br />
The main contribution of the current work is the possibility of the use of automated hybrid<br />
SVM-fuzzy for trust management. In addition, the framework shows some advantages such as<br />
follows: first, it does not conflict with any security infrastructure in the environment; second,<br />
it is dynamic as the trust changes according to the activities of the node; third, it is protected<br />
against false recommendation that can be given by human; and finally, it lets the autonomous<br />
entities interact freely without security management overhead.<br />
CONCLUSION AND RECOMMENDATIONS FOR FUTURE WORK<br />
The issue of trust is really a challenge in ubiquitous and pervasive computing environments,<br />
especially for wireless and mobile networks. In this paper, the concept of trust has been presented<br />
and the basic of a controlled environment has also been explained. The framework is based<br />
on simple statistical methods which are used in interaction computation. Hence, a framework<br />
that integrates both the SVM and fuzzy system is proposed. Other than the trust frameworks,<br />
the importance of the central point, which is responsible of the trust calculation and evaluation<br />
process, have also been taken into consideration. In order to obtain a reliable recommendation,<br />
the central point request policy has been adopted. In addition, the framework has the capability<br />
of: (1) avoiding conflict with any security infrastructure in the environment, (2) dealing with<br />
the dynamic nature of trust, (3) giving protection against the false recommendation, and (4)<br />
avoiding security management overhead. A possible future work is the direction towards<br />
multidisciplinary approaches due to the complexities in the environments.<br />
REFERENCES<br />
Almenárez, F., Marín, A., Díaz, D., Cortés, A., Campo, C., & García-Rubio, C. (2011). Trust management<br />
for multimedia P2P applications in autonomic networking. Ad Hoc Networks, 9(4), 687-697.<br />
Bedi, P., & Gaur, V. (2008). Trust based prioritization of quality attributes. International Arab <strong>Journal</strong><br />
of Information Technology, 5(3), 223-229.<br />
Boukerche, A., & Ren, Y. (2008). A trust-based security system for ubiquitous and pervasive computing<br />
environments. Computer Communications, 31(18), 4343-4351.<br />
Denko, M. K., Sun, T., & Woungang, I. (2011). Trust management in ubiquitous computing: A Bayesian<br />
approach. Computer Communications, 34(3), 398-406.<br />
Deno, M. K., & Tao, S. (2008, 17-20 Dec. 2008). Probabilistic Trust Management in Pervasive<br />
Computing. Paper presented at the Embedded and Ubiquitous Computing, 2008. EUC ‘08. IEEE/<br />
IFIP International Conference.<br />
<strong>Pertanika</strong> J. Sci. & Technol. <strong>21</strong> (1): 283 - 298 (<strong>2013</strong>)<br />
191
Abubakr Sirageldin, Baharum Baharudin and Low Tang Jung<br />
Jin-Hee, C., Swami, A., & Ing-Ray, C. (2011). A Survey on Trust Management for Mobile Ad Hoc<br />
Networks. Communications Surveys & Tutorials, IEEE, 13(4), 562-583.<br />
Rhymend Uthariaraj, V., Valarmathi, J., Arjun Kumar, G., Subramanian, P., & Karthick, R. (2010). A Novel<br />
Trust Management Scheme Using Fuzzy Logic for a Pervasive Environment. In N. Meghanathan,<br />
S. Boumerdassi, N. Chaki & D. Nagamalai (Eds.), Recent Trends in Networks and Communications<br />
(<strong>Vol</strong>. 90, pp. 144-152): Springer Berlin Heidelberg.<br />
Sharma, S., Mishra, R., & Kaur, I. (2010, 9-11 July 2010). New trust based security approach for ad-hoc<br />
networks. Paper presented at the Computer Science and Information Technology (ICCSIT), 2010 3rd<br />
IEEE International Conference.<br />
Trcek, D. (2011). Trust Management in the Pervasive Computing Era. Security & Privacy, IEEE, 9(4),<br />
52-55.<br />
Wenshuan, X., Yunwei, X., & Guizhang, L. (2007, <strong>21</strong>-25 Sept. 2007). A Trust Framework for Pervasive<br />
Computing Environments. Paper presented at the Wireless Communications, Networking and Mobile<br />
Computing, 2007. WiCom 2007.<br />
Wu, X. (2011). A Stable Group–based Trust Management Scheme for Mobile P2P Networks. International<br />
<strong>Journal</strong> of Digital Content Technology and Its Applications, 5(2), February.<br />
Yao, W. (2004). Trust management for widely distributed systems. Technical report, UCAM-CL-TR-608.<br />
Retrieved from http://www.cl.cam.ac.uk/techreports/UCAM-CL-TR-608.pdf<br />
Zeng, S., Xu, F., Xin, Y., Yand, Y-X., & Hu, Z-M. (2010). Trust Model based on Dynamic Policy Similarity<br />
for pervasive Computing Environments. IEEE, 978-1-4244-6349.<br />
Zhong, D., Zhu, Y., Lei, W., Gu, J., & Wang Y. (2010). Multilevel Trust Management Framework for<br />
Pervasive Computing. Third International Conference on Knowledge Discovery and Data Mining.<br />
IEEE, 978-0-7695-3923.<br />
192 <strong>Pertanika</strong> J. Sci. & Technol. <strong>21</strong> (1): 283 - 298 (<strong>2013</strong>)
ISSN: 0128-7680 © <strong>2013</strong> <strong>Universiti</strong> <strong>Putra</strong> Malaysia Press.<br />
<strong>Pertanika</strong> J. Sci. & Technol. <strong>21</strong> (1): 193 - 204 (<strong>2013</strong>)<br />
SCIENCE & TECHNOLOGY<br />
<strong>Journal</strong> homepage: http://www.pertanika.upm.edu.my/<br />
A Negation Query Engine for Complex Query Transformations<br />
Rizwan Iqbal* and Masrah Azrifah Azmi Murad<br />
Faculty of Computer Science and Information Technology, <strong>Universiti</strong> <strong>Putra</strong> Malaysia, Serdang, Selangor,<br />
Malaysia<br />
ABSTRACT<br />
Natural language interfaces to ontologies allow users to query the system using natural language queries.<br />
These systems take natural language query as input and transform it to formal query language equivalent<br />
to retrieve the desired information from ontologies. The existing natural language interfaces to ontologies<br />
offer support for handling negation queries; however, they offer limited support for dealing with them.<br />
This paper proposes a negation query handling engine which can handle relatively complex natural<br />
language queries than the existing systems. The proposed engine effectively understands the intent of<br />
the user query on the basis of a sophisticated algorithm, which is governed by a set of techniques and<br />
transformation rules. The proposed engine was evaluated using the Mooney data set and AquaLog dataset,<br />
and it manifested encouraging results.<br />
Keywords: Natural language interfaces, ontology, semantic web, negation queries, search engines<br />
INTRODUCTION<br />
Many natural language interfaces have been developed to date. The concept of natural language<br />
interfaces is not new. Natural language interfaces were initially used for databases which<br />
allowed users to submit their queries in natural language instead of writing in SQL query<br />
format. Since the emergence of ontologies in the field of computer science, researchers have<br />
started developing interfaces for them. Natural language interfaces facilitate users to express<br />
their information needs in natural language that they are familiar with and can consequently<br />
Article history:<br />
Received: 31 March 2012<br />
Accepted: 31 August 2012<br />
E-mail addresses:<br />
mail.rizwaniqbal@yahoo.com (Rizwan Iqbal),<br />
masrah@fsktm.upm.edu.my (Masrah Azrifah Azmi Murad)<br />
*Corresponding Author<br />
populate knowledge bases.<br />
Depending upon the ability to process<br />
natural language input, natural language<br />
interface can be classified into two categories,<br />
namely full natural language interface and<br />
restricted natural language interface. Full<br />
natural language interfaces provide the ease of<br />
inputting a natural language query without any
Rizwan Iqbal and Masrah Azrifah Azmi Murad<br />
restriction of vocabulary, whereas restricted natural language interfaces contradict the former<br />
and restrict users to input a restricted vocabulary.<br />
Natural language interfaces work by converting natural language into formal semantic<br />
query (Tablan et al., 2008a). Different interfaces rely on distinct techniques and algorithms to<br />
translate natural language query into formal semantic query. Some natural language interfaces<br />
that support full natural language support are Semsearch (Lei et al., 2006), NLP-Reduce<br />
(Kaufmann et al., 2007), FREya (Damljanovic et al., 2010), QuestIO (Tablan et al., 2008b),<br />
Spark (Zhou et al., 2007), Q2Semantic (Wang et al., 2008) and NLION (Ramachandran &<br />
Krishnamurthi, 2009). Natural language interface that comes under the category of restricted<br />
natural language interfaces include Orakel (Cimiano et al., 2008), and AquaLog (Vanessa et<br />
al., 2007).<br />
Natural language queries with negation are a very usual and expected input from the user.<br />
In this study, Mooney dataset (MooneyData, 1994), which is widely applied for the evaluation<br />
of natural language interfaces and systems (Wang et al., 2007; Damljanovic et al., 2010;<br />
Tablan et al., 2008b; Kaufmann et al., 2006; Iqbal et al., 2012) was used. This dataset has a<br />
number of negation queries in it. This paper proposes a negation query handling engine, which<br />
effectively caters negation natural language queries. The proposed negation query handling<br />
engine supports full natural language rather than restricted language. The proposed engine<br />
effectively understands the intent of the user’s negation query on the basis of a sophisticated<br />
algorithm, which is governed by a set of techniques and transformation rules. The rest of this<br />
paper is organized as follows. Work related to the current study is discussed in the next section.<br />
Then, the motivation for the proposed negation query handling engine is discussed. Later<br />
sections cover the design, technical details and evaluation of the proposed engine. Finally, the<br />
paper is concluded by the conclusion and future work section.<br />
RELATED WORK<br />
All developed natural language interfaces differ from each other in one way or another. Some<br />
natural language interfaces focus on giving users the freedom of entering natural language<br />
query using free vocabulary (Lei et al., 2006), while others allow users to enter natural language<br />
query using a restricted vocabulary (Cimiano et al., 2008; Vanessa et al., 2007). Other than<br />
natural language interfaces, there are also interfaces that allow the user to search knowledge<br />
bases by inputting formal language queries. Such search engines are of two types; first is the<br />
form-based search engine, which provides web forms as a means of specifying queries (Rocha<br />
et al., 2004), and second is the RDF-based querying search engine which supports RDF-based<br />
querying languages at the front end (Rocha et al., 2004).<br />
SHOE (Heflin & Hendler, 2000) is an interface which comes in the category of form-based<br />
semantic search engine. This system is based on a semantic mark-up language. SHOE (Heflin &<br />
Hendler, 2000) allows users to define and associate vocabularies which can be understandable<br />
by the machines. The system uses knowledge annotator to add up SHOE annotations to the<br />
documents. Naive users often feel uncomfortable using SHOE as the web forms require<br />
familiarity with the knowledge bases being searched. On the other hand, adding annotations<br />
with SHOE is more time consuming as compared to standard XML.<br />
194 <strong>Pertanika</strong> J. Sci. & Technol. <strong>21</strong> (1): 283 - 298 (<strong>2013</strong>)
A Negation Query Engine for Complex Query Transformations<br />
Corese (Corby et al., 2004) search engine is from the category of RDF-based querying<br />
language fronted search engines. This search engine is dedicated to RDF metadata. The Corese<br />
engine internally works on the concept of conceptual graphs (CG). The query and the ontology<br />
schema are translated from RDF to conceptual graphs (CG) in order to perform matching<br />
operations. The limitation with such search systems is that they require the users to be familiar<br />
with both the knowledge base and the querying language used.<br />
The kind of interfaces that take a formal language query for input remains comparatively<br />
less preferred by users than the natural language query interfaces. The reason is the fact that<br />
users require training of the system as well as reasonable knowledge about the knowledge bases<br />
being searched. When talking about the systems that support natural language, SemSearch<br />
(Lei et al., 2006) is an interface that was designed to take input in natural language from the<br />
users. The system has idealized Google for the style of its interface. In particular, SemSearch<br />
(Lei et al., 2006) uses three heuristic operators to support its search. The use of these heuristic<br />
operators helps the system to have a clue of what information exactly the user wants from the<br />
knowledge bases. SemSearch relies on simple string matching algorithms rather than using<br />
complex techniques like WordNet (Fellbaum, 1998) in order to reduce the response time of<br />
the system. The use of the simple string matching algorithms reduces the response time but at<br />
the same time, it can be a reason for losing some good matches in certain situations.<br />
AquaLog (Vanessa et al., 2007) is a natural language based question-answering system.<br />
It takes input in the natural language query and answers on the basis of ontology loaded in<br />
the system. AquaLog has a learning mechanism in which it helps to improve the performance<br />
over time. Relation Similarity Service (RSS) is a component of AquaLog and it is considered<br />
as the backbone of the system. In case of any ambiguity between multiple terms, the RSS<br />
module directly interacts with the user to disambiguate between the terms of natural language<br />
and the concepts of the knowledge bases. The limitation with AquaLog is that it can at the<br />
most translate the query to two triples.<br />
QuestIO (Tablan et al., 2008b) is another natural language interface that was designed to<br />
take natural language input from the user. It was designed to cater language ambiguities, handle<br />
incomplete and grammatically incorrect queries. QuestIO focuses to be an open domain system<br />
that does not require any customization by the users, as well as any training to use it. This<br />
system uses light weight linguistic processing that allows the user’s text to be fully analyzed<br />
in the query processing part for the identification of ontology concepts and property names.<br />
QuestIO works by finding implicit relations which are not clearly stated in the user query. The<br />
limitation is that it only works with directly explored relations (Tablan et al., 2008b).<br />
The creators of QuestIO (Tablan et al., 2008b) later developed another natural language<br />
interface named FREya (Damljanovic et al., 2010). The focus of creating FREya was to further<br />
reduce customization efforts and to introduce clarification dialogues mechanism to avoid<br />
empty results. The clarification dialogue mechanism in FREya helps users to get answers<br />
in case the system is not able to find any answer (Damljanovic et al., 2010). If the system<br />
does not come up with an answer automatically, it will interact with the end users to get a<br />
clue for the right answer. The user’s selections are saved over time and the system learned<br />
to place correct suggestions on top of any similar query next time on the basis of the saved<br />
user selections. FREya reported satisfactory results for the learning mechanism in it but its<br />
<strong>Pertanika</strong> J. Sci. & Technol. <strong>21</strong> (1): 283 - 298 (<strong>2013</strong>)<br />
195
Rizwan Iqbal and Masrah Azrifah Azmi Murad<br />
correctness without clarification dialogues was considerably low as compared to other similar<br />
systems like PANTO (Wang et al., 2007) for the same data. Damljanovic et al. (2010) also<br />
reported that FREya was not able to answer some questions correctly while evaluating. The<br />
questions that were answered incorrectly included those with negation. PANTO (Wang et al.,<br />
2007) is another natural language interface that is portable and does not make any assumption<br />
about any specific knowledge domain. It functions in a way that it picks the words from the<br />
natural language query and map them to entities (concepts, instances, relations) in the ontology.<br />
The architecture of PANTO (Wang et al., 2007) relies on the existing tools like WordNet<br />
(Fellbaum, 1998) and different string metric algorithm. In PANTO, the Lexicon Builder<br />
automatically extracts ontological resources (Classes, Object and Datatype properties, Literals,<br />
Instances) from the ontology and constructs the Lexicon. The translator is the core processing<br />
engine of PANTO. It receives the processed natural language query from the parser as input<br />
and then performs operations to map the natural language entities to the ontological entities.<br />
PANTO uses an off the shelf parser which relies on limited NLP techniques, and this<br />
restricts the scope of queries which can be handled by the system (Wang et al., 2007). Wang<br />
et al. (2007) also discussed the limitation of PANTO in relation to the weakness in supporting<br />
complex user interactions. The current version of PANTO deals with superlative, comparative,<br />
conjunction and negation kind of queries. Nonetheless, PANTO has not discussed how<br />
effectively it can deal with the queries. PANTO discusses that it can handle negation queries<br />
including “not” and “no”. However, Wang et al. (2007) have not discussed in detail how<br />
effectively PANTO can deal with negation queries or what the precision of the system is in<br />
catering particularly with negation queries. From the literature, it is found that all systems have<br />
discussed about their supports for catering negation queries. Wang et al. (2007) mentioned that<br />
it could support negation queries but did not give any detail that to what extent and precision<br />
it could cater them. Damljanovic et al. (2010) discussed about catering negation cases, and<br />
explicitly mentioned that their system had failed to answer some questions correctly and<br />
amongst them were questions with negation.<br />
MOTIVATION FOR NEGATION QUERY HANDLING ENGINE<br />
After studying the trend in some natural language interfaces over the years, it is found that<br />
the state-of-art interfaces are particularly focusing on some specific features. Some of these<br />
features include portability (Wang et al., 2007), users’ interaction (Damljanovic et al., 2010),<br />
automated learning (Vanessa et al., 2007; Damljanovic et al., 2010), lesser customization<br />
(Lei et al., 2006), detecting and resolving the ambiguity in natural language (Lei et al., 2006)<br />
and precision in understanding the complexity of the natural language query (Wang et al.,<br />
2007; Tablan et al., 2008a). For a natural language interface to be effective for the user, it is<br />
very critical for it to understand the complexity of the natural language query inputted by the<br />
user. Over the years, researchers have improved from simple string matching algorithms to<br />
advance natural language processing engines which are designed to understand the complexity<br />
of natural language.<br />
It was found that natural language interfaces have the capability to deal with different types<br />
of queries such as instance superlative, comparative, conjunction and negation. Systems like<br />
196 <strong>Pertanika</strong> J. Sci. & Technol. <strong>21</strong> (1): 283 - 298 (<strong>2013</strong>)
A Negation Query Engine for Complex Query Transformations<br />
PANTO (Wang et al., 2007) and FREya (Damljanovic et al., 2010) have discussed negation<br />
queries. In particular, PANTO has given no details about the extent, details and precision for<br />
which it can handle the negation queries. FREya only discussed that the system was not able<br />
to answer some questions correctly and amongst them were questions with negation. Natural<br />
language queries with negation are very usual and expected input from the user. A review<br />
of relevant literature has shown that the Mooney dataset (MooneyData, 1994) and AquaLog<br />
dataset (AquaLogData, 2007) are widely used for the evaluation of natural language interfaces<br />
(Wang et al., 2007; Damljanovic et al., 2010; Tablan et al., 2008a; Kaufmann et al., 2007).<br />
These datasets have negation queries in them.<br />
A natural language interface with the capability to handle negation queries must be able<br />
to correctly interpret the intent of the user’s query to its equivalent formal query language. In<br />
order to correctly interpret the intent of the user’s query, the natural language interface cannot<br />
just rely on simple keyword detection and simple string matching algorithms. An effective<br />
negation handling interface must have a sophisticated algorithm that is governed by a set of<br />
rules. These rules should give a deeper insight into the natural language interface about the<br />
negation query under consideration. An in-depth understanding of the negation query will<br />
facilitate the interface to make appropriate transformations of natural language query to its<br />
equivalent formal query language, keeping intact the intent of the user.<br />
The absence of such an algorithm focusing to handle negation queries has become a<br />
motivation for this research. This research came up with a negation query handling engine<br />
which incorporates an algorithm that has been particularly designed to cater negation queries<br />
in an effective manner. The next section discusses the design of negation query handling<br />
engine in detail.<br />
THE DESIGN OF NEGATION QUERY HANDLING ENGINE<br />
The negation query handling engine was designed to cater effective machine level transformation<br />
for the natural language query entered by the user. The engine was designed to perform some<br />
processes in a sequential manner. There is also a set of natural language query transformation<br />
rules which are implemented according to the structure of the natural language query entered<br />
by the user. Fig.1 shows how the negation query handling engine works.<br />
The processes performed by the negation query handling engine<br />
The negation query handling engine performs three processes on the natural language query<br />
entered by the user. The first process identifies the negation keywords in the natural language<br />
query. The second process is responsible to identify the coordinating conjunctions in the<br />
natural language query structure. The final process is responsible to make sure that the natural<br />
language keywords are correctly mapped to the corresponding ontological resources (Classes,<br />
Object and Datatype properties, Literals, Instances) and the machine level transformations are<br />
correctly carried out.<br />
<strong>Pertanika</strong> J. Sci. & Technol. <strong>21</strong> (1): 283 - 298 (<strong>2013</strong>)<br />
197
Identification of negation keywords<br />
Rizwan Iqbal and Masrah Azrifah Azmi Murad<br />
This process deals with the identification of negation keywords. The engine intelligently<br />
identifies keywords with a broad coverage in the aspect of negation. Some previous systems<br />
like PANTO (Wang et al., 2007) suffer limited support for negation queries. In particular,<br />
PANTO handles those queries including “not” and “no”. This engine was designed to handle<br />
several kinds of queries including those with does not/ do not/ don’t/ excluding/ except/ leaving/<br />
none/ and other than. The proposed engine also has provision to handle affirmative-negative<br />
and affirmative-negative-pseudorel type of queries, whereby such queries can be found in the<br />
AquaLog data set (AquaLogData, 2007). In addition, the proposed engine does not only identify<br />
negation keywords but also makes appropriate transformations from the natural language to<br />
formal query language (like SPARQL) keeping in integrity the negation sense of the user query.<br />
Detection of coordinating conjunctions<br />
Fig.1: Negation query handling engine<br />
After the occurrence of negation keywords, the engine looks for coordinating conjunctions in<br />
the natural language query. Coordinating conjunctions include for, and, nor, but, or, yet, so.<br />
If a coordinating conjunction is detected, only the keywords before it will be considered for<br />
198 <strong>Pertanika</strong> J. Sci. & Technol. <strong>21</strong> (1): 283 - 298 (<strong>2013</strong>)
A Negation Query Engine for Complex Query Transformations<br />
query formation. The occurrence of a coordinating conjunction depicts that the query has more<br />
than one condition in it. For example, if the Mooney dataset (MooneyData, 1994) which is<br />
used as a test data for many natural language interfaces to ontologies is considered, it is found<br />
that there are many queries in it which have more than one condition in them. The existence<br />
of more than one condition in the user’s query makes query transformation a complex task<br />
especially when handling negation queries.<br />
Identification of ontological resources and natural language query transformation<br />
This process deals with the identification of ontological resources. After the identification<br />
of ontological resources (Classes, Object and Datatype properties, Literals, Instances), the<br />
engine performs the transformation of natural language query to its formal query language<br />
equivalent. The engine ensures that the transformation is in alignment with the viewpoint of<br />
the user. The natural language query transformation rules were designed on the basis of some<br />
rules. These rules have been found to be satisfying the negation queries within the Mooney<br />
dataset (MooneyData, 1994) and AquaLog dataset (AquaLogData, 2007).<br />
The natural language query transformation rules<br />
The negation query handling engine transforms natural language query to formal query language<br />
on the basis of some rules. These rules are applied to the natural language query, depending on<br />
the detection of certain scenarios. These rules give an insight into the engine about the intent<br />
of the user query and actions which should be applied on the user’s query for transforming it<br />
into the formal query language equivalent. These rules were tested on the Mooney dataset and<br />
AquaLog dataset, and encouraging results were seen while performing the query transformation.<br />
Table 1 shows some query transformation rules.<br />
Step-by-step processing of the natural language query<br />
The negation query handling engine performs step-by-step operation on the natural language<br />
query inputted by the user. The operations on the natural language query can handle a negation<br />
query with two possible cases. The first case deals with explicit negation words like not/ do<br />
not/ don’t/ excluding/ except/ leaving/ none. The second case deals with affirmative-negative<br />
and affirmative-negative-pseudorel type of queries. Below is the step-by-step processing for<br />
the first case.<br />
1. A negation keyword is detected in the user’s query.<br />
2. After detecting the negation keyword, the engine looks for a coordinating conjunction.<br />
3. If a coordinating conjunction is found, only the keywords before it are considered<br />
for query transformation; otherwise, all the keywords are considered for the query<br />
transformation.<br />
4. The engine tries to map the literals and instances from the knowledge base to the<br />
keywords in the user’s query.<br />
5. If the engine fails to find an appropriate match for a literal or an instance, it is then<br />
expected that a data or object be detected.<br />
<strong>Pertanika</strong> J. Sci. & Technol. <strong>21</strong> (1): 283 - 298 (<strong>2013</strong>)<br />
199
TABLE 1: Query transformation rules<br />
Rules Actions<br />
Coordination<br />
conjunction detected.<br />
Coordination<br />
conjunction is not<br />
detected.<br />
Literal or instance is<br />
not detected.<br />
Literal or instance is<br />
detected.<br />
Is/ Does/ Has is<br />
detected at the<br />
beginning of the<br />
Query.<br />
Rizwan Iqbal and Masrah Azrifah Azmi Murad<br />
The query transformation is not based on a single step. The keywords<br />
before the coordinating conjunction are considered for the first step of the<br />
natural query transformation. The remaining part of the natural query is<br />
treated as the second part of a query transformation. After the completion<br />
of the transformation for the first part of the query, the remaining part<br />
of the query will be treated as a different part and all the transformation<br />
processes will be performed from the beginning.<br />
The query transformation is a single step. All the keywords in the<br />
natural language query are considered for the natural language query<br />
transformation.<br />
The natural language query refers to an object or data property. Matching<br />
algorithms are run to find the appropriate matches for the object or data<br />
property from a list of ontological resources.<br />
The natural language query has detected a literal or an instance. The next<br />
step is to find the associated data or object property with the detected<br />
literal or instance from a list of ontological resources.<br />
This is the condition that deals with affirmative-negative and affirmativenegative-pseudorel<br />
type of queries. The next step is to detect an instance<br />
in between Is/ Does/ Has and "?" in the query. If an instance is detected,<br />
all the keywords (excluding Is/ Has/ Does) and the instance will then be<br />
matched to find the best match for object property associated with the<br />
instance.<br />
6. Transformations are based on some predefined rules, depending whether a literal/<br />
instance or a data/object property is detected.<br />
7. If there is a coordinating conjunction detected at step 3, all the steps will be repeated<br />
for the remaining part of the query.<br />
The step-by-step processing for the second case is as below.<br />
1. Is/ Does/ Has is detected at the beginning of the query which ends with a “?”.<br />
2. The next step is to look for an instance after the words Is/ Does/ Has.<br />
3. If an instance is found, the next step is to find an object property.<br />
4. Matching is performed by the algorithm, which excludes Is/ Does/ Has, and<br />
the instance is to find the best match for the object property associated with the<br />
instance.<br />
5. Transformations are performed based on some predefined rules and templates.<br />
EVALUATION OF NEGATION QUERY HANDLING ENGINE<br />
The designed negation query handling engine is evaluated using the negation queries in the<br />
Mooney dataset (MooneyData, 1994) and Aqualog dataset (AquaLogData, 2007). The Mooney<br />
data set included a total of 88 negation queries. There are 74 negation queries in the job Mooney<br />
dataset and 14 negation queries in the geography Mooney dataset. There are a total 24 negation<br />
queries in the Aqualog dataset. The Aqualog dataset has divided these negation queries into<br />
200 <strong>Pertanika</strong> J. Sci. & Technol. <strong>21</strong> (1): 283 - 298 (<strong>2013</strong>)
A Negation Query Engine for Complex Query Transformations<br />
three different categories. The category names are affirmative-negative, affirmative-negativepseudorel<br />
and negation. The designed algorithm of the negation query handling engine correctly<br />
transformed 72.7% of the negation queries in the Mooney dataset and 41.6% of the negation<br />
queries in the Aqualog data set to their formal query language equivalent. Table 2 and Fig.2<br />
show the evaluation of the proposed algorithm.<br />
The designed algorithm of the negation query handling engine manifested encouraging<br />
results for the negation queries in the Mooney dataset and AquaLog dataset. All the negation<br />
queries in the Mooney dataset and AquaLog data set were parsed through the algorithm of the<br />
proposed negation query handling engine. Below are some examples of how every query with<br />
negation is individually parsed and the proposed algorithm is evaluated.<br />
Sample Query 1 (Job Mooney data set): “Are there ada jobs outside austin?”<br />
Refer to Fig.3 for details of the sequence of processing natural language in the proposed<br />
negation query handling engine.<br />
Step 1 : Negation keyword detected: outside.<br />
Step 2 : Coordinating conjunction not detected. According to the transformation rules,<br />
all the words in the natural language query will be considered for formal language query<br />
transformation (SPARQL).<br />
Step 3 : Instances are detected: “ada” and “austin”. According to the query transformation<br />
rules (Table 2) if a literal or an instance is detected, the next step is to find the associated<br />
data or object property with the detected literal or an instance from the list of ontological<br />
resources.<br />
Step 4 : The negation query handling engine will look for the object properties associated<br />
with the instances. The engine will find the associated object properties associated with<br />
TABLE 2: Results obtained for query transformation<br />
Dataset Total negation<br />
queries<br />
No of queries correctly<br />
transformed to formal query<br />
language<br />
Mooney 88 64 72.7%<br />
Aqualog 24 10 41.6%<br />
Fig.2: Query transformation results<br />
<strong>Pertanika</strong> J. Sci. & Technol. <strong>21</strong> (1): 283 - 298 (<strong>2013</strong>)<br />
% of queries correctly<br />
transformed to formal query<br />
language<br />
201
Rizwan Iqbal and Masrah Azrifah Azmi Murad<br />
“ada” and “austin”. As for “ada”, the system will locate “useslanguage” and for “austin”,<br />
the system will recognize “isinCity”.<br />
Step 5: The selected object properties are set into pre-defined template in SPARQL in a<br />
specified format. The basic format is as below. The selected object property is set in the<br />
following sequence of triple.<br />
?subject name of selected property?Var<br />
FILTER(?Var!=(name of instance or literal))<br />
In the case of the exampled query, the exact query transformation in SPARQL will be in<br />
the following format. The negation query handling engine will intelligently identify the intent<br />
of the user in the negation sense and will place a “!” in the filter part of the SPARQL query. In<br />
the case of the example query, the “?City!=p1:austin” means to exclude all those jobs which<br />
are not in “Austin” city.<br />
SELECT ?subject ?Lang ?City<br />
WHERE{?subject a p1:ITJob.<br />
?subject p1:usesLanguage ?Lang.<br />
?subject p1:isInCity ?City.}<br />
FILTER(?Lang=p1:ada && ?City!=p1:austin).<br />
CONCLUSION AND RECOMMENDATIONS FOR FUTURE WORK<br />
This paper has proposed a negation query handling engine that was specifically designed for<br />
handling negation queries. The designed negation query handling engine was evaluated using<br />
the Mooney dataset (MooneyData, 1994) and AquaLog dataset (AquaLogData, 2007). It<br />
was found that the proposed negation query handling engine correctly transformed 72.7% of<br />
Mooney dataset and 41.6% of AquaLog dataset negation queries to their formal query language<br />
equivalent. The proposed engine demonstrated encouraging results. Hence, it is a step forward<br />
towards an effective handling of complex natural language query transformations.<br />
It is an intention for the future to further improve the algorithm so as to bring more<br />
correctness in the negation query transformations. An evaluation of the proposed engine on other<br />
datasets may also lead to new insights, which can be incorporated in the existing algorithm of<br />
the negation query handling engine to make it more effective and robust in handling negation<br />
queries.<br />
202 <strong>Pertanika</strong> J. Sci. & Technol. <strong>21</strong> (1): 283 - 298 (<strong>2013</strong>)
REFERENCES<br />
A Negation Query Engine for Complex Query Transformations<br />
Fig.3: The step-by-step processing of the natural language query<br />
AquaLogData. (2007). Retrieved from http://kmi.open.ac.uk/technologies/aqualog/examples.html<br />
Cimiano, P., Haase, P., Heizmann, J., Mantel, M., & Studer, R. (2008). Towards portable natural language<br />
interfaces to knowledge bases - The case of the ORAKEL system. Data and Knowledge Engineering,<br />
65, 325-354.<br />
Corby, O., Dieng-Kuntz, R., & Faron-Zucker, C. (2004). Querying the Semantic Web with the corese<br />
search engine. 16th European conference on Artificial Intelligence (ECAI-2004), 705-709.<br />
Cohen, W. W., Ravikumar, P., & Fienberg, S. E. (2003). A Comparison of String Distance Metrics for<br />
Name-Matching Tasks. Workshop on information integration on the Web (IIWeb-03), 73-78.<br />
Damljanovic, D., Agatonovic,M., & Cunningham, H. (2010). Natural Language interface to ontologies:<br />
Combining syntactic analysis and ontology-based lookup through the user interaction. European<br />
Semantic Web Conference (ESWC 2010), 106-120.<br />
Fellbaum, C. (1998). WORDNET: An Electronic Lexical Database. MIT Press, 1998.<br />
<strong>Pertanika</strong> J. Sci. & Technol. <strong>21</strong> (1): 283 - 298 (<strong>2013</strong>)<br />
203
Rizwan Iqbal and Masrah Azrifah Azmi Murad<br />
Heflin, J., & Hendler, J. (2000). Searching the web with SHOE. Workshop on AI for Web Search (AAAI-<br />
2000).<br />
Iqbal, R., Murad, M. A. A., Selamat, M. H., & Azman, A. (2012). Negation query handling engine for<br />
natural language interfaces to ontologies. International Conference on Information Retrieval and<br />
Knowledge Management (CAMP’12), 249-253.<br />
Kaufmann, E., Bernstein, A., & Fischer, L. (2007). Nlp-Reduce: A “naïve” but domain independent<br />
natural language interface for querying ontologies. European Semantic Web Conference (ESWC 2007).<br />
Kaufmann, E., Bernstein, A., & Zumstein, R. (2006). Querix: A Natural Language Interface to Query<br />
Ontologies Based on Clarification Dialogs. International Semantic Web Conference (ISWC 2006),<br />
Springer, 980-981.<br />
Lei,Y., Uren, V., & Motta, E. (2006). Semsearch: a search engine for the semantic web. Managing<br />
Knowledge in a World of Networks, 4248, 238-245.<br />
Motro, A. (1986). Constructing queries from tokens. SIGMOD international conference on Management<br />
of data (SIGMOD ‘86), 120-131.<br />
MooneyData. (1994). Retrieved from http://www.cs.utexas.edu/users/ml/nldata.html.<br />
Rocha, C., Schwabe, D., & de Aragao, M. (2004). A Hybrid Approach for Searching in the Semantic<br />
Web. 13 th International conference on World Wide Web (WWW’04), 374-383.<br />
Ramachandran, V. A., & Krishnamurthi, I. (2009). NLION: Natural Language interface for querying<br />
ontologies. 2 nd Bangalore Annual Compute Conference (COMPUTE’ 09), 1-4.<br />
Tablan,V., Damljanovic, D., & Bontcheva, K. (2008a). A natural language query interfaceto structured<br />
information. 5 th European semantic web conference on The semantic web: research and applications<br />
(ESWC’08), Springer Berlin/Heidelberg, LNCS, 50<strong>21</strong>, 361–375.<br />
Tablan, V., Damljanovic, D., & Bontcheva, K. (2008b). A natural language query interface to structured<br />
information. European Semantic Web Conference (ESWC 2008), 361-375.<br />
Vanessa, L., Victoria, U., Motta, E., & Michele, P. (2007). AquaLog: an ontology-driven question<br />
answering system for organizational semantic intranets. <strong>Journal</strong> of Web Semantics, 5, 72–105.<br />
Wang, H., Zhang, K., Liu, Q., Tran, T., & Yu, Y. (2008). Q2semantic: A lightweight keyword interface<br />
to semantic search. European Semantic Web Conference (ESWC ‘08), 584–598.<br />
Wang, C., Xiong, M., Zhou, Q., & Yu, Y. (2007). PANTO: A Portable Natural Language Interface to<br />
Ontologies. European Semantic Web Conference (ESWC ‘07), 473-487.<br />
Zhou, Q., Wang, C., Xiong, M., Wang, H., & Yu, Y. (2007). Spark: Adapting keyword query to semantic<br />
search. International Semantic Web Conference (ISWC)/Asian Semantic Web Conference (ASWC),<br />
694-707.<br />
204 <strong>Pertanika</strong> J. Sci. & Technol. <strong>21</strong> (1): 283 - 298 (<strong>2013</strong>)
ISSN: 0128-7680 © <strong>2013</strong> <strong>Universiti</strong> <strong>Putra</strong> Malaysia Press.<br />
<strong>Pertanika</strong> J. Sci. & Technol. <strong>21</strong> (1): 205 - <strong>21</strong>6 (<strong>2013</strong>)<br />
SCIENCE & TECHNOLOGY<br />
<strong>Journal</strong> homepage: http://www.pertanika.upm.edu.my/<br />
Modified Multi-Class Classification using Association Rule Mining<br />
Yuhanis Yusof* and Mohammed Hayel Refai<br />
School of Computing, UUM College of Arts and Sciences, <strong>Universiti</strong> Utara Malaysia, 06010 Sintok, Kedah,<br />
Malaysia<br />
ABSTRACT<br />
As the amount of document increases, automation of classification that aids the analysis and management<br />
of documents receive focal attention. Classification, based on association rules that are generated from<br />
a collection of documents, is a recent data mining approach that integrates association rule mining<br />
and classification. The existing approaches produces either high accuracy with large number of rules<br />
or a small number of association rules that generate low accuracy. This work presents an association<br />
rule mining that employs a new item production algorithm that generates a small number of rules and<br />
produces an acceptable accuracy rate. The proposed method is evaluated on UCI datasets and measured<br />
based on prediction accuracy and the number of generated association rules. Comparison is later made<br />
against an existing classifier, Multi-class Classification based on Association Rule (MCAR). From the<br />
undertaken experiments, it is learned that the proposed method produces similar accuracy rate as MCAR<br />
but yet uses lesser number of rules.<br />
Keywords: Classification, association rule, rule mining, rule production, data mining<br />
INTRODUCTION<br />
The availability of high performance computers, data collection tools and huge memory<br />
capacities has made gathering and saving huge quantities of data possible. For example,<br />
the number of sales transactions executed during one year in a large retail supermarket<br />
such as Carrefour is numerous and the amount of data on the World Wide Web (WWW) is<br />
extremely massive as well. This vast growth of stored databases provides an opportunity for<br />
new automated intelligent data analysis methods that summarizes information from these<br />
Article history:<br />
Received: 31 March 2012<br />
Accepted: 31 August 2012<br />
E-mail addresses:<br />
yuhanis@uum.edu.my (Yuhanis Yusof),<br />
mohammdrefai@yahoo.com (Mohammed Hayel Refai)<br />
*Corresponding Author<br />
databases. The process of generating this<br />
useful knowledge is accomplished using<br />
data mining techniques. Liu et al. (1998)<br />
define data mining as one of the primary steps<br />
in Knowledge Discovery from Databases<br />
(KDD), which finds and generates useful
Yuhanis Yusof and Mohammed Hayel Refai<br />
hidden knowledge from large databases.<br />
Classification using Association (CuA), which is also known as associative classification,<br />
is a research field in data mining that integrates association rule discovery and classification.<br />
CuA utilises association rule to discover knowledge and to select a subset of which to build<br />
the classifier (Thabtah et al., 2010a). The main goal for CuA is to construct a classifier based<br />
on the identified knowledge from labelled input. This model is later used to predict the class<br />
attribute for a test data case (Baralis et al., 2008).<br />
In the last few years, several CuA algorithms have been developed such as CPAR (Yin<br />
& Han, 2003), Live and Let Live (L 3 G) (Baralis et al., 2004), MCAR (Thabtah et al., 2005),<br />
CACA (Tang & Liao, 1998), BCAR (Yoon & Lee, 2008) and others. These research studies<br />
have shown that the approach produces better classifiers (in terms of accuracy) compared to<br />
traditional classification data mining approaches like probabilistic (Meretakis & Wuthrich,<br />
1999) and decision tree (Quinlan, 1998). Nevertheless, the CuA algorithm suffers from<br />
exponential growth of rules, i.e. they derive large numbers of rules which make the resulting<br />
classifiers being outsized and consequently limit their uses since decision makers face difficulty<br />
in understanding and maintaining a large set of rules.<br />
In this work, an algorithm named “Modified Multi-class Classification using Association<br />
Rule Mining” (MMCAR) is proposed to reduce the number of rules produced by association<br />
rule based algorithms. The proposed MMCAR is developed based on the existing approaches<br />
of CuA. Nevertheless, MMCAR employs a new rule production algorithm which results in<br />
only relevant rules being used to predict test cases. The training method of MMCAR scans<br />
training data sets only once (Thabtah et al., 2005) and the class assignment (prediction) method<br />
makes a group of rule prediction instead of utilising only a single rule.<br />
Different datasets from the UCI repository (Merz & Murphy, 1996) have been utilised to<br />
evaluate the proposed learning algorithm and to compare it with other traditional data mining<br />
classification techniques, including decision tree (C4.5) (Quinlan, 1993), greedy classification<br />
(RIPPER) (Cohen, 1995), and MCAR (Thabtah, 2005). The measures used in the experiments<br />
for comparison are the prediction accuracy and the number of rules derived.<br />
The paper is structured as follows: The problem of CuA and its related works are presented<br />
in CLASSIFICATION USING ASSOCIATION. The proposed algorithm is discussed in<br />
MATERIAL AND METHODS. Datasets and the experiments of using different classification<br />
algorithms are demonstrated in RESULTS AND DISCUSSION, while conclusions and<br />
suggestions for further research work are given in CONCLUSIONS.<br />
CLASSIFICATION USING ASSOCIATION<br />
CuA is a case of association rule discovery, in which the rule on the right hand side (consequent)<br />
is the class label, and the rule on the left hand side (antecedent) is attribute values. Thus, for<br />
the rule R: X ⇒ Y , (X) is a conjunction of attribute values, and (Y) is the class attribute.<br />
The ultimate goal of CuA is to extract a complete set of rules which is normally called<br />
class association rules (CARs) from the training dataset.<br />
206 <strong>Pertanika</strong> J. Sci. & Technol. <strong>21</strong> (1): 283 - 298 (<strong>2013</strong>)
The Problem<br />
Association Rule Mining<br />
In the definition of the CuA problem, we employ by Thabtah (2005). Let T be the input training<br />
dataset with k different attributes A 1, A 2, … , A k and L is a set of class labels. A specific attribute<br />
value for A i is represented by a i, and the class labels of L are represented l j.<br />
Definition 1: An AttributeValue (A i, a i) is combination of between 1 and k different attributes<br />
values, e.g. < (A 1, a 1)>, < (A 1, a 1), (A 2, a 2)>, (A 1, a 1), (A 2, a 2), (A 3, a 3)>, …, etc.<br />
Definition 2: A class association rule (CAR) is given in the following format:<br />
( Ai1, ai1)<br />
∧ ( Ai<br />
2 , ai<br />
2 ) ∧ ... ∧ ( A1k<br />
, aik<br />
) → li<br />
, where the antecedent is a conjunction of AttributeValues<br />
and the consequent is a class.<br />
Definition 3: The frequency (freq) of a CAR in T is the number of cases in T that matches r’s<br />
antecedent.<br />
Definition 4: The support count (suppcount) of a CAR is the number of cases in T that matches<br />
r’s antecedent and belongs to a class l i for r.<br />
Definition 5: A CAR (r) passes the minsupp if for r, suppcount(r)/ |T| ≥ minsupp, where |T| is<br />
the number of cases in T.<br />
Definition 6: A CAR (r) passes minconf if suppcount(r) /freq(r) ≥ minconf.<br />
CuA Main Steps<br />
Fig.1 depicts the main steps used in CuA. The first step involves the discovery of frequent<br />
item set. This requires methods that find complete set of the frequent items by separating those<br />
that are potentially frequent and determine their frequencies in the training dataset (step 1). A<br />
rule will be produced if an item set exceeds the Minconf threshold value. The rule will be in<br />
the form of X → l , where l is the largest frequency class associated with X in the training<br />
dataset (Step 2). In step 3, a selection of an effective subset of rules ordering is performed using<br />
various procedures, while the quality of the selected subset is measured on an independent<br />
(test) data set in step 4.<br />
Fig.1: Main Steps in CuA (adopted from Thabtah, 2005)<br />
<strong>Pertanika</strong> J. Sci. & Technol. <strong>21</strong> (1): 283 - 298 (<strong>2013</strong>)<br />
207
Yuhanis Yusof and Mohammed Hayel Refai<br />
To explain the CuA discovery of rules and classifier development, consider data shown<br />
in Table 1. The table consists of two attributes, A 1 (a 1, b 1, c 1) and A 2 (a 2, b 2, c 2), and two class<br />
labels (l 1, l 2). Assume that Minsupp = 30% and Minconf = 80%, the frequent one, and two<br />
items for data depicted in Table 1 are shown in Table 2, along with the associated support and<br />
confidence values. The frequent items (in bold) in Table 2 denote those that pass the confidence<br />
and support thresholds, which are later converted into rules. Finally, the classifier is constructed<br />
using a subset of these rules.<br />
The support threshold is the key to success in CuA. However, for certain applications, rules<br />
with large confidence value are ignored because they do not have enough support. Traditional<br />
CuA algorithms such as CBA (Liu et al., 1998) and MCAR (Thabtah & Cowling, 2007) use<br />
one support threshold to control the number of rules derived and may be unable to capture high<br />
confidence rules that have low support. In order to explore a large search space and to capture<br />
as many high confidence rules as possible, such algorithms commonly tend to set a very low<br />
support threshold, which may lead to problems such as generating low statistically support<br />
rules and a large number of candidate rules which require high computational time and storage.<br />
In response to these issues, one approach that suspends the support and uses only the<br />
confidence threshold to rule generation has been proposed by Wang et al. (2001). This<br />
confidence-based approach aims to extract all the rules in a dataset that passes the Minconf<br />
threshold. Other approaches are to extend some of the existing algorithms such as CBA and<br />
CMAR. These extensions resulted in a new approach called multiple supports (Baralis et al.,<br />
2008) that considers class distribution frequencies in a dataset and also assigns a different<br />
support threshold to each class. This assignment is done by distributing the global support<br />
TABLE 1: Training Dataset<br />
RowNo Attribute 1 Attribute 2 class<br />
1 a 1 a 2 l 1<br />
2 a 1 a 2 l 2<br />
3 a 1 b 2 l 1<br />
4 a 1 b 2 l 2<br />
5 b 1 b 2 l 2<br />
6 b 1 a 2 l 1<br />
7 a 1 b 2 l 1<br />
8 a 1 a 2 l 1<br />
9 c 1 c 2 l 2<br />
10 a 1 a 2 l 1<br />
TABLE 2: Potential Classifier for Data in Table 1<br />
Frequent Items<br />
Rule Condition Rule class Supp Conf<br />
l 1 4/10 4/5<br />
l 1 5/10 5/7<br />
208 <strong>Pertanika</strong> J. Sci. & Technol. <strong>21</strong> (1): 283 - 298 (<strong>2013</strong>)
Association Rule Mining<br />
threshold to each class corresponding to its number of frequencies in the training dataset, and<br />
thus, considers the generation of rules for the class labels with low frequencies in the training<br />
data.<br />
An approach called MCAR (Thabtah, 2005) that employs vertical mining was proposed, in<br />
which during the first training data scan, the frequent items of size one are determined and their<br />
appearances in the training data (rowIds) are stored inside an array in a vertical format. Any<br />
item that fails to pass the support threshold is discarded. The rowIds hold useful information<br />
that can be used laterally during the training step in order to compute the support threshold<br />
by intersecting the rowIds of any disjoint items of the same size. It should be noted that the<br />
proposed algorithm of MMCAR also utilises vertical mining in discovering and generating<br />
the rules. Next section describes the proposed algorithm based on an example.<br />
MATERIAL AND METHODS<br />
MMCAR goes through three main phases: Training, Construction of classifier, and Forecasting<br />
of new cases as shown in Fig.1. During the first phase, it scans the input data set to find<br />
frequent items in the form of size 1. These items are called one-item.<br />
The algorithm repeatedly joins them to produce frequent two-items, and so forth. It should be<br />
noted that any item that appears in the input dataset less than the MinSupp threshold will be<br />
discarded. Once all the frequent items of all sizes are discovered, the algorithm will check for<br />
the items confidence values. Only if the confidence value is larger than the MinConf threshold,<br />
it will then become a CAR. Otherwise, the item gets deleted. The next step is to sort the rules<br />
according to certain measures and to choose a subset of the complete set of CARs to form the<br />
classifier. Details on the proposed MMCAR are given in the next subsections.<br />
CARs Discovery and Production<br />
MMCAR uses an intersection method based on the so-called Tid-list to compute the support<br />
and confidence values of the item values. The Tid-list of an item represents the number of<br />
rows in the training dataset in which an item has occurred. Thus, by intersecting the Tid-lists<br />
of two disjoint items, the resulting set denotes the number of rows, in which the new resulting<br />
item has appeared in the training dataset, and the cardinality of the resulting set represents the<br />
new item support value.<br />
The proposed algorithm goes over the training dataset only once to count the frequencies of<br />
one-items, from which it discovers those that pass the MinSupp. During the scan, the frequent<br />
one-items are determined, and their appearances in the input data (Tid-lists) are stored inside<br />
a data structure in a vertical format. Meanwhile, any item that does not pass the MinSupp will<br />
be removed. Then, the Tid-lists of the frequent one-item are used to produce the candidate twoitem<br />
by simply intersecting the Tid-lists of any two disjoint one-items. Consider for instance,<br />
the frequent attribute values (size 1) (, l 1) and (, l 1) that are shown in Table 2 can<br />
be utilised to produce the frequent item (size 2) (, l 1) by intersecting their Tid-lists,<br />
i.e. (1,3,7,8,10) and (1,6,8,10) within the training dataset (Table 1). The result of the above<br />
intersection is the set (1,8,10) in which its cardinality equals 3, and denotes the support value<br />
of the new attribute value (, l 1). Now, since this attribute value support is larger than<br />
<strong>Pertanika</strong> J. Sci. & Technol. <strong>21</strong> (1): 283 - 298 (<strong>2013</strong>)<br />
209
Yuhanis Yusof and Mohammed Hayel Refai<br />
or equivalent to the MinSupp threshold (i.e. 30%), this 2-item will become frequent.<br />
The above discussion describes the training approach which is called vertical mining<br />
that has been successfully used in association rule discovery (Zaki & Gouda, 2003) and in<br />
classification (Thabtah, 2005). This approach transforms the training dataset into items table<br />
that contains the locations (Tid-lists) of each item in the training dataset, employs simple<br />
intersections among these locations to discover frequent values and produces the rules. Once<br />
all the items of all sizes have been discovered, MMCAR will then check for their values and<br />
generate those which pass both the MinSupp and MinConf thresholds as items to be used in the<br />
classification association rule(s). The proposed item production algorithm is shown in Fig.2,<br />
while Fig.3 illustrates the algorithm utilized by MCAR (Thabtah, 2005).<br />
Building the Classifier<br />
One primary limitation of CuA approach in data mining is the exponential growth of rule (Li<br />
et al., 2006; Thabtah et al., 2006). Thus, a primary motivation of this work is to cut down the<br />
number of generated CARs. Prior to pruning redundant rules and to build the classifier, rules<br />
Fig.2: MMCAR Item Production Algorithm<br />
Fig.3: MCAR Item Production Algorithm<br />
<strong>21</strong>0 <strong>Pertanika</strong> J. Sci. & Technol. <strong>21</strong> (1): 283 - 298 (<strong>2013</strong>)
Association Rule Mining<br />
must be sorted in order to prioritize quality rule to be chosen as a part of the classifier. In this<br />
work, the rules are sorted according to the following guidelines:<br />
1. The rule with higher confidence is placed in a higher rank.<br />
2. If the confidence values of two or more rules are the same, the rule with higher support<br />
will then get a higher rank.<br />
3. If the confidence and the support values of two or more rules are the same, the rule<br />
with lesser number of attribute values in the antecedent gets a higher rank<br />
4. If all the above criteria are similar for two or more rules, the rule which was produced<br />
first will get a higher rank.<br />
For each sorted rule (CAR), MMCAR applies it on the training dataset, and the rule gets<br />
inserted into the classifier if it covers at least one case regardless of the rule class that is similar<br />
to that of the training case. Now, once a rule gets inserted into the classifier, all the training<br />
cases associated with it are discarded. In situations where a rule fails to cover any training<br />
case, it will then be removed. The same process is repeated until no more case remains in the<br />
training dataset or all CARs are tested.<br />
In predicting test data case, the prediction method of MMCAR divides all the rules which<br />
match the test case into groups; one for each class label to calculate the average confidence<br />
and support values. It assigns the test case with the class of the group with the largest average<br />
confidence. In cases where there are two or more groups with similar average, the prediction<br />
method is considered for the largest average support group. Unlike other current CuA methods<br />
like MCAR (Thabtah, 2005) and CBA (Liu, 1998) which employ only the highest confidence<br />
rule for predicting the test case, our algorithm makes the prediction decision based on multiple<br />
rules (Li et al., 2006; Thabtah et al., 2006). Finally, in cases when no rules in the classifier are<br />
applicable to the test case, the default class (the majority class in the training dataset) will be<br />
assigned to that case.<br />
RESULTS AND DISCUSSION<br />
In this section, a recent classification using association algorithm, which is the MCAR (Thabtah,<br />
2005), is compared against MMCAR with reference to classification accuracy and the number<br />
of rules produced by the classifier. A total of fourteen (14) UCI datasets (Merz & Murphy,<br />
1996) have been utilized in the experiments. Cross validation which divides training dataset<br />
into (n+1) folds arbitrary was employed and learning was performed on the n folds of each<br />
iteration. Later, evaluation is undertaken on the remaining holdout fold. The process is repeated<br />
n+1 times and the results are obtained by taking the average values. In the experiments, the<br />
number of folds in cross validation is set at 10, as employed by Thabtah et al. (2005). On the<br />
other hand, the main parameters of MMCAR and MCAR, namely, MinSupp and MinConf,<br />
were set to 3% and 50%, respectively, in the experiments. This is since 3% of support usually<br />
balances between the number of rules discovered and processing time. All of the experiments<br />
were performed on Pentium IV machine with 2.0 GB RAM and 2.6 GH processors.<br />
A.<br />
<strong>Pertanika</strong> J. Sci. & Technol. <strong>21</strong> (1): 283 - 298 (<strong>2013</strong>)<br />
<strong>21</strong>1
Results and Analysis<br />
Yuhanis Yusof and Mohammed Hayel Refai<br />
Table 3 contains the results of the classification accuracy, while data in Table 4 depicts the<br />
number of association rules produced by MCAR and MMCAR. Data in Table 4 show similar<br />
consistency in the classification accuracies of both MMCAR and MCAR. The accuracy values<br />
obtained by both MCAR and MMCAR for six data sets (Austra, Balance-scale, Labor, Lymph,<br />
Mushroom and Wine) are at the same level; they only differ at the decimal point. For example,<br />
using Austra dataset, both classifiers generate 86% accuracy. On the other hand, MMCAR<br />
outperformed the accuracy obtained by MCAR in five data sets. Such a scenario is illustrated<br />
in Fig.4, where it shows the difference of accuracy values between MMCAR and MCAR. For<br />
example, the difference is as high as 2.85% for the Glass dataset, while there is no difference<br />
for the Labour dataset.<br />
TABLE 3: Prediction Accuracy<br />
Data set MCAR MMCAR<br />
Austra 86.14 86.26<br />
Balance-scale 76.96 76.17<br />
Breast 94.99 93.83<br />
Cleve 81.84 78.77<br />
Glass 71.35 74.2<br />
Heart-s 81.15 80.51<br />
Iris 92.93 94.26<br />
Labor 83.5 83.5<br />
Led7 71.83 73<br />
Lymph 78.1 78.05<br />
Mushroom 99.6 99.67<br />
Pima 77.12 74.44<br />
Vote 88.2 86.39<br />
Wine 95.73 95.73<br />
Fig.4: The Difference in Prediction Accuracy<br />
<strong>21</strong>2 <strong>Pertanika</strong> J. Sci. & Technol. <strong>21</strong> (1): 283 - 298 (<strong>2013</strong>)
Association Rule Mining<br />
On the other hand, the results of the generated number of rules are depicted in Table 5. Data<br />
in the table indicate that the proposed algorithm (i.e. MMCAR) produces less number of rules<br />
than MCAR. MMCAR has derived on average 63 rules for the fourteen datasets as compared<br />
to MCAR that produced an average of 76 rules. The difference of the generated rules is also<br />
illustrated in Fig.5. It is noted that MMCAR produces less number of rules for eight datasets,<br />
whereby the highest difference can be seen in the Led7 dataset.<br />
TABLE 4: The Number of Association Rules<br />
Dataset MCAR MMCAR<br />
Austra 193 185<br />
Balance-scale 77 81<br />
Breast 79 80<br />
Cleve 98 93<br />
Glass 43 34<br />
Heart-s 39 29<br />
Iris 16 11<br />
Labor 15 15<br />
Led7 <strong>21</strong>4 87<br />
Lymph 54 54<br />
Mushroom 42 48<br />
Pima 107 80<br />
Vote 83 75<br />
Wine 11 11<br />
Fig.5: The Difference in the Number of Association Rules<br />
<strong>Pertanika</strong> J. Sci. & Technol. <strong>21</strong> (1): 283 - 298 (<strong>2013</strong>)<br />
<strong>21</strong>3
CONCLUSION<br />
Yuhanis Yusof and Mohammed Hayel Refai<br />
In this paper, a modified Multi-class classification based on association rule mining is presented.<br />
The so-called MMCAR algorithm includes a new item production algorithm in generating<br />
relevant association rules. A more restricted condition is included in the item production so<br />
that MMCAR only selects the best related items in producing association rules of the classifier.<br />
Hence, a moderate size of association rules will then be obtained. Such a result will aid users<br />
in interpreting and understanding the nature of data in the context of study. The proposed<br />
MMCAR is proven to be at par with MCAR in prediction accuracy but outperforms the<br />
benchmark method in producing lesser number of association rules.<br />
REFERENCES<br />
Baralis, E., Chiusano, S., & Garza, P. (2004). On support thresholds in associative classification.<br />
Proceedings of the 2004 ACM Symposium on Applied Computing, Nicosia, Cyprus, pp. 553-558.<br />
Baralis, E., Chiusano, S., & Garza, P. (2008). A lazy approach to associative classification. IEEE<br />
Transactions on Knowledge and Data Engineering, 20, 156-171.<br />
Cohen, W. W. (1995). Fast effective rule induction. In Proceedings of the Twelfth International Conference<br />
on Machine Learning, pp. 115-123.<br />
Li, W., Han, L., & Pei, J. (2001). CMAR: Accurate and efficient classification based on multiple classassociation<br />
rules. In Proceedings of the ICDM’01 San Jose, CA, p. 369.<br />
Lim, T. S., Loh, W. Y., & Shih, Y. S. (2000). A comparison of prediction accuracy, complexity, and<br />
training time of thirty-three old and new classification algorithms. Machine learning, 40, 203-228.<br />
Liu, B., Hsu, W., & Ma, Y. (1998). Integrating classification and association rule mining. Knowledge<br />
discovery and data mining, 80–86.<br />
Meretakis, D., & Wüthrich, B. (1999). Extending naïve Bayes classifiers using long item sets. In<br />
Proceedings of the fifth ACM SIGKDD International Conference on Knowledge Discovery and Data<br />
Mining, San Diego, California, pp. 165-174.<br />
Merz, C., & Murphy, P. (1996). UCI repository of machine learning databases. Retrieved from FTP of<br />
ics. uci.edu in the directory pub/machine-learning-databases.<br />
Tang, Z., & Liao, Q. (1998). A new class based associative classification algorithm. IAENG International<br />
<strong>Journal</strong> of Applied Mathematics, 36(2), 136-141.<br />
Thabtah, F., Cowling, P., & Peng, Y. (2005). MCAR: multi-class classification based on association rule.<br />
In Proceeding of the 3rd IEEE International Conference on Computer Systems and Applications, p. 33.<br />
Thabtah, F., Crowling, P., & Hammoud, S. (2006). Improving rule sorting, predictive accuracy and<br />
training time in associative classification. Expert Systems with Applications, 31, 414-426.<br />
Thabtah, F. A., & Cowling, P. I. (2007). A greedy classification algorithm based on association rule.<br />
Applied Soft Computing, 7, 1102-1111.<br />
Thabtah F., Mahmood Q., McCluskey L., & Abdel-jaber H. (2010). A new Classification based on<br />
Association Algorithm. <strong>Journal</strong> of Information and Knowledge Management, 9(1), 55-64.<br />
Quinlan, J. R. (1993). C4.5: Programs For Machine Learning. Morgan Kaufmann.<br />
<strong>21</strong>4 <strong>Pertanika</strong> J. Sci. & Technol. <strong>21</strong> (1): 283 - 298 (<strong>2013</strong>)
Association Rule Mining<br />
Quinlan, J. R. (1998). Data mining tools See5 and C5.0. Technical Report, RuleQuest Research.<br />
Wang, K., He, Y., & Cheung, D. W. (2001). Mining confident rules without support requirement. In<br />
Proceedings of the Tenth International Conference on Information and Knowledge Management.<br />
Atlanta, Georgia, pp. 89-96.<br />
WEKA (2000). Data Mining Software in Java. Retrieved from http://www.cs.waikato.ac.nz/ml/weka.<br />
Yin, X., & Han, J. (2003). CPAR: Classification based on predictive association rules. Paper presented<br />
at the 2003 SIAM International Conference on Data Mining, Cathedral Hill Hotel, San Francisco,<br />
CA, May 1-3, 2003. pp. 331.<br />
Yoon, Y., & Lee, G. G. (2008). Text Categorization Based on Boosting Association Rules. Paper presented<br />
at the the 2008 IEEE International Conference on Semantic Computing. pp.136-143.<br />
Zaki, M. J., & Gouda, K. (2003). Fast vertical mining using diffsets. Paper presented at the 9 th ACM<br />
SIGKDD International Conference on Knowledge Discovery and Data Mining. Washington, D.C.,<br />
pp. 326-335.<br />
<strong>Pertanika</strong> J. Sci. & Technol. <strong>21</strong> (1): 283 - 298 (<strong>2013</strong>)<br />
<strong>21</strong>5
ISSN: 0128-7680 © <strong>2013</strong> <strong>Universiti</strong> <strong>Putra</strong> Malaysia Press.<br />
<strong>Pertanika</strong> J. Sci. & Technol. <strong>21</strong> (1): <strong>21</strong>7 - 226 (<strong>2013</strong>)<br />
SCIENCE & TECHNOLOGY<br />
<strong>Journal</strong> homepage: http://www.pertanika.upm.edu.my/<br />
Multi-Format Information Fusion through Integrated Metadata<br />
Using Hybrid Ontology for Disaster Management<br />
Che Mustapha Yusuf, J. 1,3 *, Mohd Su’ud, M. 2 , Boursier, P. 3 and Muhammad, A. 1<br />
1 UniKL-Malaysian Institute of Information Technology, Kuala Lumpur, Malaysia<br />
2 UniKL-Malaysia France Institute, Bangi, Selangor, Malaysia<br />
3 Laboratoire L3i Université de La Rochelle, La Rochelle, France<br />
ABSTRACT<br />
Finding relevant disaster data from a huge metadata overhead often results in frustrating search<br />
experiences caused by unclear access points, ambiguous search methods, unsuitable metadata, and<br />
long response times. More frequently, semantic relation between the retrieved objects is neglected.<br />
This paper presents a system architecture that makes use of ontologies in order to enable semantic<br />
metadata descriptions for gathering and integrating multi-format documents in the context of disaster<br />
management. After a brief discussion on the challenges of the integration process, the Multi-format<br />
Information Retrieval, Integration and Presentation (MIRIP) architecture is presented. A specific approach<br />
for ontology development and mapping process is introduced in order to semantically associate user’s<br />
query and documents metadata. An ontology model approach was designed to follow inspirational and<br />
collaborative approaches with top-down to bottom-up implementation. A prototype of the integrated<br />
disaster management information system is currently under development, based on the architecture that<br />
is presented in this paper.<br />
Keywords: Ontology Engineering, hybrid ontology, multi-format document, metadata integration,<br />
disaster management<br />
Article history:<br />
Received: 31 March 2012<br />
Accepted: 31 August 2012<br />
E-mail addresses:<br />
jawahir@miit.unikl.edu.my (Che Mustapha Yusuf, J.),<br />
mazliham@unikl.edu.my (Mohd Su’ud, M.),<br />
patrice.boursier@univ-lr.fr (Boursier, P.),<br />
muhammad.unikl@gmail.com (Muhammad, A.)<br />
*Corresponding Author<br />
INTRODUCTION<br />
In managing disasters at all stages, a large<br />
amount of information within multiple media<br />
documents is produced and collected. The<br />
information contained in spatial and nonspatial<br />
documents, which were collected<br />
before and after disasters, is composed of<br />
collections of features, coverage and highresolution<br />
imageries, snap photos, text<br />
report, video and audio clips. Even though
Che Mustapha Yusuf, J., Mohd Su’ud, M., Boursier, P. and Muhammad, A.<br />
the documents can be in multiple different formats, multiple characteristics and are available<br />
from different sources, their contents may tell an equivalent semantic of objects, the calamity<br />
story, share the space-time extension, and may be closely related to each other (see Fig.1).<br />
As the description outside the packaging describes information about such product,<br />
metadata also describes the context and elementary contents of a document. With metadata,<br />
access to information at the first level to get the document of information can be found by<br />
searching. However, extracting relevant information from a massive number of available<br />
metadata still remains a challenge. Users often get frustrating search experiences caused by<br />
unclear access points, ambiguous search methods, unsuitable metadata, and long response<br />
times (Larson et al., 2006), especially when metadata is used in various forms to describe<br />
different document formats such as spatial and non-spatial metadata (e.g. multimedia metadata).<br />
Hence, understanding the semantics of metadata is a good way to combine different sources of<br />
information while ensuring effective integration and access to information. Current research<br />
into semantic metadata integration still lacks of focus to combine between spatial and nonspatial<br />
metadata which hold descriptions of both document types. Most of the works consider<br />
only a single format type or a single context type (e.g. texts, images, spatial) as in Gagliardi<br />
et al. (2005), Hurtienne et al. (2008) and Olteanu et al. (2008), when implementing schema<br />
and/or instance matching to align terminology between different metadata and user’s query<br />
terms. Such effort is insufficient to solve matching problem within the environment with high<br />
structural and semantic heterogeneity.<br />
In the presented context, there is a need to establish and combine users’ and metadata<br />
conceptualization, as well as to provide machine automatism to semantic metadata integration.<br />
For this purpose, this paper presents a system architecture using ontology to enable semantic<br />
metadata descriptions to gather and integrate multi-format documents. An approach for semantic<br />
metadata integration using ontology modelling of the available resources is currently being<br />
studied in the context management of national disaster and relief in Malaysia.<br />
Challenges to Information Integration: Malaysian Disaster Management<br />
Malaysia has a good mechanism in managing disasters through Malaysian public agencies,<br />
particularly amongst the local authorities, police, fire brigades, and medical agencies. The<br />
committee is established at Federal-level, State-level and District-level, under the administrative<br />
Fig.1: Different document formats that are closely related to each other<br />
<strong>21</strong>8 <strong>Pertanika</strong> J. Sci. & Technol. <strong>21</strong> (1): 283 - 298 (<strong>2013</strong>)
Information Fusion via Integrated Metadata Using Hybrid Ontology<br />
control of the National Security Division Secretariat to coordinate all the activities related<br />
to disaster. This mechanism is well stated in “Policy and Mechanism in the Management of<br />
National Disaster and Relief in Malaysia” or “National Security Council (NSC) Directive<br />
No. 20” (Umar, 2011). These agencies perform their own daily work routines and maintain<br />
their own information, either manually or in digitized form (e.g., file-systems and Geographic<br />
Information System (GIS) and/or non-GIS databases).<br />
During disaster events, a vast amount of information is acquired from different sources to<br />
be disseminated amongst them. Various challenges emerge to enforce knowledge sharing, which<br />
makes the information integration more difficult. The required datasets are not only difficult<br />
to obtain from the system network but also lack automated data coordination at operational<br />
level such as during counter-disaster, rescue and relief activities. The major challenge is in the<br />
system, structural/schematic and syntactic differences. A diverse distributed storage system<br />
is used to store the information that ranges from databases and file-systems. For example,<br />
collection of images is stored as Binary Large Object (BLOb) at data provider 1, but as a filesystem<br />
at data provider 2. The differences in software platform, file formatting and data models<br />
certainly add the challenges to interoperability. Furthermore, some data providers provide<br />
metadata database to manage data about data they have but some are not. Obviously, the current<br />
environment has no composition and consumption of metadata. In order for documents to be<br />
identifiable, the metadata should be produced and stored in a format that allows its efficient<br />
management. Another challenge arises if metadata system is utilised. Each agency may use<br />
different terminologies to refer to similar data, and also different document formats to store<br />
spatially and semantically related information.<br />
It is important to note that semantic integration to group and combine data (metadata)<br />
from different sources of various agencies involved in a disaster management is necessary. For<br />
this purposed, semantic integration has to ensure that only data related to the same real-world<br />
entity are merged. Ontology is the current best practice to resolve semantic conflicts in these<br />
diverse information sources. Gruber (2007) states that ontology is an enabling technology<br />
(a layer of the enabling infrastructure) to enforce knowledge sharing and manipulation. The<br />
authors strongly believe that an appropriate ontology development approach should depend<br />
on the current organisational environment of Malaysian management of disasters. Majority of<br />
the current systems and metadata standards hold less explicit semantics of information (Fig.2),<br />
and this makes data fusion tasks difficult (Halevy et al., 2006; Haslhofer & Klas, 2010; Haas,<br />
2007). Modern information system is encouraged to embed more semantics in their systems<br />
so as to allow a better information integration and this can be achieved by using ontology.<br />
This research opens up significant opportunities to achieve more flexible and adaptable ways<br />
to start employing ontology within disaster management agencies.<br />
A System Architecture for Multi-format Information Fusion through Metadata<br />
Integration Using Hybrid Ontology<br />
The advent of Semantic Web technologies and ontology engineering facilitates the idea to enable<br />
semantic metadata integration within various metadata sources. For this purpose, an ontologybased<br />
architecture for information retrieval, integration and presentation is formed. The<br />
<strong>Pertanika</strong> J. Sci. & Technol. <strong>21</strong> (1): 283 - 298 (<strong>2013</strong>)<br />
<strong>21</strong>9
Che Mustapha Yusuf, J., Mohd Su’ud, M., Boursier, P. and Muhammad, A.<br />
designed system aims at providing users with data input, discovery and access to multiple media<br />
documents via rich ontology-based metadata describing them. The architecture comprehends<br />
the semantic matchmaking between user’s query and metadata of multi-format information<br />
using ontologies. This system architecture is called MIRIP (Multi-format Information Retrieval,<br />
Integration and Presentation), conformant to Service Oriented Architecture (SOA) standards<br />
(Sprott & Wilkes, 2011). A conceptual notion of the system is depicted in Fig.4. There are three<br />
sections involved in the overall process model, namely, provider, mediator and client sections.<br />
Details pertaining to the processing components in the architecture are as Fig.2.<br />
Provider section. This section comprises distributed data repositories, which are<br />
administered by different data owners. The data repository can be in the type of file-systems<br />
and special purpose databases (administration, GIS and multimedia). Information is stored as<br />
a set of files containing multiple media types such as GIS vector files, high-resolution aerial<br />
photographs and satellite images, snap photo images, audio-video clips and text documents.<br />
Metadata exist for managing the various media formats. To provide the semantic descriptions<br />
of each metadata, local (source) ontology is constructed according to bottom-up ontology<br />
principle. Concurrently, the local ontology is aligned with the upper-ontologies representing<br />
the common concepts and its relations.<br />
Mediator section. This section provides a searchable repository of data service descriptions,<br />
thus enabling data providers to publish their data and data requestors to search for these data.<br />
Semantic metadata-base permits the storage of metadata from various sources. Ontology<br />
component provides a common vocabulary to define the relationships between object classes<br />
once new metadata are (automatically) registered to the system. The ontology facilitates<br />
the retrieval system to identify the relevant media information through metadata, which are<br />
semantically annotated and matched to the terms specified in the query.<br />
Fig. 2: The MIRIP (Multi-format Information Retrieval, Integration and Presentation) architecture<br />
220 <strong>Pertanika</strong> J. Sci. & Technol. <strong>21</strong> (1): 283 - 298 (<strong>2013</strong>)
Information Fusion via Integrated Metadata Using Hybrid Ontology<br />
Client section. This section enables human-machine interaction at registering data<br />
services, querying, navigating and accessing the information. By using the data registration<br />
interface (dRI), data providers can register their available metadata (push) to the catalogue<br />
service as data sources. The metadata catalogue is useful to facilitate data requestors to locate<br />
and evaluate the data services before it automatically makes a request to access the data. Once<br />
data services registration is made, service description is maintained by the mediator. The user<br />
query interface allows users to provide input to the query to automatically search the required<br />
information service. When the request method is posted, a user’s request will be sent to the<br />
mediator to search for matching values. If a data provider is found, the connection will be<br />
bonded between the data provider and the data requestor. The retrieval results and presentation<br />
interface allow search results from metadata catalogue to be presented in a ranked-list. These<br />
search results are delivered to the user through a combination of graphical and textual (e.g.<br />
descriptions) elements.<br />
Ontology Modelling for Semantic Integration<br />
In this work, ontology development takes advantages of the hybrid ontology with the<br />
implementation of top-down and bottom-up ontology designs (see Fig.4). The upper-ontology<br />
used in the hybrid ontology approach transfers the burden of information correlation and filters<br />
the query processing system (Mena et al., 2000). Following up the top-down design, the set of<br />
top-level ontology is firstly provided. Common terms are specified at a very abstract extent,<br />
so that a new source ontology can be easily mapped to the upper-ontology. If the new source<br />
contains a local concept that is not described in upper-ontology, the common concept that<br />
matches with the local concept will be established in the upper shared-vocabulary. Secondly,<br />
the source ontologies that contain more specific terms are extended from the primitive terms<br />
in the set of top-level ontology. Terms at both levels are comparable easily because the source<br />
ontologies only use the vocabulary of top-level ontology. Based on the bottom-up ontology<br />
design, the existing source schema and its instances are extracted to generate the source<br />
ontologies which contain more high level data descriptions. Then, the source ontologies of all<br />
disparate sources are mapped to the abstract concepts of top-level ontology which has been<br />
constructed earlier.<br />
In developing the ontology for the current environment and to enable bottom-up ontology<br />
mapping, each source must have at least one common concept. Some uncommon concepts that<br />
are considered important for query purpose will be declared as sharable in global ontology to<br />
avoid data loss. For instance, Source 1 holds concept ‘channels’ that describe the number of<br />
channels represented in the waveform data, such as 1 for mono or 2 for stereo. The concept,<br />
however, is not common to another source. Thus, the concept along with its possible subconcepts<br />
will be added in the shared vocabulary. The participating data sources in the integration<br />
process have no pre-existing ontologies. Thus, local ontology for each data source will be<br />
created with reference to shared-vocabulary. The body of the local ontology is extended to<br />
list more specific entities and properties. With no pre-existence of ontology, data sources still<br />
have the autonomy to maintain its own name concepts.<br />
The shared-ontologies (vocabularies) include top-level ontology to describe the primitive<br />
concepts and domain-specific disaster management ontology. At domain-specific level,<br />
<strong>Pertanika</strong> J. Sci. & Technol. <strong>21</strong> (1): 283 - 298 (<strong>2013</strong>)<br />
2<strong>21</strong>
Che Mustapha Yusuf, J., Mohd Su’ud, M., Boursier, P. and Muhammad, A.<br />
document ontology along with administration ontology that is presented by Xu and Zlatanova<br />
(2007) are generated to represent the concepts associated with the documents dataset and the<br />
providers. The top-level ontology contains common concepts that are associated with space,<br />
time and theme. The domain-specific ontology is created to capture spatial and non-spatial<br />
concepts related to disaster management. A specific case study of landslide disaster in Malaysia<br />
is drawn to demonstrate the applicability of the proposed ontology. So, the ontology also<br />
captures details of the landslide concepts which are described as the sub-concepts of natural<br />
disaster in the event ontology.<br />
Ontology building methodology, proposed by Uschold and King (1995) and Uschold and<br />
Gruniger (1996), is used as basis steps to build the ontology components. The following steps<br />
are adhered to properly design the ontologies under provision; 1) Identification of ontology<br />
purposes & scopes, 2) Ontology conceptualization, semi-formal specification and formalization,<br />
3) Ontology evaluation and 4) Ontology documentation. The sets of ontology that are still at<br />
the development stage play a key role to semantically associate user’s query and the document<br />
metadata. Consequently, the ontology components here support the classification of resources<br />
and retrieval to the resources. Semantic Web ontology languages such as Resource Description<br />
Framework Schema-RDFS (Antoniou & Harmelen, 2008) and Web Ontology Language-<br />
OWL (W3C, 2009) are utilized along with the Protégé and the Jena API (Protégé, 2011) as an<br />
automatic development tool in this work.<br />
Ontology Mapping Methodology<br />
Fig. 3: Ontology model for disaster management domain<br />
In the modelling ontology, each class and property is assigned with primary identifier as in<br />
Parts LIBrary (PLIB) ontology (Pierra, 2004) to map between concepts. The primary identifier<br />
is used to indicate the similarity or different concepts between participating data sources and it<br />
upper-vocabularies. Fig.5 depicts the top-down to bottom-up mapping implementation with the<br />
use of primary identifier. An example of the text document concepts is presented. In the , local<br />
222 <strong>Pertanika</strong> J. Sci. & Technol. <strong>21</strong> (1): 283 - 298 (<strong>2013</strong>)
Information Fusion via Integrated Metadata Using Hybrid Ontology<br />
ontology is defined based on the schema of the local data. Data owners will decide their own<br />
definition of the local ontology concepts. The concepts that are rational to be disclosed will be<br />
pulled out to domain-shared list. Meanwhile, concealed concepts (shaded in Fig.5) will not be<br />
shared but can be accessed locally or may be shared (right away or later) in a different domain.<br />
Generic and domain shared-vocabulary are the list of shared concepts for all participating<br />
data sources. In this approach, the design of shared-vocabulary begins with inspirational<br />
approach (Holsapple & Joshi, 2002). At the initial stage, the specification of generic and<br />
domain shared-vocabulary, that are substantially potential to be shared with the group of the<br />
data owners, are initiated. Concerned with the importance of information sharing, the data<br />
owners may collaboratively (Holsapple & Joshi, 2002) use the existing shared-vocabulary as<br />
the anchor and supportively extend it if necessary. However, the data source owners will not<br />
be attentive to each other’s data. This is important for most of the intelligence systems that<br />
are confidentiality-related.<br />
MIRIP PROTOTYPICAL IMPLEMENTATION<br />
Fig. 4: Top -down to bottom-up ontology mapping<br />
<strong>Pertanika</strong> J. Sci. & Technol. <strong>21</strong> (1): 283 - 298 (<strong>2013</strong>)<br />
223
Che Mustapha Yusuf, J., Mohd Su’ud, M., Boursier, P. and Muhammad, A.<br />
An implementation plan to demonstrate the interaction (data services registration and discovery)<br />
within MIRIP is illustrated in disaster management domain. In MIRIP, data providers are from<br />
different mapping agencies and institutions involved in disaster management. They present a<br />
collection of data services while mediator is employed with a set of data registry services, and<br />
client (data requestor) is equipped with a set of client applications.<br />
Data services registration involves data listing process in catalogue services. Data providers<br />
can use the MIRIP dRI not only for submitting their new data (metadata), but they can take<br />
out data from the catalogue and update some specific data. The following case shows how the<br />
data service registration works. Let’s assume that the Public Work Department of Malaysia<br />
(PWD) is cooperatively giving out a landslide investigation report (in MIRIP geo-portal).<br />
Thus, PWD must use the concepts enumerated in ontologies to generate the data service<br />
descriptions. With the help of the dRI to access the relevant concepts from ontologies, PWD<br />
will perform multiple steps to select an appropriate disaster event (in this case, landslide). In<br />
the proposed event ontology shown in Fig.6, ‘landslide’ is enumerated as a sub-concept of<br />
geological natural hazard. After the landslide concept has been chosen, PWD is navigated to<br />
stipulate an important attributes (i.e. format, reference date, abstract etc.) for the published<br />
data. In the case of publishing spatial dataset, more detail spatial representation properties are<br />
required. Once the new metadata registration is submitted, it is stored in the metadata-base<br />
(enriched with ontology descriptions).<br />
Data services discovery always concerns with the identification of service descriptions<br />
that match a data service requested by the client. From the previous case, if PWD registers<br />
multiple datasets, PWD has provided a service description that defines an important metadata<br />
which entirely describes the characteristics of services that are deployed on MIRIP geo-portal.<br />
This metadata provides an abstract definition of the information that is essential to deploy<br />
and interact with a service. Suppose that Malaysian Public Works Institute (Ikram) is about to<br />
request datasets about specific landslide resources. Analogous to registration step, Ikram will<br />
perform the request (via query interface with catalogue service) by specifying the properties<br />
such as the event type, location, date, etc. Since the information about landslide has been<br />
Fig. 5: Snippet of class event and its membership<br />
224 <strong>Pertanika</strong> J. Sci. & Technol. <strong>21</strong> (1): 283 - 298 (<strong>2013</strong>)
Information Fusion via Integrated Metadata Using Hybrid Ontology<br />
registered and classified under a specific category and aligned with the ontologies, the query<br />
is foreseen to return the relevant result list and ready to be browsed for further discovery (i.e.<br />
reiterate search, display and download).<br />
OUTLOOK<br />
This specific system was designed to increase the efficiency in document query and integration,<br />
particularly for disaster management domain. The presented ontology-based architecture for a<br />
semantic integration of documents via metadata approach was currently developed. Validation<br />
upon the designated ontology would be attained with the professional members involved in<br />
Malaysian disaster management, particularly with personnel involved with data acquisition<br />
and risk analysis. The recent research is still in focus to scrutinize the ontology formation as<br />
well as the complex ontology matchmaking process highlighted in this paper to produce ideal<br />
mapping between upper and low level ontology. The approach using ontology is foreseeable<br />
to help achieve the goal of automatic data search and integration to response a specific query.<br />
REFERENCES<br />
Antoniou, G., & Harmelen, F. V. (2008). A semantic web primer (2 nd Edition). Cambridge, MA: The<br />
MIT Press.<br />
Gagliardi, H., Haemmerlé, O., Pernelle, N., & Saïs, F. (2005). An automatic ontology-based approach to<br />
enrich tables semantically. 1 st International Workshop on Context and Ontologies: Theory, Practice<br />
and Applications. Pittsburgh, Pennsylvania, pp. 64–71.<br />
Gruber, T. (2007). Ontology of folksonomy: a mash-up of apples and oranges. International <strong>Journal</strong> on<br />
Semantic Web and Information Systems (IJSWIS), 3(1), pp. 1-11.<br />
Haas, L. M. (2007). Beauty and the beast: the theory and practice of information integration. International<br />
Conference on Database Theory, pp. 28-43.<br />
Halevy, A., Rajaraman, A., & Ordille, J. (2006). Data integration: the teenage years. 32 nd International<br />
Conference on Very Large Databases, September 12-15, Seoul, Korea.<br />
Haslhofer, B., & Klas, W. (2010) A survey of techniques for achieving metadata interoperability. ACM<br />
Computing Surveys (CSUR), 42(2), 1-37.<br />
Holsapple, C. W., & Joshi, K. D. (2002). A collaborative approach to ontology design. Communications<br />
of the ACM, 45(2), 42-47.<br />
Hurtienne, J., Weber, K., & Blessing, L. (2008). Prior experience and intuitive use: image schemas in<br />
user centred design. Designing Inclusive Futures, 107–116.<br />
Larson, J., Olmos Siliceo, M. A., Pereira dos Santos Silva, M., Klien, E., & Schade, S. (2006).<br />
Are geospatial catalogues reaching their goals? Paper presented at the 9 th Agile Conference on<br />
Geographical Information Science, Visegrád, Hungary.<br />
Mena, E., Illarramendi, A., Kashyap, V., & Sheth, A. P. (2000). OBSERVER: An approach for query<br />
processing in global information systems based on interoperation across pre-existing ontologies.<br />
Distributed and Parallel Databases, 8(2), 223-271.<br />
Pierra, G. (2004). The PLIB ontology-based approach to data integration. Paper presented at the18 th<br />
IFIP World Computer Congress (WCC’2004), Toulouse, France.<br />
<strong>Pertanika</strong> J. Sci. & Technol. <strong>21</strong> (1): 283 - 298 (<strong>2013</strong>)<br />
225
Che Mustapha Yusuf, J., Mohd Su’ud, M., Boursier, P. and Muhammad, A.<br />
Protégé-Stanford Center for Biomedical Informatics Research. (2011). Integration of jena in protégéowl.<br />
Retrieved on June 29, 2011 from http://protege.stanford.edu/plugins/owl/jena-integration.html.<br />
Sprott, D., & Wilkes, L. (2011). Understanding service-oriented architecture. Retrieved on August 6,<br />
2011 from msdn.microdsoft.com/en-us/library/ aa4800<strong>21</strong>.aspx.<br />
Olteanu, A., Mustière, S., & Ruas, A. (2008). Matching imperfect spatial data. Paper presented at the 7 th<br />
International Symposium on Spatial Accuracy Assessment in Natural Resources and Environmental<br />
Sciences.<br />
Umar, C. M. (2011). Policy and mechanism on national disaster and relief management. Retrieved on<br />
July 23, 2003 from http://spm.um.edu.my/news/disastermanagement 23072008/ talk02.pdf.<br />
Uschold, M., & King, M. (1995). Towards a methodology for building ontologies. Paper presented at the<br />
Workshop on Basic Ontological Issues in Knowledge Sharing. Montreal, Canada, pp. 1-13.<br />
Uschold, M., & Gruninger, M. (1996). Ontologies: principles, methods and applications. Knowledge<br />
Engineering Review, 11, 93-136.<br />
W3C OWL Working Group (2009). OWL 2 web ontology language document overview. W3C<br />
Recommendation. Retrieved on July 15, 2011 from http://www.w3.org/TR/ 2009/REC-owl2overview-20091027/.<br />
Xu, W., & Zlatanova, S. (2007). Ontologies for disaster management response. Geomatics Solutions for<br />
Disaster Management, 185-200.<br />
226 <strong>Pertanika</strong> J. Sci. & Technol. <strong>21</strong> (1): 283 - 298 (<strong>2013</strong>)
ISSN: 0128-7680 © <strong>2013</strong> <strong>Universiti</strong> <strong>Putra</strong> Malaysia Press.<br />
<strong>Pertanika</strong> J. Sci. & Technol. <strong>21</strong> (1): 227 - 238 (<strong>2013</strong>)<br />
SCIENCE & TECHNOLOGY<br />
<strong>Journal</strong> homepage: http://www.pertanika.upm.edu.my/<br />
Context Modelling for Just-In-Time Mobile Information Retrieval<br />
(JIT-MobIR)<br />
Az Azrinudin Alidin 1 * and Fabio Crestani 2<br />
1 Faculty of Information Technology and Computer Science, <strong>Universiti</strong> <strong>Putra</strong> Malaysia, 43400 Serdang,<br />
Selangor, Malaysia<br />
2 Faculty of Informatics, Universita’ della Svizzera italiana, Via Giuseppe Buffi 13, CH-6904 Lugano,<br />
Switzerland<br />
ABSTRACT<br />
Mobile users have the capability of accessing information anywhere at any time with the introduction<br />
of mobile browsers and mobile web search. However, the current mobile browsers are implemented<br />
without considering the characteristics of mobile searches. As a result, mobile users need to devote time<br />
and effort in order to retrieve relevant information from the web in mobile devices. On the other hand,<br />
mobile users often request information related to their surroundings, which is also known as context. This<br />
recognizes the importance of including context in information retrieval. Besides, the availability of the<br />
embedded sensors in mobile devices has supported the recognition of context. In this study, the context<br />
acquisition and utilization for mobile information retrieval are proposed. The “just-in-time” approach<br />
is exploited in which the information that is relevant to a user is retrieved without the user requesting<br />
it. This will reduce the mobile user’s effort, time and interaction when retrieving information in mobile<br />
devices. In this paper, the context dimensions and context model are presented. Simple experiments are<br />
shown where user context is predicted using the context model.<br />
Keywords: Context recognition, mobile information retrieval, just-in-time information access<br />
INTRODUCTION<br />
It is common now for people to address their information needs by using the web search in<br />
mobile devices. Since mobile users are connected to the Internet almost every minute, accessing<br />
Article history:<br />
Received: 31 March 2012<br />
Accepted: 31 August 2012<br />
E-mail addresses:<br />
azri@fsktm.upm.edu.my (Az Azrinudin Alidin),<br />
fabio.crestani@usi.ch (Fabio Crestani)<br />
*Corresponding Author<br />
information has become much faster than<br />
years before mobile Internet was introduced.<br />
However, performing information retrieval<br />
(IR) on mobile devices is rather complex<br />
because mobile browsers are implemented<br />
without considering the characteristics of
Az Azrinudin Alidin and Fabio Crestani<br />
mobile information retrieval (mobile IR). Besides, the characteristics of mobile IR are quite<br />
different from the traditional IR frameworks.<br />
One notable characteristic of mobile IR is the physical limitations of mobile devices. Mobile<br />
devices are built physically small for ease of portability. This makes it challenging for mobile<br />
users to operate with the mobile device when they are on the move. Besides, adopting desktop<br />
browser to fit the size of a mobile devices screen forces them to spend more time selecting<br />
and reading the right information in small font and crowded text (Church et al., 2002). Mobile<br />
users also need to put extra attention when using mobile devices because they can easily get<br />
distracted by other things going on around them (Sohn et al., 2008). On the other hand, the<br />
evolving smart-phone technologies have enabled researchers and developers to exploit the<br />
embedded sensors in smartphones to sense users’ surrounding information (Lane et al., 2010).<br />
The user’s surrounding information is also known as context. Context, in general, can be<br />
used to overcome the problem of IR systems retrieving too much information that may not be<br />
relevant in the user’s current situation and also to minimize their involvement in interaction<br />
particularly on a mobile device. The embedded sensors on the smartphones make them ideal<br />
devices to capture users’ context because these users always carry the devices.<br />
The inclusion of context in the IR frameworks has become increasingly important<br />
particularly for the implementation of mobile IR. The problem with the current IR systems is that<br />
these systems retrieve all relevant information in response to a query without considering the<br />
representation of the query. These systems do not have any knowledge about user’s preferences,<br />
or why the user submits a particular query or what is the user’s intention when submitting that<br />
particular query. As a result, the relevant information retrieved by the IR systems is too generic<br />
and is not within the right user’s context, and the user needs to spend time finding the desired<br />
information. In order to improve the retrieval results, the implementation of context in the IR<br />
frameworks is employed in one of the following retrieval phases: (a) query reformulation, (b)<br />
document re-ranking, and (c) document retrieval (Tamine-Lechani et al., 2010). However, in<br />
mobile IR, apart from improving the retrieval results, minimizing the user interaction is also<br />
a key to increase the user’s experience when using the mobile IR. Smartphones can react and<br />
adapt to the context to minimize user’s interaction and use context as information trigger to<br />
pro-actively present information to the user. This is also known as Just-In-Time Information<br />
Access system (Leake et al., 1999). For this research, the system is named as Just-In-Time<br />
Mobile Information Retrieval (JIT-MobIR). JIT-MobIR works by monitoring context, predicting<br />
user’s information needs in any given context and proactively providing the user with relevant<br />
information with the aim to reduce user’s interaction. Thus, the effectiveness of JIT-MobIR is<br />
measured both in the capability of the system to understand the context and in the ability of the<br />
system to retrieve information that satisfies user’s information needs in that particular context.<br />
The motivation of this research is to construct, understand and apply context for developing<br />
JIT-MobIR. However, very little work has been done on utilizing context in mobile IR because<br />
of the complexity of constructing and generalizing context. Context, by nature, is always<br />
changing particularly when a user is on the move. This makes context extremely complex to<br />
be identified (Schmidt et al., 1999). How context can be identified and captured by using a<br />
smartphone is explained in this paper. In specific, the paper is organized as follows: In the next<br />
section, work related to the current study is presented. The context modelling in JIT-MobIR is<br />
228 <strong>Pertanika</strong> J. Sci. & Technol. <strong>21</strong> (1): 283 - 298 (<strong>2013</strong>)
Context Modelling for Just-In-Time Mobile Information Retrieval (JIT-MobIR)<br />
introduced subsequently. Then, the implementation of JIT-MobIR is described in detail, with<br />
a discussion on the results, followed by conclusion and future work.<br />
DEFINITION OF CONTEXT<br />
According to the Free Online Dictionary of Computing (FOLDOC), context is defined as “that<br />
which surrounds, and gives meaning to, something else”. However, the definition of FOLDOC<br />
is too broad and vague, and for this reason, many researchers defined the context according<br />
to their own understanding that is influenced by their research observations (Dey & Abowd,<br />
2000; Schilit et al., 1994; Schmidt et al., 1999). Schilit et al. (1994) proposed the definition of<br />
context based on location awareness. However, Schmidt et al. (1999) disagree when context is<br />
treated merely as a location as past researchers always do. They describe that context has many<br />
aspects in three dimensions: Environment, Self and Activity. Nevertheless, Dey and Abowd<br />
(2000) argue that those two definitions of context are experimental oriented and difficult to be<br />
applied. They also argue that one aspect of context is not important from others since these<br />
aspects will change from one situation to another. Thus, context according to Dey and Abowd<br />
(2000) emphasizes that any information will be considered as context when this information<br />
helps a user to interact with an application. However, if the information is no longer relevant to<br />
the user’s interaction, then it is no longer a part of the context. This definition does not restrict<br />
where the context is coming from as long as that context helps the user’s interaction. Dey and<br />
Abowd’s (2000) definition of context is “any information that can be used to characterize<br />
the situation of an entity. An entity is a person, place, or object that is considered relevant<br />
to the interaction between a user and an application, including the user and applications<br />
themselves”. This definition is widely recognized as a formal definition of context by current<br />
researchers. The definition also emphasizes that context has several dimensions which can<br />
clarify the situation of an entity.<br />
DIMENSIONS OF CONTEXT<br />
Previous works on context awareness usually used location as an approximation of context.<br />
Although location is one of the dimensions of context, relying solely on it does not explain the<br />
entire context of a user. Schilit et al. (1994) explained that context should exploit the changing<br />
aspects of the environment. They further summarized the environments as: (a) Computing<br />
environment, such as network connectivity, communication costs, and nearby resources such<br />
as printers and workstations; (b) User environment, such as location and user’s profile; and<br />
(c) Physical environment, such as lighting and noise level. However, according to Schmidt et<br />
al. (1999), the computer environment and the physical environment overlap with each other.<br />
They proposed a hierarchical context model where context is divided into general categories of<br />
human environment and physical environment. Beyond these general categories, each of them<br />
is further divided into three sub-categories where a set of relevant features is identified. The<br />
value of these features will determine the overall user’s context. Based on those two works,<br />
researchers began to propose their own dimensions of context by expanding, reducing the<br />
dimensions or proposing new general models of context according to their own works (Bierig<br />
& Göker, 2006; Brown & Jones, 2002; Korpipaa et al., 2003; Raento et al., 2005; Razzaque et<br />
<strong>Pertanika</strong> J. Sci. & Technol. <strong>21</strong> (1): 283 - 298 (<strong>2013</strong>)<br />
229
Az Azrinudin Alidin and Fabio Crestani<br />
al., 2006). However, some researchers often incorporate too many dimensions of context which<br />
make the context models too complex to be implemented in smartphones. On the other hand,<br />
a few dimensions of context make context models unable to understand the whole context.<br />
CONTEXT AND INFORMATION RETRIEVAL<br />
IR system is dependent upon how efficient a user formulates his information needs into a<br />
form of a query to retrieve relevant information. Mizzaro (1998) discusses how the user’s<br />
actual needs are inadequately represented by the queries. Besides, the retrieval process in the<br />
current IR frameworks does not consider any external information other than the queries. This<br />
external information is also known as a context. The role of context in the IR frameworks<br />
has been discussed by many researchers (see for example, Brown & Jones, 2001; Fuhr, 2005;<br />
Jones & Brown, 2004) and also cited as one of the long-term challenges in IR (Allan et al.,<br />
2004). According to Fuhr (2005), the definition of IR generic task does suggest the need of IR<br />
systems to be user specific and to have the necessary knowledge about the user. This indirectly<br />
indicates the importance of including context to the IR frameworks. Meanwhile, Brown and<br />
Jones (2001) proposed that a query could be constructed by user’s current context on behalf of<br />
user in context-aware retrieval framework. The query would be specific to a user and understand<br />
that user’s situation and information problem. In order to simplify mobile user interaction, Jones<br />
and Brown (2004) also suggested the IR system to behave autonomously and pro-actively in<br />
retrieving and presenting information to a user with the implementation of context. This would<br />
make mobile IR, in some sense, intelligent because information is retrieved and presented to<br />
a user without much effort from the user.<br />
CONTEXT MODELING IN JIT-MobIR<br />
Contextual retrieval by definition is application specific (Fuhr, 2005). Since context plays an<br />
important role in this research, we need to acquire a complete interpretation of user context.<br />
Thus, we proposed our own dimensions of context. These dimensions were created by studying<br />
the dimensions proposed by different researchers and mapping it with the embedded sensors<br />
in Apple iPhone. Details of our dimensions of the context are described below:<br />
• User’s Profile – this dimension stores any information about the user. Information such<br />
as who the user is and habits are saved in this dimension.<br />
• Time – this dimension stores timestamp of every change to other context dimensions. This<br />
dimension contains the date, the days, the hours, and the minutes of change dimensions.<br />
• Location – this dimension stores the information about where the user is.<br />
• Sounds – this dimension identifies the surrounding sounds where the user currently is.<br />
• Activity – this dimension identifies and stores user’s activity.<br />
• Agenda – this dimension contains user’s driven data on user’s future activities.<br />
• Speed – this dimension indicates any change in speed if the user is on the move.<br />
• Heading – this dimension updates user’s heading in order to recognize if the user has<br />
the possibility of visiting previous location in his context.<br />
230 <strong>Pertanika</strong> J. Sci. & Technol. <strong>21</strong> (1): 283 - 298 (<strong>2013</strong>)
Context Modelling for Just-In-Time Mobile Information Retrieval (JIT-MobIR)<br />
• Network – this dimension indicates if the user is connected to the Internet.<br />
• Preferences – this dimension refers to user’s interest in some particular topics.<br />
The information on this part will be updated over time since it can be influenced by many<br />
factors. These dimensions use only the sensors that are embedded in iPhone in order to identify<br />
and capture user’s context. The work by Lane et al. (2010) discusses in detail the lists of Apple<br />
iPhone sensors. However, the extracted sensors data do not represent the whole information<br />
of user’s context. For example, GPS sensor only specifies user’s current location but it does<br />
not indicate why the user is at that location. Thus, the sensor data need to be interpreted to<br />
understand user’s context. Consequently, we developed our own context interpretation model<br />
to translate sensors data into the description of user’s context. This model consists of four<br />
different levels of context interpretation, as depicted in Fig.1.<br />
The levels on this context model are:<br />
• User’s scenario: situations encountered by a particular user.<br />
• High-level context: a description of user’s current context. User’s current context is<br />
characterized by interpreting multiple context dimensions.<br />
• Context dimensions or low-level context: a characterization of multiple sensors data<br />
into meaningful information. It is recognized that one dimension of a context is a subset<br />
of high-level context.<br />
• Sensors data: any information collected from embedded sensors in the smart- phone<br />
and information from user’s interaction with the mobile applications.<br />
In this model, context dimension is regarded as low-level context whereby it interprets<br />
and describes information collected from sensors data. The context dimension addresses the<br />
basic questions like who the user is, where the user is, what the user does, and many more.<br />
Fig.1: Four levels interpretation of context model<br />
<strong>Pertanika</strong> J. Sci. & Technol. <strong>21</strong> (1): 283 - 298 (<strong>2013</strong>)<br />
231
Az Azrinudin Alidin and Fabio Crestani<br />
Each context dimension in this model is treated as a subset of high-level context, which is more<br />
abstract and difficult to characterize. Besides, the high-level context deals with the semantic<br />
relationships between the low-level contexts.<br />
IMPLEMENTATION OF JIT-MobIR<br />
The context model in the previous section is implemented by using the Apple iPhone. The aim<br />
of this study was to recognize user’s context by using the data from iPhone embedded sensors.<br />
The implementation relies solely on iPhone embedded sensors and any external sensor that is not<br />
included in the process of acquiring user’s context. The conceptual architecture of JIT-MobIR<br />
is depicted in Fig.2. In the JIT-MobIR conceptual architecture, the system has two important<br />
functions. The first function of the system is to recognize user’s context and to infer the user’s<br />
information needs. The second function is the retrieval system, where it provides two different<br />
approaches (pro-active retrieval and query-based retrieval). The pro-active retrieval uses user’s<br />
information need in context to retrieve relevant information to the user and present it without<br />
a request from the user himself. For query-based retrieval, the query submitted by the user is<br />
re-formulated by enhancing it with context before it is used to retrieve relevant information.<br />
The user’s information needs in context and query re-formulation are processed in the server<br />
where the contexts are saved. In this architecture, the retrieval process will use a common IR<br />
framework and the mechanism will remain unchanged.<br />
Fig.2: JIT-MobIR conceptual architecture<br />
232 <strong>Pertanika</strong> J. Sci. & Technol. <strong>21</strong> (1): 283 - 298 (<strong>2013</strong>)
Context Modelling for Just-In-Time Mobile Information Retrieval (JIT-MobIR)<br />
In order to recognize user context, context model obtains sample data from the embedded<br />
sensors. These sample data are classified into low-level context and combined in order to<br />
identify high-level context. User’s agenda is also extracted in order to recognize if user’s context<br />
is influenced by the agenda. The system also needs to recognize if the user’s current context is<br />
a repetition of the user’s previous context. If the new user’s context is not a repetition of user<br />
previous context, the agenda will be examined to determine if it affects the new user’s context.<br />
Conversely, simple description of the user’s context is provided if there is no indication that the<br />
context is not a repetition of the user’s previous context or the context is affected by agenda.<br />
Next, the system infers user’s information need in context based on the user’s current context<br />
and the information need analyzer. However, user’s information need in context may fail to<br />
infer user’s information need. If this happens, the system could predict user’s information need<br />
through: (a) acquiring the context from different users that are closely similar to the current<br />
user’s context, or (b) arranging information related to the user’s location, preference, and<br />
context. The information retrieved based on these approaches may not be required by the user<br />
but by presenting the information to the user, the system can update user’s preference based<br />
on the information selected by the user.<br />
RESULTS<br />
The initial result of recognizing user’s context is presented in this section. Since the sensors<br />
can be interpreted in various ways, the sensors interpretation in this study is restricted to<br />
information that is required by JIR-MobIR, as presented in Fig.3. The sensors data are<br />
assigned to the proper dimension with several interpretations. Some of the interpretations are<br />
rather straightforward. However, some of the dimensions require a prior pattern in order to<br />
distinguish the dimensions value. For example, a prior walking pattern of accelerometer data is<br />
required before the context model can recognize it. Thus, initial experiments are conducted to<br />
collect these prior patterns where the application captures several users’ activities and sounds.<br />
The collections of these prior patterns are analyzed and used to automatically interpret the<br />
Fig.3: General sensors analysis for the context dimensions<br />
<strong>Pertanika</strong> J. Sci. & Technol. <strong>21</strong> (1): 283 - 298 (<strong>2013</strong>)<br />
233
Az Azrinudin Alidin and Fabio Crestani<br />
particular dimension. Besides, these patterns need to be general and consistent in interpreting<br />
the dimension when implemented in a later stage.<br />
Fig.4 shows the accelerometer axes. The axes are influenced by gravitation force. By<br />
examining this force, the orientation of the iPhone can be detected. Then, by collecting the force<br />
value over time, the user’s activities can be recognized by analyzing the iPhone orientation.<br />
For this experiment, iPhone accelerometer and microphone data are collected and analyzed to<br />
collect a prior pattern that recognizes the user’s activities and the surrounding sounds.<br />
The initial results of recognizing the user’s activities are presented in Fig.5, Fig.6 and Fig.7,<br />
and the result of analyzing the surrounding sounds is depicted in Fig.8. In this experiment,<br />
the iPhone is always placed inside the front pocket of the user’s trousers because most of the<br />
users often place their smartphones inside the trouser front pocket. The accelerometer data<br />
are collected when the user is doing simple activities like sitting, standing and walking. These<br />
accelerometer patterns will be used as a reference to automatically recognize the context<br />
dimensions of the user’s activity in this research.<br />
Fig.5 shows the pattern for recognizing the sitting activities. The x, y, z axes of the<br />
accelerometer indicated the orientation of the iPhone. If z axis is equivalent to -1, the screen<br />
of the iPhone is facing up and if z axis is equivalent to 1, the screen of the iPhone is facing<br />
down. Since the user is sitting, the values of the x and y axes indicate that the user is practically<br />
not making any movement.<br />
Fig.6 indicates the pattern when the user is standing. The graph indicates when the user<br />
is standing and the user will somehow move a little bit, as indicated by the x and z axes. The<br />
orientation of the iPhone is in portrait orientation when y axis is equivalent to -1 or portrait<br />
upside down when the y axis equal to 1.<br />
On the other hand, a pattern of accelerometer data when the user is walking is shown in<br />
Fig.7. The accelerometer axes are greatly fluctuating and unstable compared to the graphs<br />
when the user is sitting and standing. When the user is walking, the user’s steps cause the<br />
accelerometer to record greater gravitation force as shown in the y axis. Besides, the user’s steps<br />
when walking also cause the iPhone to receive a vibration, as suggested by the values from<br />
the x axis. Hence, the system can automatically distinguish these activities by recognizing the<br />
fluctuating pattern of the accelerometer axes. This process will not require too much processing<br />
power, which can be implemented inside the iPhone without draining its battery life.<br />
Fig.4: The iPhone accelerometer axes<br />
234 <strong>Pertanika</strong> J. Sci. & Technol. <strong>21</strong> (1): 283 - 298 (<strong>2013</strong>)
Context Modelling for Just-In-Time Mobile Information Retrieval (JIT-MobIR)<br />
Fig.5: Accelerometer pattern for the sitting activity<br />
Fig.6: Accelerometer pattern for the standing activity<br />
Fig.7: Accelerometer pattern for the walking activity<br />
<strong>Pertanika</strong> J. Sci. & Technol. <strong>21</strong> (1): 283 - 298 (<strong>2013</strong>)<br />
235
Az Azrinudin Alidin and Fabio Crestani<br />
Fig.8 indicates the patterns of different sound categories. These patterns captured the sound<br />
pressure power or decibel from the microphone instead of using sound recognition. There are<br />
four sound patterns captured in this experiment, which are: “quiet”, “conversation”, “noisy”<br />
and “very noisy”. The “quiet” pattern is probably difficult to capture because the consistently<br />
quiet surrounding sound is not easy to obtain. The “conversation” pattern shows that the<br />
lowest decibel almost reaches zero decibel because while people are conversing, there are<br />
moments when people are silent for brief seconds. The “very noisy” and “noisy” patterns can<br />
be differentiated by identifying the lowest and the highest decibels.<br />
CONCLUSION AND FUTURE WORK<br />
Fig.8: Sound patterns<br />
The results presented in this paper have shown how context could be identified and captured<br />
by using embedded sensors in smartphone. The results collected in this paper will be used as<br />
prior patterns to automatically recognize context in a later development without using complex<br />
recognition algorithm. This could ensure that smartphone can be used to identify context<br />
without draining its battery life.<br />
The next development in this research focuses on context interpretation, context utilization<br />
in JIT-MobIR and user’s verification of the JIT-MobIR. The current implementation in this<br />
study emphasizes on identifying and capturing user’s context based on the analysis of the<br />
embedded sensors. In order to develop a feasible JIT-MobIR system, three different studies<br />
are outlined, and these are:<br />
1. Generating context interpretation, where user’s context is automatically interpreted<br />
by using the patterns collected in this paper.<br />
2. User’s validation, where the system is employed in real situation and the user’s<br />
validation of his context is collected.<br />
3. Relationship between context and queries, where the system needs to understand how<br />
queries can be substituted by context.<br />
236 <strong>Pertanika</strong> J. Sci. & Technol. <strong>21</strong> (1): 283 - 298 (<strong>2013</strong>)
ACKNOWLEDGMENTS<br />
Context Modelling for Just-In-Time Mobile Information Retrieval (JIT-MobIR)<br />
The authors gratefully acknowledged the Ministry of Higher Education, Malaysia for the<br />
inancial support provided for this study.<br />
REFERENCES<br />
Allan, J. Aslam, J., Belkin, N., Buckley, C., Callan, J., Croft, B., Dumais, S., Fuhr, N., Harman, D., &<br />
Harper, D. (2004). Challenges in information retrieval and language modelling. Report of a Workshop<br />
held at the Centre for Intelligent Information Retrieval. University of Massachusetts Amherst,<br />
September 2002. Computing Reviews, 45(7), 437.<br />
Bierig, R., & Göker, A. (2006). Time, location and interest: an empirical and user-centred study. Paper<br />
presented at the 1st international conference on Information interaction in context, IIiX, pp.79–87.<br />
Brown, P., & Jones, G. (2001). Context-aware retrieval: exploring a new environment for information<br />
retrieval and information filtering. Personal and Ubiquitous Computing, 5(4), 253–263.<br />
Brown, P. J., & Jones, G. J. F. (2002). Exploiting contextual change in context-aware retrieval. Paper<br />
presented at the ACM Symp. on Applied computing, SAC ’02. pp.650–656.<br />
Church, K., Smyth, B., & Keane, M. T. (2006). Evaluating interfaces for intelligent mobile search. Paper<br />
presented at the International cross-disciplinary workshop on Web accessibility (W4A): Building the<br />
mobile web: rediscovering accessibility? W4A’06. pp.69–78.<br />
Dey, A., & Abowd, G. (2000). Towards a Better Understanding of Context and Context-Awareness.<br />
Paper presented at the CHI’2000 Workshop on The What, Who, Where, When, and How of Context-<br />
Awareness. pp.304–307.<br />
Fuhr, N. (2005). Information Retrieval-From Information Access to Contextual Retrieval. Designing<br />
Information Systems. Festschrift für Jürgen Krause, 47.<br />
Jones, G., & Brown, P. (2004). The role of context in information retrieval. Paper presented at the SIGIR<br />
2004 Information Retrieval in Context. pp.20–22.<br />
Korpipaa, P., Mantyjarvi, J., Kela, J., Keranen, H., & Malm, E. (2003). Managing context information<br />
in mobile devices. IEEE Pervasive Computing, 2(3), 42–51.<br />
Lane, N., Miluzzo, E., Lu, H., Peebles, D., Choudhury, T., & Campbell, A. (2010). A survey of mobile<br />
phone sensing. Communications Magazine, IEEE, 48(9), 140 –150.<br />
Leake, D. B., Scherle, R., Budzik, J., & Hammond, K. (1999). Selecting task-relevant sources for justin-time<br />
retrieval. Paper presented at the AAAI-99 Workshop on Intelligent Information Systems,<br />
Menlo Park, CA.<br />
Mizzaro, S. (1998). How many relevances in information retrieval? Interacting with Computers, 10(3),<br />
303 – 320.<br />
Raento, M., Oulasvirta, A., Petit, R., & Toivonen, H. (2005). Contextphone: A prototyping platform for<br />
context-aware mobile applications. IEEE Pervasive Computing, 4(2), 51–59.<br />
Razzaque, M. A., Dobson, S., & Nixon, P. (2006). Categorization and modelling of quality in context<br />
information. Paper presented at the IJCAI 2005 Workshop on AI and Autonomic Communications.<br />
Schilit, B., Adams, N., & Want, R. (1994). Context-aware computing applications. Paper presented at<br />
the Workshop on Mobile Computing Systems and Applications. pp.85–90.<br />
<strong>Pertanika</strong> J. Sci. & Technol. <strong>21</strong> (1): 283 - 298 (<strong>2013</strong>)<br />
237
Az Azrinudin Alidin and Fabio Crestani<br />
Schmidt, A., Aidoo, K., Takaluoma, A., Tuomela, U., Van Laerhoven, K., & Van de Velde, W. (1999).<br />
Advanced interaction in context. In H.-W. Gellersen (Ed.), Handheld and Ubiquitous Computing (pp.<br />
89–101). Springer Berlin/ Heidelberg.<br />
Schmidt, A., Beigl, M., & Gellersen, H. (1999). There is more to context than location. Computers &<br />
Graphics, 23(6), 893 – 901.<br />
Sohn, T., Li, K. A., Griswold, W. G., & Hollan, J. D. (2008). A diary study of mobile information needs.<br />
Paper presented at the twenty-sixth annual SIGCHI conference on Human Factors in Computing<br />
Systems, CHI’08, 433–442.<br />
Tamine-Lechani, L., Boughanem, M., & Daoud, M. (2010). Evaluation of contextual information retrieval<br />
effectiveness: overview of issues and research. Knowledge and Information Systems, 24(1), 1–34.<br />
238 <strong>Pertanika</strong> J. Sci. & Technol. <strong>21</strong> (1): 283 - 298 (<strong>2013</strong>)
ISSN: 0128-7680 © <strong>2013</strong> <strong>Universiti</strong> <strong>Putra</strong> Malaysia Press.<br />
<strong>Pertanika</strong> J. Sci. & Technol. <strong>21</strong> (1): 239 - 246 (<strong>2013</strong>)<br />
SCIENCE & TECHNOLOGY<br />
<strong>Journal</strong> homepage: http://www.pertanika.upm.edu.my/<br />
Using SVMs for Classification of Cross-Document Relationships<br />
Yogan Jaya Kumar 1,2 *, Naomie Salim 2 , Ahmed Hamza Osman 2 and<br />
Albaraa Abuobieda 2<br />
1 Faculty of Information and Communication Technology, <strong>Universiti</strong> Teknikal Malaysia Melaka,<br />
76100 Durian Tunggal, Melaka, Malaysia<br />
2 Faculty of Computer Science and Information Systems, <strong>Universiti</strong> Teknologi Malaysia, 81310 Skudai,<br />
Johor, Malaysia<br />
ABSTRACT<br />
Cross-document Structure Theory (CST) has recently been proposed to facilitate tasks related to multi-<br />
document analysis. Classifying and identifying the CST relationships between sentences across topically<br />
related documents have since been proven as necessary. However, there have not been sufficient studies<br />
presented in literature to automatically identify these CST relationships. In this study, a supervised<br />
machine learning technique, i.e. Support Vector Machines (SVMs), was applied to identify four types<br />
of CST relationships, namely “Identity”, “Overlap”, “Subsumption”, and “Description” on the datasets<br />
obtained from CSTBank corpus. The performance of the SVMs classification was measured using<br />
Precision, Recall and F-measure. In addition, the results obtained using SVMs were also compared<br />
with those from the previous literature using boosting classification algorithm. It was found that SVMs<br />
yielded better results in classifying the four CST relationships.<br />
Keywords: CST relation, multi-document, rhetorical relation, SVMs<br />
INTRODUCTION<br />
Discourse analysis in texts has nowadays become very prominent, especially when it involves<br />
multiple texts such as documents. The idea of cross-document structural relationship is to<br />
investigate the existence of inter-document rhetorical relationships. These rhetorical relations are<br />
based on the CST model (Cross-document Structure Theory) (Radev, 2000). Documents which<br />
Article history:<br />
Received: 31 March 2012<br />
Accepted: 31 August 2012<br />
E-mail addresses:<br />
yogan@utem.edu.my (Yogan Jaya Kumar),<br />
naomie@utm.my (Naomie Salim),<br />
ahmedagraa@hotmail.com (Ahmed Hamza Osman),<br />
albarraa@hotmail.com (Albaraa Abuobieda)<br />
*Corresponding Author<br />
are related to the same topic usually contain<br />
semantically related textual units. These<br />
textual units can be words, phrases, sentences,<br />
or the documents itself. The general schema<br />
of CST is shown in Fig.1. In the current work,<br />
only the semantic relations between sentences<br />
were taken into consideration. Some examples<br />
of such semantic connections are “Identity”,
Yogan Jaya Kumar, Naomie Salim, Ahmed Hamza Osman and Albaraa Abuobieda<br />
“Contradiction”, “Description”, and “Historical background”. Table 1 shows some examples<br />
of the sentence pairs that hold CST relationship. Full descriptions of the CST relations are<br />
given in Radev (2000).<br />
The work on CST can be put in line with Rhetorical Structure Theory (RST) (Taboada<br />
& Mann, 2006). The difference between these two theories is that RST aims to capture the<br />
rhetorical relation between span of adjacent text units, while CST goes across topically related<br />
documents to describe its rhetorical relation. In topically related documents, especially news<br />
articles, the information contents are closely connected even though the news story comes from<br />
various sources. By referring to the description of CST relations shown in Table 1, it can be seen<br />
that these types of relations are essential for the analysis of redundancy, complementarity and<br />
contradiction among different information sources. Thus, the ability to automatically identify<br />
the types of CST relationship will definitely be handy for tasks related to multi-document<br />
analysis. A number of research works have addressed the benefits of CST for summarization<br />
task (see for instance, Zhang et al., 2002; Jorge et al., 2010). Nonetheless, a major limitation<br />
of these works is that the CST relationships need to be manually annotated by human expert.<br />
Human annotation is not only expensive, but it also consumes a lot of time.<br />
There have been efforts put to learn the CST relationships in texts. Zhang et al. (2003)<br />
used boosting, i.e. a classification algorithm, to identify the presence of CST relationships<br />
between sentences. It is an adaptive algorithm which works by iteratively learning previous<br />
weak classifiers and adding them to a final strong classifier. The authors experimented with CST<br />
annotated article cluster that built the CSTBank corpus. Hence, lexical, syntactic and semantic<br />
features were used for data representation. Their classifier was able to identify sentence pairs<br />
with no relationship very well, but showed a rather poor performance in classifying the other<br />
types of CST relationship.<br />
Fig.1: CST general schema (Radev, 2000)<br />
240 <strong>Pertanika</strong> J. Sci. & Technol. <strong>21</strong> (1): 283 - 298 (<strong>2013</strong>)
Using SVMs for Classification of Cross-Document Relationships<br />
TABLE 1: Some examples of the CST relationship between sentences (source: Zhang et al., 2002)<br />
Relationship Description Text span 1 (S1) Text span 2 (S2)<br />
Identity The same text appears in<br />
more than one location<br />
Equivalence Two text spans have the<br />
same information content<br />
Translation The same information<br />
content in different<br />
languages<br />
Subsumption S1 contains all<br />
information in S2, plus<br />
additional information<br />
not in S2<br />
Tony Blair was elected<br />
for a second term today.<br />
Derek Bell is<br />
experiencing resurgen0ce<br />
in his career.<br />
Shouts of “Viva la<br />
revolucion!” echoed<br />
through the night.<br />
With 3 wins this year,<br />
Green Bay has the best<br />
record in the NFL.<br />
Contradiction Conflicting information There were 122 people on<br />
the downed plane.<br />
Historical<br />
Background<br />
S1 gives historical<br />
context to information<br />
in S2<br />
This was the fourth<br />
time a member of the<br />
Royal Family has gotten<br />
divorced.<br />
<strong>Pertanika</strong> J. Sci. & Technol. <strong>21</strong> (1): 283 - 298 (<strong>2013</strong>)<br />
Tony Blair was elected<br />
for a second term today.<br />
Derek Bell is having a<br />
“comeback year.”<br />
The rebels could be heard<br />
shouting, “Long live the<br />
revolution”.<br />
Green Bay has 3 wins<br />
this year.<br />
126 people were aboard<br />
the plane.<br />
The Duke of Windsor<br />
was divorced from the<br />
Duchess of Windsor<br />
yesterday.<br />
In another related work, Miyabe et al. (2008) investigated on the identification of CST<br />
relationship types by using cluster-wise classification with SVM classifier. They used a<br />
Japanese cross-document relation corpus annotated with CST relationships. The authors<br />
proposed using the detected “Equivalence” relations to address the task of “Transition”<br />
identification. In particular, similarity through the variable noun phrases was used for transition<br />
identification. They obtained F-measure of 75.50% for equivalence and 45.64% for transition.<br />
However, their approach is only limited to the two aforementioned relations.<br />
Closely related to our work is the approach by Zahri and Fukumoto (2011). The authors<br />
determined five types of CST relation between sentences using SVMs. The authors computed<br />
the lexical features between sentence pairs using the dataset from the CSTBank corpus. Then,<br />
they used the identified CST relations to determine the directionality between the sentences<br />
for PageRank (Erkan & Radev, 2004) computation. However there were no experimental<br />
results specifically shown on the performance of their CST relationship classification. This<br />
is essential because the performance of the classification has direct implication on the final<br />
results of the system.<br />
METHODS<br />
Relying on manually annotated text for CST relationship identification consumes a lot of time<br />
and resources. Thus, it is favourable to have a system which can automatically identify the<br />
existence of the CST relations between pairs of sentences. However, at this point of time, we<br />
are only considering four types of CST relations, namely “Identity”, “Overlap”, “Subsumption”,<br />
and “Description”. More details of these relations are given in Table 2. Meanwhile, further<br />
details with examples can be found in Zhang et al. (2002).<br />
241
Yogan Jaya Kumar, Naomie Salim, Ahmed Hamza Osman and Albaraa Abuobieda<br />
TABLE 2: The CST relations used in this work<br />
Relationship Description<br />
Identity The same text appears in more than one location<br />
Subsumption S1 contains all information in S2, plus additional information not<br />
in S2<br />
Description S1 describes an entity mentioned in S2<br />
Overlap (partial<br />
equivalence)<br />
S1 provides facts X and Y while S2 provides facts X and Z; X, Y,<br />
and Z should all be non-trivial<br />
In this study, the publically available CSTBank corpus was exploited (Radev et al., 2003) – ,<br />
i.e. a corpus consisting clusters of English news articles annotated with the CST relationships.<br />
Using the datasets from CSTBank, we were able to obtain our training and testing data. Then,<br />
the training set comprising of the features between sentence pairs with its corresponding CST<br />
relationship was prepared. Each of these sentence pairs was represented using four lexical<br />
features which could be useful to differentiate the CST relationships between the sentences.<br />
After that 100 pairs of sentences that posed no CST relations were manually selected for the<br />
training and test data. The lexical features that were computed for each sentences pair are<br />
described in the following.<br />
Cosine similarity – cosine similarity is used to measure how similar two sentences<br />
are. Here, the sentences are represented as word vectors having words with tf-idf as the<br />
element value:<br />
cos( S , S ) =<br />
1 2<br />
∑ S ⋅ S<br />
∑ ∑<br />
1, i 2, i<br />
( S ) ⋅ ( S )<br />
2 2<br />
1, i 2, i<br />
Word overlap – this feature represents the measure on the numbers of words overlapping<br />
in the two sentences (after stemming process). This measure is not sensitive to the word<br />
order in the sentences:<br />
# words( S1∩S2) overlap( S1, S2)<br />
=<br />
# words( S ∪ S )<br />
1 2<br />
Length difference – length difference gives the measure of difference between the lengths<br />
of two sentences. It shows how long or how short a sentence is compared to the other:<br />
lengdiff ( S , S ) = length( S ) −<br />
length( S )<br />
1 2 1 2<br />
Length type of S 1 – this feature gives the length type of the first sentence when the lengths<br />
of two sentences are compared:<br />
242 <strong>Pertanika</strong> J. Sci. & Technol. <strong>21</strong> (1): 283 - 298 (<strong>2013</strong>)<br />
(1)<br />
(2)<br />
(3)
Using SVMs for Classification of Cross-Document Relationships<br />
lengtype( S1) = 1 if length( S1) > length( S2),<br />
-1 if length( S1) < length( S2),<br />
0 if length( S ) = length( S )<br />
1 2<br />
Support Vector Machines (SVMs) (Vapnik, 1995), a supervised machine learning technique<br />
commonly used for classification and regression analysis, was employed in this work. SVMs<br />
are feature-based classifiers, where each instance from the datasets is usually represented as a<br />
feature vector which is then used as an input for machine learning. An excellent introduction to<br />
SVMs can be found in Cristianini and Taylor (2000). SVMs are basically two-class classifiers.<br />
A support vector machine builds a hyperplane that separates the instances of the two classes.<br />
Since ours is a multi-class problem, SVMs built a set of one-versus-one classifiers, and chose<br />
the class that is selected by most classifiers. The general flow of the classification process is<br />
shown in Fig.2.<br />
Based on the dataset from CSTBank, a total of 477 sentence pairs were selected for the<br />
training and 205 sentence pairs were used for the testing. These included the sample of 100<br />
sentence pairs with no CST relationship. First of all, the texts were preprocessed by stop-word<br />
filtering and word stemming. After computing each of the feature values for every sentence<br />
pair from the training set, they were used as inputs for the training of SVMs. The training<br />
data were then trained using the LibSVM tool (Chang & Lin, 2011) on MATLAB. The SVMs<br />
model best parameters were chosen after applying 5-folds cross validation. Once the training<br />
was completed, the resulting classifier model was tested by using the test data to measure its<br />
performance. The performance of SVMs classification was evaluated using Precision, Recall<br />
and F-measure.<br />
Fig.2: The training and classification processes<br />
<strong>Pertanika</strong> J. Sci. & Technol. <strong>21</strong> (1): 283 - 298 (<strong>2013</strong>)<br />
(4)<br />
243
Yogan Jaya Kumar, Naomie Salim, Ahmed Hamza Osman and Albaraa Abuobieda<br />
RESULTS AND DISCUSSION<br />
Fig.3 shows the results of the classification in the present study. It can be observed that the<br />
SVM achieved a high precision and recall in determining the relation “Identity” as compared<br />
to the rest of the CST relationships. To detect “No relation” sentence pairs, the precision score<br />
was good but its recall was below average. The rest of the relations obtained average results.<br />
One possible reason for getting imbalance classification results was probably the features<br />
chosen for the SVM training. Since the features used in this work are only of lexical type,<br />
SVM might not well differentiate most of the relation types. Thus, it can be assumed that the<br />
performance of the classifier can be further improved by selecting better features for training.<br />
With the motivation to observe the general performance of the SVM classification in<br />
identifying the CST relationship between sentences, the initial results retrieved were also<br />
compared with those obtained by Zhang et al. (2003) who had applied boosting classification<br />
algorithm (BCA). Table 3 gives the precision, recall and F-measure, while Fig.4 shows the<br />
F-measure comparison between the two methods. It was observed that BCA performed well<br />
in differentiating non-CST related sentence pairs. However, SVM was found to outperform<br />
BCA in classifying the other types of CST relationships.<br />
TABLE 3: A comparison of the results<br />
Relationship<br />
No relation<br />
Identity<br />
Subsumption<br />
Description<br />
Overlap<br />
Fig.3: The classification by SVM<br />
Precision Recall F-Measure<br />
BCA SVM BCA SVM BCA SVM<br />
0.89 0.76 0.94 0.32 0.91 0.45<br />
- 0.95 - 0.87 - 0.91<br />
0.06 0.48 0.04 0.77 0.05 0.59<br />
0.26 0.47 0.<strong>21</strong> 0.62 0.23 0.54<br />
0.55 0.63 0.35 0.61 0.43 0.62<br />
244 <strong>Pertanika</strong> J. Sci. & Technol. <strong>21</strong> (1): 283 - 298 (<strong>2013</strong>)
CONCLUSION<br />
Using SVMs for Classification of Cross-Document Relationships<br />
Fig.4: A comparison of the F-measures between BCA and SVM<br />
The feasibility to identify the CST relationships between the sentences across topically related<br />
documents is a noteworthy advancement for multi-document analysis. However, there have<br />
not been sufficient studies presented in the literature to automatically identify these CST<br />
relationships. In this paper, an attempt to investigate the performance of SVMs classification<br />
technique for identifying four types of CST relations (namely, “Identity”, “Overlap”,<br />
“Subsumption”, and “Description”) was carried out. In order to achieve this, the publically<br />
available CSTBank corpus (i.e. the corpus with human annotated CST relationships) was<br />
exploited so as to obtain the required training and testing data. Each instance of these datasets<br />
was represented using the lexical features.<br />
The performance of the SVMs classification was evaluated using Precision, Recall and<br />
F-measure. The experimental results showed that we were able to detect “Identity” relation very<br />
well and also produced average results for the other types of relations. Moreover, the results<br />
obtained using SVMs were also compared with those retrieved from the previous literature using<br />
boosting classification algorithm. It was observed that overall, the SVMs classification yields<br />
better results. Currently, the authors are investigating further into improving the performance of<br />
the classifier by proposing additional semantic features such as noun phrases, verb phrases, etc.<br />
for feature vector representation. By being able to produce better classification accuracy, it can<br />
be stated that many applications related to multi document analysis will gain benefit out of it.<br />
ACKNOWLEDGEMENTS<br />
The research was sponsored by IDF and the Ministry of Science Technology and Innovation,<br />
under the University’s research grant vote number 01H74, <strong>Universiti</strong> Teknologi Malaysia.<br />
<strong>Pertanika</strong> J. Sci. & Technol. <strong>21</strong> (1): 283 - 298 (<strong>2013</strong>)<br />
245
REFERENCES<br />
Yogan Jaya Kumar, Naomie Salim, Ahmed Hamza Osman and Albaraa Abuobieda<br />
Chang, C. C., & Lin C. J. (2011). LIBSVM: a library for support vector machines. ACM Transactions<br />
on Intelligent Systems and Technology, 227(1-27), 27.<br />
Cristianini, N., & Shawe-Taylor, J. (2000). An Introduction to Support Vector Machines and Other<br />
Kernel-Based Learning Methods. Cambridge: Cambridge University Press.<br />
Erkan, G., & Radev D. R. (2004). LexPageRank: Prestige in multi-document text summarization. In<br />
Proceedings of the Conference on Empirical Methods in Natural Language Processing, 365-371.<br />
Jorge, M. L. C., & Pardo, T. S. (2010). Experiments with CST-based Multidocument Summarization.<br />
Workshop on Graph-based Methods for Natural Language Processing, ACL, 74–82.<br />
Miyabe, Y., Takamura, H., & Okumura, M. (2008). Identifying cross-document relations between<br />
sentences. In Proceedings of the 3 rd International Joint Conference on Natural Language Processing,<br />
141–148.<br />
Radev, D. R. (2000). A Common Theory of Information Fusion from Multiple Text Sources Step One:<br />
Cross-Document Structure. Paper presented at the 1 st ACL SIGDIAL Workshop on Discourse and<br />
Dialogue, 10, pp.74-83.<br />
Radev, D. R., & Otterbacher, J. (2003). CSTBank Phase I. Retrieved at http://tangra.si.umich.edu/clair/<br />
CSTBank/phase1.htm<br />
Taboada, M., & Mann, W. C. (2006). Rhetorical Structure Theory: Looking Back and Moving Ahead.<br />
Discourse Studies, 8, 423-459.<br />
Vapnik, V. (1995). The Nature of Statistical Learning Theory. New York: Springer Verlag.<br />
Zahri, N. A. H .B., & Fukumoto, F. (2011). Multi-document Summarization Using Link Analysis Based<br />
on Rhetorical Relations between Sentences. Paper presented at the 12 th International Conference on<br />
Computational Linguistics and Intelligent Text Processing, 2, pp.328-338.<br />
Zhang, Z., Blair-Goldensohn, S., & Radev, D. R. (2002). Towards CST-Enhanced Summarization. Paper<br />
presented at the 18th National Conference on Artificial Intelligence, pp.439-446.<br />
Zhang, Z., Otterbacher, J., & Radev, D. R. (2003). Learning cross-document structural relationships<br />
using boosting. Paper presented at the 12 th International Conference on Information and Knowledge<br />
Management, pp.124-130.<br />
246 <strong>Pertanika</strong> J. Sci. & Technol. <strong>21</strong> (1): 283 - 298 (<strong>2013</strong>)
ISSN: 0128-7680 © <strong>2013</strong> <strong>Universiti</strong> <strong>Putra</strong> Malaysia Press.<br />
<strong>Pertanika</strong> J. Sci. & Technol. <strong>21</strong> (1): 247 - 260 (<strong>2013</strong>)<br />
SCIENCE & TECHNOLOGY<br />
<strong>Journal</strong> homepage: http://www.pertanika.upm.edu.my/<br />
Usability of Educational Computer Game (UsaECG):<br />
A Quantitative Approach<br />
Hasiah Mohamed@Omar 1 *, Azizah Jaafar 2 and Rohana Yusoff 1<br />
1 Faculty of Computer & Mathematical Sciences, <strong>Universiti</strong> Teknologi MARA, 23000 Dungun, Terengganu,<br />
Malaysia<br />
2 Institute of Visual Informatics, <strong>Universiti</strong> Kebangsaan Malaysia , 43600 Bangi, Selangor, Malaysia<br />
ABSTRACT<br />
Heuristic Evaluation (HE) is used as a basis in developing a new technique to evaluate usability or<br />
educational computer games known as Playability Heuristic Evaluation for Educational Computer Game<br />
(PHEG). PHEG was developed to identify usability problems that accommodate five heuristics, namely,<br />
interface, educational elements, content, playability and multimedia. In HE process, usability problems<br />
are rated based on severity score and this is followed by presentation of a mean value. The mean value<br />
is used to determine the level of usability problems; however, in some cases, this value may not accurate<br />
because it will ignore the most critical problems found in a specific part. In developing PHEG, a new<br />
quantitative approach was proposed in analyzing usability problems data. Numbers of sub-heuristics for<br />
each heuristic involved were taken into account in calculating percentage for each heuristic. Functions<br />
to calculate critical problems were also introduced. Evaluation for one educational game that was still<br />
in development process was conducted and the results showed that most of the critical problems were<br />
found in educational elements and content heuristics (57.14%), while the least usability problems were<br />
found in playability heuristic. In particular, the mean value in this analysis can be used as an indicator<br />
in identifying critical problems for educational computer games.<br />
Keywords: Usability of educational computer game, tool, interface, playability, multimedia<br />
Article history:<br />
Received: 31 March 2012<br />
Accepted: 31 August 2012<br />
E-mail addresses:<br />
hasia980@tganu.uitm.edu.my (Hasiah Mohamed@Omar),<br />
aj@ftsm.ukm.my (Azizah Jaafar),<br />
rohanayu@tganu.uitm.edu.my (Rohana Yusoff)<br />
*Corresponding Author<br />
INTRODUCTION<br />
In application development process,<br />
evaluation plays an important and integral<br />
part. This evaluation can be carried out either<br />
during the development (formative) or once<br />
the development is completed (summative).<br />
Expert evaluators may involve in any stage<br />
either formative or summative and real<br />
(potential) users are normally involved during<br />
summative evaluation. Meanwhile, selection
Hasiah Mohamed@Omar, Azizah Jaafar and Rohana Yusoff<br />
of the evaluators depends on the types of application, evaluation techniques and tools. One<br />
of the many popular applications nowadays is computer games. The popularity of computer<br />
games leads to the increment of computer game development that integrates educational<br />
elements in it. There are a lot of researches conducted on the integrations of computer games<br />
and educational elements in the perspective of impact, implication and effects (Yee Leng et<br />
al., 2010). The terms used for these applications are known as game based learning, computer<br />
games, educational computer games and digital game based learning (Kato, 2010; Papastergiou,<br />
2009; Robertson & Howells, 2008).<br />
The integration of fun to be played by the users and also the ability to contribute to<br />
the teaching and learning processes have become vital elements in any educational games<br />
development process. In order to merge these elements, comprehensive evaluation technique<br />
is needed during the development process. One of the evaluation techniques that is normally<br />
used by expert evaluators is Heuristic Evaluation (HE). In particular, HE is used by expert<br />
evaluators to examine the interface of any applications during interactive design process. The<br />
experts’ involvement in the evaluation process is able to help developers to detect usability<br />
problem before the game can be released (Hasiah & Azizah, 2011b). The ability and the<br />
characteristics of HE have been used as a basis in developing specific heuristic technique to<br />
evaluate educational computer games (ECG). This technique is known as Playability Heuristic<br />
Evaluation for Educational Computer Game (PHEG), which consists of five heuristics, namely,<br />
interface (IN), educational element (ED), content (CN), playability (PL) and multimedia<br />
(MM) (Hasiah & Azizah, 2010). The experts who are involved in the evaluation process are<br />
from various backgrounds based on the heuristics provided, such as interface expert (for IN),<br />
educational technologies (for ED), subject matter experts (for CN), multimedia experts (for<br />
MM) and game developers (for PL).<br />
The experts’ involvement in the evaluation process shows a significant impact in<br />
identifying usability problems based on their knowledge and experiences. On the other hand,<br />
gathering experts in one place to conduct an evaluation is not an easy task since experts’<br />
work commitments need to be taken into consideration. In order to overcome this problem,<br />
an evaluation system known as AHP_HeGES was developed to assist the evaluation process.<br />
This online system can be used by the experts to conduct the evaluation and it is capable of<br />
handling the experts from various backgrounds at one time (Hasiah & Azizah, 2011b). A pilot<br />
study was conducted to test the system with the involvement of an expert for each heuristic. All<br />
the experts were able to accomplish the evaluation process accordingly, as well as to identify<br />
and list down usability problems based on the sub-heuristics involved and rate severity scale.<br />
In analyzing the HE data or known as usability problems, severity rating plays important<br />
roles in helping developers to predict the level of usability problems in any application that<br />
is being evaluated. The experts normally identified all usability problems after inspecting the<br />
interface of the applications and rating the severity rating score based on the severity that<br />
was introduced by Nielsen (1995). Most of the papers have reported that the presentations of<br />
severity rating were calculated based on the mean of the severity rating (Nielsen, 1995; Pinelle<br />
et al., 2009; Ssemugabi & Villiers, 2007; Tan, Liu & Bishu, 2009).<br />
The aim of this study was to propose potential quantitative analysis approach for usability<br />
of ECG based on the usability problems (results) presented in Hasiah and Azizah (2011b).<br />
248 <strong>Pertanika</strong> J. Sci. & Technol. <strong>21</strong> (1): 283 - 298 (<strong>2013</strong>)
Usability of Educational Computer Game (UsaECG): A Quantitative Approach<br />
This paper reports the potential quantitative analysis for PHEG data in order to estimate the<br />
usability level of ECG. This research is important to facilitate game developers to get evaluators’<br />
feedback and usability problems of the ECG that is still in the development process.<br />
HEURISTIC EVALUATION<br />
Heuristics evaluation (HE) is a design guideline which serves as a useful evaluation tool for<br />
both product designers and usability professional (Nielsen & Molich, 1990). HE is an inspection<br />
evaluation technique that is normally used by an expert to find any usability problem in any<br />
product or system (Mureen et al.,2007; Nielsen & Molich, 1990). In particular, HE is commonly<br />
used for formative evaluation where the product or system is still in a development process.<br />
HE involves a small number of evaluators (expert in specific field) who have been assigned<br />
to inspect a system according to heuristics or guidelines that are relevant and focused on the<br />
interface of the system. HE is a light-weight process that can be cheap, fast, and easy to apply<br />
in an evaluation process (Nielsen, 1994). It can be used both in the design and evaluation<br />
phases of development and can even be applied to paper-based designs before the first working<br />
prototype is created (Nielsen & Molich, 1990). Studies on HCI have shown that using five<br />
evaluators may be enough to find most usability problems, while adding more will reduce<br />
the benefit to the cost ratio, and hence, suggesting that three may suffice (Nielsen & Molich,<br />
1990). It can be used both in design and evaluation phases of development and can even can be<br />
applied to paper-based designs before the first working prototype is created. The HE technique<br />
has emerged from an evaluation of software (system and products) to one of the most popular<br />
applications nowadays, that is, games (Hasiah & Azizah, 2010).<br />
In HE, there is a list of heuristics attributes that cover common criteria for any system that<br />
focuses on user’s interface and interaction elements. These elements cover all the perspective<br />
of the system in general but in terms of educational computer game (ECG), to the best of our<br />
knowledge, there are no specific heuristics which accommodate all the elements in ECG, such<br />
as educational design and contents. Therefore, another set of heuristics that focuses on ECG<br />
is required. The argument for the requirement is the usability in ECG should deal with several<br />
elements of education if they are to be applied in teaching and learning officially. Hence, the<br />
elements of education, such as content and educational design, should be taken into consideration<br />
in the evaluation. A specific evaluation technique that is dealing with all the important criteria<br />
of educational computer games is known as Heuristic Evaluation for Educational Computer<br />
Game (PHEG) (Hasiah & Azizah, 2011a). In particular, PHEG accommodates five heuristics<br />
in evaluating the usability of educational computer games (UsaECG), interface, educational<br />
element, content, playability and multimedia.<br />
EVALUATION PROCESS IN HE<br />
Heuristic evaluation is a discount usability engineering method for quick, cheap, and easy<br />
evaluation of a user interface design (Kirmani, 2008). The goal of the evaluation process in<br />
HE is to find the usability problems in the design so that they can be attended to as parts of an<br />
iterative design process (Kirmani, 2008). The HE, developed by Nielsen and Molich in 1990<br />
(Nielsen & Molich, 1990), is a technique used to evaluate the usability, with the inspection<br />
<strong>Pertanika</strong> J. Sci. & Technol. <strong>21</strong> (1): 283 - 298 (<strong>2013</strong>)<br />
249
Hasiah Mohamed@Omar, Azizah Jaafar and Rohana Yusoff<br />
being carried out mainly by evaluators, normally referred to as expert evaluators. The studies<br />
by Nielsen (1995) have shown that a number between 3 and 5 evaluators is enough. “It detects<br />
approximately 42% of serious design problems and 32% of minor problems, depending on the<br />
number of evaluators who reviewed the site” (Nielsen, 1995). In order to make a HE efficient<br />
and to provide quality results, the phases below should be taken into consideration:<br />
1. Prior training: The evaluator must become familiar with the interface for a few<br />
minutes to learn the website and to be able to carry out the HE agilely.<br />
2. Evaluations: The evaluator follows the set of heuristics to find deficiencies or to<br />
catalogue the website as usable. He can write comments.<br />
3. Rate severity: The evaluator should determine the severity of each of the problems<br />
encountered. It is therefore appropriate that the priority of the problems is rated.<br />
He suggests three parameters: Frequency of problems occurs (are the users<br />
affected by the occurrence of the problem, and persistence of the problem). Is it<br />
a one-time problem and can the users overcome once they know about it or will<br />
the users repeatedly be bothered by the problem? (Nielsen & Molich, 1990). The<br />
problems in each parameter can score on a scale of 0 (not a usability problem) to<br />
4 (catastrophe: it is obligatory to fix it) (Nielsen & Molich, 1990).<br />
4. Review: In order to analyze each of the evaluations made to present a report with<br />
all the problems and possible resolutions by taking into account the qualitative<br />
analysis obtained (Nielsen & Molich, 1990).<br />
Presentation of the usability problems have been made more meaningful based on rating<br />
scale (Nielsen, 1995). Rating scale is used to rate the severity of usability problems that have<br />
been identified during the evaluation process. The rating scale are based on the number with<br />
specific meaning, namely; 4 (Usability catastrophe: imperative to fix this before product can<br />
be released), 3 (Major usability problem: important to fix, so should be given high priority),<br />
2 (Minor usability problem: fixing this should be given low priority), 1 (Cosmetic problem<br />
only: need not be fixed unless extra time is available on project) and 0 (I don’t agree that this<br />
is a usability problem at all) (Nielsen, 1995).<br />
CALCULATION OF THE USABILITY PROBLEM FOUND IN HE<br />
A comparative evaluation study that investigated the extent to which HE identifies usability<br />
problems in a web-based learning application and compares the results with those of the survey<br />
evaluations among end-users (learners) was conducted (Ssemugabi & Villiers, 2007). Four<br />
evaluators (experts) in different expertise (user interface design, instructional/educational design<br />
and teaching) were invited and they agreed to participate in the evaluation process. There were<br />
a total of 58 problems identified by the experts and the severity rating was used to categorize the<br />
problems found. All the usability problem found were then divided into 2 categories, namely,<br />
major problem for severity scores 4 and 5 and minor for severity scores 1 and 2. Data were<br />
presented based on the numbers of problem founds and the mean of severity rating.<br />
Network Game Heuristic (NGH) was developed by Pinelle et al. (2009), who later<br />
conducted an evaluation process with ten participations who had previous experiences with<br />
250 <strong>Pertanika</strong> J. Sci. & Technol. <strong>21</strong> (1): 283 - 298 (<strong>2013</strong>)
Usability of Educational Computer Game (UsaECG): A Quantitative Approach<br />
usability evaluation and experience with multiplayer networked games (double experts). The<br />
participants evaluated and rated the usability problem using the Nielsen’s severity rating<br />
(Nielsen, 1995). The results are shown in a form of table that summarizes the heuristic, total<br />
problem and mean severity. The evaluation results showed that the new heuristics were effective<br />
at specializing the evaluation process for multiplayer network games. The argument here was<br />
the way the results are being presented in term of severity rating. By having the mean value for<br />
the severity rating, it is debatable that it will not show the real level of the usability problems<br />
in the network game that is being evaluated.<br />
Web evaluation using Heuristic Evaluation and user testing was also conducted (Tan et<br />
al., 2009). For HE, nine expert evaluators were recruited and defined as who had graduated<br />
level coursework in human computer interaction and in human factors of web design. The<br />
evaluators independently examined the interfaces and judged their compliance with a set<br />
of heuristics. After the evaluation process had been completed, all the findings (usability<br />
problems) were compiled and reported. The problems were classified on the basis of severity.<br />
A set of severity criteria was established to rate the severity of the problems. The three different<br />
severity ratings included were severe, medium and mild problems. Severe problems included<br />
catastrophic usability problems, where users were unable to do their work and major problems<br />
where users had difficulty, but were still able to find workarounds. Hence, fixing the problems<br />
is a mandatory. Medium problems included medium usability problems where users stumbled<br />
over the problem, but could quickly adapt to it. Fixing the problems should be given medium<br />
priority. Mild problems included minor usability problems, where users could easily work<br />
around the problem. Fixing the problems should be given low priority. Meanwhile, usability<br />
problem found was presented based on the numbers and the type of severity (namely, severe,<br />
medium and mild).<br />
Quantitative analysis for a heuristic evaluation was adapted from González et al. (2009).<br />
To the best of our knowledge, this is one of the few studies that has attempted to quantitatively<br />
analyze heuristic evaluation data (usability problems). Research conducted by González et al.<br />
(2009) was based on UsabAIPO project that had initiated new experiment to obtain quantitative<br />
result after a heuristic evaluation process. Function of UsabAIPO was introduced and this gave<br />
the estimation of the degree or the level of usability of the website. The number of heuristics<br />
and sub-heuristics involved play an important role in developing the functions and overall<br />
calculation. The results are presented in the form of percentage of the overall usability. Usability<br />
level can be considered as good when its value is higher than 80% and 100%. This also means<br />
that all the sub-heuristics are satisfied or fulfilled (González et al., 2009).<br />
PLAYABILITY HEURISTIC EVALUATION FOR EDUCATIONAL GAMES<br />
(PHEG)<br />
Heuristic Evaluation (HE) is used as a basis in developing specific heuristic technique to<br />
evaluate educational computer games known as Playability Heuristic Evaluation for Educational<br />
Computer Game (PHEG) consisting of five heuristics, namely, interface (IN), educational<br />
element (ED), content (CN), playability (PL) and multimedia (MM) (Hasiah & Azizah, 2011a).<br />
The experts who are involved in the evaluation process came from various backgrounds,<br />
<strong>Pertanika</strong> J. Sci. & Technol. <strong>21</strong> (1): 283 - 298 (<strong>2013</strong>)<br />
251
Hasiah Mohamed@Omar, Azizah Jaafar and Rohana Yusoff<br />
and in this case, interface expert (for IN), educational technologies (for ED), subject matter<br />
experts (for CN), multimedia experts (for MM) and game developers (for PL). The criteria<br />
for usability evaluation of educational computer games (UsaECG) consist of 5 heuristics and<br />
37 sub-heuristics. Table 1 below shows the PHEG.<br />
TABLE 1: Playability Heuristic for Educational Computer Games (PHEG)<br />
(Source: Hasiah & Azizah, 2011a)<br />
Heuristic and Sub heuristics<br />
Interface (IN)<br />
IN1 Visibility of system status.<br />
IN2 Match between system and the real world.<br />
IN3 User control and freedom.<br />
IN4 Consistency and standards.<br />
IN5 Error prevention.<br />
IN6 Recognition rather than recall.<br />
IN7 Flexibility and efficiency of use.<br />
IN8 Aesthetic and minimalist design.<br />
IN9 Help users recognize, diagnose, and recover from errors.<br />
IN10 Help and documentation.<br />
Educational Element (ED)<br />
ED1 Clear learning objectives.<br />
ED2 Suitable for learning process.<br />
ED3 Functions as self directed learning tools.<br />
ED4 Considers the individual learning level differences.<br />
ED5 Provide feedback about the knowledge being constructed.<br />
ED6 Offers the ability to select the level of difficulty in games.<br />
Content (CN)<br />
CN1 Reliable and proven content with correct syllabus flow.<br />
CN2 Clear structure of content.<br />
CN3 Screen navigation is precise.<br />
CN4 Supporting learning materials is relevant.<br />
CN5 Content materials are engaging.<br />
CN6 The content is chunk based on topic and subtopic.<br />
Playability (PL)<br />
PL1 Provide enough information to get started to play.<br />
PL2 Control keys follow standard conventions.<br />
PL3 Users should always be able to identify their score in the game.<br />
PL4 Users able to save games in different states.<br />
PL5 Successful users in completing all the activities in a module are rewarded.<br />
PL6 Challenges provided are positive game experiences.<br />
PL7 The game is enjoyable to replay.<br />
252 <strong>Pertanika</strong> J. Sci. & Technol. <strong>21</strong> (1): 283 - 298 (<strong>2013</strong>)
TABLE 1: (Continued)<br />
Usability of Educational Computer Game (UsaECG): A Quantitative Approach<br />
MM1<br />
Heuristic and Sub heuristics<br />
Multimedia (MM)<br />
Each multimedia element used serves a clear purpose.<br />
MM2 Usage of multimedia elements is suitable with the content.<br />
MM3 Combinations of multimedia elements are adequate.<br />
MM4 The presentation of multimedia elements is well managed.<br />
MM5 Numbers of multimedia elements for each screen is not more than 2<br />
elements.<br />
MM6 The use of multimedia elements support meaningfully the information<br />
provided.<br />
MM7 The quality of multimedia elements used is good.<br />
MM8 The use of multimedia elements enhances the content presentation.<br />
RESEARCH METHODOLOGY<br />
This study was carried out based on the previous set of heuristic and sub-heuristics that were<br />
developed to evaluate UsaECG (Hasiah & Azizah, 2011a) known as Playability Heuristic for<br />
Educational Computer Games (PHEG). PHEG consists of 5 heuristics such as (Interface (IN),<br />
Educational Element (ED), Content (CN), Playability (PL) and Multimedia (MM)). Heuristic<br />
for Interface consists of 10 sub-heuristics, and this is followed by heuristic for Educational<br />
Element (6 sub-heuristics), heuristic for Content (6 sub-heuristic), heuristic for Playability (7<br />
sub-heuristics) and heuristic for Multimedia (8 sub-heuristics). Each heuristic was weighted<br />
according to its sub-heuristics, represented in the form of percentage of the sub-heuristic weight<br />
corresponding to the heuristic, as shown in Table 2.<br />
Table 2 shows the heuristics, the number of sub-heuristics for each heuristic and its<br />
weighting used to calculate the total percentage of the educational computer games usability.<br />
The formula, called UsaECG(x), is as follows:<br />
UsaECG(x) = ((IN/0.2073) + (ED/0.1622) + (CN/0.1622) + (PL/0.1892)<br />
+ (MM/0.<strong>21</strong>62))/5 (1)<br />
where, IN represents the score of Interface heuristic, ED is Educational Element heuristic, CN<br />
is Content heuristic, PL is Playability heuristic and MM is Multimedia heuristic. UsaECG refers<br />
to as the weighted mean and it can refer to an indicator for the overall usability of ECG. Each<br />
of these variables (IN, ED, CN, PL and MM) obtains the corresponding value when applying<br />
the next formula:<br />
F(x) = (∑H / ∑Ht) x P (2)<br />
where, ∑H is the summation of the severity scores for each sub-heuristic group, P is the<br />
percentage for the current group, and ∑Ht represents the summation of the sub-heuristic group<br />
in the worst case (in the event that all severity ratings are 4).<br />
<strong>Pertanika</strong> J. Sci. & Technol. <strong>21</strong> (1): 283 - 298 (<strong>2013</strong>)<br />
253
Hasiah Mohamed@Omar, Azizah Jaafar and Rohana Yusoff<br />
TABLE 2: Percentage assigned for each sub-heuristic in UsaECG<br />
Heuristic Total Sub heuristic<br />
The usability of educational computer games [usaECG(x)] gives an estimation of the degree<br />
or the level of critical usability problem found, namely, the value of the overall critical usability<br />
problem found of the educational computer games. In Table 2, function (1) and function (2)<br />
are derived from González et al. (2009), which we found as one of the promising attempt to<br />
quantitatively analyze the results of a usability evaluation based on the HE method. Function<br />
(2) was then modified in order to simplify the calculation.<br />
EVALUATION PROCESS<br />
Weight each sub<br />
heuristic<br />
Interface (IN) 10 0.2703 27.03<br />
Educational Element (ED) 6 0.1622 16.2<br />
Content (CN) 6 0.1622 16.2<br />
Playability (PL) 7 0.1892 18.92<br />
Multimedia (MM) 8 0.<strong>21</strong>62 <strong>21</strong>.62<br />
Total 37 1 100<br />
There are six steps involved in the evaluation process. First, the experts were identified and<br />
contacted through email. The experts who agreed to join the evaluation process replied and<br />
they were provided with the URL of the evaluation system (AHP_HeGES). Then, the experts<br />
performed the evaluation based on the provided PHEG with the explanation on how to<br />
conduct the process. The experts identified usability problem and rated severity scale. Once<br />
the evaluation was completed, the admin was able to view the usability problems found (data)<br />
and then performed the analysis. Fig.1 below shows the flow of the said evaluation process.<br />
Fig.1: Evaluation flow (Source: Hasiah & Azizah, 2011b)<br />
254 <strong>Pertanika</strong> J. Sci. & Technol. <strong>21</strong> (1): 283 - 298 (<strong>2013</strong>)<br />
Weight each sub<br />
heuristic (%)
Usability of Educational Computer Game (UsaECG): A Quantitative Approach<br />
There were five expert evaluators involved in the process which consisted of a HCI expert,<br />
an educational element expert, a content expert, a playability expert (game developer) and a<br />
multimedia expert. The educational game used for the evaluation process was DatabaseFun<br />
game. Table 3 shows the profile of the experts involved and Table 4 presents the number of<br />
usability problems found by all the experts.<br />
TABLE 3: Profile of Expert Evaluators<br />
Expert<br />
Evaluators<br />
IN MSc<br />
ED MSc<br />
CN MSc<br />
Highest<br />
Qualification<br />
Professional Role Duties/course taught (relevant to this<br />
study)<br />
Senior lecturer in<br />
Science System<br />
Senior lecturer in<br />
Education faculty<br />
Senior lecturer in System<br />
Science<br />
<strong>Pertanika</strong> J. Sci. & Technol. <strong>21</strong> (1): 283 - 298 (<strong>2013</strong>)<br />
Experience in teaching HCI for the past<br />
5 years<br />
Teaches Instructional Design and<br />
Technology<br />
Teaches Database for 3 years<br />
PL Bsc<br />
Game developer Has been involved in developing game<br />
for the past 3 years<br />
MM MSc Senior lecturer in IT Teaches multimedia for 4 years<br />
TABLE 4: Usability Problems and Rating Found by Experts (Source: Hasiah & Azizah, 2011b)<br />
Expert Usability Problems<br />
Severity Rating<br />
4 3 2 1 0<br />
IN 10 2 4 3 1 0<br />
ED 8 3 2 1 1 1<br />
CN 9 1 3 3 2 0<br />
PL 8 3 2 2 0 1<br />
MM 9 3 2 2 2 0<br />
Extracting Result Analysis<br />
Based on the results of usability problem found in Table 3, the calculation for ∑H, P and ∑Ht<br />
was conducted. Table 4 shows the calculation of ∑H, P and ∑Ht based on the usability problem<br />
found for each heuristic. ∑H is the summation of the severity scores for each sub-heuristic<br />
group, P is the percentage for the current group, and ∑Ht represents the summation of the<br />
whole group in the worst case (in the event that all ratings were 4). The usability problem<br />
found for the calculation purposes focused on the criticality of usability problem found, i.e.<br />
where severity score was 4. An example of the calculation on how the value of ∑H for expert<br />
IN is as follows:<br />
∑H = (4*2) + (3*4) + (2*3) + (1*1)<br />
= 8 + 12 + 6 + 1<br />
= 27<br />
255
Hasiah Mohamed@Omar, Azizah Jaafar and Rohana Yusoff<br />
The example of the calculation on how the value of ∑Ht for expert IN is as follows:<br />
∑Ht = 4*2<br />
= 8<br />
The results in Table 4 represent the value for each heuristics; for example, F(IN) = (8/27) *<br />
27.03 is F(IN) = 8.0089. The value of 29.63% represents the critical usability problem found in<br />
the interface for the ECG evaluated. In term of usability level, it was about 70%, which meant<br />
that it still could not be considered good, as mentioned by González et al. (2009), whereby<br />
the usability level could be considered as good when its value higher is than 80% and 100%<br />
or when all the sub-heuristics are fulfilled.<br />
TABLE 5: Calculation for Each Heuristic<br />
Expert<br />
Usability Problems<br />
Found<br />
Example of Calculation<br />
∑H ∑Ht P F(x) F(x)%<br />
IN 10 27 8 27.03 8.0089 29.63<br />
ED 8 <strong>21</strong> 12 16.2 9.2571 57.14<br />
CN 9 <strong>21</strong> 12 16.2 9.2571 57.14<br />
PL 8 22 4 18.92 3.4400 18.18<br />
MM 9 24 12 <strong>21</strong>.62 10.8100 50.00<br />
Evaluation Results<br />
Mean (indicator) 42.42<br />
The function for UsaECG (x) was used to calculate the overall critical usability problem found<br />
in the ECG evaluated.<br />
UsaECG(x) = ((IN/0.2073) + (ED/0.1622) + (CN/0.1622) + (PL/0.1892)<br />
+ (MM/0.<strong>21</strong>62)) / 5<br />
Based on the function, UsaECG(x), the critical problem for each heuristic was calculated<br />
and presented in the form of a bar graph, as shown in Fig.2. Here, UsaECG(x) refers to weighted<br />
mean and it is an indicator for the overall usability of ECG.<br />
UsaECG(x) = ((8.0089/0.2073) + (9.2571/0.1622) + (9.2571/0.1622) + 3.4400/0.1892)<br />
+ (10.8100/0.<strong>21</strong>62)) / 5<br />
UsaECG(x) = (29.63 + 54.14 + 57.14 + 18.18 + 50.00) / 5<br />
UsaECG(x) = 42.42<br />
256 <strong>Pertanika</strong> J. Sci. & Technol. <strong>21</strong> (1): 283 - 298 (<strong>2013</strong>)
Usability of Educational Computer Game (UsaECG): A Quantitative Approach<br />
Fig.2: The Percentage of Critical Usability Problem for ECG<br />
Fig.2 shows the percentage of the critical problem found for each heuristic. The most<br />
critical problem was found in Educational Element and Content heuristics, whereby there was<br />
57.14% critical problems found for each heuristic. The least critical problem found was in<br />
Playability heuristic, whereby the value was 18.18%, indicating that in term of usability level<br />
for Playability, it is considered as good (González et al., 2009) because the value is 81.82%.<br />
Even though the usability level for Playability can be considered as good, there is a need to<br />
look in details for each usability problem found in order to help developers to improve ECG.<br />
The mean value (42.42%) for the overall critical problem found in ECG represents an<br />
indicator for the overall usability level of ECG. Meanwhile, the overall result shown in Fig.3<br />
should be able to help developers to grasp the idea on the part that needs to be improved<br />
accordingly. The Educational Element and Content heuristics need to be given priority in term<br />
of improvement, followed by Multimedia, Interface and Playability.<br />
DISCUSSION<br />
Usability problems found in most of the heuristic evaluation processes presented are based on<br />
severity rating. Several studies have presented severity rating based on the mean of severity<br />
scale, i.e. the value represents the score level of usability problems. In some cases, the mean<br />
value may not be accurate to represent the usability problems found. This is because the mean<br />
value will ignore the most critical problems found in specific part. One of the possible solutions<br />
to overcome this problem is by analyzing the numbers of severity rating for the critical problems<br />
found. The quantitative analysis for HE (González et al., 2009) was adapted as a basis of this<br />
analysis. Some modifications were done in order to simplify the analysis process. The function<br />
for UsaECG(x) and F(x) was used to help in the analysis of the data.<br />
<strong>Pertanika</strong> J. Sci. & Technol. <strong>21</strong> (1): 283 - 298 (<strong>2013</strong>)<br />
257
Hasiah Mohamed@Omar, Azizah Jaafar and Rohana Yusoff<br />
The number of the sub-heuristics for each heuristic was used in order to calculate the<br />
percentage for each heuristic. Based on the percentage presented, further calculation and<br />
function were developed. The values (%) for each critical problem found were extracted from<br />
the developed functions. This value should be able to help developers to simply get the results<br />
of the evaluation for the ECG that is still in the development process. The presentation of the<br />
results in the form of percentage is one of the distinctive results from this process. This will<br />
help game developers to shorten the process of analyzing the usability problem found.<br />
CONCLUSION<br />
Evaluating educational computer games using Playability Heuristic Evaluation for Educational<br />
Computer Games (PHEG) technique shows the ability of the new technique in identifying<br />
usability problems. Meanwhile, the involvement of expert evaluators demonstrates the<br />
numbers of usability problems found and the score of the usability problems. The new<br />
approach in analyzing critical usability problems found was introduced in order to fabricate<br />
more presentable results. The functions to calculate critical problems, based on the number of<br />
sub-heuristics, were created. The presentation of the critical usability problems should be able<br />
to help ECG developers to easily grab the most critical part that needs to be improved. This<br />
particular approach contributes to the body of knowledge in quantitatively analysing usability<br />
problems. The outcome of the analysis can be used to indicate the overall critical usability<br />
problems of educational computer games. Thus, a future study is suggested to be carried out<br />
on the evaluation processes involving expert evaluators (3 to 5) for each heuristic to detect<br />
more usability problems. The analysis process needs to take into consideration the number of<br />
problems found in term of its uniqueness. Based on the uniqueness of the problems, the overall<br />
critical problems can be calculated accurately.<br />
REFERENCES<br />
Allen, Mureen, Currie, Leanne M., Bakken, Suzanne, Patel, Vimla L., & Cimino, J. J. (2006). Heuristic<br />
evaluation of paper-based Web pages: A simplified inspection usability methodology. <strong>Journal</strong> of<br />
Biomedical Informatics, 39(4), 412-423.<br />
González, M., Masip, L., Granollers, A., & Marta, O. (2009). Quantitative analysis in a heuristic<br />
evaluation experiment. Advances in Engineering Software, 40(12), 1271-1278.<br />
Hasiah M.O. and Azizah J. (2010). Challenges in the evaluation of educational computer games. Paper<br />
presented at the International Symposium on Information Technology (ITSim), Kuala Lumpur,<br />
Malaysia.<br />
Hasiah M. O., & Azizah J. (2011a). Methodology to evaluate interface of educational computer game<br />
Paper presented at the Pattern Analysis and Intelligent Robotics (ICPAIR), Kuala Lumpur, Malaysia.<br />
Hasiah M. O., & Azizah J. (2011b). Tools to Evaluate Usability of Educational Computer Game<br />
(UsaECG). Paper presented at the 2nd International Conference on User Science and Engineering<br />
(i-USEr 2011), Kuala Lumpur, Malaysia.<br />
Hvannberg, E. T., Law, E. L. -C., & Lárusdóttir, M. K. (2007). Heuristic evaluation: Comparing ways<br />
of finding and reporting usability problems. Interacting with Computers, 19(2), 225-240.<br />
258 <strong>Pertanika</strong> J. Sci. & Technol. <strong>21</strong> (1): 283 - 298 (<strong>2013</strong>)
Usability of Educational Computer Game (UsaECG): A Quantitative Approach<br />
Kato, P. M. (2010). Video games in health care: Closing the gap. Review of General Psychology, 14(2),<br />
113-1<strong>21</strong>.<br />
Kirmani, S. (2008). Heuristic Evaluation Quality Score (HEQS): Defining Heuristic Expertise. <strong>Journal</strong><br />
of Usability Studies, 4(1), 49-59.<br />
Nielsen, J. (1995). Severity ratings for usability problems Retrieved 15 February, 2012 from http://www.<br />
useit.com/papers/heuristic/severityrating.html.<br />
Nielsen, J., & Molich, R. (1990). Heuristic evaluation of user interfaces. Paper presented at the<br />
Proceedings of the SIGCHI conference on Human factors in computing systems: Empowering people,<br />
Seattle, Washington, United States.<br />
Papastergiou, M. (2009). Digital Game-Based Learning in high school Computer Science education:<br />
Impact on educational effectiveness and student motivation. Computers & Education, 52(1), 1-12.<br />
Pinelle, D., Wong, N., Stach, T., & Gutwin, C. (2009). Usability heuristics for networked multiplayer<br />
games. Paper presented at the Proceedings of the ACM 2009 international conference on Supporting<br />
group work, Sanibel Island, Florida, USA.<br />
Robertson, J., & Howells, C. (2008). Computer game design: Opportunities for successful learning.<br />
Computers & Education, 50(2), 559-578.<br />
Ssemugabi, S., & Villiers, R. D. (2007). A comparative study of two usability evaluation methods using<br />
a web-based e-learning application. Paper presented at the Annual Research Conference of the South<br />
African institute of Computer Scientists and Information Technologists on IT Research in Developing<br />
Countries (SAICSIT), Port Elizabeth, South Africa.<br />
Tan, W. -S, Liu, D., & Bishu, R. (2009). Web evaluation: Heuristic evaluation vs. user testing.<br />
International <strong>Journal</strong> of Industrial Ergonomics, 39(4), 6<strong>21</strong>-627.<br />
Yee L. E., Zah bte Wan Ali, Wan bt. Mahmud, Rosnaini, & Baki Roselan. (2010). Computer games<br />
development experience and appreciative learning approach for creative process enhancement.<br />
Computers & Education, 55(3), 1131-1144.<br />
<strong>Pertanika</strong> J. Sci. & Technol. <strong>21</strong> (1): 283 - 298 (<strong>2013</strong>)<br />
259
ISSN: 0128-7680 © <strong>2013</strong> <strong>Universiti</strong> <strong>Putra</strong> Malaysia Press.<br />
<strong>Pertanika</strong> J. Sci. & Technol. <strong>21</strong> (1): 261 - 272 (<strong>2013</strong>)<br />
SCIENCE & TECHNOLOGY<br />
<strong>Journal</strong> homepage: http://www.pertanika.upm.edu.my/<br />
The Role of Similarity Measurement in an Agent-Based Supplier<br />
Selection Framework<br />
Alireza Jahani*, Masrah Azrifah Azmi Murad, Md. Nasir Sulaiman and<br />
Hasan Selamat<br />
Faculty of Computer Science and Information Technology, <strong>Universiti</strong> <strong>Putra</strong> Malaysia, 43400 Serdang,<br />
Selangor, Malaysia<br />
ABSTRACT<br />
Similarity measurement is a critical component in any case-based reasoning (CBR) system. CBR is<br />
a superior technique for solving new problems based on previous experiences. Main assumption in<br />
CBR relies on the hypothesis that states similar problems should have similar solutions. This paper<br />
describes a comparative analysis on several commonly used similarity measures (Canberra, Clark, and<br />
Normalized Euclidean distance) in retrieving phase of the case-based reasoning approach to facilitate<br />
supplier selection. In addition, the proposed agent-based supplier selection framework was designed to<br />
use customer’s defined weights to evaluate the price, volume, quality grade, and delivery date of supply<br />
materials, and also provide them with alternative products which are closest to their first order if it was<br />
out of stock. Finally, based on the proposed framework, a numerical example of the used approach is<br />
illustrated.<br />
Keywords: Supplier selection, intelligent agent, customer knowledge management, case based reasoning,<br />
similarity measures<br />
INTRODUCTION<br />
In general, knowledge management has been of interest to companies because they realize that<br />
it can contribute to their competitive advantage. Therefore, in emphasizing on knowledge as<br />
a key competitive factor in the global economy, these companies may be overlooking a major<br />
Article history:<br />
Received: 31 March 2012<br />
Accepted: 1 September 2012<br />
E-mail addresses:<br />
jahani@fsktm.upm.edu.my (Alireza Jahani),<br />
masrah@fsktm.upm.edu.my (Masrah Azrifah Azmi Murad),<br />
nasir@fsktm.upm.edu.my (Md. Nasir Sulaiman),<br />
hasan@fsktm.upm.edu.my (Hasan Selamat)<br />
*Corresponding Author<br />
element, i.e. customer knowledge. This means<br />
the knowledge that a customer has about<br />
the issues that are related to the products or<br />
services that he is interested in buying. Since<br />
the firm has a better understanding of the<br />
customer’s expectations and needs, it will be<br />
able to improve customer service and thus
Alireza Jahani, Masrah Azrifah Azmi Murad, Md. Nasir Sulaiman and Hasan Selamat<br />
achieve customers’ satisfaction and retention. Better relationships with the customer can lead<br />
to increased sales and then new customers (García-Murillo & Annabi, 2002).<br />
A supply chain is a network of organizations and their associated activities like procurement,<br />
manufacturing and distribution that work together to produce value for customers (Wang et al.,<br />
2008). Competitive advantage in tomorrow’s environment will go to those enterprises that can<br />
consistently anticipate and implement customer-winning supply chain competencies (Ross,<br />
2003). On the other hand, selecting the suitable suppliers has influence on the short- and longterm<br />
profits or losses of companies which spend a significant amount of their time and money<br />
on purchasing parts. Various selection criteria, weighting methods, and intelligent models<br />
have been used to support the supplier selection of organizations (Chang-Joo & Chung-Hsing,<br />
2011). However, the failure of coordination between manufacturers and suppliers results in<br />
excessive delays and ultimately leads to poor customer services (Lee et al., 2001). Then, there<br />
is a need for an automated and integrated system framework. This paper aims to present such a<br />
framework for cooperation and information exchange that can receive orders and preferences<br />
from customers, generate production plans and material requirement specifications, check<br />
the inventory, make a build or buy decision, call suppliers for proposals, as well as receive<br />
and evaluate material offers, select the best suppliers, negotiate with them, and satisfy the<br />
requirements of the negotiating parties. These can be useful for all the stakeholders, especially<br />
customers who are more crucial for any company’s survival.<br />
RELATED WORK<br />
The benefits of adopting agent technology in SCM (Supply Chain Management) systems have<br />
been recognized in an increasingly wide variety of applications. The agent technology facilitates<br />
the integration of the entire supply chain as a networked system of independent echelons<br />
(Gjerdrum et al., 2001). Agents are also capable of solving the problem of matching supply<br />
to demand and carrying out information exchange, uncertainty resolution, and preferences<br />
revision (Blecker & Graf, 2003). Due to the large amount of data collected and it is hard to<br />
remember every customer’s preferences, agents can play a key role to collect and analyze<br />
this information, and then customers could be recognized later and presented by a series of<br />
alternatives that suit their preferences (García-Murillo & Annabi, 2002).<br />
A number of researchers have attempted to apply agent technology to manufacturing<br />
integration, supply sourcing, supply chain management, negotiation, information transfer<br />
and knowledge sharing within a supply chain. Among other, Saad et al. (1995) proposed a<br />
Production Reservation approach by using a bidding mechanism based on the Contract Net<br />
protocol to generate production plan and schedule. Meanwhile, Barbuceanu and Fox (1997)<br />
proposed organizing supply chain as a network of cooperating agents, each performing one<br />
or more supply chain functions and coordinating their actions with other agents (Barbuceanu<br />
and Fox, 1997). Maturana et al. (1999) developed a hybrid agent-based mediator-centric<br />
Framework, called MetaMorph, to integrate partners, suppliers and customers dynamically with<br />
the main enterprise via the Internet and Intranets (Maturana et al., 1999). Min and Bjornsson<br />
(2000) presented a conceptual model of agent-based supply chain automation, in which a<br />
project agent gathers actual construction progress information and sends them to subcontractor<br />
262 <strong>Pertanika</strong> J. Sci. & Technol. <strong>21</strong> (1): 283 - 298 (<strong>2013</strong>)
The Role of Similarity Measurement in an Agent-Based Supplier Selection Framework<br />
agents and supplier agents, respectively, over the Internet (Min and Bjornsson, 2000). Jiao<br />
et al. applied multi-agent paradigm to collaborative multi-contract negotiation in a global<br />
manufacturing supply chain (Jiao et al., 2006). Wentao designed an agent-based negotiation<br />
model for the sourcing of construction supplies based on a new parallel bargaining protocol<br />
and Bayesian learning model (Wentao, 2008).<br />
Typically, supplier selection is a multi-criteria decision problem (Weber et al., 1991;<br />
Ghodsypour & O’Brien, 1998). The suggested methods in the related literature can be classified<br />
into two categories, namely, mathematical programming models and weighting models. The<br />
mathematical programming model has a problem in dealing with qualitative criteria that are<br />
very important in decision making (Ghodsypour & O’Brien, 1998). Chang and Chung (2011)<br />
developed a multi-criteria decision making (MCDM) model for a manufacturing company to<br />
select suppliers based on customer order dependent weighting method to determine the weights<br />
of the supplier selection criteria. This was achieved by modelling the relationship between<br />
the customer order factors and supplier selection criteria, using a knowledge base with if-then<br />
rules (Chang-Joo & Chung-Hsing, 2011).<br />
However, most of the above works have not applied the case based on reasoning method<br />
with customers’ defined weights in the supplier selection and find alternative supplies due to<br />
the stock out. Failure to account for that may either lead to unsatisfied customer demand and<br />
loss of market share. Therefore, in order to keep customers and the multi-criteria decision<br />
making nature of supplier selection, first, this paper aims to present an agent-based supply<br />
chain framework in support of selecting the best suppliers by means of the proposed casebased<br />
reasoning approach. CBR is in the subset of weighting models. This framework is going<br />
to evaluate material offers, negotiate with suppliers and customers on the price and terms of<br />
quotation in the negotiation process and make successful agreements with the final supplier.<br />
In addition, this framework also wants to take into consideration customers’ knowledge and<br />
provide them with alternative supplies, which are closest to their first order, if the manufacturer<br />
is unable to supply it. Then, the performance of the supplier’s selection process will be improved<br />
to reach a real “win-win” situation and the mentioned problems like unsatisfied customers and<br />
then losing them can be reduced.<br />
AN AGENT-BASED SUPPLY SELECTION FRAMEWORK<br />
The proposed agent-based supply chain framework can generate a flexible, reconfigurable<br />
and coordinated approach for supplier selection process, both across enterprises and within<br />
an enterprise. In this framework, there is a FIPA-compliant (The Foundation for Intelligent<br />
Physical Agents) multi-agent system composed of a seller agent, a design agent, a procurement<br />
agent, a buyer agent, and a case-base for keeping suppliers records. Each agent performs one<br />
or more supply chain functions independently and coordinates its actions with other agents.<br />
This framework is illustrated in Fig.1 and the major components of the proposed framework<br />
are described below. Besides in this section, the order management and the supplier selection<br />
mechanism, along with Case-Based Reasoning (CBR) approach, will be defined later.<br />
Seller agent provides an intelligent interface for the customers to place their personal orders.<br />
It is responsible for acquiring orders and preferences’ weights from customers, handling order<br />
<strong>Pertanika</strong> J. Sci. & Technol. <strong>21</strong> (1): 283 - 298 (<strong>2013</strong>)<br />
263
Alireza Jahani, Masrah Azrifah Azmi Murad, Md. Nasir Sulaiman and Hasan Selamat<br />
modification or cancellation. Design agent is responsible to gather all the incoming orders from<br />
the seller agent and eliciting relevant information regarding customer’s preferences. Another<br />
task of this agent is product planning and placing Material Requirement Specification (MRS)<br />
into case structures and also sending them to Procurement agent and receives offers from it.<br />
The Procurement agent decomposes MRS into specific categories to generate and advertise<br />
Call For Proposals (CFP) through the Buyer agent as an intelligent interface to all the potential<br />
suppliers. Buyer agent is responsible for the general negotiation process that is divided into<br />
three consecutive phases: inviting, bidding and awarding. Whenever an order comes to a<br />
buyer agent, it invites potential suppliers to bid by sending a CFP to seller agents of suppliers.<br />
Then, it will collect and evaluate all the bids based on Suppliers’ Case-Base and choose the<br />
one with maximal utility as a winner, and thus the winner supplier is awarded the contract. A<br />
few rounds of conversation may take place, where several proposals and counter-proposals<br />
are exchanged. The negotiation will end when one party accepts or rejects the other party’s<br />
proposal, or when any party terminates the negotiation process on its own (Jiao et al., 2006).<br />
Suppliers’ Case-Base keeps supplier information files as cases and gathers information on the<br />
past and new suppliers in order to identify alternative suppliers. This information includes<br />
the name of each supplier, a list of the available materials and their attributes, the supplier’s<br />
delivery history, the supplier’s quality records, the supplier’s overall desirability, and general<br />
information about the supplier’s plant and management.<br />
Fig.1: Multi-agent based supply chain framework<br />
264 <strong>Pertanika</strong> J. Sci. & Technol. <strong>21</strong> (1): 283 - 298 (<strong>2013</strong>)
The Role of Similarity Measurement in an Agent-Based Supplier Selection Framework<br />
Order Management and the Supplier Selection Mechanism<br />
Here, the major activities of the proposed framework are briefly described for a better<br />
understanding:<br />
1. The customer places an order through the seller agent to the design agent.<br />
2. The design agent will formulate the MRS and make a case structure of CBR approach<br />
for the ordered product and then send it to the procurement agent.<br />
3. The Procurement agent checks the inventory regarding stocked finished products and<br />
raw materials based on the MRS structure. If the stock has enough resources, then<br />
there is no need for supplying.<br />
4. Otherwise, the procurement agent must manage supplying sufficient raw materials<br />
from the suppliers.<br />
5. The procurement agent advertises its outgoing orders with CFPs through the buyer<br />
agent for all the potential suppliers.<br />
6. After receiving the CFPs, the potential suppliers make the decision of bidding and<br />
then bid on the case base of buyer agent.<br />
7. After receiving all the bids, the buyer agent will evaluate the suppliers in consideration<br />
of price, due date, quality grade, volume, and so on, and then choose the most suitable<br />
suppliers.<br />
8. If some or all supply materials of the customer’s first order are found during the<br />
supplying process, the procurement agent will try to generate alternative product<br />
recommendations based on the received bids and offer them to the customers.<br />
9. If the customer accepts the new offer, the buyer agent will then choose the suppliers<br />
who bid the alternative product’s materials.<br />
10. The buyer agent proclaims the award of bid and gives necessary replies to the unchosen<br />
suppliers.<br />
11. The supplier who has won the bid carries out manufacturing to fulfil the incoming<br />
orders.<br />
12. The supplier delivers its finished products to the manufacturer.<br />
Case-Based Reasoning (CBR) Approach<br />
One of the most important contributions of this paper is that it shows how buyer agents can<br />
check orders with received bids from its associated case-based and responds to requests from<br />
the procurement agent. After receiving all the bids and storing them in the case base, the buyer<br />
agent retrieves from the case base cases that are identical or at least most similar due to the<br />
features of the new order’s case. According to Maturana et al. (1999), the process of CBR<br />
strategy includes four steps (retrieve, reuse, revise and retain), which constitute the CBR cycle<br />
but the revised and retrained steps are not inculded in the scope of this paper. However, before<br />
the cycle can be run, another step, case description, should also be performed for both case<br />
base construction and application of case knowledge. Here are the explanations for each step<br />
that starts with Case Description:<br />
1) Case Description: The CBR mechanism starts with the description of a new order<br />
which corresponds to a new case. Case description concerns with deciding what contents<br />
<strong>Pertanika</strong> J. Sci. & Technol. <strong>21</strong> (1): 283 - 298 (<strong>2013</strong>)<br />
265
Alireza Jahani, Masrah Azrifah Azmi Murad, Md. Nasir Sulaiman and Hasan Selamat<br />
are to be stored in a case. It is important for the new case to be adequately described so that<br />
the retrieval of appropriate previous or newcomer’s cases from the case base is possible. By<br />
considering order constraints which contain MRSs for ordered products, this research adopts<br />
the case structure as shown in Table 1 to describe each case. Product ID numbers, a certain<br />
product for its own and required materials; Product name indicates the name of the product;<br />
Price indicates the offered price to customers or suggested by customers in an incoming order;<br />
<strong>Vol</strong>ume shows the requested quantity of ordered products from customers or bidding quantity<br />
from suppliers; Quality Grade specifies the requested quality for each material; Delivery<br />
Time is the requested time by customer for each order. For suppliers, it indicates the possible<br />
delivery time for their bids.<br />
TABLE 1: Case structure and content<br />
Case Attribute Attribute Value<br />
Product ID Integer, from 01 to n<br />
Product name text<br />
Price Integer, from 1 to n<br />
<strong>Vol</strong>ume Integer, from 1 to n<br />
Quality Grade Integer, from 1 to 5<br />
Delivery Time Integer, number of days<br />
2) Case Retrieval: Case retrieval is finding the most similar case from the case base<br />
according to the features of a new case. A CBR method seriously depends on this step to find<br />
the order’s matches of incoming bids from suppliers. There are numerous similarity measures<br />
in use today. While different similarity measure employs different algorithms, they have<br />
basically the same in functionality, and these are to take two objects as input and output as a<br />
measure of their similarity. The existence of many similarity measures does not always give a<br />
clear choice of an appropriate measure for a particular application domain. Hence, it is often<br />
convenient to be able to experiment with different measures before a final version is decided<br />
upon (Long et al., 2004).<br />
In this paper, three similarity measures (namely, Canberra, Clark, and Normalized<br />
Euclidean distance) were used as similarity functions in the nearest neighbour algorithm, one of<br />
the widely used methods to identify the similarity between cases employed here to perform the<br />
retrieval task. For the nearest neighbour algorithm, the similarity of two cases was calculated<br />
according to (1), as follows:<br />
similarity(<br />
O,<br />
S)<br />
n<br />
∑<br />
w × sim(<br />
O , S )<br />
i<br />
= i=<br />
1<br />
n<br />
∑<br />
i=<br />
1<br />
266 <strong>Pertanika</strong> J. Sci. & Technol. <strong>21</strong> (1): 283 - 298 (<strong>2013</strong>)<br />
w<br />
i<br />
i<br />
i<br />
(1)
The Role of Similarity Measurement in an Agent-Based Supplier Selection Framework<br />
In (1), O is the new order, S is the incoming bid from the suppliers, Oi and Si are the<br />
features i of O and S, respectively, wi is the weight of feature i, and ( , i ) S sim Oi<br />
is the<br />
similarity function of the feature i. The value of ( , i ) S sim Oi<br />
is calculated in three different<br />
ways; the normalized absolute difference of the individual level is called Canberra in the<br />
equation (3), the squared root of half of the divergence is called Clark in the equation (3), and<br />
Normalized Euclidean distance in the equation (4):<br />
Canberra:<br />
sim<br />
Clark:<br />
sim<br />
( O , S )<br />
i<br />
i<br />
O<br />
= 1−<br />
O<br />
O<br />
ik<br />
ik<br />
− S<br />
+ S<br />
ik<br />
ik<br />
ik<br />
ik<br />
( Oi<br />
, Si<br />
) = 1−<br />
2<br />
O<br />
ik<br />
− S<br />
+ S<br />
Normalized Euclidean:<br />
sim<br />
( O , S )<br />
i<br />
i<br />
= 1−<br />
m<br />
∑<br />
k = 1<br />
ik<br />
2<br />
( O − S )<br />
ik<br />
σ<br />
2<br />
ik<br />
2<br />
The weights of the features, which have been obtained from the customers, are applied<br />
to select the closest suppliers’ bid to the customer’s order. The role of the supplier selection<br />
mechanism is to calculate the similarity of each feature of the bids during the supplier selection<br />
and also to rank the alternative suppliers.<br />
3) Case Reuse: Once the same case or the most similar case to the incoming order is<br />
selected from the received bids, it will then be offered to the customer. For the same cases, the<br />
suggested case can be reused by direct copy. However, for most situations that have different<br />
values in their attributes, the seller agent can offer the retrieved case as an alternative to the<br />
customer who can either accept or reject it.<br />
CASE STUDY<br />
In order to illustrate the proposed method of this paper, the case study of Moxober, a leading<br />
mobile phone manufacturing company in Finland (which has also been used by Jiao et al.,<br />
2006) was also used for the current work. Fig.2 shows Moxober’s product structure at three<br />
levels: component arts, subassemblies and the final product. Nearly all the components parts<br />
<strong>Pertanika</strong> J. Sci. & Technol. <strong>21</strong> (1): 283 - 298 (<strong>2013</strong>)<br />
(2)<br />
(3)<br />
(4)<br />
267
Alireza Jahani, Masrah Azrifah Azmi Murad, Md. Nasir Sulaiman and Hasan Selamat<br />
were produced by Moxober, but with the development of global economy and booming<br />
telecommunication market, it has changed to a global manufacturing strategy focusing on<br />
key technologies and its core competency while outsourcing major component manufacturing<br />
activities, such as the manufacturing of peripherals like batteries and chargers, memory chips<br />
and LCD panels.<br />
In Moxober’s supply chain network, customers and suppliers are spread worldwide. The<br />
mobile phone company plays the role of the manufacturer. Its direct suppliers, which are labelled<br />
as Supplier I, provide resources like software, PCB (Printed Circuit Board), LCD (Liquid<br />
Crystal Display), cover and peripheral. Its suppliers’ suppliers (which are labelled as Supplier<br />
II) provided sub-resources like chip, board, interface, charger, and battery to the corresponding<br />
Supplier I. The next issue is to determine a specific configuration of the global manufacturing<br />
supply chain network for each individual customer order of a particular product model.<br />
In this paper, the operation of this specific supply chain network is analysed by means of<br />
an agent-based supply chain framework and giving a numerical example for using CBR in the<br />
supplier selection process. In fact, actual employment of a supplier should be consistent with<br />
the product fulfilment process of a specific customer’s order to achieve customers’ satisfaction.<br />
Now, suppose a customer’s order is from Wenzhou China. This customer places his order<br />
through the seller agent of the mobile phone company. Through interaction, the customer can<br />
configure various ordering parameters such as product features like quality grade, quantity,<br />
price, and delivery date. The order information then goes to the design agent for product<br />
planning and determining a set of MRSs for each order along with the defined constraints.<br />
Then, the MRSs will be organized into three case structures for LCD, Cover and Peripheral,<br />
and then forwarded to the procurement Agent.<br />
In order to accelerate the delivery, the procurement agent decides to allocate the final<br />
assembly of this order to the Xiamen plant in China - a process which involves the requirement<br />
specification of three material types, namely, LCD, Charger and Battery. The software design<br />
and PCB assembly operations are still held in Finland. The buyer agent will broadcast the<br />
material requirements to the potential suppliers who will bid on the platform of this agent to<br />
win the supplier selection procedure.<br />
Fig.2: The BOM structures of Moxober mobile phones (Jiao et al., 2006)<br />
268 <strong>Pertanika</strong> J. Sci. & Technol. <strong>21</strong> (1): 283 - 298 (<strong>2013</strong>)
The Role of Similarity Measurement in an Agent-Based Supplier Selection Framework<br />
Since that customer defines the range for his order, the best values which are the highest<br />
for attributes like volume and quality and the lowest for attributes like price and delivery date<br />
were used to find more suitable alternative products. For example, the best values of the price,<br />
volume, quality, and delivery date for MRS1 are:<br />
Order high =<br />
( 01;013; Charger;20;&800;5;20)<br />
Table 2 shows the case structure of an incoming order (ID=#13) related to MRSs, in<br />
addition to the defined weight by the customer for each attribute.<br />
TABLE 2: Case structure values<br />
Case Attribute MRS1 MRS2 MRS3 W<br />
Product ID O1;013 02;013 03;013 -<br />
Product name Charger Battery LCD -<br />
Price 20-30 50-80 100-120 2<br />
<strong>Vol</strong>ume 600-800 1200-1600 1000 4<br />
Quality Grade 3-5 2-4 4-5 5<br />
Delivery Date 20 15 12 4<br />
Table 3 shows all the incoming bids received from the suppliers and the offered values<br />
for each attribute, including price, volume, quality, and delivery date.<br />
TABLE 3: Incoming Bids<br />
MRS Bid <strong>Vol</strong>ume Price Due Date Quality Grade<br />
MRS 1 Charger Bid11:Supplier01 800 20 20 5<br />
Bid12:Supplier02 1000 25 18 4<br />
Bid13:Supplier03 800 20 18 3<br />
MRS 2 Battery Bid<strong>21</strong>:Supplier04 1000 65 22 4<br />
Bid22:Supplier05 1400 70 10 4<br />
Bid23:Supplier06 2000 45 18 3<br />
MRS 3 LCD Bid31:Supplier07 1000 120 11 5<br />
Bid32:Supplier08 1200 100 10 4<br />
Bid33:Supplier09 900 90 15 3<br />
<strong>Pertanika</strong> J. Sci. & Technol. <strong>21</strong> (1): 283 - 298 (<strong>2013</strong>)<br />
269
Alireza Jahani, Masrah Azrifah Azmi Murad, Md. Nasir Sulaiman and Hasan Selamat<br />
Now, for the nearest neighbour algorithm, which is used to find the most similar bid, and<br />
the similarity of highest values of orders with each bid are calculated as follows. For example,<br />
the similarity of order 1 and supplier 1’s bid for MRS1 are:<br />
Table 4 shows all the results of similarity function calculations for the highest values of<br />
the received orders and suppliers’ bids for each MRS. The weight of each attribute is assumed<br />
to be both equal to 1 and with various weights from 1 to 5 for each attribute.<br />
TABLE 4: The overall similarity function results<br />
MRS Bids<br />
MRS 1<br />
Charger<br />
MRS 2<br />
Battery<br />
MRS 3<br />
LCD<br />
Utility<br />
(Jiao et al.,<br />
2006)<br />
W=1 W=1-5<br />
Canberra Clark Euclidean Canberra Clark Euclidean<br />
Bid01 0.68 0.922 0.986 -1 0.943 0.991 0.434<br />
Bid02 0.73 0.936 0.993 -1.499 0.936 0.993 0.037<br />
Bid03 0.75 0.846 0.970 -1.828 0.846 0.969 -0.414<br />
Bid04 0.65 0.868 0.974 -1.499 0.872 0.974 0.058<br />
Bid05 0.72 0.916 0.987 -1.499 0.919 0.987 0.058<br />
Bid06 0.69 0.843 0.969 -1.828 0.843 0.976 -0.414<br />
Bid07 0.77 0.989 0.999 -0.414 0.988 0.999 0.623<br />
Bid08 0.71 0.903 0.990 -1.828 0.902 0.989 -0.414<br />
Bid09 0.69 0.873 0.975 -1.828 0.870 0.971 -0.414<br />
The results show that the weighted attributes do not play an important role in the awarding<br />
process of three similarity measures and the satisfaction of the MRS constraints. For instance,<br />
if w=1, the bid of supplier 2 with the highest similarity for MRS1 would be selected in both<br />
the Canberra and Clark measures and supplier 1 is selected in Normalized Euclidean distance<br />
measure. The only exception in the awarding process is for Canberra similarity measure when<br />
different weights are applied. Table 5 lists the winners of the awarding process in comparison<br />
to (Jiao et al., 2006) the utility values for each MRS. In Jiao et al. (2006) for MRS, S1 was<br />
selected; however in this paper, S2 is selected due to the proposed mechanism and considering<br />
the different weights for different attributes.<br />
270 <strong>Pertanika</strong> J. Sci. & Technol. <strong>21</strong> (1): 283 - 298 (<strong>2013</strong>)
TABLE 5: Winners<br />
MRS<br />
The Role of Similarity Measurement in an Agent-Based Supplier Selection Framework<br />
Utility<br />
(Jiao et<br />
al., 2006)<br />
W=1 W=1-5<br />
Canberra Clark Euclidean Canberra Clark Euclidean<br />
MRS 1 Charger S3 S2 S2 S1 S1 S2 S1<br />
MRS 2 Battery S5 S5 S5 S4, S5 S5 S5 S4, S5<br />
MRS 3 LCD S7 S7 S7 S7 S7 S7 S7<br />
CONCLUSION<br />
This paper presents an agent-based Supply Chain framework for supplier selection by<br />
considering the influence of different similarity measures in case-based reasoning process. The<br />
process involved selecting the best suppliers using the CBR method to match incoming orders<br />
with those of the received bids from the suppliers. In the proposed framework, customer orders<br />
have various weights in the CBR approach. Sometimes, the manufacturer is unable to supply<br />
and to provide their customers’ first order. Therefore, the main contribution of this research<br />
is to take the customers’ preferences into consideration and to provide them with alternatives<br />
which are most similar to their first order from various suppliers. The second contribution is to<br />
use the CBR approach in finding the most similar alternatives by using three different similarity<br />
measures, namely, Canberra, Clark, and Normalized Euclidean distance. During the ordering<br />
process, customers can define the features’ importance of their orders by weight. Hence, in the<br />
case retrieval level, these weights can help to find the most similar bids and offer alternative<br />
products to the customers based on their desires. The results of the numerical example show<br />
that the proposed approach is robust enough to find the closest bid to the received order and<br />
rewards the winner supplier. The improvement and development of the prototype of the<br />
proposed framework should be submitted to further studies.<br />
REFERENCES<br />
Barbuceanu, M., & Fox, M. S. (1997). Integrating communicative action, conversations and decision<br />
theory to coordinate agents. Paper presented in AAMAS-97, 1997 Marina del Rey (pp. 49 - 58).<br />
California, United States. 267667: ACM.<br />
Blecker, T., & Graf, G. (2003). Multi agent systems in internet based production environments—an<br />
enabling infrastructure for mass customization. In F.T. Piller, R. Reichwald, & M. Tseng (Eds). MCPC<br />
2003, 2003. Munich.<br />
Chang-Joo, Y., & Chung-Hsing, Y. (2011). Customer order dependent supplier selection. Paper presented<br />
in ICNIT (pp. 57-62), <strong>21</strong>-23 June 2011.<br />
Garcia-Murillo, M., & Annabi, H. (2002). Customer Knowledge Management. The <strong>Journal</strong> of the<br />
Operational Research Society, 53, 875-884.<br />
Ghodsypour, S. H., & O’Brien, C. (1998). A decision support system for supplier selection using an<br />
integrated analytic hierarchy process and linear programming. International <strong>Journal</strong> of Production<br />
Economics, 56-57, 199-<strong>21</strong>2.<br />
Gjerdrum, J., Shah, N., & Papageorgiou, L. G. (2001). A combined optimization and agent-based<br />
<strong>Pertanika</strong> J. Sci. & Technol. <strong>21</strong> (1): 283 - 298 (<strong>2013</strong>)<br />
271
Alireza Jahani, Masrah Azrifah Azmi Murad, Md. Nasir Sulaiman and Hasan Selamat<br />
approach to supply chain modelling and performance assessment. Production Planning & Control:<br />
The Management of Operations, 12, 81 - 88.<br />
Jiao, J., You, X., & Kumar, A. (2006). An agent-based framework for collaborative negotiation in the<br />
global manufacturing supply chain network. Robotics and Computer-Integrated Manufacturing, 22,<br />
239-255.<br />
Lee, E. -K., Ha, S., & Kim, S. -K. (2001). Supplier selection and management system considering<br />
relationships in supply chain management. Engineering Management, IEEE Transactions, 48, 307-318.<br />
Long, J., Stoecklin, S., Schwartz, D. G., & Patel, M. (2004). Adaptive similarity metrics in case-based<br />
reasoning. Paper presented in the 6th IASTED International Conference on Intelligent Systems and<br />
Control, 260-265.<br />
Maturana, F., Shen, W., & Norrie, D. H. (1999). MetaMorph: an adaptive agent-based architecture for<br />
intelligent manufacturing. International <strong>Journal</strong> of Production Research, 37, <strong>21</strong>59 - <strong>21</strong>73.<br />
MIN, J. U., & Bjornsson, H. (2000). Agent based supply chain management automation. Paper presented<br />
in ICCCBE-VIII (pp. 1001-1006). Stanford University, California, USA.<br />
Ross, D. F. (2003). Introduction to e-supply chain management: engaging technology to build marketwinning<br />
business partnerships. St. Lucie Press.<br />
Saad, A., Kawamura, K., & Biswas, G. (1995). Performance evaluation of contract net-based<br />
heterarchical scheduling for flexible manufacturing systems. Paper presented in IJCAI-95 (pp. 310-<br />
3<strong>21</strong>). Montreal, Canada.<br />
Wand, M., Liu, J., Wang, H., Cheung, W. K., & Xie, X. (2008). On-demand e-supply chain integration:<br />
A multi-agent constraint-based approach. Expert Systems with Applications, 34, 2683-2692.<br />
Weber, C. A., Current, J. R., & Benton, W. C. (1991). Vendor selection criteria and methods. European<br />
<strong>Journal</strong> of Operational Research, 50, 2-18.<br />
Wentao, L. (2008). An Agent-Based Negotiation Model for the Sourcing Of the Condtruction Suppliers<br />
(Doctoral thesis dissertation). The University of Hong Kong.<br />
272 <strong>Pertanika</strong> J. Sci. & Technol. <strong>21</strong> (1): 283 - 298 (<strong>2013</strong>)
REFEREES FOR THE PERTANIKA<br />
JOURNAL OF SCIENCE AND TECHNOLOGY<br />
VOL. <strong>21</strong>(1) JAN. <strong>2013</strong><br />
The Editorial Board of the <strong>Journal</strong> of Tropical Agricultural Science wishes to thank the following<br />
for acting as referees for manuscripts published in this issue of <strong>JST</strong>.<br />
Abdul Aziz Abdul<br />
Rahman<br />
(UM, Malaysia)<br />
Abdul Razak Daud<br />
(UKM, Malaysia)<br />
Adem Kilicman<br />
(UPM, Malaysia)<br />
Aida Mustapha<br />
(UPM, Malaysia)<br />
Alfian Abdul Halin<br />
(UPM, Malaysia)<br />
Anuar Kassim<br />
(UPM, Malaysia)<br />
Azlina Harun@<br />
Kamaruddin<br />
(USM, Malaysia)<br />
Barkawi Sahari<br />
(UPM, Malaysia)<br />
Chukwu Ogbonnaya<br />
(Federal University of<br />
Technology, Nigeria)<br />
Evi Indriasari Mansor<br />
(UPM, Malaysia)<br />
Fatimah Khalid<br />
(UPM, Malaysia)<br />
Hailiza Kamarulhaili<br />
(USM, Malaysia)<br />
UPM- <strong>Universiti</strong> <strong>Putra</strong> Malaysia<br />
UKM- <strong>Universiti</strong> Kebangsaan Malaysia<br />
USM- <strong>Universiti</strong> Sains Malaysia<br />
UM- <strong>Universiti</strong> Malaya<br />
Special Acknowledgement<br />
Hakim S. Sultan Aljibori<br />
(UM, Malaysia)<br />
Hazizan Md Akil<br />
(USM, Malaysia)<br />
Hazura Zulzalil<br />
(UPM, Malaysia)<br />
Ibrahim Abu Talib<br />
(UKM, Malaysia)<br />
Kamaruzzaman Yunus<br />
(IIUM, Malaysia)<br />
Lili Nurliyana Abdullah<br />
(UPM, Malaysia)<br />
Lilly Suriani Affendey<br />
(UPM, Malaysia)<br />
Lim Kean Pah<br />
(UPM, Malaysia)<br />
M. Abdul Maleque<br />
(MMU, Malaysia)<br />
Maisarah Ali<br />
(IIUM, Malaysia)<br />
Mar Yah Said<br />
(UPM, Malaysia)<br />
Mas Rina Mustaffa<br />
(UPM, Malaysia)<br />
Masrah Azrifah Azmi<br />
Murad<br />
(UPM, Malaysia)<br />
IIUM- International Islamic University of Malaysia<br />
UPNM- <strong>Universiti</strong> Pertahanan Nasional Malaysia<br />
UNITEN- <strong>Universiti</strong> Tenaga Nasional<br />
MMU- Multimedia University<br />
Mohamad Rushdan Md<br />
Said<br />
(UPM, Malaysia)<br />
Mohamed Abd Rahman<br />
(UPM, Malaysia)<br />
Mohamed Ansari M.<br />
Nainar<br />
(UNITEN, Malaysia)<br />
Mohd Sapuan Salit<br />
(UPM, Malaysia)<br />
Muhammad Sayuti<br />
Fadhil<br />
(Universitas Malikussaleh,<br />
Indonesia)<br />
Noraini Che Pa<br />
(UPM, Malaysia)<br />
Norhayati Mohd Ali<br />
(UPM, Malaysia)<br />
Novia Admodisastro<br />
(UPM, Malaysia)<br />
Oon Shea Ming<br />
(UM, Malaysia)<br />
Pathiah Abdul Samat<br />
(UPM, Malaysia)<br />
Puteri Suhaiza Sulaiman<br />
(UPM, Malaysia)<br />
Risby Mohd Sohaimi<br />
(UPNM, Malaysia)<br />
Rodziah Atan<br />
(UPM, Malaysia)<br />
Sa’adah Hassan<br />
(UPM, Malaysia)<br />
Sahari Japar<br />
(UPM, Malaysia)<br />
Salmi Baharom<br />
(UPM, Malaysia)<br />
Shamala Subramaniam<br />
(UPM, Malaysia)<br />
Sharifah Md Yasin<br />
(UPM, Malaysia)<br />
Takaomi Arai<br />
(UPM, Malaysia)<br />
Tey Beng Ti<br />
(UPM, Malaysia)<br />
Wan Ramli Wan Daud<br />
(UKM, Malaysia)<br />
Zulkarnain Zainal<br />
(UPM, Malaysia)<br />
The <strong>JST</strong> Editorial Board gratefully acknowledges the assistance of Doreen Dillah, who served as<br />
the English language editor for this issue.<br />
While every effort has been made to include a complete list of referees for the period stated above, however if<br />
any name(s) have been omitted unintentionally or spelt incorrectly, please notify the Executive Editor, <strong>Pertanika</strong><br />
<strong>Journal</strong>s at nayan@upm.my.<br />
Any inclusion or exclusion of name(s) on this page does not commit the <strong>Pertanika</strong> Editorial Office, nor the UPM<br />
Press or the University to provide any liability for whatsoever reason.
<strong>Pertanika</strong><br />
Our goal is to bring high quality research to the widest possible audience<br />
<strong>Journal</strong> of Science & Technology<br />
INSTRUCTIONS TO AUTHORS<br />
(Manuscript Preparation & Submission Guidelines)<br />
Revised: July 2012<br />
We aim for excellence, sustained by a responsible and professional approach to journal publishing.<br />
We value and support our authors in the research community.<br />
Please read the guidelines and follow these instructions carefully; doing so will ensure that the publication of your manuscript<br />
is as rapid and efficient as possible. The Editorial Board reserves the right to return manuscripts that are not prepared in<br />
accordance with these guidelines.<br />
About the <strong>Journal</strong><br />
<strong>Pertanika</strong> is an international peer-reviewed journal devoted to the publication of original papers, and it serves as a forum for<br />
practical approaches to improving quality in issues pertaining to tropical agriculture and its related fields. <strong>Pertanika</strong> began<br />
publication in 1978 as <strong>Journal</strong> of Tropical Agricultural Science. In 1992, a decision was made to streamline <strong>Pertanika</strong> into three<br />
journals to meet the need for specialised journals in areas of study aligned with the interdisciplinary strengths of the university.<br />
The revamped <strong>Journal</strong> of Science and Technology (<strong>JST</strong>) is now focusing on research in science and engineering, and its<br />
related fields. Other <strong>Pertanika</strong> series include <strong>Journal</strong> of Tropical Agricultural Science (JTAS); and <strong>Journal</strong> of Social Sciences<br />
and Humanities (JSSH).<br />
<strong>JST</strong> is published in English and it is open to authors around the world regardless of the nationality. It is currently published two<br />
times a year i.e. in <strong>Jan</strong>uary and July.<br />
Goal of <strong>Pertanika</strong><br />
Our goal is to bring the highest quality research to the widest possible audience.<br />
Quality<br />
We aim for excellence, sustained by a responsible and professional approach to journal publishing. Submissions are guaranteed<br />
to receive a decision within 12 weeks. The elapsed time from submission to publication for the articles averages 5-6 months.<br />
Indexing of <strong>Pertanika</strong><br />
<strong>Pertanika</strong> is now over 33 years old; this accumulated knowledge has resulted in <strong>Pertanika</strong> journals being indexed in SCOPUS<br />
(Elsevier), EBSCO, DOAJ, AGRICOLA, and CABI etc. <strong>JST</strong> is indexed in SCOPUS, EBSCO, DOAJ, ISC and ERA .<br />
Future vision<br />
We are continuously improving access to our journal archives, content, and research services. We have the drive to realise<br />
exciting new horizons that will benefit not only the academic community, but society itself.<br />
We also have views on the future of our journals. The emergence of the online medium as the predominant vehicle for the<br />
‘consumption’ and distribution of much academic research will be the ultimate instrument in the dissemination of the research<br />
news to our scientists and readers.<br />
Aims and Scope<br />
<strong>Pertanika</strong> <strong>Journal</strong> of Science and Technology aims to provide a forum for high quality research related to science and engineering<br />
research. Areas relevant to the scope of the journal include: bioinformatics, bioscience, biotechnology and bio-molecular sciences,<br />
chemistry, computer science, ecology, engineering, engineering design, environmental control and management, mathematics and<br />
statistics, medicine and health sciences, nanotechnology, physics, safety and emergency management, and related fields of study.<br />
Editorial Statement<br />
<strong>Pertanika</strong> is the official journal of <strong>Universiti</strong> <strong>Putra</strong> Malaysia. The abbreviation for <strong>Pertanika</strong> <strong>Journal</strong> of Science & Technology is<br />
<strong>Pertanika</strong> J. Sci. Technol.
Guidelines for Authors<br />
Publication policies<br />
<strong>Pertanika</strong> policy prohibits an author from submitting the same manuscript for concurrent consideration by two or more publications.<br />
It prohibits as well publication of any manuscript that has already been published either in whole or substantial part elsewhere.<br />
It also does not permit publication of manuscript that has been published in full in Proceedings. Please refer to <strong>Pertanika</strong>’s<br />
Code of Ethics for full details.<br />
Editorial process<br />
Authors are notified on receipt of a manuscript and upon the editorial decision regarding publication.<br />
Manuscript review: Manuscripts deemed suitable for publication are sent to the Editorial Board members and/or other reviewers.<br />
We encourage authors to suggest the names of possible reviewers. Notification of the editorial decision is usually provided<br />
within to eight to ten weeks from the receipt of manuscript. Publication of solicited manuscripts is not guaranteed. In most<br />
cases, manuscripts are accepted conditionally, pending an author’s revision of the material.<br />
Author approval: Authors are responsible for all statements in articles, including changes made by editors. The liaison author<br />
must be available for consultation with an editor of The <strong>Journal</strong> to answer questions during the editorial process and to approve<br />
the edited copy. Authors receive edited typescript (not galley proofs) for final approval. Changes cannot be made to the copy<br />
after the edited version has been approved.<br />
Manuscript preparation<br />
<strong>Pertanika</strong> accepts submission of mainly four types of manuscripts. Each manuscript is classified as regular or original articles,<br />
short communications, reviews, and proposals for special issues. Articles must be in English and they must be competently<br />
written and argued in clear and concise grammatical English. Acceptable English usage and syntax are expected. Do not use<br />
slang, jargon, or obscure abbreviations or phrasing. Metric measurement is preferred; equivalent English measurement may<br />
be included in parentheses. Always provide the complete form of an acronym/abbreviation the first time it is presented in the<br />
text. Contributors are strongly recommended to have the manuscript checked by a colleague with ample experience in writing<br />
English manuscripts or an English language editor.<br />
Linguistically hopeless manuscripts will be rejected straightaway (e.g., when the language is so poor that one cannot be sure<br />
of what the authors really mean). This process, taken by authors before submission, will greatly facilitate reviewing, and thus<br />
publication if the content is acceptable.<br />
The instructions for authors must be followed. Manuscripts not adhering to the instructions will be returned for revision without<br />
review. Authors should prepare manuscripts according to the guidelines of <strong>Pertanika</strong>.<br />
1. Regular article<br />
Definition: Full-length original empirical investigations, consisting of introduction, materials and methods, results and discussion,<br />
conclusions. Original work must provide references and an explanation on research findings that contain new and significant<br />
findings.<br />
Size: Should not exceed 5000 words or 8-10 printed pages (excluding the abstract, references, tables and/or figures). One<br />
printed page is roughly equivalent to 3 type-written pages.<br />
2. Short communications<br />
Definition: Significant new information to readers of the <strong>Journal</strong> in a short but complete form. It is suitable for the publication of<br />
technical advance, bioinformatics or insightful findings of plant and animal development and function.<br />
Size: Should not exceed 2000 words or 4 printed pages, is intended for rapid publication. They are not intended for publishing<br />
preliminary results or to be a reduced version of Regular Papers or Rapid Papers.<br />
3. Review article<br />
Definition: Critical evaluation of materials about current research that had already been published by organizing, integrating,<br />
and evaluating previously published materials. Re-analyses as meta-analysis and systemic reviews are encouraged. Review<br />
articles should aim to provide systemic overviews, evaluations and interpretations of research in a given field.<br />
Size: Should not exceed 4000 words or 7-8 printed pages.<br />
4. Special issues<br />
Definition: Usually papers from research presented at a conference, seminar, congress or a symposium.<br />
Size: Should not exceed 5000 words or 8-10 printed pages.<br />
5. Others<br />
Definition: Brief reports, case studies, comments, Letters to the Editor, and replies on previously published articles may be<br />
considered.<br />
Size: Should not exceed 2000 words or up to 4 printed pages.
With few exceptions, original manuscripts should not exceed the recommended length of 6 printed pages (about 18 typed pages,<br />
double-spaced and in 12-point font, tables and figures included). Printing is expensive, and, for the <strong>Journal</strong>, postage doubles<br />
when an issue exceeds 80 pages. You can understand then that there is little room for flexibility.<br />
Long articles reduce the <strong>Journal</strong>’s possibility to accept other high-quality contributions because of its 80-page restriction. We<br />
would like to publish as many good studies as possible, not only a few lengthy ones. (And, who reads overly long articles<br />
anyway?) Therefore, in our competition, short and concise manuscripts have a definite advantage.<br />
Format<br />
The paper should be formatted in one column format with at least 4cm margins and 1.5 line spacing throughout. Authors are<br />
advised to use Times New Roman 12-point font. Be especially careful when you are inserting special characters, as those<br />
inserted in different fonts may be replaced by different characters when converted to PDF files. It is well known that ‘µ’ will be<br />
replaced by other characters when fonts such as ‘Symbol’ or ‘Mincho’ are used.<br />
A maximum of eight keywords should be indicated below the abstract to describe the contents of the manuscript. Leave a blank<br />
line between each paragraph and between each entry in the list of bibliographic references. Tables should preferably be placed<br />
in the same electronic file as the text. Authors should consult a recent issue of the <strong>Journal</strong> for table layout.<br />
Every page of the manuscript, including the title page, references, tables, etc. should be numbered. However, no reference<br />
should be made to page numbers in the text; if necessary, one may refer to sections. Underline words that should be in italics,<br />
and do not underline any other words.<br />
We recommend that authors prepare the text as a Microsoft Word file.<br />
1. Manuscripts in general should be organised in the following order:<br />
o Page 1: Running title. (Not to exceed 60 characters, counting letters and spaces). This page should only<br />
contain the running title of your paper. The running title is an abbreviated title used as the running head on<br />
every page of the manuscript.<br />
In addition, the Subject areas most relevant to the study must be indicated on this page. Select the<br />
appropriate subject areas from the Scope of the <strong>Journal</strong>s provided in the Manuscript Submission Guide.<br />
A list of number of black and white / colour figures and tables should also be indicated on this<br />
page. Figures submitted in color will be printed in colour. See “5. Figures & Photographs” for details.<br />
o Page 2: Author(s) and Corresponding author information. This page should contain the full title of<br />
your paper with name(s) of all the authors, institutions and corresponding author’s name, institution and full<br />
address (Street address, telephone number (including extension), hand phone number, fax number and<br />
e-mail address) for editorial correspondence. The names of the authors must be abbreviated following the<br />
international naming convention. e.g. Salleh, A.B., Tan, S.G., or Sapuan, S.M.<br />
Authors’ addresses. Multiple authors with different addresses must indicate their respective addresses<br />
separately by superscript numbers:<br />
George Swan 1 and Nayan Kanwal 2<br />
1 Department of Biology, Faculty of Science, Duke University, Durham, North Carolina, USA.<br />
2 Office of the Deputy Vice Chancellor (R&I), <strong>Universiti</strong> <strong>Putra</strong> Malaysia, Serdang, Malaysia.<br />
o Page 3: This page should repeat the full title of your paper with only the Abstract (the abstract should<br />
be less than 250 words for a Regular Paper and up to 100 words for a Short Communication). Keywords<br />
must also be provided on this page (Not more than eight keywords in alphabetical order).<br />
o Page 4 and subsequent pages: This page should begin with the Introduction of your article and the rest<br />
of your paper should follow from page 5 onwards.<br />
Abbreviations. Define alphabetically, other than abbreviations that can be used without definition. Words or<br />
phrases that are abbreviated in the introduction and following text should be written out in full the first time that<br />
they appear in the text, with each abbreviated form in parenthesis. Include the common name or scientific name,<br />
or both, of animal and plant materials.<br />
Footnotes. Current addresses of authors if different from heading.<br />
2. Text. Regular Papers should be prepared with the headings Introduction, Materials and Methods, Results<br />
and Discussion, Conclusions in this order. Short Communications should be prepared according to “8. Short<br />
Communications.” below.<br />
3. Tables. All tables should be prepared in a form consistent with recent issues of <strong>Pertanika</strong> and should be numbered<br />
consecutively with Arabic numerals. Explanatory material should be given in the table legends and footnotes. Each
table should be prepared on a separate page. (Note that when a manuscript is accepted for publication, tables must<br />
be submitted as data - .doc, .rtf, Excel or PowerPoint file- because tables submitted as image data cannot be edited<br />
for publication.)<br />
4. Equations and Formulae. These must be set up clearly and should be typed triple spaced. Numbers identifying<br />
equations should be in square brackets and placed on the right margin of the text.<br />
5. Figures & Photographs. Submit an original figure or photograph. Line drawings must be clear, with high black and<br />
white contrast. Each figure or photograph should be prepared on a separate sheet and numbered consecutively with<br />
Arabic numerals. Appropriate sized numbers, letters and symbols should be used, no smaller than 2 mm in size after<br />
reduction to single column width (85 mm), 1.5-column width (120 mm) or full 2-column width (175 mm).<br />
6. Failure to comply with these specifications will require new figures and delay in publication. For electronic figures,<br />
create your figures using applications that are capable of preparing high resolution TIFF files acceptable for publication.<br />
In general, we require 300 dpi or higher resolution for coloured and half-tone artwork and 1200 dpi or higher for<br />
line drawings. For review, you may attach low-resolution figures, which are still clear enough for reviewing, to keep<br />
the file of the manuscript under 5 MB. Illustrations may be produced at extra cost in colour at the discretion of the<br />
Publisher; the author could be charged Malaysian Ringgit 50 for each colour page.<br />
7. References. Literature citations in the text should be made by name(s) of author(s) and year. For references with<br />
more than two authors, the name of the first author followed by ‘et al.’ should be used.<br />
Swan and Kanwal (2007) reported that …<br />
The results have been interpreted (Kanwal et al. 2009).<br />
o References should be listed in alphabetical order, by the authors’ last names. For the same author, or<br />
for the same set of authors, references should be arranged chronologically. If there is more than one<br />
publication in the same year for the same author(s), the letters ‘a’, ‘b’, etc., should be added to the year.<br />
o When the authors are more than 11, list 5 authors and then et al.<br />
o Do not use indentations in typing References. Use one line of space to separate each reference. The<br />
name of the journal should be written in full. For example:<br />
Jalaludin, S. (1997a). Metabolizable energy of some local feeding stuff. Tumbuh, 1, <strong>21</strong>-24.<br />
Jalaludin, S. (1997b). The use of different vegetable oil in chicken ration. Malayan<br />
Agriculturist, 11, 29-31.<br />
Tan, S.G., Omar, M.Y., Mahani, K.W., Rahani, M., & Selvaraj, O.S. (1994). Biochemical<br />
genetic studies on wild populations of three species of green leafhoppers Nephotettix from<br />
Peninsular Malaysia. Biochemical Genetics, 32, 415 - 422.<br />
o In case of citing an author(s) who has published more than one paper in the same year, the papers should<br />
be distinguished by addition of a small letter as shown above, e.g. Jalaludin (1997a); Jalaludin (1997b).<br />
o Unpublished data and personal communications should not be cited as literature citations, but given in the<br />
text in parentheses. ‘In press’ articles that have been accepted for publication may be cited in References.<br />
Include in the citation the journal in which the ‘in press’ article will appear and the publication date, if a date<br />
is available.<br />
8. Examples of other reference citations:<br />
Monographs: Turner, H.N., & Yong, S.S.Y. (2006). Quantitative Genetics in Sheep Breeding. Ithaca: Cornell University<br />
Press.<br />
Chapter in Book: Kanwal, N.D.S. (1992). Role of plantation crops in Papua New Guinea economy. In Angela R. McLean<br />
(Ed.), Introduction of livestock in the Enga province PNG (p. 2<strong>21</strong>-250). United Kingdom: Oxford Press.<br />
Proceedings: Kanwal, N.D.S. (2001). Assessing the visual impact of degraded land management with landscape<br />
design software. In Kanwal, N.D.S., & Lecoustre, P. (Eds.), International forum for Urban Landscape Technologies (p.<br />
117-127). Lullier, Geneva, Switzerland: CIRAD Press.<br />
9. Short Communications should include Introduction, Materials and Methods, Results and Discussion, Conclusions<br />
in this order. Headings should only be inserted for Materials and Methods. The abstract should be up to 100 words,<br />
as stated above. Short Communications must be 5 printed pages or less, including all references, figures and tables.<br />
References should be less than 30. A 5 page paper is usually approximately 3000 words plus four figures or tables (if<br />
each figure or table is less than 1/4 page).<br />
*Authors should state the total number of words (including the Abstract) in the cover letter. Manuscripts that do not<br />
fulfill these criteria will be rejected as Short Communications without review.
STYLE OF THE MANUSCRIPT<br />
Manuscripts should follow the style of the latest version of the Publication Manual of the American Psychological Association<br />
(APA). The journal uses American or British spelling and authors may follow the latest edition of the Oxford Advanced Learner’s<br />
Dictionary for British spellings.<br />
SUBMISSION OF MANUSCRIPTS<br />
All articles should be submitted electronically using the ScholarOne web-based system. ScholarOne, a Thomson Reuters product<br />
provides comprehensive workflow management systems for scholarly journals. For more information, go to our web page and<br />
click “Online Submission”.<br />
Alternatively, you may submit the electronic files (cover letter, manuscript, and the Manuscript Submission Kit comprising<br />
Declaration and Referral forms) via email directly to the Executive Editor. If the files are too large to email, mail a CD containing<br />
the files. The Manuscript Submission Guide and Submission Kit are available from the <strong>Pertanika</strong>’s home page at<br />
http://www.pertanika.upm.edu.my/ or from the Executive Editor’s office upon request.<br />
All articles submitted to the journal must comply with these instructions. Failure to do so will result in return of the manuscript<br />
and possible delay in publication.<br />
Please do not submit manuscripts to the editor-in-chief or to any other office directly. All manuscripts must be submitted through<br />
the executive editor’s office to be properly acknowledged and rapidly processed at the address below:<br />
Dr. Nayan KANWAL<br />
The Executive Editor<br />
<strong>Pertanika</strong> <strong>Journal</strong>s, UPM Press<br />
Office of the Deputy Vice Chancellor (R&I)<br />
IDEA Tower II, UPM-MTDC Technology Centre<br />
<strong>Universiti</strong> <strong>Putra</strong> Malaysia<br />
43400 UPM, Serdang, Selangor<br />
Malaysia<br />
E-mail: executive_editor.pertanika@upm.my; tel: + 603-8947 1622.<br />
or visit our website at http://www.pertanika.upm.edu.my/home.php for further information.<br />
Authors should retain copies of submitted manuscripts and correspondence, as materials can not be returned. Authors are<br />
required to inform the Executive Editor of any change of address which occurs whilst their papers are in the process of publication.<br />
Cover letter<br />
All submissions must be accompanied by a cover letter detailing what you are submitting. Papers are accepted for<br />
publication in the journal on the understanding that the article is original and the content has not been published or<br />
submitted for publication elsewhere. This must be stated in the cover letter.<br />
The cover letter must also contain an acknowledgement that all authors have contributed significantly, and that all<br />
authors are in agreement with the content of the manuscript.<br />
The cover letter of the paper should contain (i) the title; (ii) the full names of the authors; (iii) the addresses of the<br />
institutions at which the work was carried out together with (iv) the full postal and email address, plus facsimile and<br />
telephone numbers of the author to whom correspondence about the manuscript should be sent. The present address<br />
of any author, if different from that where the work was carried out, should be supplied in a footnote.<br />
As articles are double-blind reviewed, material that might identify authorship of the paper should be placed on a cover sheet.<br />
Peer review<br />
<strong>Pertanika</strong> follows a double-blind peer-review process. Peer reviewers are experts chosen by journal editors to provide written<br />
assessment of the strengths and weaknesses of written research, with the aim of improving the reporting of research and<br />
identifying the most appropriate and highest quality material for the journal.<br />
In the peer-review process, three referees independently evaluate the scientific quality of the submitted manuscripts. Authors<br />
are encouraged to indicate in the Referral form using the Manuscript Submission Kit the names of three potential reviewers,<br />
but the editors will make the final choice. The editors are not, however, bound by these suggestions.<br />
Manuscripts should be written so that they are intelligible to the professional reader who is not a specialist in the particular field.<br />
They should be written in a clear, concise, direct style. Where contributions are judged as acceptable for publication on the basis<br />
of content, the Editor reserves the right to modify the typescripts to eliminate ambiguity and repetition and improve communication<br />
between author and reader. If extensive alterations are required, the manuscript will be returned to the author for revision.
The <strong>Journal</strong>’s review process<br />
What happens to a manuscript once it is submitted to <strong>Pertanika</strong>? Typically, there are seven steps to the editorial review process:<br />
1. The executive editor and the editorial board examine the paper to determine whether it is appropriate for the journal and<br />
should be reviewed. If not appropriate, the manuscript is rejected outright and the author is informed.<br />
2. The executive editor sends the article-identifying information having been removed, to three reviewers. Typically, one of<br />
these is from the <strong>Journal</strong>’s editorial board. Others are specialists in the subject matter represented by the article. The<br />
executive editor asks them to complete the review in three weeks and encloses two forms: (a) referral form B and (b)<br />
reviewer’s comment form along with reviewer’s guidelines. Comments to authors are about the appropriateness and<br />
adequacy of the theoretical or conceptual framework, literature review, method, results and discussion, and conclusions.<br />
Reviewers often include suggestions for strengthening of the manuscript. Comments to the editor are in the nature of<br />
the significance of the work and its potential contribution to the literature.<br />
3. The executive editor, in consultation with the editor-in-chief, examines the reviews and decides whether to reject the<br />
manuscript, invite the author(s) to revise and resubmit the manuscript, or seek additional reviews. Final acceptance or<br />
rejection rests with the Editorial Board, who reserves the right to refuse any material for publication. In rare instances,<br />
the manuscript is accepted with almost no revision. Almost without exception, reviewers’ comments (to the author)<br />
are forwarded to the author. If a revision is indicated, the editor provides guidelines for attending to the reviewers’<br />
suggestions and perhaps additional advice about revising the manuscript.<br />
4. The authors decide whether and how to address the reviewers’ comments and criticisms and the editor’s concerns.<br />
The authors submit a revised version of the paper to the executive editor along with specific information describing how<br />
they have answered’ the concerns of the reviewers and the editor.<br />
5. The executive editor sends the revised paper out for review. Typically, at least one of the original reviewers will be<br />
asked to examine the article.<br />
6. When the reviewers have completed their work, the executive editor in consultation with the editorial board and the<br />
editor-in-chief examine their comments and decide whether the paper is ready to be published, needs another round<br />
of revisions, or should be rejected.<br />
7. If the decision is to accept, the paper is sent to that Press and the article should appear in print in approximately three<br />
months. The Publisher ensures that the paper adheres to the correct style (in-text citations, the reference list, and tables<br />
are typical areas of concern, clarity, and grammar). The authors are asked to respond to any queries by the Publisher.<br />
Following these corrections, page proofs are mailed to the corresponding authors for their final approval. At this point,<br />
only essential changes are accepted. Finally, the article appears in the pages of the <strong>Journal</strong> and is posted on-line.<br />
English language editing<br />
<strong>Pertanika</strong> emphasizes on the linguistic accuracy of every manuscript published. Thus all authors are required to get their<br />
manuscripts edited by professional English language editors. Author(s) must provide a certificate confirming that their<br />
manuscripts have been adequately edited. A proof from a recognised editing service should be submitted together with the cover<br />
letter at the time of submitting a manuscript to <strong>Pertanika</strong>. All costs will be borne by the author(s).<br />
This step, taken by authors before submission, will greatly facilitate reviewing, and thus publication if the content is acceptable.<br />
Author material archive policy<br />
Authors who require the return of any submitted material that is rejected for publication in the journal should indicate on the<br />
cover letter. If no indication is given, that author’s material should be returned, the Editorial Office will dispose of all hardcopy<br />
and electronic material.<br />
Copyright<br />
Authors publishing the <strong>Journal</strong> will be asked to sign a declaration form. In signing the form, it is assumed that authors have<br />
obtained permission to use any copyrighted or previously published material. All authors must read and agree to the conditions<br />
outlined in the form, and must sign the form or agree that the corresponding author can sign on their behalf. Articles cannot be<br />
published until a signed form has been received.<br />
Lag time<br />
A decision on acceptance or rejection of a manuscript is reached in 3 to 4 months (average 14 weeks). The elapsed time from<br />
submission to publication for the articles averages 5-6 months.<br />
Hardcopies of the <strong>Journal</strong>s and off prints<br />
Under the <strong>Journal</strong>’s open access initiative, authors can choose to download free material (via PDF link) from any of the journal<br />
issues from <strong>Pertanika</strong>’s website. Under “Browse <strong>Journal</strong>s” you will see a link entitled “Current Issues” or “Archives”. Here you<br />
will get access to all back-issues from 1978 onwards.<br />
The corresponding author for all articles will receive one complimentary hardcopy of the journal in which his/her articles is<br />
published. In addition, 20 off prints of the full text of their article will also be provided. Additional copies of the journals may be<br />
purchased by writing to the executive editor.
Our journals’ reputation for quality is<br />
unsurpassed ensuring that the originality, authority<br />
and accuracy of your work will be fully recognised.<br />
Each manuscript submitted to <strong>Pertanika</strong><br />
undergoesa rigid originality check. Our<br />
double-blind peer refereeing procedures are<br />
fair and open, and we aim to help authors<br />
develop and improve their work. <strong>Pertanika</strong><br />
JTAS is now over 33 years old; this<br />
accumulated knowledge has resulted in<br />
<strong>Pertanika</strong> being indexed in SCOPUS<br />
(Elsevier), Thomson (Biosis), EBSCO, CABI,<br />
AGRICOLA, Google Scholar, MyAIS, ISC and ERA.<br />
SCOPUS, EBSCO, DOAJ & ISC<br />
four times a year in<br />
February, May, August and November.<br />
September and December.<br />
<strong>Jan</strong>uary and July.<br />
four times a year in March, June,<br />
www.pertanika.upm.edu.my or by mail or email upon request.
Usability of Educational Computer Game (UsaECG): A Quantitative Approach 247<br />
Hasiah Mohamed@Omar, Azizah Jaafar and Rohana Yusoff<br />
The Role of Similarity Measurement in an Agent-Based Supplier Selection<br />
Framework<br />
Alireza Jahani, Masrah Azrifah Azmi Murad, Md. Nasir Sulaiman<br />
and Hasan Selamat<br />
261
Selected Articles from UPM-Malaysian Nuclear Agency Symposium 2011<br />
Guest Editor: Mohd Sapuan Salit<br />
Guest Editorial Board: Mansor Ahmad, Syams Zainudin, Hawa Ze Jaafar,<br />
Fathinul Fikri Ahmad Saad, Kamarudin Hashim and Mohamad Azwar Hashim<br />
Radiation-Induced Formation of Acrylated Palm Oil Nanoparticle Using Pluronic<br />
F-127 Microemulsion System<br />
Tajau, R., Wan Yunus, W. M. Z., Mohd Dahlan, K. Z., Mahmood, M. H.,<br />
Hashim, K., Ismail, M., Salleh, M. and Che Ismail, R.<br />
Induced Tensile Properties With EB- Cross Linking of Hybridized Kenaf/Palf<br />
Reinforced HDPE Composite<br />
Aji, I. S., Zinudin, E. S., Khairul, M. Z., Abdan, K. and S. M. Sapuan<br />
Thermal Properties of Alkali-Treated Sugar Palm Fibre Reinforced High Impact<br />
Polystyrene Composites<br />
D. Bachtiar, S. M. Sapuan, E. S. Zainudin, A. Khalina and K. Z. H. M. Dahlan<br />
FTIR and TGA Analysis of Biodegradable Poly(Lactic Acid)/Treated Kenaf Bast<br />
Fibre: Effect of Plasticizers<br />
N. Maizatul, I. Norazowa, W. M. Z. W. Yunus, A. Khalina and K. Khalisanni<br />
Selected Articles from The International Conference on Information Retrieval<br />
and Knowledge Management, CAMP’12<br />
Guest Editors: Shyamala Doraisamy and Ramlan Mahmod<br />
Guest Editorial Board: Lili Nurliyana Abdullah, Rusli Abdullah, Masrah Azmi Murad, Rodziah<br />
Atan and Rabiah Abdul Kadir<br />
Content-based Image Retrieval Using Colour and Shape Fused Features 161<br />
Mas Rina Mustaffa, Fatimah Ahmad, Ramlan Mahmod and Shyamala Doraisamy<br />
Toward Automatic Semantic Annotating and Pattern Mining for Domain Knowledge<br />
Acquisition<br />
Tianyong Hao and Yingying Qu<br />
Issues on Trust Management in Wireless Environment 183<br />
Abubakr Sirageldin, Baharum Baharudin and Low Tang Jung<br />
A Negation Query Engine for Complex Query Transformations 193<br />
Rizwan Iqbal and Masrah Azrifah Azmi Murad<br />
Modified Multi-Class Classification using Association Rule Mining 205<br />
Yuhanis Yusof and Mohammed Hayel Refai<br />
Multi-Format Information Fusion through Integrated Metadata Using Hybrid<br />
Ontology for Disaster Management<br />
Che Mustapha Yusuf, J., Mohd Su’ud, M., Boursier, P. and Muhammad, A.<br />
Context Modelling for Just-In-Time Mobile Information Retrieval (JIT-MobIR) 227<br />
Az Azrinudin Alidin and Fabio Crestani<br />
Using SVMs for Classification of Cross-Document Relationships 239<br />
Yogan Jaya Kumar, Naomie Salim, Ahmed Hamza Osman<br />
and Albaraa Abuobieda<br />
127<br />
135<br />
141<br />
151<br />
169<br />
<strong>21</strong>7