d(GC) - Association of Biotechnology and Pharmacy
d(GC) - Association of Biotechnology and Pharmacy
d(GC) - Association of Biotechnology and Pharmacy

Create successful ePaper yourself
Turn your PDF publications into a flip-book with our unique Google optimized e-Paper software.
Current Trends in <strong>Biotechnology</strong> <strong>and</strong> <strong>Pharmacy</strong><br />
Vol. 6 (2) 173-182 April 2012, ISSN 0973-8916 (Print), 2230-7303 (Online)<br />
DNA fingerprinting <strong>of</strong> M. grisea isolates:<br />
Polymerase Chain Reaction (PCR) was<br />
performed in a final volume <strong>of</strong> 25 µl consisting <strong>of</strong><br />
0.25 mM <strong>of</strong> each dNTP’s, 1 unit <strong>of</strong> Taq DNA<br />
polymerase, 15-20 ng <strong>of</strong> DNA template, 0.3 µM<br />
<strong>of</strong> primer (Integrated DNA Technologies, Iowa,<br />
USA), 1 X PCR buffer (containing 1.5 mM MgCl 2 )<br />
<strong>and</strong> sterile distilled water. The reactions were<br />
carried in a Thermal Cycler PT-100 (MJ<br />
Research, Watertown, MA). Thermal pr<strong>of</strong>ile was<br />
94 o C for 5 min, followed by 36 cycles <strong>of</strong> 94 o C for<br />
45 sec, 50-60 o C for 1 min, 72 o C for 1 min with<br />
final extension <strong>of</strong> 72 o C for 7 min. The PCR<br />
products were electrophoresed at 100 v for 3 h<br />
on 3.5 % agarose gels in 0.5 X TBE buffer for<br />
MGM primers <strong>and</strong> on 1 % agarose gel for Pot2<br />
primer. Gels were stained with ethidium bromide<br />
<strong>and</strong> visualized using UV Trans illuminator. Twelve<br />
MGM Primers <strong>and</strong> a Pot2 primer were used for<br />
PCR amplification <strong>of</strong> 34 M. grisea isolates.<br />
Analysis <strong>of</strong> DNA fingerprints: The pr<strong>of</strong>iles<br />
generated by different MGM <strong>and</strong> Pot2 primers<br />
were compiled to determine the genetic<br />
relatedness among the different M. grisea<br />
isolates. The presence or absence <strong>of</strong> each b<strong>and</strong><br />
in all the isolates was scored manually by binary<br />
data matrix with ‘1’ indicating the presence <strong>of</strong> the<br />
b<strong>and</strong> <strong>and</strong> ‘0’ indicating the absence. Data were<br />
generated separately for each primer. A similarity<br />
matrix was generated from the binary data using<br />
Jaccard’s similarity coefficient in the SIMQUAL<br />
program <strong>of</strong> the NTSYS-pc package. Cluster<br />
analysis was performed with the unweighted pair<br />
group arithmetic mean method (UPGMA) in the<br />
SHAN program <strong>of</strong> the NTSYS-pc package (26).<br />
Results <strong>and</strong> Discussion<br />
Thirty four M. grisea isolates from various<br />
endemic regions in India were selected for the<br />
present study to gain insight into the genetic<br />
diversity <strong>of</strong> the fungal population. A set <strong>of</strong> 12<br />
Magnaporthe grisea Microsatellite (MGM)<br />
markers <strong>and</strong> a repeat element specific primer<br />
Pot2 were used in the present study. Of these<br />
markers, 10 MGM markers viz., MGM - 1, MGM<br />
175<br />
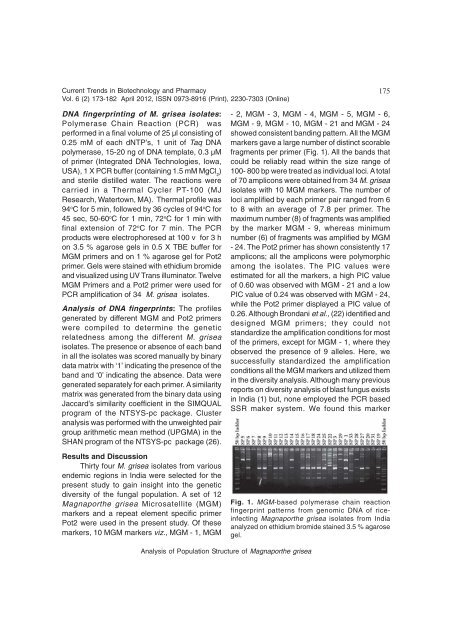
- 2, MGM - 3, MGM - 4, MGM - 5, MGM - 6,<br />
MGM - 9, MGM - 10, MGM - 21 <strong>and</strong> MGM - 24<br />
showed consistent b<strong>and</strong>ing pattern. All the MGM<br />
markers gave a large number <strong>of</strong> distinct scorable<br />
fragments per primer (Fig. 1). All the b<strong>and</strong>s that<br />
could be reliably read within the size range <strong>of</strong><br />
100- 800 bp were treated as individual loci. A total<br />
<strong>of</strong> 70 amplicons were obtained from 34 M. grisea<br />
isolates with 10 MGM markers. The number <strong>of</strong><br />
loci amplified by each primer pair ranged from 6<br />
to 8 with an average <strong>of</strong> 7.8 per primer. The<br />
maximum number (8) <strong>of</strong> fragments was amplified<br />
by the marker MGM - 9, whereas minimum<br />
number (6) <strong>of</strong> fragments was amplified by MGM<br />
- 24. The Pot2 primer has shown consistently 17<br />
amplicons; all the amplicons were polymorphic<br />
among the isolates. The PIC values were<br />
estimated for all the markers, a high PIC value<br />
<strong>of</strong> 0.60 was observed with MGM - 21 <strong>and</strong> a low<br />
PIC value <strong>of</strong> 0.24 was observed with MGM - 24,<br />
while the Pot2 primer displayed a PIC value <strong>of</strong><br />
0.26. Although Brondani et al., (22) identified <strong>and</strong><br />
designed MGM primers; they could not<br />
st<strong>and</strong>ardize the amplification conditions for most<br />
<strong>of</strong> the primers, except for MGM - 1, where they<br />
observed the presence <strong>of</strong> 9 alleles. Here, we<br />
successfully st<strong>and</strong>ardized the amplification<br />
conditions all the MGM markers <strong>and</strong> utilized them<br />
in the diversity analysis. Although many previous<br />
reports on diversity analysis <strong>of</strong> blast fungus exists<br />
in India (1) but, none employed the PCR based<br />
SSR maker system. We found this marker<br />
Fig. 1. MGM-based polymerase chain reaction<br />
fingerprint patterns from genomic DNA <strong>of</strong> riceinfecting<br />
Magnaporthe grisea isolates from India<br />
analyzed on ethidium bromide stained 3.5 % agarose<br />
gel.<br />
Analysis <strong>of</strong> Population Structure <strong>of</strong> Magnaporthe grisea