d(GC) - Association of Biotechnology and Pharmacy
d(GC) - Association of Biotechnology and Pharmacy
d(GC) - Association of Biotechnology and Pharmacy

You also want an ePaper? Increase the reach of your titles
YUMPU automatically turns print PDFs into web optimized ePapers that Google loves.
Current Trends in <strong>Biotechnology</strong> <strong>and</strong> <strong>Pharmacy</strong><br />
Vol. 6 (2) 241-254 April 2012, ISSN 0973-8916 (Print), 2230-7303 (Online)<br />
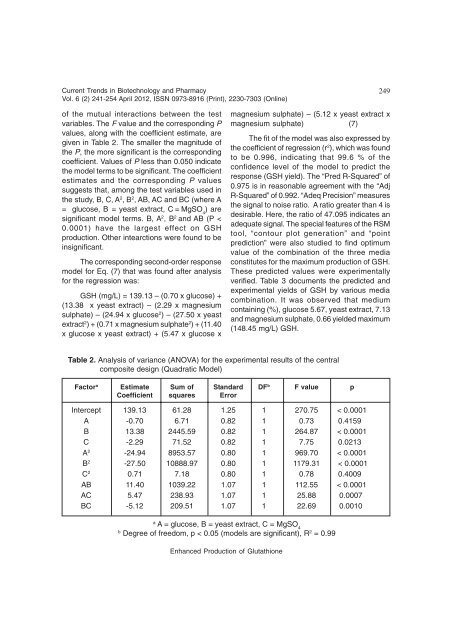
<strong>of</strong> the mutual interactions between the test<br />
variables. The F value <strong>and</strong> the corresponding P<br />
values, along with the coefficient estimate, are<br />
given in Table 2. The smaller the magnitude <strong>of</strong><br />
the P, the more significant is the corresponding<br />
coefficient. Values <strong>of</strong> P less than 0.050 indicate<br />
the model terms to be significant. The coefficient<br />
estimates <strong>and</strong> the corresponding P values<br />
suggests that, among the test variables used in<br />
the study, B, C, A 2 , B 2 , AB, AC <strong>and</strong> BC (where A<br />
= glucose, B = yeast extract, C = MgSO 4 ) are<br />
significant model terms. B, A 2 , B 2 <strong>and</strong> AB (P <<br />
0.0001) have the largest effect on GSH<br />
production. Other intearctions were found to be<br />
insignificant.<br />
The corresponding second-order response<br />
model for Eq. (7) that was found after analysis<br />
for the regression was:<br />
GSH (mg/L) = 139.13 – (0.70 x glucose) +<br />
(13.38 x yeast extract) – (2.29 x magnesium<br />
sulphate) – (24.94 x glucose 2 ) – (27.50 x yeast<br />
extract 2 ) + (0.71 x magnesium sulphate 2 ) + (11.40<br />
x glucose x yeast extract) + (5.47 x glucose x<br />
249<br />
magnesium sulphate) – (5.12 x yeast extract x<br />
magnesium sulphate) (7)<br />
The fit <strong>of</strong> the model was also expressed by<br />
the coefficient <strong>of</strong> regression (r 2 ), which was found<br />
to be 0.996, indicating that 99.6 % <strong>of</strong> the<br />
confidence level <strong>of</strong> the model to predict the<br />
response (GSH yield). The “Pred R-Squared” <strong>of</strong><br />
0.975 is in reasonable agreement with the “Adj<br />
R-Squared” <strong>of</strong> 0.992. “Adeq Precision” measures<br />
the signal to noise ratio. A ratio greater than 4 is<br />
desirable. Here, the ratio <strong>of</strong> 47.095 indicates an<br />
adequate signal. The special features <strong>of</strong> the RSM<br />
tool, “contour plot generation” <strong>and</strong> “point<br />
prediction” were also studied to find optimum<br />
value <strong>of</strong> the combination <strong>of</strong> the three media<br />
constitutes for the maximum production <strong>of</strong> GSH.<br />
These predicted values were experimentally<br />
verified. Table 3 documents the predicted <strong>and</strong><br />
experimental yields <strong>of</strong> GSH by various media<br />
combination. It was observed that medium<br />
containing (%), glucose 5.67, yeast extract, 7.13<br />
<strong>and</strong> magnesium sulphate, 0.66 yielded maximum<br />
(148.45 mg/L) GSH.<br />
Table 2. Analysis <strong>of</strong> variance (ANOVA) for the experimental results <strong>of</strong> the central<br />
composite design (Quadratic Model)<br />
Factor a Estimate Sum <strong>of</strong> St<strong>and</strong>ard DF b F value p<br />
Coefficient squares Error<br />
Intercept 139.13 61.28 1.25 1 270.75 < 0.0001<br />
A -0.70 6.71 0.82 1 0.73 0.4159<br />
B 13.38 2445.59 0.82 1 264.87 < 0.0001<br />
C -2.29 71.52 0.82 1 7.75 0.0213<br />
A 2 -24.94 8953.57 0.80 1 969.70 < 0.0001<br />
B 2 -27.50 10888.97 0.80 1 1179.31 < 0.0001<br />
C 2 0.71 7.18 0.80 1 0.78 0.4009<br />
AB 11.40 1039.22 1.07 1 112.55 < 0.0001<br />
AC 5.47 238.93 1.07 1 25.88 0.0007<br />
BC -5.12 209.51 1.07 1 22.69 0.0010<br />
a A = glucose, B = yeast extract, C = MgSO4<br />
b Degree <strong>of</strong> freedom, p < 0.05 (models are significant), R 2 = 0.99<br />
Enhanced Production <strong>of</strong> Glutathione