willis ∙ iata ∙ aapa asia pacific aviation insurance conference
willis ∙ iata ∙ aapa asia pacific aviation insurance conference
willis ∙ iata ∙ aapa asia pacific aviation insurance conference

Create successful ePaper yourself
Turn your PDF publications into a flip-book with our unique Google optimized e-Paper software.
WILLIS <strong>∙</strong> IATA <strong>∙</strong> AAPA ASIA PACIFIC<br />
AVIATION INSURANCE CONFERENCE<br />
PHUKET, THAILAND<br />
26th – 29th February 2008<br />
Le Méridien Phuket
GAB<br />
global_<strong>aviation</strong>_bulletin@<strong>willis</strong>.com<br />
January 31, 2008 - Edition No 148<br />
Airline Hull and Liability review - December Renewals<br />
Once again, December was the busiest month of the renewal calendar; there were in excess of 50 programmes that<br />
renewed during the month which met our selection criteria*, generating US$745m in premium, a reduction of 11% (on a<br />
like for like basis). This compares with a reduction of 21% in December 2006.<br />
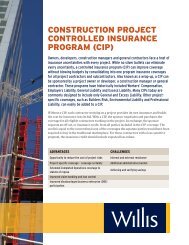
These reductions resulted in the hull and liability premium totalling US$1,608m for 2007, a reduction of 11.5%, again this is<br />
a much smaller percentage reduction than seen in 2006. As can be seen in the following chart, the level of premium<br />
reductions continued to decline as the year progressed, providing evidence that the market was slowly starting to show<br />
signs of hardening, albeit whilst still giving reductions in rate.<br />
Gross 4 th Quarter 2006 & 2007 Premium Movements<br />
10%<br />
5%<br />
0%<br />
-5%<br />
-10%<br />
-15%<br />
-20%<br />
-25%<br />
% Change in Total Premium Cumulative Percentage Change for period Cumulative Percentage Change for 2007<br />
-21% -20% -21%<br />
-17% -18% -17% -17%<br />
-20%<br />
-19%<br />
-22%<br />
The Global Aviation Bulletin is intended to inform our clients and others of issues and developments within the<br />
aerospace <strong>insurance</strong> markets. Whilst every effort is made to ensure the accuracy of the information contained herein,Willis Limited accept no<br />
responsibility for any errors or omissions in the information, or their consequences.<br />
*The selection criteria used for analysis are: Programmes with an Average Fleet Value (AFV) in excess of US$100m.<br />
3%<br />
-19.1%<br />
6%<br />
-8%<br />
-11.5%<br />
Oct-06 Nov-06 Dec-06 Jan-07 Feb-07 Mar-07 Apr-07 May-07 Jun-07 Jul-07 Aug-07 Sep-07 Oct-07 Nov-07 Dec-07<br />
Premium movement % derived from Airlines Renewing with Average Fleet Value US$100m and greater. Comparisons made from annual renewal figures year-on-year - It<br />
should be noted that due to the relatively small sample of renewals in some months, that the comparisons with 2006 - can be distorted by the renewal of a small number of<br />
major risks and should be treated with caution.<br />
-8%<br />
-11%<br />
In this issue<br />
Airline:<br />
Hull & Liability Review<br />
Losses & Incidents<br />
Hull War Update<br />
Regional Review<br />
AFV Review<br />
Renewal Distribution<br />
News:<br />
General News<br />
Market News<br />
A Lloyd’s broker, authorised and regulated by the Financial Services<br />
Authority. Registered office Ten Trinity Square, London EC3P 3AX.<br />
Registered number 181116 England and Wales.
Airline Hull and Liability<br />
Airline Renewals 2007 Hull & Liability Gross Premium % Change Analysis<br />
Year to date summary table<br />
AFV %<br />
Change<br />
December 2007 Renewals (Cont.)<br />
PAX %<br />
Change<br />
The reductions in premium during the fourth quarter remained fairly consistent; October<br />
saw a premium reduction of 8.2%, November a reduction of 8.4% and December a<br />
reduction of 10.6%. This resulted in an average reduction of 9.9% for the fourth quarter<br />
in 2007, this compares with a reduction of 20.5% for the fourth quarter in 2006.<br />
As can be seen from the chart below, nearly half the world’s airline premium<br />
income was generated during the month and it has a significant impact on the<br />
premium change figures for the year.<br />
2008 renewal premium distribution by quarter*<br />
*Based on known 2007 premium renewal information for accounts with an AFV in excess of $100m.<br />
2006 Premium<br />
US$ m<br />
January 10.1% 22.0% 15.29<br />
February -1.7% 5.3% 13.84<br />
March 9.6% -7.5% 32.59<br />
Q1 Summary 5.8% 1.8% 61.7<br />
April 10.3% 13.6% 145.23<br />
May 8.8% 12.9% 53.82<br />
June 4.33% 8.3% 45.75<br />
Q2 Summary 9.4% 12.8% 244.8<br />
July 8.5% 6.5% 224.22<br />
August 2.4% 15.5% 30.96<br />
September 40.4% 27.7% 34.08<br />
Q3 Summary 6.3% 10.6% 289.3<br />
October 13.1% 13.2% 57.92<br />
November 14.0% 14.2% 331.37<br />
December 5.4% 7.1% 832.62<br />
Q4 Summary 7.8% 8.2% 1,221.9<br />
Year to Date 8.8% 10.0% 1,817.7<br />
December<br />
45.1%<br />
1st Quarter<br />
2.8%<br />
November<br />
17.8%<br />
2nd Quarter<br />
12.9%<br />
3rd Quarter<br />
17.8%<br />
October<br />
3.6%<br />
2007 Premium<br />
US$ m<br />
12.66<br />
10.78<br />
26.75<br />
50.2<br />
119.64<br />
44.03<br />
38.51<br />
202.2<br />
186.80<br />
31.77<br />
36.09<br />
254.7<br />
53.17<br />
303.51<br />
744.67<br />
1,101.4<br />
1,608.4<br />
On a like-for-like basis, the hull premium for December totalled US$200m, a<br />
7.2% reduction. Total AFV increased by US$15.8bn or 5.4% and totalled<br />
US$307bn. Total liability premium for the month totalled US$545m, a reduction of<br />
11%. Passenger numbers totalled 1.34bn, an increase of 7%.<br />
Differentials between lead and following market terms continued to narrow during<br />
December, in fact, we understand from market sources it is believed that some<br />
following markets on certain programmes attained higher premium levels than<br />
those of the leader. This has resulted in the overall composite premium reduction<br />
being less than the headline lead figures that we track and show in this<br />
newsletter.<br />
Based on our selection criteria* total GROSS LEAD premium for 2007 is<br />
US$1,608m. This equates to an 11.5% or US$209m reduction in premium to the<br />
market when compared with the US$1,818m of 2006.<br />
We estimate that the GROSS COMPOSITE 2007 premium level is in the region<br />
of US$1,480m compared with US$1,600m in 2006, a reduction of 7.5%. This is<br />
a smaller reduction than the headline lead figure and is a consequence of the<br />
differentials closing in the second half of the year.<br />
Forthcoming Renewals<br />
US$ Premium<br />
Change<br />
Premium %<br />
Change<br />
-2.6 -17.2%<br />
-3.1 -22.1%<br />
-5.8 -17.9%<br />
-11.5 -18.7%<br />
-25.6 -17.6%<br />
-9.8 -18.2%<br />
-7.2 -15.8%<br />
-25.6 -17.4%<br />
-37.4 -16.7%<br />
0.8 2.6%<br />
2.0 5.9%<br />
-34.6 -12.0%<br />
-4.8 -8.2%<br />
-27.9 -8.4%<br />
-87.9 -10.6%<br />
-120.6 -9.9%<br />
-209.3 -11.5%<br />
Willis believes that in 2008 insurers will be looking to stabilise premium levels on<br />
renewals. This may restrict the level of reductions negotiated compared with those<br />
previously available. It is likely that underwriters will become increasingly<br />
selective in their underwriting, with those programmes with a good profile, good<br />
historic loss records and significant exposure growth receiving more favourable<br />
treatment in terms of rating. This is of course dependent on the level of losses<br />
during 2008.<br />
Additionally, market indications are that many insurers believe hull rating levels<br />
have fallen to a point that are not realistic, especially considering the level of hull<br />
losses in 2007 (US$709m). These have an immediate impact on insurers as these<br />
losses are paid immediately after any incident, before the majority of premiums<br />
have been paid, and it is likely that insurers will attempt to increase hull rates. The<br />
ongoing closing of differentials seen during the fourth quarter between leaders and<br />
following markets rates will continue.
Airline Hull and Liability<br />
Another factor that may influence rating levels is the worldwide economic environment, this may affect the level of passengers being carried, which in turn may reduce<br />
the level of premium generated by the 2007 year of account renewals when they are adjusted.<br />
All these factors are likely to lead to premium income becoming more evenly spread by the end of 2009, as there are a significant number of programmes which have<br />
options to extend their 2007 policies; we believe these options are more likely to be used in the anticipated market environment during 2008.<br />
January<br />
The months of December and January illustrate the extremes<br />
in renewal activity, with 51 renewals in December and only 3<br />
risks are expected to renew in January (that meet our<br />
selection criteria*). In 2007, January accounted for less than<br />
1% of the year’s income.<br />
We also believe that although the recent British Airways<br />
incident has had no immediate effect on underwriters’ attitudes<br />
to rating at this moment in time, it has acted as a reminder to<br />
the levels of risks to which they are exposed.<br />
Insured<br />
First Quarter<br />
Country Insured Country<br />
Air Nostrum Spain Iranair Iran<br />
Airlinair France Izmir Airlines Turkey<br />
Bangkok Airways Thailand KD Avia Russia<br />
Blue Wings Germany Skynet Asia Airways Japan<br />
Eos USA Sudan Airways Sudan<br />
Free Bird Airlines Turkey Tradewinds USA<br />
Inter Ekspres Turkey Varig Log Brasil<br />
Hull War<br />
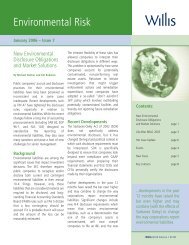
Unsurprisingly the renewal pattern for Hull War business closely follows that of the Hull & Liability renewal calendar, with the result that the majority of business renews<br />
in the fourth quarter. Rate reductions continued to be negotiated throughout the year, the gross average Hull War premium percentage reduction for the year was 13.6%.<br />
There were large differences in the level of reduction/increase seen each month, this is caused by the number of renewals and the area of domicile of carriers renewing<br />
in the month, some months see a very small number of renewals.<br />
We believe that the gross premium for 2007 was around US$105m, this is below the value of a single wide-bodied aircraft. These figures are lead terms and significant<br />
verticalisation takes place between lead and following markets which further reduces premium levels for many insurers. It should also be remembered that nearly all<br />
US carriers do not purchase this coverage in the commercial markets again reducing the volume of premium available. The five year technical surplus for 2002-2007<br />
stands at +US$676m. The Hull War market is extremely loss sensitive and it is likely that any significant war or terrorist related loss would result in an immediate<br />
reaction in terms of pricing.<br />
World Wide Airline Hull War Premium & Claims - 2003 – 2007 (Gross US$ m)<br />
200<br />
180<br />
160<br />
140<br />
120<br />
100<br />
80<br />
60<br />
40<br />
20<br />
0<br />
However, we would advise caution when looking at the percentage change figures during the first 3<br />
months of 2008; as with around 15 renewals meeting our selection criteria* it is very easy for one<br />
major renewal in a month or in the quarter to distort the figures. Just over US$50m in premium or<br />
3.1% of the year’s premium was generated during the 1 st quarter of 2007. This figure will show a further<br />
reduction in 2008 as two of the quarters larger renewals (Vietnam Airlines & MyTravel) no longer<br />
renew in this period.<br />
The level of renewal activity increases substantially in April (as can be seen in the following table). This<br />
will be the first time in 2008 when the size and number of renewals will offer some guidance as to<br />
insurer’s future intensions for the remainder of 2008. With British Airways renewing, it will also give an<br />
indication of how underwriters will treat major renewals and those accounts that have suffered<br />
significant losses in their expiring periods of <strong>insurance</strong>.<br />
April Renewal<br />
Insured Country Insured Country<br />
Air Astana Kazakhstan Jet Airways India<br />
Air Berlin Germany Kingfisher Airlines India<br />
Air Plus Comet Spain Meridiana Group Italy<br />
Air Mauritius Mauritius Royal Brunei Airlines Brunei<br />
British Airways UK Spicejet India<br />
Hainan Airlines China<br />
Premium* Claims Loss Ratio<br />
Programmes with an AFV in excess of US$500m<br />
03 04 05 06 07<br />
Prem ium * 185 155 142.5 120 105<br />
Claims 20 0 0 11.5 0<br />
Loss Ratio 10.50% 0% 0% 10% 0%<br />
2006 loss arises from a the GOL/Excel Aire loss where aircraft is impounded in Brazil. It is currently subject to 50/50 settlement whilst negotiations continue. 2002 and onward premium excludes US domiciled airlines which took Homeland Security<br />
cover. *Premium includes all known airlines, and is based on Gross London Lead Terms. Data shown above is for all airlines and is an estimated based on information known to date; it is subject to change if more information becomes available.<br />
12%<br />
10%<br />
8%<br />
6%<br />
4%<br />
2%<br />
0%
Losses<br />
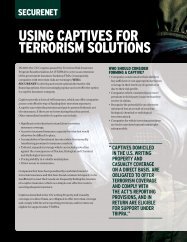
Airline losses for 2007 were US$1,710m, including an estimate of US$425m in respect of attritional losses. We believe the Gross LEAD total income for ALL airline<br />
risks is US$1,830m. (This includes risks with an AFV less than US$100m and an allowance for those risks that we are not aware of). This equates to a loss ratio of<br />
92% or a technical surplus (before expenses and re<strong>insurance</strong> costs are taken into account) of just US$120m compared to US$747m in 2006. If expenses and<br />
re<strong>insurance</strong> costs (which we estimate to be in the region of US$550m) are taken into account then a deficit of around US$430m (based on lead terms) has been<br />
generated in 2007, with the situation being even worse for insurers that do not underwrite risks at lead terms.<br />
World Wide Airline Hull & Liability Premium & Claims - 2003 – 2007 (Gross US$m)<br />
$3,500<br />
$3,000<br />
$2,500<br />
$2,000<br />
$1,500<br />
$1,000<br />
$500<br />
$0<br />
Premium* Claims** Loss Ratio<br />
Premium* $3,100 $2,700 $2,550 $2,080 $1,830<br />
Claims** $924 $994 $1,157 $1,333 $1,710<br />
Loss Ratio 30.8% 36.8% 45.4% 64.1% 93.4%<br />
Est Att Losses $375 $375 $400 $400 $425<br />
Recent incidents that may result in significant reserves are detailed below.<br />
2007<br />
03 04 05 06 07<br />
16th December 2007- Air Wisconsin, Bombardier CRJ-200LR, N470ZW, Providence Green Airport, USA. The aircraft experienced a hard landing before it ran off<br />
the runway and into a snow bank, causing damage to the port wing and possibly its port main undercarriage. None of the 31 passengers and 3 crew sustained serious<br />
injury.<br />
30th December 2007 - Tarom, Boeing 737-300, YR-BGC, Bucharest International Airport, Romania. The aircraft hit a car with its left engine during take off run<br />
before running off the side of the runway and coming to rest with severed undercarriage. The car was checking runway lighting as visibility was poor due to thick fog. All<br />
of the 6 crew and 117 passengers were safely evacuated without serious injury.<br />
2008<br />
5 Year Totals (2003-2007)<br />
Premium: US$12,260m<br />
Claims (inc attritional): US$6.118m<br />
Profit to the market: US$6,142m<br />
Loss Ratio: 49.9%<br />
*Premium includes all known airlines and an estimate for untracked airlines, and is based on Gross London Lead Terms.; it is subject to change as more information becomes available - **Including attritronal losses<br />
2nd January 2008 - Asian Spirit, NAMC YS-11, RP-C3592, Masbate Airport, Philippines. The aircraft sustained substantial damage when it struck a wall<br />
following an overrun in strong gusty winds. None of the 4 crew and 43 passengers sustained injury.<br />
2nd January 2008 - Iran Air, Fokker 100, EP-IDB, Tehran Mehrabad International Airport, Iran. The aircraft overran the runway after suffering a reported engine<br />
failure on take off. Its undercarriage collapsed before it came to rest on a military ramp where all six crew and 53 passengers were safely evacuated. A fire broke out on<br />
the left side of the aircraft which then spread quickly gutting the aircraft.<br />
4th January 2008 - Transaven, Let 410, YV-2081, Caribbean Sea. The aircraft ditched into the Caribbean Sea approximately 64 miles from Caracas International<br />
Airport after suffering a double engine failure killing all 14 passengers and crew onboard.<br />
17th January 2008 - British Airways, Boeing 777-200ER, G-YMMM, London Heathrow International Airport, United Kingdom. The aircraft landed short of the<br />
runway threshold following a reported loss of power in both engines. All 136 passengers and 16 crew survived the accident and were evacuated from the aircraft without<br />
serious injury.<br />
19th January 2008 - Gira Globo, Beech 200 Super King Air, D2-FFK, near Huambo, Angola. The aircraft was destroyed when it flew into a mountain killing all 12<br />
passengers and crew onboard.<br />
28th January 2008 - Aires Colombia, Bombardier Dash-8-200, HK-3997, Bogota International Airport, Colombia. On landing in darkness, the aircraft suffered a<br />
collapse of its left main gear resulting in a sharp drift to the left. The aircraft came to rest on the grass with substantial damage. A number of passengers sustained injuries.<br />
90%<br />
80%<br />
70%<br />
60%<br />
50%<br />
40%<br />
30%<br />
20%<br />
10%<br />
0%
AFV Banding Review - 2007 Renewals<br />
We have also reviewed the treatment of renewals falling into AFV bands.<br />
AFV in excess of US$20,000m<br />
AFV %<br />
Change<br />
As would be expected, this banding sees the smallest number of renewals (6), but sees the largest volume of AFV, which totalled<br />
US$208,663m or 32.5% (34.4% in 2006) of the world’s fleet. Passengers totalled 748.8m, or 30.5% (25% in 2006) of the world’s<br />
total, an increase of 11.6%. They generated US$385.8m in premium, a reduction of 9.8% or 24.3% of the total premium.<br />
AFV between US$10,000m & US$20,000m<br />
This banding generated AFV of US$194,357m or 30.2% (24.6% in 2006) of the world’s fleet, an increase of 4.2%. Passengers<br />
totalled 737.3m, or 30.1% (27.3%) of the total, an increase of 5.3%. US$370.1m in premium or 23.3% of the total was<br />
produced; this was a reduction of 17% in premium.<br />
AFV between US$5,000m & US$10,000m<br />
This banding saw AFV of US$85,653m or 13.3% of the world’s fleet, an increase of 7.9% on 2006’s figure. Passengers<br />
totalled 259.2m an increase of 3% or 10.6% of the total. The banding generated US$174.8m in premium or 11% (unchanged)<br />
of the total premium, a reduction in premium of 17.4%, which was the highest level of percentage reduction seen in any<br />
banding for the second year running.<br />
AFV between US$1,000m & US$5,000m<br />
PAX %<br />
Change<br />
2006 Premium<br />
US$ m<br />
Greater than US$20bn 10.7% 11.6% 427.7<br />
Between US$10bn & US$20bn 4.2% 5.3% 445.7<br />
Between US$5bn & US$10bn 7.9% 3.0% 211.5<br />
Between US$1bn & US$5bn 14.0% 14.9% 409.7<br />
Between US$500m & US$1bn 16.0% 20.1% 108.5<br />
Between US$100m & US$500m 3.6% 6.4% 199.7<br />
2007 Premium<br />
US$ m<br />
Premium<br />
Change US$ m<br />
Premium %<br />
Change<br />
This banding generated AFV of US$116,188m or 18.1% (20.3% in 2006) of the world’s fleet, an increase of 14%. Passengers<br />
totalled 516.8m or 21.1% (24.9%) of the total, an increase of 14.9%. This banding generated US$375.4m in premium, a<br />
reduction of 8.4% or 23.6% (25%) of the total premium.<br />
385.8<br />
370.1<br />
174.8<br />
375.4<br />
97.6<br />
186.1<br />
-41.9 -9.8%<br />
-75.6 -17.0%<br />
-36.7 -17.4%<br />
-34.3 -8.4%<br />
-10.9 -10.0%<br />
-13.6 -6.8%<br />
AFV between US$500m &<br />
US$1,000m<br />
This banding generated AFV of<br />
US$18,946m or 2.9% (3.6% in 2006)<br />
of the world’s total AFV, an increase of<br />
16%. Passengers totalled 95.5m or<br />
3.9% (4.4%) of the total, an increase<br />
of 20.1%, generating US$97.6m in<br />
premium or 6.1% of the total premium,<br />
this figure is a reduction of 10.0% on<br />
2006’s premium figure.<br />
AFV between US$100m &<br />
US$500m<br />
This banding sees the greatest level of<br />
activity with 76 renewals, but only<br />
generated AFV of US$18,741m or<br />
2.9% (3.7% in 2006) of the world’s<br />
fleet, a 3.6% increase. Passengers<br />
totalled 94.3m or 3.8% (6.4%) of the<br />
total, an increase of 6.4%. It generated<br />
US$186.1m in premium, a reduction of<br />
6.8% or 11.7% (13%) of the total<br />
premium.
Regional Review - 2007 Renewals (AFV above US$100m)<br />
Africa<br />
The region’s AFV totalled<br />
US$10,085m or 1.6% of the world’s<br />
fleet. This was an increase of 0.2%,<br />
the smallest increase in the sample.<br />
Passengers totalled 27.7m, or 1.1%<br />
of the world total, an increase of<br />
9.7%. It generated US$52.1m in<br />
premium or 3.3% of the total and is<br />
the smallest area of the world in terms<br />
of premium generation. It saw a<br />
premium reduction of 9%.<br />
Asia Pacific (Including<br />
Austral<strong>asia</strong>)<br />
Total AFV was US$179,462m or<br />
27.9% (29.9% in 2006) of the world’s<br />
fleet, an increase of 8.4%. Passengers<br />
totalled 582.7m, or 23.6% (24.8%) of<br />
the total, an increase of 12.2%. The<br />
region generated US$397.9m in<br />
premium or 25% (25.5%) of the<br />
premium, a reduction of 14.3%.<br />
Europe<br />
AFV totalled US$190,924m or 29.7%<br />
(27.3% in 2006) of the world’s fleet, an<br />
increase of 12.7%. This now makes<br />
the region the largest in terms of AFV<br />
replacing the Asia Pacific region.<br />
Passengers totalled 780.4m, or 31.6%<br />
(30.3%) of the total, an increase of<br />
10.8%. The region produced US$472m<br />
in premium or 29.6% (28.7%) of the<br />
total and continues to produce the<br />
largest share of the sample. This was a<br />
premium reduction of 10.3%.<br />
News<br />
New study shows a decline in the number of accidents caused by pilot error<br />
Airline accidents due to pilot error declined significantly between 1983 and 2002, according to new US research. The overall rate of US airline mishaps remained stable<br />
during that time, however, the proportion involving pilot error reduced 40%. Researchers also demonstrated that there was a 71% reduction in the rate of mishaps related<br />
to poor decision-making by pilots, the decline was linked to better training and technological advances. The study is published in the January 2008 edition of Aviation,<br />
Space and Environmental Medicine.<br />
Lead author Susan Baker says the study investigated 558 crashes and other accidents involving US domestic air carriers on scheduled and unscheduled flights. They<br />
were drawn from the National Transportation Safety Board database of accidents and incidents involving fatalities and injuries in the air as well as on the ground. Pilot<br />
error attributed to a crash in 180 - 32% - of the 558 mishaps studied, but declined from 42% from 1983-1987 to 36% in 1988-1992 period and 31% in 1993-1997 and<br />
25% in 1998-2002. The results show the rate per 10m departures for mishaps involving pilot error declined from 14.2 for 1983-1987 to 8.5 for 1998-2002.<br />
According to the study, the most common types of pilot error were carelessness (26%), poor decisions (25%), mishandling aircraft kinetics (21%) and poor crew<br />
interaction (11%). “Much of the decrease in pilot-error mishaps was associated with improved decision-making by pilots”, says the study. Weather-related mishaps<br />
involving pilot error dropped 76% from the period 1983-1987 to 1998-2002 and accidents caused by mishandling wind or runway conditions fell 78%. Pilot error did not<br />
occur often during taxiing, take-off, final approach or landing and mishaps during take-off declined 70%.<br />
Source - Flight International<br />
Indian Sub-Continent<br />
AFV %<br />
Change<br />
PAX %<br />
Change<br />
2006 Premium<br />
US$ m<br />
Africa 0.2% 9.7% 57.2<br />
Asia Pacific (including Austral<strong>asia</strong>) 8.4% 12.2% 464.6<br />
Europe 12.7% 10.8% 526.4<br />
Indian Sub-Continent 42.6% 13.0% 54.8<br />
Middle East 11.7% 1.9% 80.4<br />
N.America 2.5% 4.5% 532.2<br />
S.America & Caribbean 19.4% 21.8% 78.6<br />
2007 Premium<br />
US$ m<br />
Premium<br />
Change US$ m<br />
Premium %<br />
Change<br />
AFV totalled US$13,184m or 2.1% of the world’s fleet, an increase of 42.6%. For the second year running, this is the largest<br />
percentage increase in the sample. Passengers totalled 48.2m, or 2% of the total, an increase of 13%. This is the second<br />
largest percentage increase in passenger numbers after South America. The region generated US$54.8m in premium<br />
unchanged on 2006 or 3.4% (4%) of the premium.<br />
Middle East<br />
52.1<br />
397.9<br />
472.0<br />
54.8<br />
77.7<br />
463.5<br />
76.3<br />
-5.1 -8.9%<br />
-66.7 -14.4%<br />
-54.4 -10.3%<br />
0.0 0.0%<br />
-2.7 -3.4%<br />
-68.7 -12.9%<br />
-2.3 -2.9%<br />
Total AFV was US$45,044m or 7% (7.3% in 2006) of the world’s fleet, an increase of 11.7%. Passengers totalled 91.2m, or<br />
3.7% of the total, an increase of 1.9%. The region generated US$77.7m in premium or 4.9% (5.1%) of the total premium, a<br />
reduction of 3.4%.<br />
North America<br />
AFV totalled US$183,240m or 28.5% (27.8% in 2006) of the world’s fleet, an increase of 2.5%. Passengers totalled 836.1m,<br />
or 33.9% (31%) of the total, an increase of 4.5%. The region generated US$463.5m in premium or 29.1% of total premium, a<br />
reduction of 12.9%. It should be remembered that the US airlines do not purchase AVN52 coverage in the commercial<br />
markets.<br />
South America & Caribbean<br />
Total AFV was US$20,754m or 3.2% (3.1% in 2006) of the world’s fleet, an increase of 19.4%. Passengers totalled 102.6m,<br />
or 4.2% of the total, an increase of 21.8%. For the second year in succession this is the largest percentage increase in the<br />
sample. The region generated US$76.3m in premium or 4.8% (5%) of the premium, a reduction of 2.9% It should be<br />
remembered that the Lan Group has not been included in this sample as it renews as part of the British Airways programme.
News<br />
IATA targets 60 airports for ground handling audits in 2008<br />
IATA plans to launch a standardized audit for ground handing companies starting in mid-April 2008, reviewing ground operations at as many as 60 airports by the end of<br />
2008.<br />
The IATA safety audit for ground operations (ISAGO) shall follow a 2- to 3-day<br />
review format and will cover 11 categories, including airside management and<br />
safety, load control, passenger and baggage handling and aircraft fuelling.<br />
Some airlines already audit their ground handling companies however each audit<br />
is different and there is no data-sharing between airlines or companies.<br />
Mike O’Brien, IATA’s director of program implementation and auditing says that<br />
“some of the larger ground-handling companies have full-time staff just to receive<br />
the audits.” Therefore by pooling airline-employed auditors and working to an<br />
individual standard, large airlines will likely be able to reduce their auditing staff.<br />
This would allow carriers and ground handling companies place these employees<br />
into “more productive roles,” O’Brien says.<br />
FAA takes heat from US legislators over staffing levels<br />
The last-minute funding bill that the US Congress passed to keep the government running while Senators and Members of the House are on holidays contained<br />
some guidance for the FAA on labour and staffing issues. In their report to accompany the bill, the appropriators told the agency that it “expects the (FAA) Administrator<br />
to work aggressively to resolve the controller’s contract immediately.” The words are not legally binding however they send a strong signal to the agency about<br />
the mood and intent of Congress.<br />
The bill does include a binding requirement for the FAA to submit an annual controller work-force plan by March 31 every year. Previous law required annual<br />
updates but the FAA has been as late for two years in completing the plan. The rapidly increasing volume of air-traffic controller retirements and staff attrition has been<br />
a major concern over the past year. The bill also requires timely reports from the FAA on its plans for hiring <strong>aviation</strong>-safety inspectors. For both the traffic-controller<br />
and safety-inspector workface-reports, the FAA would in effect be fined for each day the reports are late. The fines are in the form of smaller appropriations after<br />
March 31, 2008.<br />
Source: Air Transport Intelligence news<br />
CAE to expand AirAsia’s pilot<br />
academy<br />
Canada’s CAE is installing two more flight simulators in the<br />
AirAsia training academy in Malaysia.<br />
CAE group president of innovation, civil training and<br />
services, Jeff Roberts, says that the company will be<br />
installing an Airbus A330 and an additional Airbus A320<br />
simulator at the AirAsia Academy. The academy is situated<br />
near Kuala Lumpur International Airport’s Low Cost Carrier<br />
Terminal.<br />
Currently the academy has two A320 simulators and one<br />
Boeing 737 simulator. Roberts was speaking to ATI from the<br />
academy where he attended a ceremony yesterday to<br />
announce that CAE has selected Kuala Lumpur as its<br />
Southeast Asia base.<br />
In November CAE announced it would take control of the<br />
Malaysian budget carrier’s type rating training organisation<br />
(TRTO) in 2008. He also says CAE will offer multi-crew<br />
pilot licence (MPL) courses however the timeframe on this<br />
will depend on Malaysia’s civil <strong>aviation</strong> regulators which<br />
are now formulating guidelines for MPL courses.<br />
Source - Air Transport Intelligence news<br />
Once an IASGO audit is performed for one ground handler’s operation at a<br />
particular airport, any airline working with that company will have access to the<br />
data. Audits will first be performed on an annual basis although the period could<br />
be adjusted according to the company’s performance. Airlines will fund the<br />
investigations; however the fee amount has not been determined.<br />
Airport authorities have also suggested that ground handling companies will<br />
require a successful audit as a prerequisite for operating at the facility.<br />
Results from pilot programs show that the standards were good, though some<br />
changes will be necessary given that in some cases there was uncertainty<br />
regarding what was meant by audit questions.<br />
Source: Air Transport Intelligence news<br />
Fatal airline accidents hit an all-time low in 2007<br />
Global figures for commercial <strong>aviation</strong> crashes in 2007 show a record time low of 23 fatal accidents,<br />
and even the number of fatal casualties, at 597 was well below the annual average for the last ten<br />
years. The decade 1998-2007 showed an average of 34.5 fatal accidents a year and 846.3 fatalities.<br />
The worst accident of the year killed 187 on board and 12 on the ground.<br />
Indonesia saw two of the year’s worst fatal accidents involving passenger jets – a Boeing 737-400<br />
and a Garuda 737-400.<br />
Source – Flight International<br />
GIC of India’s new London based branch - General Insurance Corporation (GIC)<br />
India has recently opened a new branch on London’s Fenchurch Street, from where they will now be<br />
underwriting certain geographical areas, including the Caribbean, Mexico and Brazil. The classes of<br />
Re<strong>insurance</strong> business they will deal in (both Facultative and Treaty) are Non-Marine Property, Energy<br />
and Aviation. Their capacities for Treaty Re<strong>insurance</strong> is £250,000 for Aviation and for Facultative<br />
Re<strong>insurance</strong> it is £2,500,000 for any one hull and £15,000,000 for any one liability occurrence.<br />
Charles Taylor <strong>aviation</strong> - Rob Mellor has joined as a Liability Claims adjuster.<br />
Global_Aviation_Bulletin@<strong>willis</strong>.com<br />
Rebecca Green +44 20 7860 9283 greenrq@<strong>willis</strong>.com<br />
Mary Hunt +44 20 7488 9365 huntma@<strong>willis</strong>.com<br />
Gemma Li +44 20 7860 9055 lig@<strong>willis</strong>.com<br />
Steve Lodge +44 20 7860 9156 lodges@<strong>willis</strong>.com<br />
Sham Mahabir +44 20 7488 8128 mahabirs@<strong>willis</strong>.com<br />
Brad Ottolangui +44 20 7488 8122 ottolanguibg@<strong>willis</strong>.com<br />
Paul Wrenn +44 20 7488 9160 wrennp@<strong>willis</strong>.com