Design specific variation in pattern transfer by via/contact etch ...
Design specific variation in pattern transfer by via/contact etch ...
Design specific variation in pattern transfer by via/contact etch ...

You also want an ePaper? Increase the reach of your titles
YUMPU automatically turns print PDFs into web optimized ePapers that Google loves.
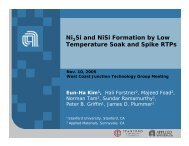
<strong>Design</strong> <strong>Design</strong> <strong>Design</strong> <strong>specific</strong> <strong>specific</strong> <strong>variation</strong> <strong>variation</strong> <strong>variation</strong> <strong>in</strong><br />
<strong>in</strong><br />
<strong>pattern</strong> <strong>pattern</strong> <strong>transfer</strong> <strong>transfer</strong> <strong>by</strong> <strong>by</strong> <strong>via</strong>/<strong>contact</strong><br />
<strong>via</strong>/<strong>contact</strong><br />
<strong>etch</strong> <strong>etch</strong> process: process: full full-chip full full-chip full chip chip analysis<br />
analysis
� Introduction<br />
Agenda<br />
� Pattern density <strong>variation</strong> <strong>in</strong> die-scale model<strong>in</strong>g<br />
� Microload<strong>in</strong>g and aspect ratio (AR) <strong>in</strong>duced <strong>etch</strong> rate<br />
<strong>variation</strong> – Physics beh<strong>in</strong>d<br />
� Calibration<br />
� Use models<br />
Copyright ©2008, Mentor Graphics.<br />
2
Etch Step <strong>in</strong> Pattern Transfer Simulation Flow<br />
� Etch step is important part of the <strong>pattern</strong> <strong>transfer</strong> technology <strong>in</strong> chip<br />
manufactur<strong>in</strong>g<br />
� While the exist<strong>in</strong>g capabilities of the predictions of post-illum<strong>in</strong>ation and<br />
post-photoresist development contours are <strong>in</strong> l<strong>in</strong>e with the current<br />
requirements, predictions of the post-<strong>etch</strong> contours are not so good.<br />
� Etch process is characterized <strong>by</strong> strong <strong>pattern</strong> density dependency<br />
Optical simulation<br />
Photoresist<br />
simulation<br />
Etch simulation<br />
Pattern Transfer <strong>in</strong> the Case<br />
of Contact Hole Etch<br />
Phot<br />
o<br />
BARC<br />
BARC/ME<br />
BARC/ME/OE<br />
Full Etch<br />
NCCAVS PAG, Sunnyvale,<br />
CA, 2005<br />
By D. Farber, B. Dostalik, B.<br />
Goodl<strong>in</strong>, et al (TI)<br />
It would be quite beneficial for both the design and process development<br />
communities to have a design automation tool capable of analyz<strong>in</strong>g the design<br />
quality regard<strong>in</strong>g the shape distortions (<strong>etch</strong> bias) caused <strong>by</strong> the employed<br />
<strong>etch</strong> recipe and, visa verse, the ability of the developed recipe to handle<br />
<strong>pattern</strong> density <strong>variation</strong> of a design to be manufactured.<br />
Copyright ©2008, Mentor Graphics.<br />
3
Plasma-assisted <strong>etch</strong><br />
� Plasma-assisted <strong>etch</strong> is a sequence<br />
of chemical reactions between<br />
<strong>etch</strong>ed material and plasmagenerated<br />
chemical species<br />
result<strong>in</strong>g<br />
products<br />
generation of volatile<br />
� In order to <strong>in</strong>itiate and susta<strong>in</strong> <strong>etch</strong><br />
process the <strong>etch</strong>ant species should be<br />
cont<strong>in</strong>uously generated and delivered<br />
to those surface segments where the<br />
material removal takes place – the<br />
bottoms of <strong>etch</strong>ed features.<br />
� In order to have a uniform across-chip<br />
<strong>etch</strong> rate, the comb<strong>in</strong>ation of fluxes of<br />
neutrals and ions imp<strong>in</strong>ged the <strong>etch</strong>ed<br />
surface should be a constant.<br />
+<br />
Copyright ©2008, Mentor Graphics.<br />
4
Effects of Aspect Ratio & Microload<strong>in</strong>g<br />
Etch rate <strong>variation</strong> across layout caused<br />
<strong>by</strong>:<br />
� Across-layout <strong>variation</strong> <strong>in</strong> concentration<br />
of neutrals <strong>in</strong> the above-wafer plasma<br />
region - Microload<strong>in</strong>g<br />
� Variation <strong>in</strong> resistance to the <strong>in</strong>terfeature<br />
transport of neutrals - AR<br />
� Variation <strong>in</strong> plasma visibility - AR<br />
Neutrals concentration<br />
across layout<br />
Variation of solid angle of<br />
visibility<br />
Ω Ω<br />
Proc. of SPIE Vol.<br />
6520 65204D-1<br />
� AR <strong>variation</strong>s are responsible for the distortion<br />
<strong>in</strong> <strong>etch</strong> rate, sidewall slope and <strong>etch</strong> depth<br />
developed <strong>in</strong> neighbor<strong>in</strong>g features<br />
� Microload<strong>in</strong>g is responsible for those<br />
distortions developed <strong>in</strong> the identical features<br />
located <strong>in</strong> different neighborhoods<br />
characterized <strong>by</strong> different <strong>pattern</strong> densities<br />
Layout and averaged patter density<br />
Copyright ©2008, Mentor Graphics.<br />
5
PD Dependency <strong>in</strong> Etch Process<strong>in</strong>g - Microload<strong>in</strong>g<br />
� Effect of the <strong>pattern</strong> density on <strong>etch</strong> is characterized<br />
<strong>by</strong> a <strong>specific</strong> correlation length depend<strong>in</strong>g on a<br />
particular process recipe<br />
� The correlation length provides the size of layout area<br />
which effects <strong>etch</strong><strong>in</strong>g of a particular feature<br />
� Correlation length is <strong>in</strong> order of magnitude of the mean<br />
free path of the gas species - λ<br />
C. Hedlund, H. O. Blom, and S.<br />
Berg, “Microload<strong>in</strong>g effect <strong>in</strong><br />
reactive ion <strong>etch</strong><strong>in</strong>g,” J. Vac.<br />
Sci. Technol. A 12, 1962–1965<br />
(1994)<br />
Copyright ©2008, Mentor Graphics.<br />
6
• Neutral radical generation<br />
• Consumption/reflection<br />
• Non-uniform concentration<br />
• Diffusion<br />
Ma<strong>in</strong> Factors of Microload<strong>in</strong>g<br />
Reactive<br />
surface<br />
Wafer<br />
Copyright ©2008, Mentor Graphics.<br />
7
Flux Boundary Condition Surface<br />
Across-die distribution of radical concentration<br />
c<br />
Γ =<br />
8π<br />
surface<br />
Radical Flux at Top of the Feature<br />
λ<br />
π λ<br />
∫ ϕ ∫ ( ϕ )<br />
2<br />
r<br />
d 1 N r1<br />
, 1<br />
r1dr<br />
1<br />
3<br />
0 0 2<br />
r<br />
r<br />
2 r r 2 ( h + r + r1<br />
)<br />
Γ<br />
Y<br />
C<br />
dS2<br />
r<br />
Γi<br />
= 2<br />
πh<br />
Pattern-dependent Flux Consumption<br />
( r)<br />
∫<br />
δδ Ω = s<strong>in</strong> Θ Θδδ<br />
Θ Θδϕ<br />
δϕ<br />
φ 1<br />
r 2 2<br />
Ni<br />
( r)<br />
ci<br />
h<br />
=<br />
4 π<br />
R<br />
r<br />
χ<br />
r<br />
r r r<br />
∫∫<br />
1<br />
πR<br />
dS 1<br />
( r+<br />
r)<br />
ρ(<br />
r,<br />
φ )<br />
1<br />
0 0<br />
Θ<br />
r r 2<br />
r r 12<br />
r r r<br />
r =<br />
r − r<br />
Surface “2”<br />
dS 2<br />
i<br />
i r1dr<br />
1d<br />
1 φ<br />
( χPR(<br />
1−ρ(<br />
r1,<br />
1 φ ) ) + χ ( AR)<br />
ρ(<br />
r1,<br />
1 φ ) )<br />
2 r r2<br />
( h + r1<br />
−r<br />
)<br />
1<br />
1<br />
X<br />
2<br />
dr1<br />
⎡<br />
r 2<br />
⎛r<br />
⎤<br />
1⎞<br />
⎢1+<br />
⎜ ⎟ ⎥<br />
⎢⎣<br />
⎝h⎠<br />
⎥⎦<br />
2<br />
1<br />
2<br />
Surface “1”<br />
Copyright ©2008, Mentor Graphics.<br />
2<br />
8<br />
=
Mass-balance<br />
Differential equation for radical distribution at the<br />
flux-BC surface<br />
• averag<strong>in</strong>g the diffusion equations along the plasma thickness (L),<br />
• us<strong>in</strong>g the flux BC<br />
• and assum<strong>in</strong>g that diffusion is much faster than the gas flow<br />
Flux BC:<br />
Radical fluxes Γ i 0 com<strong>in</strong>g from plasma imp<strong>in</strong>ges a wafer surface. Fluxes imp<strong>in</strong>ged a<br />
PR surface and an <strong>etch</strong>ed feature are consumed with different probabilities: χ i PR<br />
and χ i (χ i is AR dependent parameter).<br />
Density of consumed flux of neutrals, which is the difference of the densities of<br />
<strong>in</strong>com<strong>in</strong>g and reflected fluxes depends on the PD:<br />
Γ<br />
C<br />
dS 2<br />
=<br />
r<br />
Γi<br />
= 2<br />
πh<br />
( r )<br />
N<br />
∫<br />
R<br />
i<br />
r<br />
c<br />
4<br />
( r )<br />
r<br />
χ<br />
i<br />
h<br />
π<br />
r<br />
2 2π<br />
R<br />
∫∫<br />
( r + r ) ρ(<br />
r , φ )<br />
1<br />
0 0<br />
i<br />
i<br />
r1dr<br />
1dφ1<br />
( χ PR ( 1−<br />
ρ(<br />
r1<br />
, φ1)<br />
) + χ ( AR)<br />
ρ(<br />
r1<br />
, φ1)<br />
)<br />
2 r r 2 ( h + r1<br />
− r )<br />
1<br />
1<br />
2<br />
dr1<br />
⎡<br />
r 2<br />
⎛ r ⎤<br />
1 ⎞<br />
⎢1<br />
+ ⎜ ⎟ ⎥<br />
⎢⎣<br />
⎝ h ⎠ ⎥⎦<br />
2<br />
2<br />
=<br />
( r,<br />
φ)<br />
2<br />
2<br />
⎪⎧<br />
⎡∂<br />
n<br />
⎤⎪⎫<br />
i 1 ∂ ni<br />
1 ∂ni<br />
nicF<br />
0 = D⎨⎢<br />
+ ⋅ + ⋅ −<br />
2 2 2 ⎥⎬<br />
⎪⎩ ⎣ ∂r<br />
r ∂φ<br />
r ∂r<br />
⎦⎪⎭<br />
4L<br />
2 r<br />
r r r r d r ′<br />
F(<br />
r,<br />
φ)<br />
= ∫ ˆ χ(<br />
r ′ + r ) ρ(<br />
r ′ + r ) r 2<br />
2<br />
⎛ r ′ ⎞<br />
⎜<br />
⎜1+<br />
⎟ 2<br />
⎝ h ⎠<br />
+ γ − kV<br />
n<br />
r ⎧χ<br />
⎫<br />
ˆ χ(<br />
r ′ ) = ⎨ ⎬<br />
⎩χ<br />
PR ⎭ Stenger, AIChE Journal, 33, 1187-1190 (1987)<br />
Y<br />
φ 1<br />
r r 1<br />
dS 1<br />
X<br />
Θ<br />
r r δδ Ω = s<strong>in</strong> Θ Θδδ<br />
Θ Θδϕ<br />
δϕ<br />
2<br />
r r r<br />
12<br />
r r r<br />
r = r − r<br />
1<br />
Surface “2”<br />
dS 2<br />
Surface “1”<br />
Copyright ©2008, Mentor Graphics.<br />
2<br />
9<br />
i
Mass-balance<br />
Differential equation for across-die distribution of<br />
the radicals<br />
Due to complex character of dependency of the <strong>in</strong>troduced<br />
parameters on the plasma recipe as well as the difference <strong>in</strong><br />
generation rates of different radicals it is reasonable to <strong>in</strong>troduce a<br />
dimensionless form for radical concentration:<br />
This transformation leads to the dimensionless form of the mass<br />
balance equation:<br />
2<br />
γ<br />
⎛ γλ ⎞ cn0<br />
n0<br />
= andθ<br />
0 = n0<br />
/ =<br />
Here:<br />
k<br />
⎜<br />
V<br />
D ⎟<br />
⎝ ⎠ 3γλ<br />
Solution of these mass balance equations generates across-die<br />
distributions of concentrations of all radicals participat<strong>in</strong>g <strong>in</strong> <strong>etch</strong><br />
reactions. Gas-k<strong>in</strong>etic properties of radicals (D, λ, c) are calculated<br />
based on Chapman-Enskog k<strong>in</strong>etic theory.<br />
Approximate solution of the mass-balance equation<br />
clearly demonstrates that an across-die distribution<br />
of radicals is characterized <strong>by</strong> a complex PD<br />
dependency, more complicated than the<br />
“traditional” reverse PD: 1/PD.<br />
n<br />
θ =<br />
2 ⎛ γλ ⎞<br />
⎜<br />
⎟<br />
⎝ D ⎠<br />
r ⎡ 1 3 λ r ⎤ r<br />
1−θ<br />
( r)<br />
⎢ + F ⎥ r<br />
⎣θ0<br />
4 L ⎦<br />
2 ( r ) + λ ∆θ<br />
( ) = 0<br />
Approximate solution<br />
2 ⎡ 1 3 λ r ⎤<br />
1−<br />
λ ∆⎢<br />
+ F(<br />
r ) ⎥⎦<br />
r<br />
≈<br />
⎣θ0<br />
4 L<br />
θ ( r )<br />
⎣θ0<br />
4 L<br />
θ ( r ) ≈<br />
⎦<br />
⎡ 1 3 λ r ⎤<br />
⎢ + F(<br />
r ) ⎥⎦<br />
⎣θ0<br />
4 L<br />
F = ∫<br />
r r r r<br />
PD – GDSII<br />
2r<br />
d r′<br />
r 2 ⎛ r′<br />
⎞<br />
⎜1+<br />
⎟ 2<br />
⎝ h ⎠<br />
( r,<br />
φ)<br />
ˆ χ(<br />
r′<br />
+ r ) ρ(<br />
r′<br />
+ r ) 2<br />
Stick<strong>in</strong>g<br />
coefficients<br />
Visibility factor<br />
Copyright ©2008, Mentor Graphics.<br />
10
Radical Flux to the Feature<br />
� When a radical distribution across “effective<br />
reactive” surface is known we can determ<strong>in</strong>e a flux<br />
com<strong>in</strong>g to the feature from a small area of the<br />
“effective reactive” surface and to <strong>in</strong>tegrate it<br />
through the all area of visibility.<br />
λ<br />
π λ<br />
∫ ϕ ∫ ( ϕ )<br />
2<br />
r<br />
d 1 N r1<br />
, 1<br />
r1dr<br />
1<br />
3<br />
0 0 2<br />
c<br />
Γ =<br />
8π<br />
r<br />
r<br />
2 r r 2 ( h + r + r1<br />
)<br />
Output of the Microload<strong>in</strong>g Analysis<br />
Consumption<br />
Flux<br />
Copyright ©2008, Mentor Graphics.<br />
11
Intra-Feature Radical Transport Resistance<br />
Mechanisms of the neutrals transport <strong>in</strong>side a feature:<br />
• The “l<strong>in</strong>e-of-sight” – reagents are disappeared after first collision with wall<br />
• “Knudsen diffusion” – reagents do not react with walls<br />
For Knudsen diffusion - Claus<strong>in</strong>g factor is the probability that<br />
a randomly directed species <strong>in</strong>cident at the top of a verticalwalled<br />
feature will reach the other end.<br />
For the Claus<strong>in</strong>g factor k we can use :<br />
1<br />
for round <strong>via</strong> of the depth L and radius R k =<br />
1<br />
3 PL<br />
1+<br />
16 S<br />
3 L<br />
1+<br />
8 R<br />
And k = for the rectangular shaped feature of the<br />
perimeter P, area S and the depth L.<br />
CF 2 flux imp<strong>in</strong>ged the <strong>via</strong> bottom<br />
2π<br />
λ<br />
π<br />
c λ<br />
⎛ 2 R<br />
B 1 CF<br />
⎜<br />
2<br />
Γ =<br />
N CF ( r1<br />
, ϕ )<br />
2<br />
2 2<br />
2<br />
3 h<br />
1 k<br />
8π<br />
R ∫∫<br />
⎜ ∫∫<br />
+<br />
0 0 ⎜<br />
D<br />
8 R<br />
⎝<br />
rdrdψ<br />
2 2 2 [ λ + r + r − 2r<br />
r cos(<br />
ϕ −ψ<br />
) ]<br />
⎞<br />
⎟<br />
⎟r1dr<br />
dϕ<br />
⎟<br />
⎠<br />
CF 3 1<br />
0 0<br />
1<br />
1<br />
2<br />
2π<br />
⎝<br />
B cO<br />
( )<br />
( h + λ)<br />
ΓO r,<br />
ψ = ∫ ∫<br />
8π<br />
0<br />
⎛ λ ⎞<br />
R⎜1+<br />
⎟<br />
h ⎠<br />
0<br />
N<br />
O-atom flux imp<strong>in</strong>ged the <strong>via</strong> bottom<br />
O<br />
( r , ϕ)<br />
1<br />
⎡<br />
⎢<br />
⎢⎣<br />
λ<br />
h<br />
ψ<br />
Reactiv<br />
e<br />
surface<br />
r<br />
r<br />
1<br />
θ<br />
Copyright ©2008, Mentor Graphics.<br />
2<br />
r<br />
1<br />
2<br />
( ) ( ) 2<br />
2 2 2⎛<br />
⎞ ⎛ ⎞<br />
h + λ + r + r 1+<br />
+ 2r<br />
r 1+<br />
cos ϕ −ψ<br />
1<br />
⎜<br />
⎝<br />
r dϕdr<br />
1<br />
λ<br />
⎟<br />
h ⎠<br />
1<br />
1<br />
⎜<br />
⎝<br />
ϕ<br />
λ<br />
⎟<br />
h ⎠<br />
12<br />
⎤<br />
⎥<br />
⎥⎦<br />
3
Die-level analysis:<br />
Calculation of distribution of<br />
neutral species participat<strong>in</strong>g <strong>in</strong><br />
<strong>etch</strong> driven reactions at die level –<br />
microload<strong>in</strong>g<br />
Etch Model<strong>in</strong>g Backbone<br />
CD/Contour<br />
Simulation<br />
Eng<strong>in</strong>e – Etch<br />
Model<br />
Feature-level analysis:<br />
Plasma visibility <strong>variation</strong> – plasma<br />
region visible from every segment of<br />
the feature <strong>etch</strong> profile<br />
Etch mechanism<br />
Wafer-scale <strong>variation</strong>s &<br />
process parameters:<br />
Copyright ©2008, Mentor Graphics.<br />
13
Etch Model<br />
� Etch model, represent<strong>in</strong>g mathematical formulation<br />
of <strong>etch</strong> mechanism, provides a relation between<br />
fluxes of all <strong>etch</strong>-important species com<strong>in</strong>g to any<br />
po<strong>in</strong>t at the <strong>etch</strong>ed surface and the <strong>etch</strong> rate at this<br />
po<strong>in</strong>t.<br />
Example of model<strong>in</strong>g SiO 2 Etch <strong>by</strong> Fluorocarbon Plasmas<br />
CF x radical fluxes result <strong>in</strong> SiO 2 <strong>etch</strong> and C xF y polymer deposition<br />
O-atom flux is a major cause of the polymer removal<br />
Precursors for the <strong>etch</strong> reactions are formed at the polymer-SiO2 <strong>in</strong>terface<br />
<strong>by</strong> ion-<strong>in</strong>duced energy reactions: “-Si-O-” + E = “Si-” + “O-”. Energy flux<br />
reach<strong>in</strong>g the <strong>in</strong>terface is controlled <strong>by</strong> the polymer thickness.<br />
Radical reactions between Si- and O- from SiO 2 and F and C from gas<br />
phase and polymer layer are responsible for the silicon oxide <strong>etch</strong><br />
Reaction K<strong>in</strong>etics<br />
x C is the carbon fraction <strong>in</strong> C xF y polymer layer;<br />
θ is the fraction of precursors formed at the SiO 2 -<br />
polymer <strong>in</strong>terface<br />
Η CxFy is the thickness of polymer layer.<br />
Copyright ©2008, Mentor Graphics.<br />
14
Th<strong>in</strong> & Thick Polymer Regimes<br />
T. Tatsumi, M. Matsui, M. Okigawa, and M. Sek<strong>in</strong>e, J. Vac. Sci. Technol. B 18, 1897-1902 (2000)<br />
Th<strong>in</strong> polymer regime<br />
Thick polymer regime<br />
Copyright ©2008, Mentor Graphics.<br />
15
S n<br />
( Z1<br />
+<br />
8<br />
M 2 Z ) 9 ⎝ ⎠<br />
2<br />
( M1<br />
+ M 2 )<br />
Ion energy loss: ∂E<br />
Ion Energy Loss <strong>in</strong> Polymer Layer<br />
Nuclear stopp<strong>in</strong>g power: Electronic stopp<strong>in</strong>g power:<br />
2<br />
1<br />
1<br />
( Z ) 3<br />
3<br />
1Z<br />
⎛<br />
2 M ⎞ 1 4M1M<br />
2 3<br />
= 10.<br />
6<br />
⎜<br />
⎟<br />
2 Se ( E)<br />
( E)<br />
E<br />
� For ion energy loss:<br />
( H )<br />
−<br />
∂x<br />
=<br />
NS<br />
� From Tatsumi -JVST B18, 1897 (2000), µ = 2.97.<br />
�� For E = 1450 eV: E H ≈ E 0 − 0 . 088 H<br />
E<br />
� Etch stop will happen at<br />
the polymer thickness:<br />
H cr<br />
( E )<br />
0<br />
1<br />
3<br />
E0<br />
=<br />
2.<br />
97<br />
,[nm]<br />
n<br />
=<br />
( E)<br />
+ NS (E)<br />
e<br />
1<br />
1<br />
2<br />
15 6 1 2<br />
3. 84 1<br />
⎟<br />
1<br />
⎟<br />
− ⎛ Z Z ⎞⎛<br />
E ⎞<br />
e Z ⎜ ⎟ ⎜<br />
⎝ Z ⎠ M<br />
2<br />
3<br />
2 ⎛ ⎞<br />
⎛ ⎞<br />
⎜ µ ⎟<br />
⎜<br />
3 ⎟<br />
3<br />
≈<br />
⎜<br />
E0<br />
− βE0<br />
H<br />
⎟<br />
≈ E0<br />
− µ E0<br />
H = E0⎜1<br />
− H 1 ⎟<br />
⎝ ⎠<br />
⎜ 3 ⎟<br />
⎝ E0<br />
⎠<br />
( ) ( ) 3<br />
( ) ( )<br />
T. Tatsumi, M. Matsui, M. Okigawa, and M. Sek<strong>in</strong>e, J. Vac.<br />
Sci. Technol. B 18, 1897-1902 (2000)<br />
⎝<br />
Experiment vs. Prediction<br />
⎠<br />
Copyright ©2008, Mentor Graphics.<br />
16
Approximation of “Th<strong>in</strong> Polymer” Layer<br />
� Rate of generation of active precursors on SiO2 surface <strong>by</strong><br />
ions penetrated the adsorbed layer is much higher than the<br />
rate of their disappearance <strong>by</strong> means of <strong>etch</strong> reactions<br />
� Rate of the reaction between silicon and fluor<strong>in</strong>e atoms is<br />
faster than the rate of reactions of polymer formation. ( ) ⎟⎟<br />
M k′<br />
Γ<br />
C D CF2<br />
H ≈<br />
C<br />
ρ S kRΓO<br />
+ k<strong>etch</strong><br />
C ⎛ k ′ Γ ⎞<br />
<strong>etch</strong>k<br />
D CF<br />
≈ Γ ⎜<br />
2<br />
ER K <strong>etch</strong>k<br />
D CF 1− 2 ⎜<br />
C<br />
ηΓi<br />
E0<br />
kRΓO<br />
+ k<strong>etch</strong><br />
Polymer Polymer thickness thickness (nm) (nm)<br />
Polymer thickness (nm)<br />
6<br />
5<br />
4<br />
3<br />
2<br />
1<br />
Exp<br />
Cal<br />
O2=8 cc<br />
0<br />
0 500 1000 1500<br />
6<br />
5<br />
4<br />
3<br />
2<br />
1<br />
Exp<br />
Cal<br />
Ion Energy (eV)<br />
O2=8 cc<br />
0<br />
0.00E+00 1.00E+17 2.00E+17 3.00E+17<br />
CF2 flux (cm-2 s-1)<br />
ER of SiO2 (nm/m<strong>in</strong>)<br />
ER of SiO2 (nm/m<strong>in</strong>)<br />
600<br />
500<br />
400<br />
300<br />
200<br />
100<br />
Exp<br />
Cal<br />
O2=8 cc<br />
0<br />
0 500 1000 1500<br />
600<br />
500<br />
400<br />
300<br />
200<br />
100<br />
Exp<br />
Ion Energy (eV)<br />
O2=8 cc<br />
Cal Tatsumi, T., Hikosaka, Y., Morishita,<br />
S., Matsui, M., and Sek<strong>in</strong>e, M., “Etch<br />
rate control <strong>in</strong> a 27 MHz reactive ion<br />
<strong>etch</strong><strong>in</strong>g system for ultralarge scale<br />
<strong>in</strong>tegrated circuit process<strong>in</strong>g,” J. Vac.<br />
Sci. Technol. A 17, 1562-1569 (1999).<br />
0<br />
0.00E+00 1.00E+17 2.00E+17 3.00E+17<br />
CF2 flux (cm-2 s-1)<br />
⎝<br />
Copyright ©2008, Mentor Graphics.<br />
17<br />
⎠
“Thick Polymer” Approximation<br />
Ion-energy <strong>transfer</strong> through polymer layer is a limit<strong>in</strong>g step <strong>in</strong> SiO 2 <strong>etch</strong> rate<br />
MC<br />
H =<br />
ρS<br />
k<br />
ER = K<br />
<strong>etch</strong><br />
C<br />
<strong>etch</strong><br />
k<br />
Γ<br />
D CF2<br />
⎛ kDΓ<br />
⎜<br />
⎜1−<br />
⎝ ηΓi<br />
E<br />
CF2<br />
⎛ H ⎞<br />
ηΓi<br />
E0⎜1−<br />
⎟ = K<br />
⎝ H * ⎠<br />
0<br />
⎛<br />
⎜<br />
⎜ k Γ k′<br />
Γ<br />
R O D<br />
⎜1−<br />
C<br />
⎞ ⎜ k<strong>etch</strong><br />
ηΓi<br />
E<br />
⎟<br />
⎠<br />
⎜<br />
⎝<br />
<strong>etch</strong><br />
CF2<br />
⎛ kDΓ<br />
⎜<br />
⎜1−<br />
⎝ ηΓi<br />
E<br />
⎛<br />
⎜<br />
⎜ µ MC<br />
ηΓi<br />
E0⎜1−<br />
1<br />
⎜ 3<br />
⎜<br />
E0<br />
ρS<br />
k<br />
⎝<br />
0<br />
1<br />
CF2<br />
C<br />
<strong>etch</strong><br />
0<br />
2<br />
⎞<br />
⎟<br />
⎠<br />
⎞<br />
⎟<br />
⎟<br />
⎟<br />
⎟<br />
⎟<br />
⎠<br />
k′<br />
DΓCF<br />
2<br />
⎛ k′<br />
DΓ<br />
⎜<br />
⎜1−<br />
⎝ ηΓi<br />
E<br />
CF2<br />
0<br />
⎛<br />
⎜<br />
⎜ k Γ k′<br />
Γ<br />
R O D<br />
⎜1−<br />
C<br />
⎞ ⎜ k<strong>etch</strong><br />
ηΓi<br />
E<br />
⎟<br />
⎠<br />
⎜<br />
⎝<br />
CF2<br />
0<br />
1<br />
⎛ k′<br />
DΓ<br />
⎜<br />
⎜1−<br />
⎝ ηΓi<br />
E<br />
Matsui, M., Tatsumi, T. and Sek<strong>in</strong>e, M., “Relationship of <strong>etch</strong> reaction and reactive species flux <strong>in</strong> C4F8/Ar/O2 plasma for SiO2 selective <strong>etch</strong><strong>in</strong>g<br />
over Si and Si3N4,” J. Vac. Sci. Technol. A 19, 2089-2096 (2001).<br />
CF2<br />
0<br />
2<br />
⎞<br />
⎟<br />
⎠<br />
⎞⎞<br />
⎟⎟<br />
⎟⎟<br />
⎟⎟<br />
⎟⎟<br />
⎟⎟<br />
⎠⎠<br />
Copyright ©2008, Mentor Graphics.<br />
18
Etch Stop Condition<br />
� Etch stops when ions lose all their energy while penetrat<strong>in</strong>g the C-F layer. A<br />
condition for the <strong>etch</strong> stop is follows:<br />
k′<br />
D<br />
LE ( Γ )<br />
k<br />
i<br />
R<br />
Γ<br />
O<br />
Γ<br />
CF<br />
2<br />
=<br />
ρS<br />
M<br />
C<br />
� Knowledge of distributions of ion-neutrals fluxes along the <strong>etch</strong>ed surface:<br />
allows to determ<strong>in</strong>e a regions where <strong>etch</strong> is completely stopped<br />
1<br />
3<br />
E0<br />
µ<br />
Γ<br />
( , y),<br />
Γ ( x,<br />
y),<br />
Γ ( x,<br />
y)<br />
2<br />
i<br />
x CF<br />
O<br />
Copyright ©2008, Mentor Graphics.<br />
19
VEB+ - based correlations<br />
x<br />
Normalized Etch Rate<br />
VCE<br />
1.01<br />
1.00<br />
0.99<br />
0.98<br />
0.97<br />
0.96<br />
0.95<br />
0.94<br />
0.93<br />
P=P3 fitt<strong>in</strong>g with theta_0<br />
0.92<br />
VCE4<br />
0 200 400 600 800 1000 1200 1400 1600 1800 2000<br />
1.02<br />
1.00<br />
0.98<br />
0.96<br />
0.94<br />
0.92<br />
Distance x from edge of the large open area [um]<br />
P1=0.005 Torr<br />
P2=0.02<br />
P3=0.05<br />
P4=0.1<br />
VCE1<br />
VCE2<br />
VCE3<br />
y = 1.1734x - 0.1695<br />
R 2 = 0.9262<br />
0.90<br />
0.93 0.94 0.95 0.96 0.97 0.98 0.99 1 1.01<br />
Measurements<br />
VCE1<br />
L<strong>in</strong>ear (VCE1)<br />
Copyright ©2008, Mentor Graphics.<br />
20
VCE Input/Output<br />
Copyright ©2008, Mentor Graphics.<br />
21
Input/output to VCE tool - I<br />
VCE<br />
Input (process <strong>in</strong>fo):<br />
• Etchant radicals<br />
• Flux <strong>variation</strong><br />
• Pressure<br />
• CD <strong>variation</strong><br />
• Wall temperature • Etch rate <strong>variation</strong><br />
• Etch depth var.<br />
Input (layout <strong>in</strong>fo): GDSII<br />
Copyright ©2008, Mentor Graphics.<br />
22
Calculation of Gas K<strong>in</strong>etic Parameters<br />
- Calculation of b<strong>in</strong>ary diffusivities<br />
σ + σ<br />
2<br />
D<br />
ij<br />
T<br />
⎛<br />
⎜<br />
1<br />
⎜<br />
⎝ M<br />
i<br />
= 0.<br />
0018583<br />
2<br />
Pσ<br />
ij<br />
i j A C E G<br />
Here σ ij = Ωij<br />
= + + + and<br />
* B<br />
*<br />
*<br />
*<br />
exp DT exp FT exp HT<br />
3<br />
1<br />
+<br />
M<br />
* T<br />
, T =<br />
( T ) ( ) ( ) ( )<br />
,<br />
ε<br />
Ω<br />
ij<br />
ij<br />
j<br />
⎞<br />
⎟<br />
⎠<br />
ε ij<br />
=<br />
k<br />
B<br />
ε ε i j<br />
k k<br />
A = 1.06036, B = 0.15610, C = 0.193, D = 0.47635, E = 1.03587, F = 1.52996, G = 1.76474, H<br />
= 3.89411. Total gas pressure P <strong>in</strong> [atm], temperature T <strong>in</strong> [K] and cross-section σ σij <strong>in</strong> [A].<br />
Parameters T* and Ω ij are dimensionless. The result<strong>in</strong>g b<strong>in</strong>ary diffusivities D ij are <strong>in</strong> [cm 2 s -1 ].<br />
( 1−<br />
x )<br />
- Effective diffusivity of i-th radical <strong>in</strong> the gas mixture: i D xk is the mole fraction of<br />
i =<br />
the k-th component<br />
xk<br />
= 100<br />
8RT<br />
⎛<br />
⎜<br />
1<br />
π ⎝ M<br />
1<br />
+<br />
M<br />
∑<br />
k ≠i<br />
Dik<br />
ij<br />
- Calculation of b<strong>in</strong>ary velocities ⎜ ⎟ . Velocities are <strong>in</strong> [cm/s].<br />
( )<br />
1−<br />
xi<br />
Effective velocities: ci<br />
=<br />
x and mean free path for i-th radical<br />
k<br />
c<br />
∑<br />
k ≠i<br />
ik<br />
c<br />
i<br />
j<br />
⎞<br />
⎟<br />
⎠<br />
D<br />
λi<br />
= 3<br />
c<br />
Copyright ©2008, Mentor Graphics.<br />
i<br />
i<br />
B<br />
B<br />
23
Reactor (wafer) scale<br />
simulation (3-rd party tool)<br />
Input/output to VCE tool - II<br />
Process recipe<br />
Die-level model –VCE<br />
Miss<strong>in</strong>g l<strong>in</strong>k<br />
GDSII<br />
• Flux <strong>variation</strong><br />
• CD <strong>variation</strong><br />
• Etch rate <strong>variation</strong><br />
• Etch depth var.<br />
Copyright ©2008, Mentor Graphics.<br />
24
Calibration Methodology<br />
� The major difference between the fully-coupled multi-scale simulations and the approach proposed <strong>in</strong><br />
this paper is <strong>in</strong> a calibration-based nature of predictability of the latter one.<br />
� All unknown parameters of the employed model, such as plasma generation-recomb<strong>in</strong>ation rates,<br />
chemical reaction rates, stick<strong>in</strong>g coefficients, <strong>in</strong>teraction radiuses, etc, are calibrated/optimized based on<br />
measured post-<strong>etch</strong> geometries of the different features characterized <strong>by</strong> a variety of AR and PD.<br />
� This calibration conf<strong>in</strong>es our model with the particular type of the reactor and process. While it is<br />
perfectly well with the process-aware design optimization, however, the calibration-based approach<br />
<strong>in</strong>troduces some restrictions on the use-model for the design-aware process optimization. Calibrated<br />
model can be used mostly for explor<strong>in</strong>g the effect of small <strong>variation</strong> <strong>in</strong> process parameters on the PD<strong>in</strong>duced<br />
variability <strong>by</strong> means of the proper l<strong>in</strong>k with a reactor-scale model.<br />
center<br />
Hole/Pitch=0.140/0.600um Hole/Pitch=0.135/0.220um Hole/Pitch=0.138/0.600um Hole/Pitch=0.140/0.600um<br />
Copyright ©2008, Mentor Graphics.<br />
25
Calibration Methodology<br />
� Allocate a number of <strong>via</strong>s/<strong>contact</strong>s not less than the number of model parameters. The best practice<br />
is to pick the features from the regions characterized <strong>by</strong> different <strong>pattern</strong> densities<br />
� Measure either <strong>etch</strong> rates, post-<strong>etch</strong> <strong>via</strong> depth, or CD for these features<br />
� Run the VCE and extract from the data-base the relative fluxes of all radicals com<strong>in</strong>g to the<br />
measured features: γ ij<br />
� Run a optimization module to extract parameters values provid<strong>in</strong>g the best fit between calculated<br />
and measured characteristics.<br />
Calculated depths<br />
184<br />
180<br />
176<br />
172<br />
R 2 = 0.9226<br />
168<br />
164 168 172 176 180 184<br />
Measured depths<br />
Correlation of 92% was achieved for process node:<br />
55 nm; test chip size of 25.2x30.7 mm<br />
(a) (b)<br />
Measured values (plotted <strong>by</strong> triangles) and calculated<br />
values (squares) of <strong>via</strong>s (a) with top diameter 110 nm, and<br />
(b) with top diameter 67 nm.<br />
Copyright ©2008, Mentor Graphics.<br />
26
VCE Capability<br />
Based on accurate calculation of an across-die flux <strong>variation</strong> of radicals<br />
participat<strong>in</strong>g <strong>in</strong> <strong>etch</strong> reactions we can predict:<br />
Across-die <strong>etch</strong> rate <strong>variation</strong><br />
Via 3 layer Via5 layer<br />
Copyright ©2008, Mentor Graphics.<br />
27
No dummy fill<br />
VCE Capability<br />
Effect of dummy fill on across-die CD <strong>variation</strong><br />
With dummy fill<br />
Copyright ©2008, Mentor Graphics.<br />
28<br />
CD map full range = 6e -3
VCE Capability<br />
Across-die <strong>etch</strong> hot-spots distribution<br />
Copyright ©2008, Mentor Graphics.<br />
29
VCE/LE Capabilities<br />
Post-<strong>etch</strong> contours<br />
• Three steps of litho simulation for poly layer<br />
Post-exposure<br />
Post-photoresist<br />
Post-<strong>etch</strong><br />
Copyright ©2008, Mentor Graphics.<br />
30
APPLICATIONS of VCE<br />
Copyright ©2008, Mentor Graphics.<br />
31
Hot-spot check: Bottom CD <strong>variation</strong><br />
� VCE calibrates the bottom CD<br />
model based on the customer<br />
provided measurements of postlitho<br />
top CD and post-<strong>etch</strong> bottom<br />
CD for a number of features<br />
�� VCE predicts bottom CD<br />
<strong>variation</strong> through the entire chip<br />
78.00<br />
76.00<br />
74.00<br />
72.00<br />
70.00<br />
68.00<br />
1 3 5 7 9 11 13 15 17<br />
Measured values<br />
(plotted <strong>by</strong> diamonds)<br />
and calculated values<br />
(squares) of <strong>via</strong>s with<br />
top diameter of 67 nm<br />
(as-designed)<br />
77<br />
76<br />
75<br />
74<br />
73<br />
y = 0.6716x + 24.4<br />
R 2 = 0.6722<br />
72<br />
70.00 72.00 74.00 76.00 78.00<br />
Copyright ©2008, Mentor Graphics.<br />
32
Process-Aware <strong>Design</strong> Optimization vs.<br />
<strong>Design</strong>-Aware Process Optimization<br />
Upon completion of the hot spot check the follow<strong>in</strong>g correction<br />
actions can be undertaken:<br />
DESIGN PROCESS<br />
• Intelligent dummy-fill<br />
• Mask correction at the MDP stage<br />
• Tun<strong>in</strong>g the process parameters<br />
• Modification of the process<strong>in</strong>g gas<br />
composition<br />
Copyright ©2008, Mentor Graphics.<br />
33
<strong>Design</strong> optimization <strong>by</strong> means of dummy <strong>via</strong><br />
<strong>in</strong>sertion<br />
VCE predicts bottom<br />
CD <strong>variation</strong> through<br />
the entire chip:<br />
�� Before dummy<br />
placement<br />
� After dummy<br />
placement<br />
CD Map<br />
No dummy fill With dummy fill<br />
∆ Max – ∆ M<strong>in</strong> :<br />
no-fill / fill =<br />
1.32<br />
CD map full range = 6e -3<br />
Copyright ©2008, Mentor Graphics.<br />
34
Process optimization<br />
• VCE predicts bottom CD <strong>variation</strong> through the<br />
entire chip for different process recipes<br />
� Two cases characterized <strong>by</strong> the identical <strong>etch</strong> process recipes<br />
are considered. The only difference between these two cases is<br />
that some amount of CHF3 was added to the <strong>in</strong>let gas flow <strong>in</strong> the<br />
Case 2.<br />
� Addition of CHF3 dramatically reduces the fluor<strong>in</strong>e atom<br />
concentration <strong>in</strong> the plasma bulk.<br />
� The later causes an excessive polymer deposition at the <strong>etch</strong>ed<br />
feature sidewalls and bottom that results <strong>in</strong> a bigger <strong>etch</strong> CD bias.<br />
Copyright ©2008, Mentor Graphics.<br />
35
Reactor (wafer) scale<br />
simulation (3-rd party tool)<br />
Input/output to VCE tool -II<br />
Process recipe<br />
Die-level model –VCE<br />
Miss<strong>in</strong>g l<strong>in</strong>k<br />
GDSII<br />
• Flux <strong>variation</strong><br />
• CD <strong>variation</strong><br />
• Etch rate <strong>variation</strong><br />
• Etch depth var.<br />
Copyright ©2008, Mentor Graphics.<br />
36
F Concentration, mass fraction<br />
Reduced Fluor<strong>in</strong>e concentration<br />
Case 1<br />
edge<br />
Copyright ©2008, Mentor Graphics. Case 2<br />
37
Case 1<br />
Molar Fractions<br />
Summary of Reactor-scale simulation<br />
C CF CF2 CF3 CF4 F F2<br />
0.0006693 0.0099706 0.0107488 0.0139769 0.8800164 0.0837992 0.0008187<br />
Radical Fluxes (#/cm2/sec)<br />
CF CF2 CF3 F<br />
5.418E+15 9.415E+15 1.579E+15 9.474E+16<br />
Ion Fluxes (#/cm2/sec)<br />
CF+ CF2+ CF3+ Sum<br />
1.430E+15 2.760E+15 1.310E+16 1.729E+16<br />
Case 2<br />
Max. Ion Current: 4.85 mA, Vrf_b=181V<br />
Plasma Potential =+178.8V<br />
Aver. RFpotential -147.2 Vb/-314.1Vt<br />
E o = 326 V<br />
Molar Fractions<br />
C CF CF2 CF3 CF4 F F2 CHF3 HF<br />
0.0002971 0.0065974 0.0101139 0.0177320 0.8162692 0.0457770 0.0005838 0.0914919 0.0111377<br />
Radical Fluxes (#/cm2/sec)<br />
CF CF2 CF3 F<br />
2.835E+15 8.031E+15 2.713E+15 4.879E+16<br />
Ion Fluxes (#/cm2/sec)<br />
CF+ CF2+ CF3+ Sum<br />
5.870E+14 1.690E+15 8.070E+15 1.035E+16<br />
Max. Ion Current: 2.26 mA, Vrf_b=271V<br />
Plasma Potential =+95.5V<br />
Aver. RFpotential -388 Vb/-253 Vt<br />
E o = 484 V<br />
Copyright ©2008, Mentor Graphics.<br />
38
Averaged <strong>pattern</strong> density<br />
R=1000µm<br />
Neutral flux maps<br />
Neutral Flux (x10 15 cm -2 s -1 )<br />
CF+CF2+CF3 F<br />
Copyright ©2008, Mentor Graphics.<br />
39
CD <strong>variation</strong> maps: case1 vs case2<br />
Pattern density ∆CD : case 1<br />
∆CD : case 2<br />
Case 1<br />
Case 2<br />
Via<br />
a) b)<br />
a) ) ∆ ∆average<br />
:<br />
case2 / case1 = 1.41<br />
b) ) ) ∆∆<br />
∆ ∆Max<br />
– ∆M<strong>in</strong> :<br />
case2 / case1 = 1.49<br />
Copyright ©2008, Mentor Graphics.<br />
40<br />
CD map full range = 6e -3
OBSERVATION: FIB <strong>in</strong>spection of 0.26 um <strong>via</strong> after <strong>etch</strong><strong>in</strong>g. (a) dense <strong>via</strong>s; (b) isolated <strong>via</strong>.<br />
Dense <strong>via</strong>s <strong>etch</strong> faster than isolated <strong>via</strong>, i.e. <strong>in</strong>verse micro-load<strong>in</strong>g effect.<br />
Dense <strong>via</strong>s<br />
(a) (b)<br />
KV areas<br />
� Via <strong>etch</strong> process optimization was done for regular<br />
<strong>pattern</strong>s on test wafer<br />
� Employed <strong>pattern</strong>s represent a small part of the<br />
entire test-chip design<br />
� An <strong>etch</strong> rate <strong>variation</strong> caused <strong>by</strong> microload<strong>in</strong>g is<br />
governed <strong>by</strong> a large-scale <strong>pattern</strong> density <strong>variation</strong> –<br />
much larger than used patters. This scale is order of<br />
magnitude of the mean free path of radical species<br />
participat<strong>in</strong>g <strong>in</strong> <strong>etch</strong> reactions.<br />
� A full-chip analysis is required for understand<strong>in</strong>g<br />
the real <strong>pattern</strong> dependency of the <strong>etch</strong> step<br />
SEMbar (1)<br />
SEMbar (2)<br />
Test-chip SEMbar<br />
Copyright ©2008, Mentor Graphics.
Non-<strong>etch</strong>able Non suppressed<br />
Includes all area<br />
Pattern Density & Radical Fluxes Maps<br />
Density<br />
CF2 flux F flux<br />
Copyright ©2008, Mentor Graphics.
CF2 flux<br />
F flux<br />
SEMbar (1) <strong>in</strong> all01<br />
Flux Distributions<br />
SEMbar (2) <strong>in</strong> all01 SEMbar isolated<br />
Copyright ©2008, Mentor Graphics.
Across-Die Distribution of Etch Stop Threshold<br />
Pattern density Probability of <strong>etch</strong> stop (ES) Above-threshold ES location<br />
� SEMbar1 and SEMbar2, which are identical regard<strong>in</strong>g the local <strong>pattern</strong> density, are characterized <strong>by</strong><br />
different radical flux distribution, that <strong>transfer</strong>s <strong>in</strong>to different post-<strong>etch</strong> feature profiles.<br />
� Radical flux <strong>variation</strong> <strong>in</strong> SEMbar is determ<strong>in</strong>ed <strong>by</strong> the global <strong>pattern</strong> density distribution rather than the<br />
local one <strong>in</strong>side this segment of layout.<br />
� Calculated full-chip radical flux distributions suggest that the <strong>etch</strong> stop is more probable at the iso-<strong>via</strong><br />
location than <strong>in</strong> SEMbar.<br />
� An accurate design/process optimization could be achieved only <strong>by</strong> analyz<strong>in</strong>g test-chip design with<br />
Mentor-VCE tool.<br />
Copyright ©2008, Mentor Graphics.
Calibration/Prediction – Resist Model<br />
� CM1(Compact Model 1) is a Mentor Graphics resist model.<br />
It provides a dense simulation <strong>by</strong> consider<strong>in</strong>g acid and base neutralization, diffusion length dur<strong>in</strong>g the<br />
exposure, bak<strong>in</strong>g, and resist development phases.<br />
� The output of the model is a resist contour<br />
obta<strong>in</strong>ed from the exposure threshold T :<br />
� Each term M i(I) is of the form:<br />
Simulated, nm<br />
285<br />
275<br />
265<br />
255<br />
245<br />
235<br />
225<br />
215<br />
205<br />
+/-b is the neutralization operator (+ for acid, - for base concentration),<br />
y = 0.80x + 43.77<br />
R2 R = 0.805<br />
2 = 0.805<br />
195<br />
195 205 215 225 235 245 255 265 275 285<br />
Measured, nm<br />
M<br />
( ) ) n<br />
∑ci<br />
Mi<br />
I =<br />
k n<br />
1/<br />
∇ I b ⊗Gs<br />
, p<br />
= ±<br />
CD, nm<br />
300<br />
280<br />
260<br />
240<br />
220<br />
200<br />
180<br />
( ) T<br />
Measured<br />
Simulated<br />
1 3 5 7 9 11 13 15 17 19 21 23 25 27 29 31 33 35 37 39<br />
Via No.<br />
� Optical diameter = 2.56um<br />
� NA = 0.659<br />
� Model is calibrated on BARC open<strong>in</strong>g<br />
CD.<br />
� Result : R2 = 0.81<br />
Copyright ©2008, Mentor Graphics.
Calibration/Prediction –ARC Etch<br />
� Correction for Microload<strong>in</strong>g nature of BARC etc<strong>in</strong>g is added:<br />
CD BARC.<br />
o<br />
CDLitho<br />
γ<br />
i<br />
CD BARC . o − CD Litho = δ '+<br />
αγ O [ 1 − β ( 1 − κD<br />
)]<br />
CD<br />
Litho<br />
. o = CD Litho ⋅ { δ + αγ [ 1 − β ( 1 − κD<br />
)] }<br />
α, β, δ, κ : calibration parameters.<br />
CD BARC<br />
O<br />
: Simulated BARC CD open<strong>in</strong>g prior to ma<strong>in</strong><br />
<strong>etch</strong><strong>in</strong>g.<br />
: Simulated resist open<strong>in</strong>g CD us<strong>in</strong>g CM1 resist<br />
model (calibrated on BARC open<strong>in</strong>g CD<br />
measurements)<br />
: Normalized flux of neutral i.<br />
: Density of resist open<strong>in</strong>g.<br />
� D(r<br />
The ) term ββββ(1-κκκκD) is <strong>in</strong>troduced to expla<strong>in</strong> carbon assisted<br />
polymer formation. Carbon <strong>in</strong> resist film is considered to be the<br />
source.<br />
� CDSEM measurement error of 3nm is taken <strong>in</strong>to<br />
account. TRS 2001 eds. Metrology, p.8<br />
� Result : R 2 = 0.82<br />
CD, nm<br />
Simulated, nm<br />
300<br />
280<br />
260<br />
240<br />
220<br />
200<br />
180<br />
285<br />
275<br />
265<br />
255<br />
245<br />
235<br />
225<br />
215<br />
205<br />
Measured<br />
Simulated<br />
1 3 5 7 9 11 13 15 17 19 21 23 25 27 29 31 33 35 37 39<br />
y = 0.85x + 33.52<br />
R2 = 0.823<br />
Via No.<br />
195<br />
195 205 215 225 235 245 255 265 275 285<br />
Measured, nm<br />
Copyright ©2008, Mentor Graphics.
Calibration/Prediction - Ma<strong>in</strong> Etch<br />
� BARC CD widen<strong>in</strong>g due to PR loss dur<strong>in</strong>g ma<strong>in</strong> <strong>etch</strong><strong>in</strong>g is considered:<br />
CDBARC<br />
− CDBARC.<br />
o = α0<br />
'+ α1γ<br />
F[<br />
1−α<br />
2(<br />
1−<br />
α3D)]<br />
≥ 0<br />
CD<br />
CDBott<br />
− CD<br />
CD<br />
CD<br />
Bott<br />
BARC.<br />
o<br />
BARC<br />
BARC<br />
= CD<br />
= CD<br />
BARC<br />
γ<br />
+ β1(<br />
γ<br />
⎧β0<br />
= β0'+<br />
1<br />
⎨<br />
⎩α<br />
0 = α0<br />
'+<br />
1<br />
γ CF γ CF 2 γ CF 3<br />
= β0<br />
'+<br />
β 1 + β2<br />
( ) + β3(<br />
) ≤ 0<br />
γ γ γ<br />
BARC . o<br />
CF<br />
F<br />
F<br />
γ<br />
⋅[<br />
β0<br />
+ β1(<br />
γ<br />
F<br />
γ<br />
) + β2<br />
(<br />
γ<br />
⋅ { αα<br />
+ αα<br />
γγ<br />
[ 1 − −αα<br />
( 1 − −αα<br />
D )]}[ ββ<br />
+<br />
0<br />
γ<br />
) + β2<br />
(<br />
γ<br />
1<br />
CF<br />
F<br />
)<br />
CF<br />
F<br />
F<br />
2<br />
2<br />
γ<br />
+ β3(<br />
γ<br />
CF<br />
F<br />
)<br />
3<br />
2<br />
F<br />
γ<br />
+ β3(<br />
γ<br />
α 0, α 1, α 2, α 3, β 0, β 1, β 2 , β 3 : calibration parameters.<br />
CD bott : simulated Bottom CD after ma<strong>in</strong> <strong>etch</strong><strong>in</strong>g.<br />
CF<br />
F<br />
)<br />
3<br />
]<br />
0<br />
CF<br />
� Result : R 2 = 0.70<br />
F<br />
)<br />
3<br />
]<br />
Simulationed, nm<br />
CD, nm<br />
285<br />
275<br />
265<br />
255<br />
245<br />
235<br />
225<br />
215<br />
205<br />
195<br />
300<br />
280<br />
260<br />
240<br />
220<br />
200<br />
180<br />
Measured<br />
Simulated<br />
1 3 5 7 9 11 13 15 17 19 21 23 25 27 29 31 33 35 37 39<br />
y = 0.81x + 44.52<br />
R2 = 0.701<br />
Via No.<br />
195 205 215 225 235 245 255 265 275 285<br />
Measured, nm<br />
Copyright ©2008, Mentor Graphics.
Bias Map<br />
<strong>Design</strong><br />
� Normalized CD Bias :<br />
Area 1-2:<br />
Area 4:<br />
Area 5:<br />
Etch CD Bias Prediction<br />
∆<br />
n<br />
CDBott<br />
− CD<br />
=<br />
CD<br />
Area 4<br />
BARC.<br />
o<br />
BARC<br />
. o<br />
γ CF γ CF 2 γ CF 3<br />
= { α0<br />
+ α1γ<br />
F[<br />
1−α<br />
2(<br />
1−<br />
α3D)]}[<br />
β0<br />
+ β1(<br />
) + β2<br />
( ) + β3(<br />
) ] −1<br />
γ γ γ<br />
� Bias is represented <strong>in</strong> terms of CD BARC.o_predicted .<br />
� Large bias is expected <strong>in</strong> RED regions, and could become hot<br />
spots.<br />
� 12x12 <strong>via</strong> blocks (area 1-2 vs. area 5) : Long range<br />
microload<strong>in</strong>g may lead to different level of bias maps<br />
although these two <strong>pattern</strong>s are locally identical.<br />
Area 1-2 Area 5<br />
F<br />
Copyright ©2008, Mentor Graphics.<br />
F<br />
F<br />
∆ n ≤ -0.2<br />
∆ n = 0<br />
∆ n ≥ 0.1
Mentor Graphics Corp.,<br />
San Jose, CA, USA<br />
�J-H Choy<br />
�H. Hovsepyan<br />
�N. Khachatryan<br />
�A. Kteyan<br />
�H. �H. Lazaryan<br />
�L. Manukyan<br />
�Yu. Granik<br />
�A. Markosian<br />
�V. Sukharev<br />
Thank you!<br />
TEAM:<br />
Toshiba Corp., Japan<br />
�Seiji Onoue,<br />
�Takuo Kikuchi,<br />
�Tetsuya Kamigaki<br />
Institute of Microelectronics,<br />
S<strong>in</strong>gapore<br />
�Vladimir Bliznetsov