Autofluorescent Proteins with Excitation in the Optical ... - Tsien
Autofluorescent Proteins with Excitation in the Optical ... - Tsien
Autofluorescent Proteins with Excitation in the Optical ... - Tsien

You also want an ePaper? Increase the reach of your titles
YUMPU automatically turns print PDFs into web optimized ePapers that Google loves.
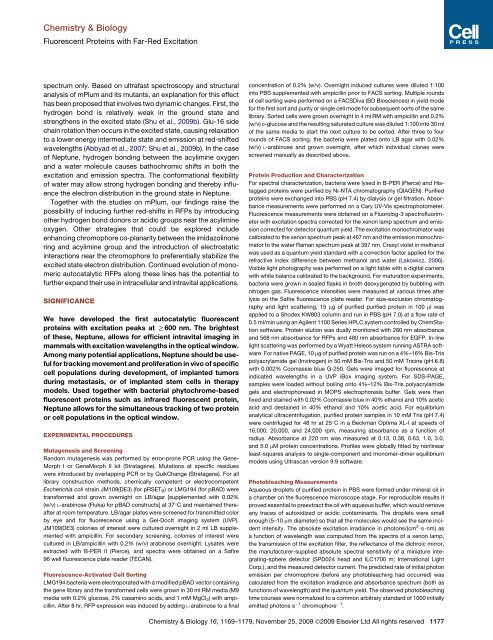
Chemistry & Biology<br />
Fluorescent <strong>Prote<strong>in</strong>s</strong> <strong>with</strong> Far-Red <strong>Excitation</strong><br />
spectrum only. Based on ultrafast spectroscopy and structural<br />
analysis of mPlum and its mutants, an explanation for this effect<br />
has been proposed that <strong>in</strong>volves two dynamic changes. First, <strong>the</strong><br />
hydrogen bond is relatively weak <strong>in</strong> <strong>the</strong> ground state and<br />
streng<strong>the</strong>ns <strong>in</strong> <strong>the</strong> excited state (Shu et al., 2009b). Glu-16 side<br />
cha<strong>in</strong> rotation <strong>the</strong>n occurs <strong>in</strong> <strong>the</strong> excited state, caus<strong>in</strong>g relaxation<br />
to a lower energy <strong>in</strong>termediate state and emission at red-shifted<br />
wavelengths (Abbyad et al., 2007; Shu et al., 2009b). In <strong>the</strong> case<br />
of Neptune, hydrogen bond<strong>in</strong>g between <strong>the</strong> acylim<strong>in</strong>e oxygen<br />
and a water molecule causes bathochromic shifts <strong>in</strong> both <strong>the</strong><br />
excitation and emission spectra. The conformational flexibility<br />
of water may allow strong hydrogen bond<strong>in</strong>g and <strong>the</strong>reby <strong>in</strong>fluence<br />
<strong>the</strong> electron distribution <strong>in</strong> <strong>the</strong> ground state <strong>in</strong> Neptune.<br />
Toge<strong>the</strong>r <strong>with</strong> <strong>the</strong> studies on mPlum, our f<strong>in</strong>d<strong>in</strong>gs raise <strong>the</strong><br />
possibility of <strong>in</strong>duc<strong>in</strong>g fur<strong>the</strong>r red-shifts <strong>in</strong> RFPs by <strong>in</strong>troduc<strong>in</strong>g<br />
o<strong>the</strong>r hydrogen bond donors or acidic groups near <strong>the</strong> acylim<strong>in</strong>e<br />
oxygen. O<strong>the</strong>r strategies that could be explored <strong>in</strong>clude<br />
enhanc<strong>in</strong>g chromophore co-planarity between <strong>the</strong> imidazol<strong>in</strong>one<br />
r<strong>in</strong>g and acylim<strong>in</strong>e group and <strong>the</strong> <strong>in</strong>troduction of electrostatic<br />
<strong>in</strong>teractions near <strong>the</strong> chromophore to preferentially stabilize <strong>the</strong><br />
excited state electron distribution. Cont<strong>in</strong>ued evolution of monomeric<br />
autocatalytic RFPs along <strong>the</strong>se l<strong>in</strong>es has <strong>the</strong> potential to<br />
fur<strong>the</strong>r expand <strong>the</strong>ir use <strong>in</strong> <strong>in</strong>tracellular and <strong>in</strong>travital applications.<br />
SIGNIFICANCE<br />
We have developed <strong>the</strong> first autocatalytic fluorescent<br />
prote<strong>in</strong>s <strong>with</strong> excitation peaks at R600 nm. The brightest<br />
of <strong>the</strong>se, Neptune, allows for efficient <strong>in</strong>travital imag<strong>in</strong>g <strong>in</strong><br />
mammals <strong>with</strong> excitation wavelengths <strong>in</strong> <strong>the</strong> optical w<strong>in</strong>dow.<br />
Among many potential applications, Neptune should be useful<br />
for track<strong>in</strong>g movement and proliferation <strong>in</strong> vivo of specific<br />
cell populations dur<strong>in</strong>g development, of implanted tumors<br />
dur<strong>in</strong>g metastasis, or of implanted stem cells <strong>in</strong> <strong>the</strong>rapy<br />
models. Used toge<strong>the</strong>r <strong>with</strong> bacterial phytochrome-based<br />
fluorescent prote<strong>in</strong>s such as <strong>in</strong>frared fluorescent prote<strong>in</strong>,<br />
Neptune allows for <strong>the</strong> simultaneous track<strong>in</strong>g of two prote<strong>in</strong><br />
or cell populations <strong>in</strong> <strong>the</strong> optical w<strong>in</strong>dow.<br />
EXPERIMENTAL PROCEDURES<br />
Mutagenesis and Screen<strong>in</strong>g<br />
Random mutagenesis was performed by error-prone PCR us<strong>in</strong>g <strong>the</strong> Gene-<br />
Morph I or GeneMorph II kit (Stratagene). Mutations at specific residues<br />
were <strong>in</strong>troduced by overlapp<strong>in</strong>g PCR or by QuikChange (Stratagene). For all<br />
library construction methods, chemically competent or electrocompetent<br />
Escherichia coli stra<strong>in</strong> JM109(DE3) (for pRSETB) or LMG194 (for pBAD) were<br />
transformed and grown overnight on LB/agar [supplemented <strong>with</strong> 0.02%<br />
(w/v) L-arab<strong>in</strong>ose (Fluka) for pBAD constructs] at 37 C and ma<strong>in</strong>ta<strong>in</strong>ed <strong>the</strong>reafter<br />
at room temperature. LB/agar plates were screened for transmitted color<br />
by eye and for fluorescence us<strong>in</strong>g a Gel-DocIt imag<strong>in</strong>g system (UVP).<br />
JM109(DE3) colonies of <strong>in</strong>terest were cultured overnight <strong>in</strong> 2 ml LB supplemented<br />
<strong>with</strong> ampicill<strong>in</strong>. For secondary screen<strong>in</strong>g, colonies of <strong>in</strong>terest were<br />
cultured <strong>in</strong> LB/ampicill<strong>in</strong> <strong>with</strong> 0.2% (w/v) arab<strong>in</strong>ose overnight. Lysates were<br />
extracted <strong>with</strong> B-PER II (Pierce), and spectra were obta<strong>in</strong>ed on a Safire<br />
96 well fluorescence plate reader (TECAN).<br />
Fluorescence-Activated Cell Sort<strong>in</strong>g<br />
LMG194 bacteria were electroporated <strong>with</strong> a modified pBAD vector conta<strong>in</strong><strong>in</strong>g<br />
<strong>the</strong> gene library and <strong>the</strong> transformed cells were grown <strong>in</strong> 30 ml RM media (M9<br />
media <strong>with</strong> 0.2% glucose, 2% casam<strong>in</strong>o acids, and 1 mM MgCl 2) <strong>with</strong> ampicill<strong>in</strong>.<br />
After 8 hr, RFP expression was <strong>in</strong>duced by add<strong>in</strong>g L-arab<strong>in</strong>ose to a f<strong>in</strong>al<br />
concentration of 0.2% (w/v). Overnight <strong>in</strong>duced cultures were diluted 1:100<br />
<strong>in</strong>to PBS supplemented <strong>with</strong> ampicill<strong>in</strong> prior to FACS sort<strong>in</strong>g. Multiple rounds<br />
of cell sort<strong>in</strong>g were performed on a FACSDiva (BD Biosciences) <strong>in</strong> yield mode<br />
for <strong>the</strong> first sort and purity or s<strong>in</strong>gle cell mode for subsequent sorts of <strong>the</strong> same<br />
library. Sorted cells were grown overnight <strong>in</strong> 4 ml RM <strong>with</strong> ampicill<strong>in</strong> and 0.2%<br />
(w/v) D-glucose and <strong>the</strong> result<strong>in</strong>g saturated culture was diluted 1:100 <strong>in</strong>to 30 ml<br />
of <strong>the</strong> same media to start <strong>the</strong> next culture to be sorted. After three to four<br />
rounds of FACS sort<strong>in</strong>g, <strong>the</strong> bacteria were plated onto LB agar <strong>with</strong> 0.02%<br />
(w/v) L-arab<strong>in</strong>ose and grown overnight, after which <strong>in</strong>dividual clones were<br />
screened manually as described above.<br />
Prote<strong>in</strong> Production and Characterization<br />
For spectral characterization, bacteria were lysed <strong>in</strong> B-PER (Pierce) and Histagged<br />
prote<strong>in</strong>s were purified by Ni-NTA chromatography (QIAGEN). Purified<br />
prote<strong>in</strong>s were exchanged <strong>in</strong>to PBS (pH 7.4) by dialysis or gel filtration. Absorbance<br />
measurements were performed on a Cary UV-Vis spectrophotometer.<br />
Fluorescence measurements were obta<strong>in</strong>ed on a Fluorolog-3 spectrofluorimeter<br />
<strong>with</strong> excitation spectra corrected for <strong>the</strong> xenon lamp spectrum and emission<br />
corrected for detector quantum yield. The excitation monochromator was<br />
calibrated to <strong>the</strong> xenon spectrum peak at 467 nm and <strong>the</strong> emission monochromator<br />
to <strong>the</strong> water Raman spectrum peak at 397 nm. Cresyl violet <strong>in</strong> methanol<br />
was used as a quantum yield standard <strong>with</strong> a correction factor applied for <strong>the</strong><br />
refractive <strong>in</strong>dex difference between methanol and water (Lakowicz, 2006).<br />
Visible light photography was performed on a light table <strong>with</strong> a digital camera<br />
<strong>with</strong> white balance calibrated to <strong>the</strong> background. For maturation experiments,<br />
bacteria were grown <strong>in</strong> sealed flasks <strong>in</strong> broth deoxygenated by bubbl<strong>in</strong>g <strong>with</strong><br />
nitrogen gas. Fluorescence <strong>in</strong>tensities were measured at various times after<br />
lysis on <strong>the</strong> Safire fluorescence plate reader. For size-exclusion chromatography<br />
and light scatter<strong>in</strong>g, 15 mg of purified purified prote<strong>in</strong> <strong>in</strong> 100 ml was<br />
applied to a Shodex KW803 column and run <strong>in</strong> PBS (pH 7.0) at a flow rate of<br />
0.5 ml/m<strong>in</strong> us<strong>in</strong>g an Agilent 1100 Series HPLC system controlled by ChemStation<br />
software. Prote<strong>in</strong> elution was dually monitored <strong>with</strong> 280 nm absorbance<br />
and 568 nm absorbance for RFPs and 480 nm absorbance for EGFP. In-l<strong>in</strong>e<br />
light scatter<strong>in</strong>g was performed by a Wyatt Heleos system runn<strong>in</strong>g ASTRA software.<br />
For native PAGE, 10 mg of purified prote<strong>in</strong> was run on a 4%–16% Bis-Tris<br />
polyacrylamide gel (Invitrogen) <strong>in</strong> 50 mM Bis-Tris and 50 mM Tric<strong>in</strong>e (pH 6.8)<br />
<strong>with</strong> 0.002% Coomassie blue G-250. Gels were imaged for fluorescence at<br />
<strong>in</strong>dicated wavelengths <strong>in</strong> a UVP iBox imag<strong>in</strong>g system. For SDS-PAGE,<br />
samples were loaded <strong>with</strong>out boil<strong>in</strong>g onto 4%–12% Bis-Tris polyacrylamide<br />
gels and electrophoresed <strong>in</strong> MOPS electrophoresis buffer. Gels were <strong>the</strong>n<br />
fixed and sta<strong>in</strong>ed <strong>with</strong> 0.02% Coomassie blue <strong>in</strong> 40% ethanol and 10% acetic<br />
acid and desta<strong>in</strong>ed <strong>in</strong> 40% ethanol and 10% acetic acid. For equilibrium<br />
analytical ultracentrifugation, purified prote<strong>in</strong> samples <strong>in</strong> 10 mM Tris (pH 7.4)<br />
were centrifuged for 48 hr at 25 C <strong>in</strong> a Beckman Optima XL-I at speeds of<br />
16,000, 20,000, and 24,000 rpm, measur<strong>in</strong>g absorbance as a function of<br />
radius. Absorbance at 220 nm was measured at 0.13, 0.38, 0.63, 1.0, 3.0,<br />
and 5.0 mM prote<strong>in</strong> concentrations. Profiles were globally fitted by nonl<strong>in</strong>ear<br />
least-squares analysis to s<strong>in</strong>gle-component and monomer-dimer equilibrium<br />
models us<strong>in</strong>g Ultrascan version 9.9 software.<br />
Photobleach<strong>in</strong>g Measurements<br />
Aqueous droplets of purified prote<strong>in</strong> <strong>in</strong> PBS were formed under m<strong>in</strong>eral oil <strong>in</strong><br />
a chamber on <strong>the</strong> fluorescence microscope stage. For reproducible results it<br />
proved essential to preextract <strong>the</strong> oil <strong>with</strong> aqueous buffer, which would remove<br />
any traces of autoxidized or acidic contam<strong>in</strong>ants. The droplets were small<br />
enough (5–10 mm diameter) so that all <strong>the</strong> molecules would see <strong>the</strong> same <strong>in</strong>cident<br />
<strong>in</strong>tensity. The absolute excitation irradiance <strong>in</strong> photons/(cm 2 $s$nm) as<br />
a function of wavelength was computed from <strong>the</strong> spectra of a xenon lamp,<br />
<strong>the</strong> transmission of <strong>the</strong> excitation filter, <strong>the</strong> reflectance of <strong>the</strong> dichroic mirror,<br />
<strong>the</strong> manufacturer-supplied absolute spectral sensitivity of a m<strong>in</strong>iature <strong>in</strong>tegrat<strong>in</strong>g-sphere<br />
detector (SPD024 head and ILC1700 m; International Light<br />
Corp.), and <strong>the</strong> measured detector current. The predicted rate of <strong>in</strong>itial photon<br />
emission per chromophore (before any photobleach<strong>in</strong>g had occurred) was<br />
calculated from <strong>the</strong> excitation irradiance and absorbance spectrum (both as<br />
functions of wavelength) and <strong>the</strong> quantum yield. The observed photobleach<strong>in</strong>g<br />
time courses were normalized to a common arbitrary standard of 1000 <strong>in</strong>itially<br />
emitted photons s 1 chromophore 1 .<br />
Chemistry & Biology 16, 1169–1179, November 25, 2009 ª2009 Elsevier Ltd All rights reserved 1177