Download full document - Automatic Control
Download full document - Automatic Control
Download full document - Automatic Control

Create successful ePaper yourself
Turn your PDF publications into a flip-book with our unique Google optimized e-Paper software.
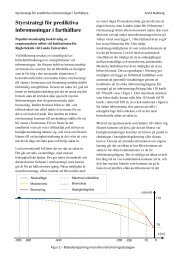
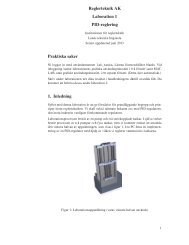
Figure 11.32 and Figure 11.33 above shows the three arm angle trajectories used as reference in<br />
the experiment and the TCP trajectory for the three components, (x,y,z). The left plot (Figure<br />
11.32) shows the three arm angle positions in degrees over the time in seconds. The right plot<br />
(Figure 11.33) shows the x, y and z components of the position of the TCP in the world<br />
coordinate frame, see Figure 4.1.<br />
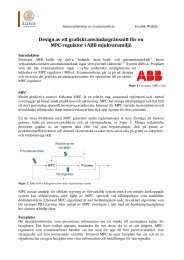
Figure 11.34, the blue line shows the velocity calculated<br />
with the Jacobian matrix, and the red line shows the<br />
reference velocity from EPAS.<br />
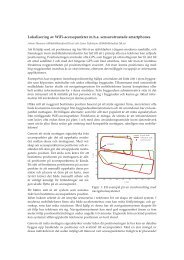
Figure 11.35, shows deviation between calculated and<br />
reference velocity. Where the calculated is computed with<br />
the Jacobian.<br />
Figure 11.34 shows the three different arm joint velocities in the unit degree/s over the time in<br />
seconds. To make it easier to see how big the deviation is between the EPAS reference value of<br />
the velocity and with Jacobian matrix calculated velocity Figure 11.35 shows the percentage<br />
deviation between EPAS reference value and with the Jacobian calculated value.<br />
Figure 11.36, the blue line shows the calculated acceleration and the red<br />
line shows the reference acceleration from EPAS.<br />
______________________________________________________________________________<br />
Public Report ELAU GmbH, Marktheidenfeld<br />
59