An Investigation Into Factors that, Affect Monoclonal Antibody ...
An Investigation Into Factors that, Affect Monoclonal Antibody ...
An Investigation Into Factors that, Affect Monoclonal Antibody ...

Create successful ePaper yourself
Turn your PDF publications into a flip-book with our unique Google optimized e-Paper software.
<strong>An</strong> <strong>Investigation</strong> <strong>Into</strong> <strong>Factors</strong> <strong>that</strong>, <strong>Affect</strong> <strong>Monoclonal</strong> <strong>An</strong>tibody<br />
Production by Hybridomas in Culture.<br />
by<br />
P. M. Hayter<br />
Department of Microbiology<br />
University of Surrey<br />
Guildford<br />
Surrey.<br />
Submitted for the degree of Doctor of Philosophy.<br />
September, 1989.
ABSTRACT<br />
The purpose of this investigation was to determine the<br />
effects of the culture environment on antibody production by<br />
hybridomas. Several observations made during" this <strong>Investigation</strong><br />
suggest <strong>that</strong> antibody production by the 321 hybridoma was<br />
favoured at low growth rates.<br />
1) <strong>An</strong>tibody production by the 321 hybridoma continued throughout<br />
the growth and decline phases of batch cultures but the specific<br />
rate of antibody production was highest when cell growth had<br />
ceased.<br />
2) In proliferating cells, the antibody production rate was higher<br />
at pH 6.8 or with 1% newborn calf serum than at pH 7.2 and with<br />
1094 serum, conditions which were more favourable for cell growth.<br />
3) <strong>An</strong>tibody production rates were higher in cultures where cell<br />
division had been arrested by excess thymidine.<br />
4) Specific antibody production rates and the yield of antibody from<br />
glutamine were higher at low growth rates In chemostat culture.<br />
Studies on the metabolism of the 321 hybrldoma provided<br />
evidence for an increased demand on metabolite and energy pools<br />
at high growth rates suggesting <strong>that</strong> the cell's metabolic capacity<br />
may be diverted towards cell growth at the expense of antibody<br />
synthesis.<br />
Alternatively, antibody production may be cell cycle-related.<br />
In synchronised cultures of the 321 hybridoma there was a<br />
reproducible decline in the antibody production rate during mitosis
and evidence of a further decline during the S phase. Higher rates<br />
of antibody synthesis during the Gx and G2 phases suggest <strong>that</strong> an<br />
increase in the proportion of cells residing in one or other of those<br />
phases would result in an increase in the rate of antibody<br />
production. Observations made on the effect of pH on the cell cycle<br />
were consistent with the hypothesis <strong>that</strong> unfavourable<br />
environmental conditions increase the duration of the Gi phase and<br />
hence the proportion of cells residing in <strong>that</strong> phase.
ACKNOWLEDGEMENTS<br />
I would like to thank my supervisors, Professor R. E. Spier<br />
and Dr N. F. Kirkbyfor their interest and enthusiasm throughout<br />
the course of this work.<br />
I would like to acknowledge the excellent technical assistance<br />
of Di Simpson for her help in tissue culture, Karel Newman for<br />
designing and building the computer interface and Terry Fieldus for<br />
building the continuous filter device.<br />
My friends and colleagues at Surrey during this work, Jane<br />
Thorpe, Steve Musgrave, Bob Wilson, Tim Clayton, Jimmy Modha,<br />
<strong>An</strong>drew Murdin, Peter Whiteside, Ric Jordan, Teresa Huck and Janet<br />
Bunker deserve special thanks for their help, encouragement, advice<br />
and above all, friendship.<br />
The cell line used in this investigation was a gift from Dr<br />
A. Wright, Central-Toxicology Laboratory, ICI and I would also like<br />
to thank Stuart Walsh in the same laboratory for helpful<br />
discussions on the purification of the 321 °. antibody.<br />
This work was funded by an Science and Engineering<br />
Research Council studentship.
ABBREVIATIONS<br />
APR antibody production rate<br />
ATP adenosine triphosphate<br />
BSA bovine serum albumin<br />
cpm counts per minute<br />
D dilution rate<br />
DEAE diethylaminoethyl<br />
DMSO dimethyl sulphoxide<br />
ELISA enzyme-linked immunosorbent assay<br />
g gravity constant<br />
Gi phase period following mitosis and preceding DNA synthesis<br />
G2 phase period following DNA synthesis and preceding mitosis<br />
h hours<br />
HPLC high performance liquid chromatography<br />
HPRT hypoxanthine phosphoribosyl transferase<br />
IgG immunoglobulin G<br />
KL a volumetric mass transfer coefficient<br />
M phase period of mitosis<br />
NAD nicotinamide adenine dinucleotide<br />
NADH reduced form of NAD<br />
PAGE polyacrylamide gel electrophoresis<br />
PBS phosphate buffered saline<br />
S phase period of DNA synthesis<br />
SDS sodium dodecyl sulphate
TCA trichloracetic acid<br />
Tris tris(hydroxymethyl)aminomethane<br />
Tween 20 non ionic detergent<br />
11 specific growth rate
Chapter 1. Introduction.<br />
Contents.<br />
1.1 <strong>An</strong>imal cell culture. 1<br />
1.2 The B-cell hybridoma.<br />
--<br />
1.3 Applications for monoclonal antibodies. 9<br />
1.4 Production of monoclonal antibodies. 12<br />
1.4.1 Ascites. 12<br />
1.4.2 In vitro production methods. 13<br />
1.4.2.1 Immobilised cell systems. 14<br />
1.4.3 Assessment of bloreactor types. 18<br />
1.5 Hybridoma growth and production kinetics.<br />
1.6 The effect of the environment on cell growth and<br />
6<br />
, 20<br />
antibody production. 23<br />
1.6.1 Carbohydrates and cell growth. 23<br />
1.6.2 The effect of glucose and lactate on<br />
antibody production. 25<br />
1.6.3 Amino acid metabolism.<br />
1.6.4 The effect of glutamine on antibody<br />
production. 31<br />
1.6.5 The effect of ammonia on cell growth<br />
and antibody production. 32<br />
1.6.6 Oxygen requirements by animal cells<br />
in culture.<br />
26<br />
33
1.6.7 The effect of oxygen on antibody<br />
production.<br />
1.6.8 The effect of pH on cell growth and<br />
antibody production. 36<br />
1.6.9 The role of serum in cell growth. 37<br />
1.6.10 The effect of serum on cell growth and<br />
antibody production. 40<br />
1.7 Cell cycle-related changes in protein expression. 41<br />
1.8 Summary and objectives. 44<br />
Chapter 2. Materials and methods.<br />
2.1 Cell culture.<br />
2.1.1 Cell line. 46<br />
2.1.2 Media. 46<br />
2.1.3 Cell culture. 47<br />
2.1.4 Cryopreservation. 47<br />
2.2 Assay techniques. 48<br />
2.2.1 Glucose determination. 48<br />
2.2.2 Lactate determination. 49<br />
2.2.3 Ammonia determination. 50<br />
2.2.4 Glutamine determination. 51<br />
2.2.5 <strong>An</strong>tibody determination. 52<br />
2.3 Purification and characterisation of the 321<br />
antibody standard. 54<br />
35<br />
46
2.3.1 Preparation of paraquat-AH Sepharose<br />
affinity column. 54<br />
2.3.2 Affinity purification of the 321 antibody. 56<br />
2.3.3 Determination of the protein content of<br />
pooled fractions. 56<br />
2.3.4 Determination of the antibody purity by<br />
SDS-polyacrylamide gel electrophoresis. 5;<br />
2.3.5 Assessment of antibody purity by high<br />
performance liquid chromatography. 62<br />
Chapter 3. The automated assay system.<br />
3.1 Requirements for an automated assay system. 65<br />
3.1.1 Methods for the monitoring of product<br />
formation in fermenters. 66<br />
3.2 Immunosorbent preparation. 69<br />
3.2.1 Preparation of the IgG fraction from<br />
sheep serum. 69<br />
3.2.2 Coupling antibody to Sepharose CL4B. 70<br />
3.2.3 Assessment of the Immunosorbent in the<br />
ELISA. 74<br />
3.2.4 Continuous flow ELISA. 77<br />
3.3 The automated assay. 82<br />
3.3.1 Computer operation of the assay. 85
3.3.2 Sequence of events during the automated<br />
assay.<br />
3.4 Optimisation of the automated assay. 87<br />
3.4.1 Determination of the optimum labelled<br />
antibody dilution. 87<br />
3.4.2 Buffer composition. 87<br />
3.5 Assay performance. 98<br />
3.6 The use of the automated ELISA for monitoring<br />
bioreactors. 101<br />
3.6.1 Column compression. 101<br />
3.6.2 On-line sampling of the bioreactor. 104<br />
3.7 Conclusions. 107<br />
Chapter 4. Hybridoma growth and antibody production kinetics in<br />
batch culture.<br />
4.1 Introduction. 109<br />
4.2 Materials and methods. 110<br />
4.3 Results., 110<br />
4.3.1 Hybridoma growth and antibody production in,<br />
static flasks. 110<br />
4.3.2 Hybridoma growth and antibody production<br />
in stirred batch culture. 113<br />
4.3.3 The effect of glutamine on cell, growth<br />
and antibody production.. 118<br />
86
4.3.4 The effect of pH on cell growth and<br />
antibody production. 124<br />
4.3.5 The effect of serum on cell growth and<br />
antibody production. 125<br />
4.3.6 The effect of excess thymidine on cell<br />
growth and antibody production. 132<br />
4.3.7 The effect of glutamine concentration on<br />
thymidine-blocked cells. 135<br />
4.3.8 The effect of pH on thymidine-blocked<br />
cells.<br />
4.3.9 The effect of serum concentration on<br />
137<br />
thymidine-blocked cells. 141<br />
4.4 Discussion. 141<br />
Chapter 5. Continuous culture.<br />
5.1 Introduction. 151<br />
5.2 Materials and methods. 153<br />
5.2.1 Apparatus for the continuous culture of<br />
hybridoma cells. 153<br />
5.2.2 Continuous culture. 154<br />
5.2.3 Metabolic quotients. 156<br />
5.3 Results. 158<br />
5.3.1 Establishment of steady state growth. 158<br />
5.3.2 The effect of the specific growth rate on<br />
the metabolism of the 321 hybridoma. 161
5.3.2.1<br />
5.3.2.2<br />
5.3.2.3<br />
5.3.2.4<br />
5.3.3 Hybrido<br />
5.4 Discussion.<br />
Cell numbers and viability. 161<br />
Glutamine and ammonia. 167<br />
Glucose and lactate. 168<br />
<strong>An</strong>tibody. 168<br />
ma stability.<br />
Chanter 6. Synchronised culture.<br />
6.1 Introduction.<br />
168<br />
170<br />
180<br />
6.1.1 Physical selection methods. 182<br />
6.1.2 Growth arrest. 183<br />
6.2 Material s and methods.<br />
6.3 Results.<br />
184<br />
6.2.1 Synchronisation of the 321 hybridoma. 184<br />
6.2.2 Radiolabelling of proteins. 185<br />
6.2.3 Radiolabelling of DNA. 185<br />
6.2.4 SDS-polyacrylamide gel electrophoresis. 186<br />
6.3.1 Determination of the S-phase 186<br />
6.3.2 Cell synchronisation. 187<br />
6.3.3 The incorporation of 35 S-methionine into<br />
antibody.<br />
194<br />
6.3.4 The effect of pH on the cell cycle. 197<br />
6.4 Discussion.<br />
6.5 Conclusions.<br />
201<br />
209
Chapter 7. Summary and Recommendations.<br />
7.1 Summary. 211<br />
7.2 Recommendations. 218<br />
References. 221<br />
Appendices.<br />
Appendix I. Solenoid interface. 251<br />
Appendix II. Automated ELISA control program. 252<br />
Appendix III. Cross-flow filter. 258<br />
Appendix IV. The determination of the volumetric mass<br />
transfer coefficient (K,. a) for oxygen in<br />
the Gallenkamp fermenter. 259
1.1 <strong>An</strong>imal cell culture.<br />
Chapter 1<br />
Introduction<br />
The earliest reports of explanted tissue being maintained and<br />
studied in vitro date back to the late 19th century when Wilhelm Roux<br />
(1885) maintained chick embryo tissue for several days in warm saline<br />
and Arnold (1887) studied the movements of isolated frog leukocytes<br />
maintained in lymph-soaked elder pith over a period of 4-5 days.<br />
However the work <strong>that</strong> stimulated most interest in tissue culture was<br />
a study on growth of nerve cells in lymph clots carried out by<br />
Harrison in 1907. Subsequent work by Carrel and colleagues (Carrel<br />
and Burrows, 1911; Burrows, 1912; Lewis and Lewis, 1912) led to<br />
refinements in salt and amino acid composition in culture media<br />
containing plasma or clotted lymph as growth promoting supplements.<br />
The first report of serial propagation followed in 1916 when Rous and<br />
Jones dispersed chick embryo cells from tissue and grew them in a<br />
plasma clot. They were able to redisperse the cells using trypsin and<br />
there was subsequent regrowth. These early studies demonstrated <strong>that</strong><br />
the structural organisation and physiology of tissues could be<br />
investigated by in vitro culture techniques and in the next decade<br />
studies on cell metabolism established <strong>that</strong> the energy requirements of<br />
cell were provided by glucose (Lewis, 1922; Warburg, 1930) and/or the<br />
deamination of amino acids (Holmes and Watchorn, 1927; Warburg and<br />
Kubowitz, 1927). The quantitative oxygen requirements of cells were<br />
also examined at this time (Warburg and Kubowitz, 1927).<br />
In the 1930s and 1940s there were many studies concerned with<br />
1
the identification of the essential amino acid, vitamin and inorganic<br />
components in plasma, lymph or serum which were the principle media<br />
for tissue culture at <strong>that</strong> time. This resulted in the development of<br />
media with defined components (Fisher et al., 1948; White, 1949;<br />
Morgan et al., 1950; Earle et al., 1951) and culminated in Eagles<br />
painstaking determination of the essential amino acid and vitamin<br />
requirements for several mammalian cell lines (Eagle, 1955a; Eagle,<br />
1955b). Modifications of these early media are still extensively used<br />
today.<br />
Since those initial studies tissue culture has proved to be a<br />
valuable tool for the study of animal cell physiology. Following the<br />
discovery by Enders in 1949 <strong>that</strong> poliomyelitis virus could be grown In<br />
primary cell cultures, cell culture has also been used in virus<br />
propagation and vaccine production. Indeed the large scale use of<br />
animal cell cultures for the production of biological material was<br />
largely confined to virus vaccine production until relatively recently<br />
despite the obvious therapeutic potential of many mammalian proteins<br />
which have been discovered In tissues. However the production of large<br />
quantities of proteins from normal tissues Is often limited by the<br />
availability of the appropriate tissue. the low concentrations present in<br />
tissues and loss of protein during purification. The large scale<br />
production of proteins from cultured normal cells is limited by the finite<br />
lifespan of normal cells in vitro. It was therefore considered <strong>that</strong> the<br />
future of large scale production of human proteins lay with genetically<br />
engineered bacteria and while biologically active proteins such as<br />
insulin (Johnson, 1983) and human growth hormone (Hsuing et al., 1986)<br />
have been produced in large quantities from Escherichla cola, there are<br />
many problems associated with the expression of mammalian proteins in<br />
2
acteria. For example bacteria are unable to carry out post translational<br />
modifications such as glycosylation, phosphorylation and signal peptide<br />
cleavage which may affect the activity or solubility of the product. The<br />
proteins may also be Incorrectly folded or present in a denatured form<br />
(Williams et al., 1982; Marston, 1986; Kenealy et al., 1987). While lower<br />
eukaryotes such as yeast can glycosylate and secrete proteins, the<br />
glycosylation pattern and protein folding may be Incorrect (Ballou, 1982;<br />
Kingsman et al., 1987) and low product activities have been reported<br />
(Wood et al., 1985). It has therefore become apparent <strong>that</strong> while a<br />
number of biologically active proteins have been produced in yeast and<br />
bacteria (Berman and Lasky, 1985; Kingsman et al., 1987). proteins such<br />
as erythropoietin, which rely on correct post translational modification<br />
for their activity (Dube et al., '1988), may only be effectively expressed<br />
in mammalian cells. Furthermore the potential for large scale protein<br />
production by animal cells has been advanced by a number of recent<br />
developments in mammalian cell technology.<br />
The first of these was the development of the hybridoma by<br />
Kohler and Milstein in 1975. The potential of monoclonal antibodies as<br />
therapeutic and diagnostic agents was quickly realised and led to the<br />
development of large scale culture processes to provide. sufficient<br />
material for clinical -testing. Secondly the finding <strong>that</strong> a number of<br />
continuous cell lines constitutively express useful therapeutic proteins<br />
has led to the development of large scale culture processes for the<br />
production of proteins such as tPA from human melanoma cells (Kluft et<br />
al., 1983) and a-interferon from Namalwa cells (Phillips et al., 1985;<br />
Lazar et al., 1987). More recently the development of techniques for the<br />
expression of recombinant human protein in -mammalian cell lines<br />
(Ringold et al., 1981; Lubiniecki, 1987; Bebbington and Hentschel, 1987)<br />
3
has greatly increased the potential for the production of proteins from<br />
mammalian cell cultures.<br />
The main concern with the use of continuous cell lines is the<br />
perceived risk of the transfer of material with tumorigenic potential to<br />
the recipient since some transforming viral genes and activated<br />
oncogenes can transform cells in. vitro (Bishop. 1983; Diderholm et al..<br />
1965) and cause tumours in vivo (Fung et al.. 1983; Israel et al.. 1979).<br />
However improved techniques for the detection of residual nucleic acids<br />
(Van Wezel et al.. 1982) and favourable assessments of the risks<br />
involved (Petricianni. 1987; Ramabhadran. 1987) have led to an<br />
increasing acceptance of products derived from continuous cell lines for<br />
human therapy. The market value of such products is high and animal<br />
cell products also have potential applications In research, diagnostics<br />
and biochemical purification. Comprehensive reviews of current and<br />
potential applications of mammalian cell technology may be found in the<br />
reports of Spier and Horaud (1985), Lubiniecki (1987), Mizrahl (1988)<br />
and Spier (1988) and some examples of these applications are presented<br />
in table 1.1.<br />
This investigation however concentrates on the production of<br />
monoclonal antibodies by hybridoma cell cultures. This system was<br />
chosen for study for several reasons.<br />
1) <strong>Monoclonal</strong> antibodies have potential in a number of fields<br />
including therapeutic medicine. There is therefore a requirement for the<br />
large scale production of antibodies by hybridomas. The design and<br />
optimisation of such processes will be facilitated by an analysis of the<br />
factors which influence antibody production by hybridomas.<br />
ii) Hybridomas grow readily in homogeneous suspension culture which<br />
is amenable to conventional fermentation techniques.<br />
4
Table 1.1. Current and potential products fron cultured animal cells.<br />
Viral vaccines Spier 1983<br />
Recombinant<br />
viral antigens<br />
hepatitis B surface antigen<br />
Spier and Horaud, 1985<br />
Mizrahi, 1988<br />
Crowley et a1., 1983<br />
herpes simplex g1ya)protein D Berman et al. 1985<br />
Immunoregulatory proteins<br />
interferans, interleukins<br />
<strong>Monoclonal</strong> antibodies<br />
Polypeptide growth factors<br />
Enzymes<br />
Hormones<br />
tPA<br />
factor ü<br />
factor VIII<br />
Shoham, 1983<br />
Phillips et al., 1985<br />
Klein et al., 1983<br />
Kris et al., 1985<br />
Kadouri and Bohak, 1985<br />
Kaufman et al. 1985<br />
<strong>An</strong>son et al., 1985<br />
Toole et al. 1984<br />
Wood et al. 1984<br />
erythropoietin Jacobs et al. 1985<br />
Viral insecticides<br />
Katinger and Bliem, 1983<br />
baculoviruses Miltenberger and Krieg, 1984<br />
71iatr specific antigens<br />
carcinoembryic antigen<br />
<strong>An</strong>imal cells as products<br />
reconstitution of skin<br />
5<br />
Kim et a1., 1985<br />
Reuveny et a1., 1987<br />
Green et al. 1979<br />
Bell et al. 1983
ill) Hybridomas secrete a product <strong>that</strong> is readily detected and<br />
characterised by existing assay techniques.<br />
1.2 The B-cell hybridoma.<br />
The B-cell hybridoma is the result of a cell -fusion between a<br />
B-lymphocyte which secretes antibody and a myeloma cell line which<br />
confers immortality to the resulting fusion product. In accordance with<br />
Burnet's clonal selection theory for antibody production by<br />
B-lymphocytes (Burnet, 1957). It is possible to select a single hybridoma<br />
clone producing antibodies of uniform specificity. The hybridisation<br />
technique was developed by Kohler and Milstein in 1975 and has since<br />
become a widely used technique in research. Detailed descriptions of the<br />
technique may be found in several reviews and books (Milstein, 1980;<br />
Fazekas de St Groth and Scheidegger, 1980; Goding, 1983; Campbell,<br />
1984; Epstein and Epstein, 1986) therefore only the basic principles will<br />
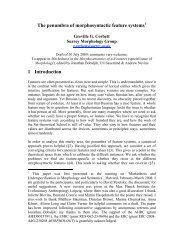
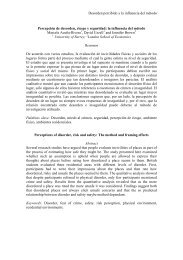
be outlined below (see figure 1.1).<br />
To produce a hybridoma secreting an antibody of the desired<br />
specificity an animal (usually a mouse) is Immunised with the antigen<br />
of interest although in vitro immunisation techniques are also used<br />
(James and Bell, 1987; Borrebaeck. 1987). B-lymphocytes, a proportion<br />
of which will be secreting antibody to the antigen, are harvested from<br />
the spleen, and fused with a cultured myeloma cell line. Kohler and<br />
Milstein used Sendai virus to promote cell fusion but the use of<br />
polyethylene glycol (Davidson et al., 1976) is more convenient and Is<br />
more commonly used today. Improved fusion efficiencies have been<br />
claimed for electrofusion<br />
(Zimmerman et al., 1985).<br />
6
Figure 1.1. The principles of hybridoma production<br />
EýS:<br />
Cultured myeloma<br />
Mouse immunised<br />
with antigen<br />
a<br />
B-lyrrphocytes harvested<br />
from spleen<br />
HPRT<br />
- Cell fusion<br />
oooo0<br />
0ö 0 08<br />
Hybridomas selected<br />
with HAT medium<br />
(promoted by PEG)<br />
Screen for cells producing<br />
desired antibody<br />
Select by cloning<br />
7
The fusion partner is a myeloma cell line which is deficient in the<br />
enzyme hypoxanthine phosphoribosyl transferase (HPRT). This enzyme<br />
is part of a salvage pathway which utilises hypoxanthine in the absence<br />
of de novo purine synthesis. Cells lacking HPRT are unable to<br />
synthesize purines from hypoxanthine and will die in the presence of<br />
aminopterin (a folate antagonist which blocks the de novo synthesis of<br />
purines and pyrimidines). Normal B-cells which possess both the<br />
enzymes thymidine kinase (TK) and HPRT can synthesize both purines<br />
from hypoxanthine and pyrimidines from thymidine but are unable to<br />
proliferate in vitro. Successful B-cell myeloma fusions may therefore be<br />
selected by their ability to proliferate in HAT medium which contains<br />
hypoxanthine, aminopterin and thymidine (Littlefield, 1964).<br />
It is then possible to screen the hybridomas for secretion of<br />
the desired antibody by immunoassay and subsequent selection and<br />
cloning will result in a single hybridoma clone producing monoclonal<br />
antibody.<br />
The monoclonal antibody has a number of advantages over more<br />
conventional polyvalent antisera.<br />
I) The antigen binding site Is uniform in its specificity and affinity<br />
whereas polyvalent antisera contain a population of antibodies from<br />
several B cell clones which have a variety of antigen affinities and<br />
specificities.<br />
ii) It is possible to use relatively<br />
Impure antigens In the immunisation<br />
of animals for monoclonal antibody preparation because cells producing<br />
the desired antibody can be selected after cloning. The production of<br />
a polyvalent antiserum requires <strong>that</strong> the antigen is of the highest<br />
purity to ensure <strong>that</strong> the greatest proportion of antibodies are directed<br />
8
towards the desired determinants.<br />
ill) The monoclonal antibody, which can be produced in unlimited<br />
quantities, is highly consistent in its properties whereas the quality of<br />
polyvalent antiserum varies from animal to animal and between<br />
bleedings of the same animal.<br />
1.3 Applications for monoclonal antibodies.<br />
The main use of monoclonal antibodies to date has been in the<br />
fields of research and diagnostics. The increasing use of<br />
diagnostic and assay kits in medicine has resulted in a demand for<br />
highly specific and reproducible reagents. The monoclonal antibody<br />
fulfils both these criteria. Furthermore the unique specificity of the<br />
monoclonal antibody has allowed research to progress into areas which<br />
would prove too rigorous for conventional antisera. Such areas include<br />
the identification of tumour-specific antigens (Schlom and Weeks,<br />
1985), the delineation of closely related cell types such as lymphocytes<br />
(Van Wauwe et al., 1981; Talle et al., 1983), cell receptor studies<br />
(Goldfine et al., 1985) and studies on the antigenic variation of viruses<br />
(Wiktor and Koprowski, 1978; Gerhard et al.. 1981). The application of<br />
monoclonal antibodies in these fields has been reviewed extensively<br />
(see for example Epstein et al., 1986) and will not be considered further.<br />
<strong>An</strong>other growing area is the use of monoclonal antibodies for the<br />
purification of valuable biologically active substances by<br />
immunoaffinity chromatography. This enables the highly specific<br />
separation of a product which may be present In low quantities and<br />
heavily contaminated by other substances. Industrial processes have<br />
been described for the separation of hepatitis B surface antigen (as<br />
9
eported by Spier, 1983) and interferon (Secher and Burke, 1980).<br />
The potential of monoclonal antibodies In therapeutic medicine has<br />
attracted a considerable amount of attention. The use of monoclonal<br />
antibodies for passive immunisation is attractive because, at present,<br />
antibodies have to be fractionated from immune sera from humans or<br />
animals with the risk of transfer of infectious agents. There are now<br />
human monoclonal antibodies to bacterial, viral and parasite antigens<br />
(James and Bell, 1987) with obvious potential in the treatment of<br />
resistant or highly virulent organisms. The potential for such treatment<br />
has already been demonstrated in the veterinary field by the use of<br />
monoclonal antibodies against E. cola K99 antigen to prevent diarrhoea<br />
in neonatal calves (Sadowski, 1982).<br />
Target-directed drug therapy has also received considerable<br />
attention in recent years due primarily to its potential for the<br />
treatment of cancer. <strong>Monoclonal</strong> antibodies raised against tumour<br />
associated antigens may be conjugated to toxins such as abrin or ricin<br />
which will then selectively destroy cells bearing those antigens (Youle<br />
and Neville, 1980; Gilliland et al., 1980; Lord et al.. 1985; Vitetta et<br />
al.. 1987). This technique may be especially useful in autologous bone<br />
marrow transplants for the removal of tumour cells (Krolick et a!.,<br />
1982; Bast et a!.. 1983) or in allogeneic transplantation to remove<br />
T-cells from donor marrow so reducing the incidence of graft versus host<br />
disease (Vallera eta!.. 1982). Successful treatment of acute graft versus<br />
host disease In humans by the use of ricin conjugated antibody to the<br />
CD5 antigen on T-lymphocytes has also been reported (Kernan et al.,<br />
1988). Isotopically labelled antibodies to tumour antigens have been<br />
used to image tumours in vivo (Buchegger et a!., 1983) and studies are<br />
now in progress to determine the effectiveness of isotope-labelled<br />
10
antibodies in tumour therapy (Byers and Baldwin, 1988). Unmodified<br />
antibodies may also be useful as therapeutic agents and some success in<br />
the treatment of B-cell tumours using anti-idlotypic monoclonals has<br />
been reported (Miller et al., 1982; Lowder et al., 1987). Unmodified<br />
anti-T-cell receptor antibodies (OKT3) have also been used to prevent<br />
renal graft rejection presumably by preventing lymphocyte-antigen<br />
interactions (Goldstein et al., 1985).<br />
Most clinical trials to date have used murine monoclonal antibodies<br />
(Byers and Baldwin, 1988) but successful treatment has so far been<br />
limited by the generation of an immune response to murine antibody<br />
which often precludes continued treatment (Levy and Miller, 1983;<br />
Jaffres et al., 1986). The use of human monoclonal antibodies would<br />
alleviate this problem but is limited by the difficulties in producing<br />
human antibodies to tumour antigens (James and Bell, 1987). Recent<br />
development of chimeric antibodies containing either human constant<br />
and mouse variable regions (Morrison et al., 1984; Boulianne et al., 1984;<br />
Morrison, 1985) or rat hypervariable regions inserted into a human<br />
antibody (Riechmann et al., 1988) may soon overcome these problems.<br />
A further potential application for monoclonal antibodies is in their<br />
use as anti-idiotype vaccines. <strong>An</strong>ti-idiotypic antibodies which are<br />
raised against the antigen binding site of a second antibody, can mimic<br />
the conformation of the antigen recognised by the second antibody. Such<br />
antibodies thus have the potential to act as immunogens and could be<br />
used as vaccines (Reagan et a1., 1983; Kaufmann et al., 1985).<br />
The realisation of the potential of monoclonal antibodies for<br />
diagnostic and therapeutic products will require the production of large<br />
amounts of antibody. Diagnostic assays may' only require microgram<br />
quantities of antibody for individual tests but could consume gram<br />
11
quantities of antibody if used in large scale screening such as in ABO<br />
blood typing (Voak and Lennox, 1983). In vivo imaging applications and<br />
immunotherapy may require tens of kilograms assuming <strong>that</strong> each<br />
patient may require several hundred micrograms for imaging (Mach et<br />
al., 1981) and several hundred milligrams during treatment (Miller et al.,<br />
1982). Furthermore as the economics for large scale production of<br />
monoclonal antibodies improve then kilogram quantities of antibodies<br />
could be consumed in biochemical purification processes. It has<br />
therefore been predicted <strong>that</strong> the market for monoclonal<br />
antibodies will increase substantially in the next decade (Ratafia, 1987;<br />
Spier, 1988) Illustrating a real need for an efficient production system<br />
to meet such a demand.<br />
1.4 Production of monoclonal antibodies.<br />
1.4.1 A scites.<br />
Hybridomas can be grown as tumours in the peritoneal cavity of<br />
histologically compatible mice and the antibody harvested from ascitic<br />
fluid at concentrations of 5-20 mg/ml. A single mouse might produce up<br />
to 15m1 of ascitic fluid before succumbing to the tumour (Hurrell, 1982).<br />
There are however several disadvantages in the use of rodents to<br />
expand monoclonal antibodies production.<br />
1) Mouse ascites may contain contaminating antibodies from the host.<br />
Other detrimental proteins such as proteases may also be present.<br />
ii) Mouse adventitious agents may be present in ascitic fluid.<br />
iii) Human hybridomas are difficult to propagate in rodents.<br />
iv) Large scale applications would require large numbers of mice. The<br />
lack of the economy of scale and process control would have to be<br />
12
considered in addition to any ethical objections to such a production<br />
process.<br />
For these reasons many workers are investigating the in vitro<br />
production of monoclonal antibodies and because hybridomas grow<br />
readily in suspension culture many of the culture techniques used for<br />
the propagation of microorganisms have been applied to the large scale<br />
culture of hybridoma cells.<br />
1.4.2 invitro production methods.<br />
The stirred tank reactor has already been used extensively for<br />
both research and production scale cultivation of mammalian cells. the<br />
largest to date being an 80001 reactor for the production of<br />
lymphoblastoid interferon (Phillips et al., 1985). As yet the use of large<br />
scale homogeneous stirred tank systems for the production of monoclonal<br />
antibodies is limited but Celltech have pioneered the use of a 10001<br />
airlift reactor for the commercial production of monoclonal antibodies.<br />
Using this system Birch et al. (1985a) claim to produce an average of<br />
150g of antibody in a typical run. This fermenter has now been scaled up<br />
to 20001 and is used for the production of both antibodies and<br />
recombinant proteins by mammalian cells (Rhodes and Birch, 1988).<br />
The concentration of product in a homogeneous suspension culture<br />
is limited by the maximum cell density <strong>that</strong> can be achieved in such a<br />
system before either nutrients are exhausted or toxic products become<br />
inhibitory. This is typically 1-2 x 10⁶ cells/ml for a hybridoma and<br />
antibody titres ranging from, 20-200 jig/ml can be obtained (see for<br />
example, Reuveny et al., 1985; Birch et aL. 1985a; Fazekas de St Groth,<br />
1983). However, increased cell densities may be achieved by perfusing<br />
13
the culture with fresh medium. The increased nutrient supply and the<br />
removal of toxic metabolites extends the production phase of a culture.<br />
Himmelfarb and colleagues (1969) showed <strong>that</strong> higher cell densities<br />
could be obtained in perfused culture in which cells were retained by<br />
removing waste medium through a spinning filter device. The high shear<br />
force generated at the surface of the spinning filter alleviated the<br />
blocking which occured with static filters.<br />
Variations on the spinning filter device have been adopted for the<br />
production of monoclonal antibodies (Tolbert et a)., 1985; Reuveny et<br />
al., 1986b). These authors have reported hybridoma densities of up to<br />
3x10⁷/ml and increased antibody titres in the effluent stream (50-500<br />
fg/ml). However filter blockage still occured after several days of<br />
culture and it was necessary to replace the filters regularly to maintain<br />
long term cultures spanning several weeks.<br />
1.4.2.1 Immobilised cell systems.<br />
The relative fragility of animal cells and the low product<br />
densities experienced in homogeneous suspension cultures has led to<br />
research into the use of immobilised cell systems for high density cell<br />
culture. Immobilised cells are not exposed to the hydrodynamic stresses<br />
experienced In agitated systems and are separated from the medium<br />
which facilitates medium perfusion and downstream processing.<br />
1) The entrapment of cells within porous matrices.<br />
A number of techniques have been applied to the immobilisation<br />
of cells in porous beads using materials such as alginate (Nilsson and<br />
Mosbach. 1980) or agarose (Nilsson et al.. 1983; Katinger and Sheirer.<br />
1985). These materials retain cells but nutrients and products may<br />
14
diffuse freely.<br />
Although hybridoma cells are non-adherent, materials with more<br />
open pore structures have also been successfully used for hybridoma<br />
immobilisation. In these systems it appears <strong>that</strong> cells settle within the<br />
tortuous network of channels and subsequent outgrowth prevents the<br />
cell mass becoming dislodged. Hybridoma densities approaching 108<br />
cells/cm3 of matrix were observed in fibrous collagen beads (Karkare et<br />
al, 1985). A variety of materials including polymer foams have also been<br />
investigated for their effectiveness In entrapping hybridoma cells<br />
(Lazar et a!.. 1987, Murdin et a!.. 1987). Packed beds were used in these<br />
investigations but problems with mass transfer due to channeling and<br />
cell outgrowth have been reported in packed beds (Karkare et al, 1985).<br />
Karkare and colleagues therefore favour a fluidised bed system using<br />
weighted collagen beads which allow higher medium flow rates and<br />
improved mass transfer. Bubble columns, air lift and stirred reactors<br />
have also been used for the cultivation of immobilised cells (Himmler et<br />
al., 1985).<br />
A different approach utilises a ceramic matrix perforated by a<br />
number of uniform square channels (Lydersen et al., 1985). Hybridomas<br />
proliferate in the porous walls of the ceramic matrix and medium is<br />
supplied through the channels allowing the system to operated for<br />
extended periods.<br />
All the systems described above allow free passage of the product<br />
into the medium and result in product titres which are often no higher<br />
than those achieved in homogeneous suspension culture.<br />
ii) Encapsulation.<br />
Cellular microencapsulation using poly-l-lysine membranes was<br />
first described by Lim and Sun (1980), who used encapsulated islets as<br />
16
an artificial pancreas. Microencapsulation has since been used for a<br />
number of cell lines (Jarvis and Grdina, 1983).<br />
Damon Biotech Incorporated have adopted this technology for the<br />
production of monoclonal antibodies (Rupp, 1985). The use of a<br />
poly-l-lysine capsule with a molecular weight cut off of 8OkD means<br />
<strong>that</strong> antibody is retained within the capsule while low molecular weight<br />
nutrients and waste products can diffuse freely across the membrane.<br />
The advantages of this system are <strong>that</strong> cells are protected from<br />
environmental stress and antibody reaches high concentration (5mg/mi<br />
capsule volume). As this may represent up to 50% of the total<br />
Intracapsular protein, product recovery during downstream processing<br />
is therefore improved. However there are disadvantages to such a<br />
system, which is essentially a batch process, because the capsules must<br />
be ruptured to harvest the antibody. The manufacture of microcapsules<br />
is a complex process and the scale up of such a system would be limited<br />
by the capacity to manufacture large numbers of microcapsules.<br />
iii) Hollow fibres.<br />
The use of capillary systems for the growth of animal cells was<br />
first described by Knazek et al. (1972) and subsequently developed by<br />
Amicon. In this configuration cells are grown in the spaces between a<br />
tightly packed bundle of hollow fibres. Medium is pumped through the<br />
porous fibres and nutrients diffuse<br />
, into the, extracapillary space.<br />
Likewise waste metabolites diffuse into the capillaries and are removed<br />
by the medium stream. Cells can be grown to high density (> 108 /ml) in<br />
conditions which are similar to those experienced by tissues in vivo.<br />
Several cell types have been successfully cultured in these systems<br />
(see review by Hopkinson, 1985) and since 1981 the hollow fibre sytem<br />
has been used for both human and mouse monoclonal antibody<br />
16
production (Calabresi et al.. 1981; Wlemann et al., 1983; Altshuler et al..<br />
1986; Schonherr et al., 1987). High concentrations of antibody can be<br />
achieved in the extra-capillary space when low molecular weight cutoff<br />
(10-100 kDaltons) membranes are used and unlike microcapsules<br />
antibody can be harvested continuously or intermittently from the<br />
extra-capillary space. The process is therefore continuous and can be<br />
operated for several months.<br />
The hollow fibre systems described above have a closed shell and<br />
medium and waste products across the membrane by diffusion. <strong>An</strong><br />
important limitation of this configuration is the formation of nutrient<br />
and metabolite gradients along the length of the fibre bundle due to high<br />
cell densities (Ku et al., 1981) and due to the pressure gradient which<br />
exists in such systems (Tharakan and Chau, 1985a). These effects can<br />
be reduced to some extent by increasing flow rates and, periodically<br />
reversing the direction of flow (Hopkinson, 1986). Improved mass<br />
transfer has been reported in cross flow systems where medium is<br />
delivered from the shell side and exits through the fibre lumen (Ku et<br />
aL, 1981; Tharakan and Chau, 1985b) while In other systems the_ use of<br />
pressure cycling ensures <strong>that</strong> medium passes back and forth across the<br />
fibre wall and hence give mass transfer rates higher than <strong>that</strong> of<br />
diffusion alone.<br />
Other reactors use ultrafiltration membranes as in hollow fibre<br />
reactors but the cells are sandwiched between flat membranes (Seaver<br />
and Gabriels, 1985). Klement et al. (1987) have modified the design<br />
further to incorporate different porosity membranes which allow the<br />
separation of cells, medium and product into different compartments.<br />
Such systems could incorporate several layers of membranes to facilitate<br />
scale-up.<br />
17
1.4.3 Assessment of bioreactor types.<br />
The type of bioreactor employed for a particular application<br />
depends on the properties of the cell and the scale of the process.<br />
Several authors have reviewed aspects of fermenter design for the scale<br />
up of animal cell production processes (Glacken et al., 1983; Lambe and<br />
Walker, 1987; Katinger and Scheirer, 1985; Hu and Dodge, 1985; Merten,<br />
1988). Merten has assessed reactor design based on the properties of the<br />
cell line namely. shear sensitivity, production kinetics and genetic<br />
stability and these parameters will be discussed for hybridoma cells.<br />
V Shear sensitivity.<br />
Fazekas de St Groth (1983) found <strong>that</strong> hybridoma cell doubling<br />
times in stirred suspension culture increased as agitator speeds<br />
approached 100 rpm but noted some variation in the sensitivity of<br />
different hybridoma lines to high stirrer speeds. Other authors have<br />
found little effect on hybridoma growth at stirrer speeds in excess of<br />
100rpm (Boraston et al., 1984; Dodge and Hu, 1987). This suggests <strong>that</strong><br />
many hybridoma lines are less sensitive to shear than has been supposed<br />
and are thus amenable to suspension culture techniques.<br />
ii) Production kinetics.<br />
The production kinetics for a particular protein will have a<br />
profound effect on the design of a production process depending on<br />
whether the product is growth-associated, non growth-associated or<br />
subject to feedback regulation. Feedback regulation would preclude the<br />
use of product retention systems described above. Growth-associated<br />
production kinetics would be favoured by rapid growth rates precluding<br />
18
the use of immobilised cell systems where growth is restricted. However<br />
in hybridomas the production of antibody is not growth associated and<br />
antibody production continues in the absence of cell proliferation (Birch<br />
et al., 1985b; Miller et al., 1988a). Furthermore, there is no evidence of<br />
feedback regulation of antibody production in hybridomas (Fazekas de<br />
St Groth. 1983). These production kinetics would be compatible with high<br />
cell densities and product retention systems.<br />
iii) Genetic stability.<br />
Merten (1988) has suggested <strong>that</strong> cell retention systems which<br />
restrict cell growth but allow extended production periods would be<br />
preferable for genetically unstable cell lines. The loss of genetic<br />
material during cell replication could be minimised In such systems.<br />
The stability of hybridoma lines varies considerably but several<br />
hybridoma lines have been maintained in culture for long periods of time<br />
without any apparent changes in the production characteristics (see for<br />
example Low and Harbour, 1985a; Birch et al. 1985b; Bree et al., 1988).<br />
It would appear <strong>that</strong> the properties of hybridoma cells do not<br />
preclude any of the production methods described and the design of the<br />
process must ultimately<br />
be centred upon the economics of the process.<br />
Stirred suspension culture systems are unit processes and benefit from<br />
the economy of scale, but low product concentrations increase the<br />
complexity of downstream processing. The high density product<br />
retention systems yield a more concentrated product which improves<br />
product recovery but scale up of such processes is often limited to an<br />
increase in the number of units and thus economy of scale cannot be<br />
realised. However cells grown at high density may have a reduced<br />
requirement for certain medium components such as serum (Hopkinson,<br />
1985; Reuveny et al., 1987) and thus make a more economical use of<br />
19
medium. The high cost of mammalian cell culture medium suggests <strong>that</strong><br />
any improvement of cell or product yields by process control and/or<br />
medium design will yield more economical production systems. Such an<br />
approach requires knowledge of antibody production kinetics and cell<br />
physiology and some aspects of these are discussed in the following<br />
section.<br />
1.5 Hybridoma growth and production kinetics.<br />
Growth kinetics for hybridomas appear to follow the characteristic<br />
bacterial growth kinetics because there is a discernable lag phase<br />
followed by exponential growth and decline phases although cell<br />
doubling times are generally longer, typically 12-24 hours for mouse<br />
hybridomas.<br />
The lag phase may be due in part to the population density<br />
dependence of cell growth observed in animal cell culture. This was<br />
shown by Eagle (1962) to be a dependence upon a pool of metabolic<br />
intermediates which cells must synthesise before they can divide. The<br />
result is <strong>that</strong> there is a minimum population which will condition the<br />
medium sufficiently to support cell growth. Eagle demonstrated <strong>that</strong> by<br />
adding various metabolic intermediates the population density<br />
dependence could be reduced.<br />
Maximum cell densities achieved in static or stirred batch cultures<br />
is generally 106 cells/ml (Boraston et al., 1984; Reuveny et al., 1987)<br />
but this figure can be doubled by batch feeding and improved medium<br />
design (Rhodes and Birch, 1988).<br />
Various observations on the production kinetics for monoclonal<br />
20
antibodies suggest <strong>that</strong> the antibody production rate is independent of<br />
growth rate. For example a number of authors have observed- <strong>that</strong><br />
antibody production continues into the stationary phase and In a<br />
number of cases It has been observed <strong>that</strong> specific antibody production<br />
rates are maximal during the stationary phase (Fazekas de St Groth,<br />
1983; Boraston et al., 1984; Reuveny et al., 1985; Birch et al., 1986). In<br />
contrast some hybridoma lines show a decreasing specific production<br />
rate as they approach stationary phase (Lavery et al., 1985) and are<br />
characteristically low producers. The latter production kinetics may be<br />
due to some inhibition mechanism as postulated by Merten et al. (1985)<br />
who showed <strong>that</strong> the addition of spent medium to the culture greatly<br />
reduces the specific production rate of antibody in these cells. This<br />
effect seemed to be highly specific in <strong>that</strong> it could not be reproduced<br />
using spent media from other cultures or using purified mouse<br />
monoclonal antibody from other hybridomas. By contrast Fazekas de St<br />
Groth (1983) has examined a number'of hybridoma lines in continuous<br />
culture and has found no evidence of feed back Inhibition of antibody<br />
synthesis because the specific production rate for antibody' was<br />
essentially the same at cell densities between 105 and 106 /ml. '<br />
The underlying mechanism of the former production kinetics has<br />
posited two possible explanations, firstly <strong>that</strong> an intracellular pool of<br />
immunoglobulin builds up in intact cells and is released during the death<br />
phase as cell membranes are disrupted and secondly <strong>that</strong> the specific<br />
production rate increases during the stationary phase. There is<br />
conflicting evidence in <strong>that</strong> Emery et al. (1987) claim to have detected<br />
an increasing intracellular pool of immunoglobulin in some cell lines<br />
whilst Birch et a!. (1987) found no such evidence in their cell lines.<br />
Much of the evidence would tend to favour an increased production rate<br />
21
during the decline phase. It has been shown for example in perfused<br />
culture systems <strong>that</strong> a stationary cell population is achieved in which<br />
the specific antibody production rate is sustained at a higher level than<br />
during the growth phase (Van Wezel et a!., 1985; Reuveny et a!., 1986).<br />
It has also been shown <strong>that</strong> the antibody production rate is related to<br />
the number of viable cells (Velez et al., 1986; Renard et a!.. 1988) with<br />
an insignificant contribution from dying cells.<br />
It is evident from the widely ranging antibody productivities seen<br />
in different hybridoma cell lines, <strong>that</strong> the production characteristics for<br />
a hybridoma is ultimately determined by the cell line itself. This results<br />
from a combination of the parental genotypes (ie myeloma and B-cell),<br />
the differentiation state of the B-cell and any chromosome<br />
rearrangement or recombination events which take place after cell<br />
fusion (Westerwoudt, 1986). Thus it is possible <strong>that</strong> each hybridoma line<br />
possesses a unique phenotype which may be manifested as defects in cell<br />
metabolic pathways or altered production kinetics. In addition defects<br />
in the metabolism of theýmyeloma parent may be complemented by the<br />
other fusion partner. Such a phenomenon has been noted for the NS-1<br />
myeloma which has a requirement for lipids in serum-free medium<br />
whereas hybridomas derived from the NS-1 parent do not have this<br />
requirement (Kawamoto et al., 1986). The influence of the parental cell<br />
phenotype on the growth and productivity of the resulting hybrid has<br />
not been rigorously examined but it is likely <strong>that</strong> optimisation of the<br />
medium and other conditions for the production of antibody will have to<br />
be undertaken for each hybridoma line. However the effects of the<br />
environment on the growth and metabolism of cultured cell lines in<br />
general and hybridomas in particular will be discussed in the next<br />
section in an attempt to identify those factors which Influence antibody<br />
22
production.<br />
1.6 The effect of the environment on cell growth and antibody<br />
production.<br />
1.6.1 Carbohydrates and cell growth.<br />
A general review of carbohydrate metabolism may be found in<br />
the paper by Morgan and Falk (1986) in which they list carbohydrates<br />
which have been shown to support cell 'growth and discuss the major<br />
regulatory enzymes of carbohydrate metabolism.<br />
Rapidly dividing cells exhibit a high rate of glycolysis and a<br />
substantial proportion of glucose is metabolised to lactate even under<br />
aerobic conditions (Warburg. 1956; Levintow and Eagle, 1961; Roos and<br />
Loos, 1973; Reitzer et al.. 1979) and this is also true of hybridoma cells<br />
(Low and Harbour 1985; Hu et al.. 1987; Luan et al.. 1987). This was<br />
initially thought to be a characteristic of tumour cells (Warburg, 1926)<br />
and indeed there is evidence <strong>that</strong> the regulation of phosphofructokinase<br />
(a key regulatory enzyme in glycolysis) may be altered in transformed<br />
cells (Morgan and Falk. 1986) possibly due to a reduced sensitivity to<br />
feedback inhibition by ATP (Eigenbrodt et al.. 1985). However certain<br />
rapidly proliferating normal cells and cells with the potential for rapid<br />
proliferation (e. g. lymphocytes), also exhibit high rates of glycolysis.<br />
Likewise it has been found <strong>that</strong> there is no direct correlation between<br />
glucose uptake and cell yield (Eagle. 1958). This phenomenon is perhaps<br />
now resolved by recent studies concerning the contribution of other<br />
carbon sources, in particular glutamine, to energy metabolism and this<br />
subject is discussed further in a later section.<br />
It has been suggested <strong>that</strong> a possible role for the apparently<br />
23
inefficient rate of glycolysis proliferating cells is the maintenance<br />
of elevated concentrations of glycolytic intermediates, for<br />
macromolecular synthesis (Hume et al., 1977). Reitzer et al. (1979)<br />
have gone further and suggested <strong>that</strong> the primary role of glycolysis In<br />
HeLa cells was to provide precursors for nucleotide synthesis via<br />
the pentose phosphate pathway. They subsequently showed <strong>that</strong><br />
several cell lines would grow in the absence of glucose provided uridine<br />
or cytidine were present (Wice et al.. 1981).<br />
It has been observed <strong>that</strong> high glucose concentrations increase<br />
both the glucose consumption rate and the yield of lactate from glucose<br />
in several cell types (Graff. et a!., 1966; Renner et al., 1972; Glacken et<br />
al., 1986) Including hybridomas (Low and Harbour. 1985b; Hu et al.,<br />
1987; Luan et a1., 1987). Renner et al. (1972) found <strong>that</strong> at glucose<br />
concentrations less than 60pM, all of the glucose was used for<br />
macromolecular synthesis and oxidative processes with no net formation<br />
of lactate. This may be due to a change in the flux of glucose through<br />
different metabolic pathways as proposed by Reitzer et al., (1979). High<br />
concentrations of glucose lead to an increased flux through glycolysis<br />
with the subsequent production of large amounts of lactate whereas at<br />
low glucose concentrations the flux through glycolysis is greatly<br />
reduced with a greater proportion of glucose carbon being diverted<br />
through anabolic pathways. The increased rate of glycolysis at high<br />
glucose concentrations is accompanied by a decreased oxygen<br />
consumption rate (Frame and Hu, 1985; Glacken et al., 1986) possibly<br />
due to the increased production of ATP . from , glycolysis inhibiting<br />
oxidation in Krebs cycle (Miller et a!., 1988a). High growth rates also<br />
lead to an increased rate of glucose consumption and increased yields<br />
of lactate from glucose (Hu et al., 1987, Luan et a!., 1987b).<br />
24
The production of large amounts of lactic acid can quickly<br />
overcome the buffering capacity of cell culture media leading to a drop<br />
in pH and inhibition of cell growth. Eagle et al. (1958) found <strong>that</strong> the<br />
substitution of more slowly metabolised sugars such as fructose or<br />
galactose for glucose, leads to a greatly reduced lactate yield. Reitzer<br />
et al. (1979) subsequently demonstrated <strong>that</strong> most of the fructose<br />
utilised by HeLa cells was metabolised via the pentose phosphate<br />
pathway with very little accumulating as pyruvate or lactate. The<br />
substitution of glucose by fructose or galactose has therefore been used<br />
by a number of workers to reduce the lactate concentration in culture<br />
media and improve pH control (Imamura et al., 1982; Reitzer et al., 1979;<br />
Low and Harbour, 1985b).<br />
1.6.2 The effect of glucose and lactate on antibody production.<br />
Products of glucose catabolism have been found to repress<br />
biosynthetic pathways in lower organisms and there is some evidence<br />
<strong>that</strong> catabolite repression may also occur in mammalian cells. For<br />
example higher titres of interferon were achieved in glucose-limited<br />
chemostat culture of mouse LS cells than in batch cultures with high<br />
glucose concentrations (Tovey eta)., 1973). The production of interferon<br />
from Nalmalva cells was also found to be inhibited by increased glucose<br />
concentrations in chemostat culture (Kromer and Katinger. 1982).<br />
Studies on glucose-limited chemostat cultures of hybridomas have<br />
revealed <strong>that</strong> the specific antibody production rate is highest at low<br />
growth rates which coincides with the lowest metabolic quotient for<br />
glucose (Birch et al.. 1985b; Miller et al., 1988a). Such an effect would<br />
be consistent with catabolite repression but there is evidence to suggest<br />
25
<strong>that</strong> this is not the case in hybridoma cells.<br />
1. Low and Harbour (1985b) found <strong>that</strong> high glucose concentrations do<br />
not inhibit antibody production in batch culture. These findings are<br />
supported by Tharakan and Chau (1986c) who found no apparent<br />
relationship between glucose uptake rate and antibody production rate.<br />
2. Substitution of more slowly metabolised carbohydrates such as<br />
fructose for glucose does not improve antibody titres (Low and Harbour,<br />
1985b).<br />
3. Miller et al. (1988a) found <strong>that</strong> at constant growth rate the highest<br />
metabolic quotient for antibody production coincided with the highest<br />
metabolic quotient for glucose uptake, an effect which is not consistent<br />
with catabolite repression.<br />
The inhibitory effect of lactic acid on cell growth is probably due<br />
to the lowering of the culture pH to suboptimal levels although it has<br />
been suggested <strong>that</strong> the lactate ion per se inhibits hybridoma growth<br />
and antibody production independently of pH (Glasken et al.. 1986).<br />
Others (Reuveny et a!., 1986a; Miller et al., 1988b) have found <strong>that</strong><br />
lactate concentrations in excess of 25mM exhibit little effect on either<br />
cell growth or antibody production. The sensitivity of cells to lactate<br />
toxicity may therefore vary considerably between cell lines.<br />
1.6.3 Amino acid metabolism.<br />
Early studies on the amino acid requirements of animal cells were<br />
largely empirical being based either on the composition of biological<br />
fluids (Fischer. 1948; White, 1949; Morgan et al. 1950) or by the<br />
evaluation of the effect of individual amino acids on cell proliferation<br />
(Eagle, 1955; Eagle, 1959). Later studies on changes in amino acid<br />
26
concentrations during cell growth have shown <strong>that</strong> patterns of uptake<br />
or accumulation of amino acids in culture media vary with the cell type,<br />
medium composition and proliferation state. However, in general it<br />
appears <strong>that</strong> glutamine is the most rapidly utilised followed by leucine,<br />
isoleucine, lysine and valine (McCarty, 1962; Kruse et al., 1967.<br />
Griffiths and Pirt, 1967; Stoner and Merchant, 1972; Roberts et al.,<br />
1976). When non-essential amino acids are omitted from medium they<br />
are synthesized by cells during growth and may accumulate in the<br />
medium (McCarty. 1962; Griffiths and Pirt. 1967; Stoner and Merchant,<br />
1972) but are consumed during the stationary phase (Stoner and<br />
Merchant. 1972). When non-essential amino acids are included in the<br />
medium they are utilised by the cells (Pasieka et al., 1960; Kruse et al.,<br />
1967) and the consumption of essential amino acids is reduced (Griffiths<br />
and Pirt, 1967). There are few reports concerning the amino acid<br />
requirements of hybridoma cells but it has been reported <strong>that</strong> there is<br />
rapid consumption of Blutamine, arginine and serine with isoleucine,<br />
leucine, methionine, valine. phenyalanine and tyrosine being used to a<br />
lesser extent (Merten et al.. 1986). The rapid consumption of serine may<br />
reflect a requirement for serine in common with certain other cell lines<br />
(Kruse eta).. 1967; Stoner and Merchant, 1972; Birch and Hopkins, 1977),<br />
serine being an important intermediate in the synthesis of purines and<br />
pyrimidines via tetrahydrofolate and glycine.<br />
The importance of glutamine for the growth of animal cells in<br />
culture has long been known (Eagle et al., 1956, Kitos et al.. 1961) and<br />
its role in cell metabolism has been reviewed recently by McKeehan<br />
(1985). The rapid utilisation of glutamine appears to be a characteristic<br />
of proliferating cells such as tumour cells (Kvamme and Svenneby,<br />
1961; Kovacevic and Morris, 1972; Regan et a)., 1973) or rapidly<br />
27
dividing normal cells . Glutamine is also consumed rapidly by mouse<br />
myeloma cells (Roberts et al., 1976), lymphocytes (Ardawi and<br />
Newsholme, 1982) and hybridomas (Seaver et al., 1984). This<br />
requirement for glutamine is due In part to the central role <strong>that</strong><br />
glutamine plays in many biosynthetic pathways. Glutamine is the<br />
amino donor in the synthesis of purines and pyrimidines, amino<br />
sugars, pyridine nucleotides and asparagine in mammalian cells. Indeed<br />
it has been shown <strong>that</strong> the availability of glutamine regulates the<br />
rate of synthesis of purines and pyrimidines and hence cell growth<br />
(Fontanelle and Henderson, 1969; Ley and Tobey, 1970; Zetterberg and<br />
Engstrom, 1981).<br />
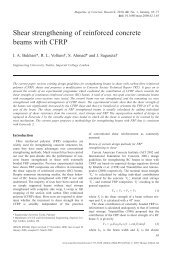
Glutamine carbon has been shown to accumulate as glutamate and<br />
aspartate with lesser amounts of alanine, pyruvate and lactate in<br />
lymphocytes (Ardawi and Newsholme, 1982a). Reitzer et al. (1979),<br />
discovered <strong>that</strong> lactate was a significant product of glutamine<br />
metabolism accounting for up to 13% of glutamine carbon in HeLa cells.<br />
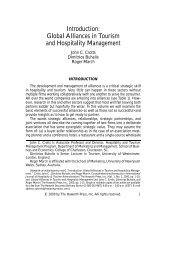
Hybridoma cells produce large amounts of alanine during cell growth<br />
(Seaver et aL, 1984; Merten. 1986) suggesting <strong>that</strong> alanine transaminase<br />
activity is high in these cells and may account for a significant<br />
proportion of glutamate nitrogen. Figure 1.2 shows the possible fate<br />
of glutamine in hybridomas.<br />
There is also considerable evidence to suggest <strong>that</strong> glutamine<br />
is an important energy source for animal cells and the appearance<br />
of large amounts of glutamine carbon as C02 indicates a high rate of<br />
glutamine oxidation. Lavietes et al. (1974) showed <strong>that</strong> glutamine<br />
oxidation accounted for 70 to 80% of oxygen uptake in lymphoma cells<br />
28
m<br />
ö<br />
v<br />
ZOQOZ<br />
LA<br />
Ny.<br />
ý<br />
ösm0<br />
WZý_<br />
W<br />
LLJ<br />
cr: l (a C, fc-11<br />
m<br />
d<br />
R- cd<br />
.a .<br />
.. r<br />
G<br />
0<br />
G<br />
Co 10<br />
f4.4<br />
N ý<br />
CLI<br />
m<br />
Co 0<br />
94<br />
Sri<br />
0 90 i G<br />
4 gz d Co c3 i<br />
Ö<br />
4.1<br />
ö<br />
, ýv ý<br />
d<br />
CO<br />
a. .,<br />
Co w<br />
C) b<br />
" 4a<br />
rw r.<br />
4)<br />
ce<br />
Ici<br />
ca C: )<br />
r= CD X<br />
CD<br />
:i ro 4..<br />
CD<br />
N CC E E E E<br />
Co<br />
4.3 yea<br />
ä ;j ý<br />
a. . Co<br />
,m<br />
r+ N CJ 'd'<br />
,<br />
d<br />
Ci<br />
Co<br />
a<br />
(D<br />
r.<br />
W<br />
0<br />
Co<br />
Z.<br />
CI)<br />
4. -1 4.1<br />
n<br />
. 41<br />
10 CO - L-<br />
29<br />
td<br />
q<br />
0.4 V<br />
cis Co<br />
cät gal<br />
m<br />
Co<br />
a<br />
o o<br />
Co<br />
Y<br />
a)<br />
to<br />
e.<br />
>.<br />
L<br />
a ts4<br />
" CO Q) - -4<br />
N<br />
CL<br />
O<br />
,r<br />
E) :5<br />
O<br />
ýij<br />
5-1<br />
03
and Donnelly and Scheffler (1976) found <strong>that</strong> the oxidation of<br />
glutamine could provide 40% of the energy requirements in Chinese<br />
hamster ovary cells. The work of Reitzer et al. (1979), on HeLa cells<br />
suggested <strong>that</strong> in the presence of glucose, glutamine oxidation via the<br />
TCA cycle provided greater than 50% of the cells energy requirements<br />
whilst 80% of glucose was converted to lactate and only 5% of glucose<br />
carbon entered the TCA cycle. Furthermore when glucose was replaced<br />
by fructose almost all the fructose carbon passed through the pentose<br />
phosphate cycle and they suggested <strong>that</strong> glutamine oxidation provided<br />
98% of the cells energy requirements. However Lazo (1981) has<br />
suggested <strong>that</strong> whilst glutamine may be the preferred respiratory<br />
substrate in many cells, aerobic glycolysis may still provide much of the<br />
cells energy requirements in rapidly growing cells.<br />
A number of authors have shown an apparent reciprocal<br />
regulation of glycolysis and glutamine oxidation. Kvamme and<br />
Svenneby (1961) noted <strong>that</strong> glutamine oxidation was inhibited by<br />
glucose in Erhlich ascites tumour cells and Zielke et al. (1978) found<br />
<strong>that</strong> glutamine utilisation in human diploid fibroblasts was regulated<br />
by glucose concentration and vice versa. A similar phenomenon has<br />
been noted in hybridomas by Hu et al. (1987) who found an increase in<br />
glutamine oxidation in low glucose media. Miller et al.. (1989a) have also<br />
observed <strong>that</strong> pulse addition of glucose to steady state hybridoma<br />
cultures leads to a decrease in the glutamine consumption rate and a<br />
reduced rate of oxygen uptake. They suggested <strong>that</strong> the increased ATP<br />
to ADP ratio due to a higher rate of glycolysis was responsible for<br />
inhibition of oxidation in Krebs cycle. Alternatively, Glacken (1988) has<br />
postulated <strong>that</strong> the increased ATP production from glycolysis lowers the<br />
intracellular phosphate pool which in turn lowers phosphate-regulated<br />
30
glutaminase activity assuming <strong>that</strong> glutaminase is of the<br />
phosphate-dependent type as has been suggested for many cultured<br />
cells (McKeehan, 1986). The mechanisms of this reciprocal regulation<br />
have yet to be elucidated and the subject is further complicated by<br />
Ardawl and Newsholme (1982) who showed <strong>that</strong> glutamine uptake is<br />
stimulated by glucose in proliferating lymphocytes. However it is<br />
likely <strong>that</strong> the changes in these major metabolic pathways will have<br />
profound effects on energy metabolism and biosynthesis and are thus<br />
important areas for study when considering the optimisation of antibody<br />
production in hybridoma cells.<br />
1.6.4 The effect of Blutamine on antibody production.<br />
Crawford and Cohen (1985) found <strong>that</strong> not only was glutamine<br />
essential for lymphocyte differentiation in vitro but also <strong>that</strong><br />
immunoglobulin synthesis and secretion was considerably enhanced in<br />
the presence of glutamine.<br />
The effect of glutamine concentration on antibody<br />
production by hybridomas has not been extensively studied. Birch et a).<br />
(1986b) have used a glutamine-limited chemostat culture to study the<br />
effect of cell growth rate on antibody production. They found <strong>that</strong> the<br />
antibody production rate increased slightly with increasing growth<br />
rate. This may be a result of the increased uptake and presumably<br />
higher intracellular concentrations of glutamine at high growth rates.<br />
This may stimulate antibody production which would be consistent with<br />
Crawford and Cohens observations perhaps by providing a larger amino<br />
acid pool for protein synthesis. However metabolic data was not<br />
discussed in Birch et als paper and it is not possible to determine the<br />
31
effects of glutamine on cell metabolism from their data. Hence the<br />
relationship between glutamine metabolism and antibody production<br />
remains obscure. Other studies have been concerned with prolonging<br />
cell viability and reducing ammonia accumulation by feeding glutamine<br />
(Luan et al.. 1987a, 1987b; Glacken et al., 1986; Reuveny et al., 1986b)<br />
and although this has led to improved cell yields and hence higher<br />
antibody titres, the effect of glutamine on the specific production rate<br />
of antibody has not been investigated.<br />
It has not yet been determined if the changes in cell metabolic<br />
pathways associated with different energy sources or cell growth rate<br />
affect protein synthesis or secretion in hybridomas. Such information<br />
would facilitate the design of improved media for immunoglobulin<br />
production and the design of production processes.<br />
1.6.5 The effect of ammonia on cell growth and antibody production.<br />
Ammonia is a major product of glutamine metabolism due to<br />
glutaminase activity. Griffiths & Pirt (1967) found <strong>that</strong> the<br />
incorporation of nitrogen into biomass was very inefficient when<br />
glutamine was present but was almost 100% efficient when cells were<br />
adapted to grow on glutamate suggesting <strong>that</strong> glutamine is the main<br />
source of ammonia in culture media. The rate of glutamate oxidation As<br />
low (Lazo, 1981) and - it has been suggested <strong>that</strong> glutamate<br />
aminotransferases are more important than glutamate dehydrogenase in<br />
the conversion of glutamate to a-ketoglutarate (Glazer et a!.. 1974;<br />
Ardawi and Newsholme. 1982; Moreadith and Lehninger, 1984) resulting<br />
in a more efficient incorporation of nitrogen and lower ammonia levels.<br />
There is also some evidence <strong>that</strong> exogenous glutamate is metabolised<br />
32
differently to glutamate derived from glutamine. It appears <strong>that</strong><br />
exogenous glutamate is more likely to be converted to a-ketoglutarate<br />
by transamination reactions whereas glutamate derived from glutamine<br />
Is oxidatively deaminated by glutamate dehydrogenase (Borst, 1962;<br />
Kovacevic, 1971; Schoolwerth and LaNoue, 1980). This may be an effect<br />
of compartmentation because both glutaminase and glutamate<br />
dehydrogenase are located within the mitochondrion whereas the<br />
transaminases are located predominantly in the cytosol.<br />
The rate of ammonia production is also increased at high<br />
glutamine concentrations and the controlled feeding of glutamine to<br />
maintain low levels of ammonia was successfully employed by Glacken<br />
et al. (1986).<br />
Ammonia has been shown to inhibit cell growth at levels above<br />
2mM in several cell lines (Visek et al., 1972; Holley et al., 1978; Butler,<br />
1985) including hybridoma cells (Reuveny et al., 1986a; Dodge et al.,<br />
1987). Ammonia has also been shown to inhibit the production of viruses<br />
(Eaton and Scala, 1961; Jensen and Liu, 1961) and interferon (Ito and<br />
McLimans, 1981) and its inhibitory effect on hybridoma growth is<br />
reflected in lower antibody titres achieved in media containing high<br />
levels of ammonia (Reuveny et al., 1986a). Whether the effect Is due to<br />
inhibition of immunoglobulin synthesis per se or a reflection of a general,<br />
depression of cell metabolism caused by ammonia has not been<br />
ascertained but the latter seems more likely.<br />
1.6.6 Oxygen requirements by cells in culture.<br />
<strong>An</strong>imal cells in culture have been reported to have oxygen<br />
uptake rates of between 0.05 and 0.5 pmoles/106 cells/hour (Fleischaker<br />
33
and Sinskey. 1981). The oxygen uptake rate for hybridoma cells falls<br />
within this range with a maximum uptake rate of 0.2 pmoles/106<br />
cells/hour (Boraston et a1.. 1984; Miller eta!.. 1987). The oxygen uptake<br />
rate also appears to be related to cell growth rate (Katinger. 1987) and<br />
has been used as an indicator of the metabolic state of cells in<br />
immobilised cell systems (Lydersen, 1985; Pugh, 1988). However the<br />
observation <strong>that</strong> oxygen uptake is inhibited by high glucose<br />
concentrations (Crabtree, 1929; Frame and Hu, 1984; Glacken et al..<br />
1986; Miller et al.. 1988) means <strong>that</strong> care must be taken when<br />
correlating oxygen uptake with cell growth rate.<br />
The optimum oxygen concentration for cell growth varies with cell<br />
type but is generally about 60% air saturation (Kilburn and Webb, 1968;<br />
Radlett et al., 1972). A similar optimal concentration of oxygen for<br />
hybridomas has been noted by some authors (Reuveny et al., 1986a;<br />
Phillips et al., 1987) whilst Boraston et al. (1984) found little effect on<br />
growth rate for oxygen concentrations between 8 and 100% air<br />
saturation. Oxygen concentrations greater than those of atmospheric air<br />
have been reported to be toxic to mammalian cells (Cooper et al., 1958;<br />
Brosemer and Rutter, 1961; Mizrahi et al., 1972) although the<br />
mechanisms for such toxicity have not been elucidated.<br />
Cell damage by air bubbles has also been reported by a number of<br />
authors (Telling and Esworth, 1965; Kilburn and Webb, 1968; Radlett et<br />
al.. 1972; Spier, 1982) which Handa and colleagues (1987) suggest is due<br />
to the energy dissipation in the region of bubble disengagement. For this<br />
reason various devices have been described which provide bubble free<br />
aeration by the use of silicone tubing (Kuhlmann, 1987). porous<br />
membranes (Lehmann et al.. 1987) or caged aerators (Whiteside and<br />
Spier. 1985). High concentrations of serum and surface active polymers<br />
34
have been reported to protect cells from bubble damage (Kilburn and<br />
Webb, 1968; Handa et al., 1987), however Birch and colleagues have<br />
successfully cultured several cell types (including hybridomas, Rhodes<br />
and Birch, 1988) in airlift reactors using low protein media and have not<br />
reported any such cell damage due to bubbles.<br />
1.6.7 The effect of oxygen on antibody production.<br />
Mlzrahi and colleagues (1972) studied the effects of oxygen on<br />
antibody production by a human lymphocyte cell line and found <strong>that</strong><br />
specific antibody, production rates were highest at oxygen<br />
concentrations which were below the optimum for cell growth.<br />
Some hybridomas also show a similar phenomenon in <strong>that</strong> optimal<br />
growth occurs at 60-60% air saturation whilst optimal antibody<br />
production occurs at 15-25% air saturation (Reuveny et a1., - 1986a;<br />
Phillips et al., 1987) and Birch et al. (1985) found <strong>that</strong> antibody<br />
production rate was higher at low growth rates in oxygen limited<br />
chemostat culture. These observations suggest <strong>that</strong> high oxygen<br />
concentrations inhibit antibody productiornllowever Miller et al. (1987)<br />
have studied the effect of oxygen concentration on -antibody<br />
production by hybridomas at constant growth rate and have<br />
Indicated <strong>that</strong> optimal antibody production occurs at 50% air<br />
saturation which coincides with the highest metabolic quotient for<br />
oxygen uptake. In addition Bodeker et al. (1987) found <strong>that</strong> IgM<br />
production by Immobilised hybridomas was favoured at high oxygen<br />
consumption rates. It thus appears <strong>that</strong> the effect of oxygen on antibody<br />
production Is not an effect of direct inhibition but rather a reflection of<br />
the balance of cell metabolism at different growth rates.<br />
35
1.6.8 The effect of PH on cell growth and antibody production.<br />
The effect of pH in animal cell cultures has been measured largely<br />
in terms of cell growth. Eagle (1973) showed' <strong>that</strong> in general, normal<br />
fibroblasts of human or rodent origin favoured a more alkaline<br />
environment (pH 7.4-7.9) than transformed cells from the same species<br />
(pH 6.6-7.4) although rodent cells tolerated wider pH ranges. The<br />
optimum pH range for hybridoma cell growth falls within the lower pH<br />
range typically between 6.9 and 7.4 (Harbour et al., 1988).<br />
There have been few reports on the effects of pH on hybridoma cell<br />
metabolism although Miller et al. (1988a) have observed <strong>that</strong> the glucose<br />
consumption rate was lower at pH 6.8 than pH 7.2 whilst oxygen<br />
consumption remained unaltered at different pH values in chemostat<br />
culture. Pugh (1988) also found <strong>that</strong> the rate of oxygen consumption by<br />
hybridomas was unaffected by pH values between 6.6 and 7.2. Reduced<br />
glucose consumption at low pH has been noted by other authors working<br />
with different cell lines (Barton, 1971; Birch and Edwards, 1980). These<br />
authors also found <strong>that</strong> there is a reduced rate of conversion of glucose<br />
to lactate at low pH. a phenomenon which has also been described for<br />
hybridomas by Luan et al. (1987b). They found <strong>that</strong> production of<br />
lactate by hybridomas ceased when the pH had reached 6.8 but by<br />
adjusting the culture pH to 7.2 lactate production was restored.<br />
There are also few reports concerned with the effect of pH on antibody<br />
production by hybridoma cells. However Miller et al. (1988a) have found<br />
<strong>that</strong> specific antibody production rates were higher at pH 6.8 than at pH<br />
7.2. <strong>An</strong>tibody production rates were also slightly higher at pH 7.7. The<br />
underlying mechanisms for this phenomenon have not been explained but<br />
36
Miller and colleagues postulated <strong>that</strong> antibody production may be<br />
enhanced in stressed cells. However it is also likely <strong>that</strong> the changes in<br />
cell growth rate and metabolic activity observed at low pH may favour<br />
antibody production. The effects of pH on cell growth and antibody<br />
production require further examination. pH is a readily controllable<br />
parameter in bioreactors and any effect on antibody production or cell<br />
growth has important consequences in process optimisation.<br />
1.6.9 The role of serum in cell growth.<br />
The use of animal sera to supplement culture media is common<br />
practice and serum is included typically at concentrations of 6-10%.<br />
Serum components fulfil a number of defined functions in culture (see for<br />
example Griffiths, 1986; Maurer, 1986) as shown in table 1.2 and it is<br />
likely <strong>that</strong> there are many components in serum which exert stimulatory<br />
or antagonistic effects in cell culture which are as yet undefined.<br />
However there is a limited number of serum components which are<br />
necessary in order to achieve cell proliferation and maintain cell<br />
viability<br />
in the absence of serum. The use of serum free media for the<br />
cultivation of mammalian cells is the subject of several reviews (Ham<br />
and McKeehan, 1979; Barnes and Sato, 1980; Waymouth. 1981) and<br />
recently a review devoted to serum free culture of hybridoma cells has<br />
been published (Glassy et al.. 1988). The serum components which are<br />
considered important for the growth of hybridoma cells in serum free<br />
medium are described below.<br />
The protein, transferrin is considered to be essential for the<br />
growth of hybridomas (Chang et al., 1980; Murakaml et al., 1982; Kovar<br />
37
Table 1.2. Defined components and properties of serum.<br />
Hormaies e. g. insulin<br />
Growth factors e. g. epidermal growth factor<br />
fibroblast growth factor<br />
insulin-like growth factors<br />
Attachment factors e. g. fibronectin, fetuin<br />
Transport/carrier proteins e. g. transferrin, albumin<br />
Nutrients e. g. trace elements, lipids<br />
keto-acids, amino acids,<br />
polyamines<br />
Buffering of pH and redcx e. g. albumin, g1utathione<br />
Protease inhibitors e. g. 2-macroglobulin<br />
Mechanical protection e. g. albumin, other proteins<br />
38
and Franek, 1985). The growth stimulatory effect of transferrin appears<br />
to be due mainly to the transport of iron to cells via specific receptors<br />
(Aisen and Listowsky, 1980; Trowbridge and Omary, 1981) in <strong>that</strong> some<br />
of the effects of transferrin can be reproduced with iron salts or iron<br />
chelators (Mather and Sato, 1979; Yabe et al., 1987).<br />
Insulin is also commonly included in serum free media and has a<br />
number of roles. Insulin stimulates uridine and glucose uptake and the<br />
synthesis of RNA, protein and lipid (Schubert, 1979) and increased<br />
incorporation of glucose into fatty acids and glycogen in the presence<br />
of insulin has been noted (Mather and Sato, 1979; Mather et al., 1981).<br />
Optimum insulin concentrations of 5-20ug/ml have been reported for<br />
hybridoma culture (Murakami et al., 1982; Darfler and Insel, 1982;<br />
Kovar, 1986).<br />
Ethanolamine was also shown to be important for the growth of<br />
hybridoma cells in serum free medium as reported by Murakami et al.<br />
(1982) and supported by the findings of Kovar (1986) and Tharakan and<br />
Chau (1986). Ethanolamine is thought to be involved in membrane lipid<br />
synthesis and the presence of ethanolamine has been shown to increase<br />
phosphatidyl ethanolamine levels in cell membranes (Murakami et al.,<br />
1982). Ethanolamine has also been described as having insulin-like<br />
activity (Barseghian, 1984), increasing the rate of glucose oxidation and<br />
lipogenesis although this may be a non-specific membrane effect.<br />
Albumin is a common component of serum free medium and its<br />
main function appears to be as a carrier molecule for lipids, although it<br />
also serves as a carrier for hormones, growth factors and some trace<br />
minerals (Barnes and Sato, 1980). Albumin may also have a role in the<br />
detoxification of peroxide (Darfier and Insel, 1982) or excess trace<br />
elements (Guilbert and Iscove, 1976; Iscove and Melchers, 1978). Most<br />
39
cells can carry out the de novo synthesis of both cholesterol and many<br />
fatty acids from acetyl CoA (King and Spector, 1981) but will utilise<br />
lipids from culture media in which case the de novo synthesis of fatty<br />
acids and cholesterol is suppressed (Jacobs and Majerus, 1973; McGee<br />
and Spector. 1974; Alberts et al., 1974).<br />
Selenium is a trace element which is frequently included in<br />
serum-free media at concentrations of 10-100nm due to its growth<br />
promoting ability (McKeehan et al., 1976; Guilbert and Iscove, 1976;<br />
Murakami et al., 1981; Kovar, 1988). It appears <strong>that</strong> selenium functions<br />
as a cofactor for glutathione peroxidase which protects cells from<br />
damage by peroxides (McKeehan et al.. 1976).<br />
Serum also provides a source of growth factors which have widely<br />
differing effects on the proliferation of different cell lines (see James<br />
and Bradshaw, 1984 for review). The presence in serum of trace minerals,<br />
hormones and a complex pool of metabolites may also enhance cell<br />
growth.<br />
1.6.10 The effect of serum on cell growth and antibody production<br />
The serum requirement by cells is measured typically in terms of<br />
the extent of cell proliferation or relative cell growth rate. However it<br />
has been noted <strong>that</strong> the serum requirement of non-proliferating high<br />
density cultures such as hollow fibres and perfusion systems is<br />
considerably reduced (Hopkinson, 1985; Reuveny et al., 1985) which may<br />
indicate <strong>that</strong> the serum requirements for cell maintenance are less than<br />
the requirements for cell proliferation. However it has also been<br />
suggested <strong>that</strong> high density cell cultures create a microenvironment in<br />
which the need for serum factors is reduced possibly due to synthesis of<br />
40
such factors by the cells themselves (Merten, 1987).<br />
Low serum or serum free media have been used for the growth of<br />
many hybridoma cell lines (see review by Glassy et al., 1988). Sustained<br />
growth and antibody production by several hybridoma and myeloma cell<br />
lines has also been reported using a protein free medium (Cleveland et<br />
a!., 1983). Many authors have noted an increased specific production<br />
rate of antibody in serum deficient media in both murine hybridomas<br />
(Baker et al., 1985; Tharakan and Chau, 1986; Tharakan et al., 1986)<br />
and human hybridomas (Cole et a!., 1985; Glassy et al., 1987; Glassy,<br />
1987). A similar phenomenon has also been observed in other lymphoid<br />
cell cultures (Tanno et al., 1982; Sharath et al., 1984; Glassy et al.,<br />
1987). This has been interpreted by some to suggest <strong>that</strong> serum contains<br />
factors which inhibit antibody production (Tharakan and Chau, 1986,<br />
Glassy et al., 1987) although no evidence of such an inhibition<br />
mechanism has yet been presented. However in a recent review Glass),<br />
et al. (1988) have shown <strong>that</strong> in general, hybridoma and lymphoid<br />
cultures have lower growth rates in serum free media than in serum<br />
supplemented media which suggests <strong>that</strong> immunoglobulin synthesis is<br />
enhanced in more slowly growing cells. Further work is required in order<br />
to clarify the relationship between serum and antibody production in<br />
hybridomas.<br />
1.7 Cell cycle-related changes in protein expression.<br />
In the previous section the effects of physiological parameters on<br />
the production monoclonal antibodies have been discussed and it has<br />
become apparent <strong>that</strong> many of the effects may due to the regulation of<br />
cell growth. This suggests <strong>that</strong> antibody production may be regulated<br />
41
within the cell division cycle and there is evidence of this in other<br />
immunoglobulin producing cell lines as will be discussed below.<br />
The basic model for the cell division cycle is <strong>that</strong> of Howard and<br />
Pelc (1953) which divides the cell cycle into four phases characterised<br />
by the observable processes of DNA synthesis (S phase) and cell mitosis<br />
(M phase) and the gaps between those processes termed Gi (the gap<br />
between M and S) and Gz (the gap between S and M). It has been observed<br />
<strong>that</strong> under adverse environmental conditions such as nutrient<br />
starvation, cells tend to arrest in the Gi phase and will not resume cell<br />
division unless favourable conditions are restored (Ley and Tobey, 1970;<br />
Brooks, 1975; Melvin et al., 1979; Wynford-Thomas et al., 1985). This<br />
phenomenon has also been demonstrated in hybridoma cells by the use<br />
of flow cytometry which shows <strong>that</strong> the cells accumulate in the Gi phase<br />
of the cell cycle as they enter the stationary phase (Schliermann et al.,<br />
1987). Pardee (1974) proposed <strong>that</strong> there is a single point within Gi<br />
(restriction point) at which cells are more sensitive to arrest but become<br />
comitted to divide once beyond <strong>that</strong> point (see also review by Pardee et<br />
al., 1986). It is now generally accepted <strong>that</strong> much of the variability in<br />
the length of cell division cycles is attributable to variations In the<br />
length of the Gi phase (Pardee et al., 1978) and <strong>that</strong> the duration of S,<br />
G2 and M phases are relatively constant. It would therefore follow <strong>that</strong><br />
cell population distributions would vary at different growth rates and<br />
Indeed population distribution studies of yeast in chemostat culture<br />
have shown <strong>that</strong> the proportion of cells in the Gi phase decreases with<br />
increasing growth rate (Scheper et al., 1987).<br />
There are a number of proteins whose expression appears to be<br />
related particular phases of the cell cycle (Milcarek and Zahn, 1978;<br />
42
Bravo and Celis, 1980; Westwood et al.. 1984) and the expression of many<br />
of these proteins can be related to specific events within the cell<br />
division process. For example many of the enzymes involved in DNA<br />
synthesis such as thymidine kinase, dihydrofolate reductase and<br />
thymidylate synthase are expressed during S phase (Littlefield, 1966;<br />
Johnson eta!., 1978; Marsani eta!., 1981; Conrad, 1971; Denhardt eta!.,<br />
1986). There is also evidence <strong>that</strong> the regulation of histone synthesis<br />
is closely coupled with DNA synthesis (Delisle eta!., 1983; Artishevsky<br />
et a!., 1984; Schumperli, 1986). Expression of several of the oncogenes<br />
is also related to specific cell cycle phases and these proteins probably<br />
have roles in cell growth regulation (Denhardt et al., 1986).<br />
The expression of other cell cycle related proteins may not be so<br />
readily linked with cell division processes. For example plasminogen<br />
activator secretion appears to be associated with the Gz phase in a rat<br />
adenosarcoma cell line (Scott et al., 1987) and albumin production by rat<br />
hepatoma cells was greatest during the Gl' phase (Chen and Redman,<br />
1977). Studies on synchronised populations of various lymphoblastoid<br />
cell lines have indicated <strong>that</strong> immunoglobulin synthesis may be<br />
restricted to the late Gi /early S phase (Buell and Fahey, 1969,<br />
Takahashi et al., 1969; Lerner and Hodge, 1970; Byars and Kidson, 1970;<br />
Garatun-Tjeldsto et al., 1976; Turner et al., 1985). Other investigators<br />
have found either no evidence of cell cycle dependent immunoglobulin<br />
expression (Cowen and Milstein, 1972; Liberti and Baglioni, 1972;<br />
Damlani et al.. 1979) or variable levels of expression (Killander et al..<br />
1977). It is still not yet clear whether these effects are a result of the<br />
non-physiological conditions used to synchronise the cells or genuine<br />
cell-cycle dependent variation in Immunoglobulin expression. However<br />
43
this poses a number of questions in the study of immunoglobulin<br />
production by hybridoma cells.<br />
1) Is immunoglobulin production restricted to the Gi phase in<br />
hybridoma cells?<br />
2) Could the increased rate of immunoglobulin production seen under<br />
growth inhibitory conditions be due to accumulation of cells in the G1<br />
phase?<br />
3) Could variation in specific immunoglobulin production rate seen in<br />
chemostat cultures (Birch et al., 1985; Miller et al., 1988) be<br />
explained by variations in the duration of the Gi phase at different<br />
growth rates?<br />
1.8 Summary and objectives.<br />
The use of animal cells for the production of proteins is receiving<br />
increasing attention and monoclonal antibodies represent one such<br />
product with considerable potential in diagnosis, therapy and protein<br />
purification. The realisation of this potential requires <strong>that</strong> monoclonal<br />
antibodies can be produced economically and on a large scale and the<br />
identification of those parameters which influence antibody production<br />
by hybridomas is a prerequisite for the optimisation of the antibody<br />
production process.<br />
It has become clear <strong>that</strong> several factors have apparent effects on<br />
the rate of antibody production in hybridomas but <strong>that</strong> the underlying<br />
mechanisms for these effects have not been elucidated. It has been<br />
observed <strong>that</strong> some conditions which are suboptimal for cell<br />
proliferation enhance the specific antibody production rate and studies<br />
44
in chemostat culture have shown <strong>that</strong> antibody production rates are<br />
often increased at low growth rates. These observations suggest <strong>that</strong><br />
there is an underlying relationship between cell growth rate and<br />
antibody production. Whether this is a consequence of the changing<br />
demands for macromolecular synthesis in rapidly dividing cells, cell<br />
cycle regulated expression of immunoglobulin as observed in other<br />
antibody producing cell lines or due to some repression/inhibition type<br />
control is yet to be determined. The understanding of this relationship<br />
will have important consequences for process design.<br />
The aims of this study are therefore to examine the effects of<br />
environmental factors on hybridoma growth and antibody production. In<br />
particular the relationship between cell growth, metabolism and<br />
immunoglobulin production will be addressed In an attempt to determine<br />
those parameters which can be optimised for an antibody production<br />
process.<br />
The study of antibody production kinetics in cultured cells would be<br />
greatly facilitated by direct on-line monitoring of antibody<br />
concentrations. Therefore the preliminary obhective of this study was<br />
to design an automated assay system for the real time determination of<br />
antibody levels in hybridoma cultures.<br />
45
Chanter 2<br />
Materials and Methods<br />
The materials and methods described in this chapter are those<br />
which are applicable to all of the subsequent chapters. More specific<br />
experimental procedures will be described in the relevant results<br />
chapter.<br />
2.1 Cell culture.<br />
2.1.1 Cell line.<br />
The hybridoma cell line used throughout this investigation was an<br />
NS1 derived mouse-mouse hybridoma, designated 321 which secreted<br />
IgG to paraquat (Wright et al., 1987). The cell line was a gift from Dr A.<br />
Wright, Central Toxicology Laboratory, ICI.<br />
2.1.2 Media<br />
The hybridoma was routinely cultured in RPMI 1640 (Flow Labs Ltd. )<br />
containing 2mM glutamine, 0.2% sodium hydrogen carbonate and 10%<br />
newborn calf serum (Seralab). Filter sterilised glutamine stock solution<br />
(200mM) was stored in working aliquots at -200 C. Sodium hydrogen<br />
carbonate stock solution (8.8%) was autoclaved and stored at 4° C.<br />
Newborn calf serum was stored in working aliquots at -20° C.<br />
<strong>An</strong>tibiotics were not added to culture media.<br />
46
2.1.3 Cell culture.<br />
Hybridoma, cultures were seeded with 1 or 2x10' cells/ml. Cultures<br />
seeded with 1x10⁵ cells/ml were passaged after 3 days whilst cultures<br />
seeded with 2x10° cells/ml were passaged after 2 days. During the<br />
passaging procedure, cells were harvested by centrifuging at 100xg for<br />
b minutes and resuspended in fresh medium at 370 C. Cell number was<br />
determined by diluting aliquots of cells in 0.5% trypan blue in saline<br />
-and counting in a modified Fuchs-Rosenthal counting chamber. Cells<br />
which incorporated trypan blue were considered to be non-viable.<br />
2.1.4 Cryopreservation.<br />
Cells in early to mid exponential phase i. e. 24 hours after passage,<br />
were harvested by centrifugation then resuspended at a density of<br />
lx106 cells/ml in a freezing mixture of 80% RPMI 1640,10% newborn calf<br />
serum and 10% dimethylsulphoxide (DMSO). Nunc Cryotubes were filled<br />
with 1.8m1 aliquots of the cell suspension. The cells were then frozen<br />
at an approximate rate of 1-3° C per minute for 1 hour then<br />
transferred to the vapour phase of a liquid nitrogen container. The<br />
initial rate of freezing was controlled by placing ampoules in a<br />
polystyrene block with walls of approximately 2cm thickness in a<br />
freezer at -700.<br />
To check <strong>that</strong> the cells had been successfully preserved an aliquot<br />
of cells was removed to check <strong>that</strong> they could be revived. Cells were<br />
revived by thawing rapidly in a 370 C water bath. Once thawed the cells<br />
Were immediately added to 10ml of prewarmed medium and then<br />
47
centrifuged at 100xg for 5 minutes. The cells were then washed in a<br />
further l Oml of medium to ensure complete removal of DMSO. The cells<br />
were finally suspended in 10ml of medium in a 25cm2 plastic tissue<br />
culture flask and incubated in a 370 C incubator with an atmosphere<br />
containing 5% COz.<br />
2.2 Assay techniques.<br />
2.2.1 Glucose determination.<br />
Glucose concentrations were determined by the o-toluidine test<br />
based on the procedures of Hyvarinen and Nikila (1962) and Feter<br />
(1965). and as described in Sigma test bulletin no. 635.<br />
Samples for glucose assay were centrifuged at 100xg for 5 minutes to<br />
remove cells and debris and stored at -200 C until required. For the<br />
assay, 0.1ml of medium was added to 5m1 o-toluidine reagent in a glass<br />
test tube which was then placed in a boiling water bath for 10 minutes.<br />
A blank containing 0.1ml water and a standard containing 0.1ml of a<br />
1mg/ml standard glucose solution were also included. The tubes were<br />
cooled rapidly to room temperature in cold water before measuring<br />
the absorbance of the resulting complex at 635nm against the blank.<br />
The standard glucose sample typically gave an absorbance reading<br />
of 0.260 ±0.010.<br />
The assay response was linear for glucose concentrations between<br />
0 and 2.5 mg/ml and therefore the glucose concentration in mg/ml could<br />
be determined by dividing the absorbance of the sample by the<br />
absorbance of the standard and multiplying by the glucose concentration<br />
of the standard.<br />
48
2.2.2 Lactate determination.<br />
Lactate concentrations were determined enzymatically by<br />
monitoring reduction of NAD during the conversion of lactate to<br />
pyruvate by lactate dehydrogenase.<br />
a) Reagents.<br />
1) NAD Grade III from yeast (Sigma) 30mg/ml in distilled water.<br />
il) Glycine-hydrazine buffer pH 9.0.11.4g glycine + 25m1 hydrazine<br />
hydrate made up to 300m1 with water.<br />
iii) Lactate dehydrogenase (LDH) Type X from bovine muscle 1000U/ml<br />
(Sigma).<br />
iv) Perchloric acid 8% w/v.<br />
v) L-lactate standard 0.4mg/ml (Sigma).<br />
b) Method.<br />
Samples for lactate determination were centrifuged at 100xg for<br />
5 minutes to remove cells and debris then deproteinised by the addition<br />
of lml ice cold perchloric acid to 0.5m1 sample. The samples were kept<br />
on ice for 20 minutes then centrifuged at 11,600xg for 10 minutes to<br />
remove the precipitated protein. The deproteinised samples were<br />
stored at 40 C until required.<br />
For the assay 200p1 of sample was added to 2.5m1 glycine buffer.<br />
A blank containing 200p1 perchioric acid and a standard containing<br />
200p1 of a 0.4mg/ml (4.44 mmoles/1) lactate standard diluted 1/3 In<br />
49
perchloric acid. were also included. NAD (200p1) was then added to<br />
each tube and the initial absorbance at 340nm of each sample,<br />
including the blank and standard, was measured against<br />
glycine-hydrazine<br />
buffer. To lml of each sample was then added 25p1<br />
LDH and all samples were incubated at 370C for 30 minutes. The<br />
final absorbance at 340nm for each sample was then measured. The<br />
lactate concentration was proportional to the increase in absorbance<br />
due to the reduction of NAD during the conversion of lactate to<br />
pyruvate and was calculated as follows:<br />
Lactate mmol/1 = (dS-dB) x 7.11<br />
where dS = difference between initial and final absorbance of the<br />
sample and dB = difference between initial and final absorbance of the<br />
blank. 7.11 is a conversion factor based on an absorbance change of<br />
6.22/mmole NADH and a dilution factor of 44.2.<br />
The assay results were considered valid if the value for the<br />
standard was within 5% of the expected value.<br />
2.2.3 Ammonia determination.<br />
The ammonia content of the culture medium was determined using<br />
an EIL ammonia probe model 8002-8 (Kent Instruments). For the assay<br />
O. lml 1M NaOH was added to 0.9m1 sample and the free ammonia thus<br />
liberated was detected with the ammonia probe. A calibration curve<br />
for the probe was constructed using aqueous ammonium chloride<br />
standards in the range of 10-1 to 10-5 M and samples were read against<br />
50
this curve.<br />
2.2.4 Glutamine determination.<br />
The glutamine concentration was determined enzymatically by<br />
monitoring the liberation of ammonia during the deatnination of<br />
glutamine by glutaminase.<br />
a) Reagents.<br />
1) 0.1 M sodium acetate buffer pH 4.9<br />
11) Glutaminase grade V from Escherichia cola (Sigma) 5U/ml in sodium<br />
acetate buffer<br />
b) Method.<br />
For the assay 450p1 sodium acetate buffer and 50p1<br />
glutaminase were added to 500p1 sample. Controls were also set up for<br />
each sample containing 500p1 sample and 500pl sodium acetate<br />
buffer only. Samples and controls were incubated at 370C for 30<br />
minutes. The ammonia content of each was measured as described in<br />
section 2.2.3. The ammonia liberated due to the action of glutaminase<br />
on glutamine was evaluated by subtracting the ammonia present in<br />
the controls from the ammonia present in the glutaminase-treated<br />
samples. Assuming 1 mole of ammonia was liberated from the complete<br />
breakdown of 1 mole of glutamine the glutamine concentration of each<br />
sample could therefore be quantified.<br />
51
2.2.5 <strong>An</strong>tibody determination.<br />
<strong>An</strong>tibody concentration in the medium was determined by<br />
sandwich enzyme-linked Immunosorbent assay (ELISA). Samples for<br />
ELISA were centrifuged at 100xg for 5 minutes to remove cells and<br />
debris then stored at -201 C until required.<br />
a) Reagents.<br />
1) Wash buffer. Phosphate buffered saline (PBS), pH 7.4 containing 0.1%<br />
Tween 20.<br />
ii) Diluent. PBS + 10% newborn calf serum<br />
ill) Coating buffer. 0.1M sodium carbonate buffer pH 9.6.<br />
iv) Coating antibody. Sheep anti-mouse IgG (Scottish <strong>An</strong>tibody<br />
Production Unit) diluted 1/1000 in coating buffer.<br />
v) Enzyme-conjugated antibody. Sheep anti-mouse IgG-alkaline<br />
phosphatase (Seralab) diluted 1/1000 in PBS containing 10%<br />
newborn calf serum.<br />
vi) Substrate for alkaline phosphatase. p-Nitrophenyl phosphate<br />
(Sigma) 1mg/ml in coating buffer.<br />
vii) Standard antibody. Affinity purified 321 monoclonal antibody<br />
(see section 2.3).<br />
b) Method.<br />
1. Nunc Immunoplates were coated with IOOpI of coating antibody in<br />
coating buffer and left overnight at 411 C.<br />
52
2. The plates were washed 4 times with wash buffer.<br />
3. Appropriate dilutions of the samples in diluent were applied to<br />
the plate at 100jil per well and serial twofold dilutions were<br />
carried out. The 321 standard antibody was also applied in twofold<br />
dilutions starting at a dilution of 1/1000 (ipg/ml).<br />
4. The plates were incubated at room temperature for 2 hours then<br />
washed 4 times with wash buffer.<br />
6. A 1/1000 dilution of antibody enzyme conjugate in diluent was<br />
applied to each well at 100p! per well and incubated for a<br />
further 2 hours at room temperature.<br />
6. The plates were washed 4 times with wash buffer.<br />
7. Enzyme substrate at 1mg/ml In substrate buffer was applied to all<br />
wells at 100p1 per well. The plates were incubated for 1-1.5 hours<br />
before reading absorbance at 405nm in a Dynatech MR600 plate<br />
reader.<br />
B. Titration curves of the 321 standard and samples were constructed..<br />
The antibody concentrations of the samples were calculated from<br />
the titration curves by dividing the titre of the sample at 50%<br />
maximum absorbance by the titre of the standard at 50% maximum<br />
absorbance.<br />
53
2 .3 Purification and characterisation of the 321 antibody standard.<br />
2.3.1 Preparation of Paraguat-AH Sepharose affinity column.<br />
Paraquat propionate (90mg) was dissolved in 2m1 distilled water<br />
and the pH was adjusted to 4.5.50mg 1-cyclohexyl-3<br />
-(2-morpholinoethyl)-carbodiimidemetho-p-toluenesulphonate(CMC)<br />
Was dissolved in lml distilled water and the pH was adjusted to 4.5. The<br />
paraquat ligand and CMC were added to 16m1 washed and reswollen<br />
AH-Sepharose (Pharmacia) and mixed by rolling for 18 hours. <strong>An</strong>other<br />
26mg CMC was then added and the suspension was mixed for a further<br />
64 hours before washing with PBS. The paraquat content of the<br />
washings was assayed by adding 0.5ml to 2.5m1 of fresh 1% sodium<br />
dithionite in 1M NaOH. The absorbance of the coloured product was<br />
measured at 600nm. A standard curve for paraquat propionate was<br />
constructed with standards ranging from 15 to 500pg/ml paraquat<br />
propionate (figure 2.1). The amount of paraquat ligand bound to the<br />
column was assessed by subtracting the total paraquat content of the<br />
washings from the paraquat content of the original solution. The<br />
coupling solution had been shown to contain 91.6mg paraquat<br />
propionate by the above assay before mixing with the Sepharose.<br />
Initial paraquat content of coupling solution 91.5mg<br />
Total paraquat content of washings 62.6mg<br />
Amount bound to 16m1 AH-Sepharose 29.0mg<br />
54
Figure 2.1. Standard curve for the determination of paraquat<br />
0<br />
0<br />
'o<br />
r9<br />
.O<br />
2"S<br />
2.0<br />
1.5<br />
1.0<br />
0.5<br />
0 100 200 300 400 500<br />
Paraquat propionate pg/ml<br />
55
Data provided by Pharmacia indicated <strong>that</strong> there were between 6 , and<br />
10 pmol of available spacer groups per ml of AH-Sepharose which gave<br />
between 90 and 150 pmol spacer groups on 15 ml Sepharose to which<br />
were bound 72pmol of paraquat propionate (molecular weight 403).<br />
This means <strong>that</strong> there was between 48 and 80% saturation of the<br />
available spacer groups.<br />
2.3.2 Affinity purification of the 321 antibody.<br />
Spent medium (100ml) from a3 day culture of the 321 hybridoma<br />
was recirculated through 15m1 of paraquat-AH-Sepharose packed in a<br />
20m1 syringe. at 0.5m1/minute overnight at 40 C. The column was then<br />
washed with PBS containing 1M NaCl (pH 7.2) at a flow rate of<br />
lml/minute until no more protein could be detected in the effluent. The<br />
column was then washed quickly with PBS containing 0.15M NaCl (pH<br />
7.2) then eluted with 0.2M glycine-HCI (pH2.5) at a flow rate of 0.6<br />
ml/minute. The protein content of each 0.5m1 fraction was estimated<br />
by absorbance at 280nm and those fractions containing significant<br />
amounts of protein were pooled giving a total volume of 2.5m1 and the<br />
pH was adjusted to 7.0 by the addition of Tris buffer. The mouse IgG<br />
content of the pooled fractions was assessed by ELISA as described in<br />
section 2.2.5 and gave a titre of 1/32,000 at 50% of maximum<br />
absorbance.<br />
2.3.3 Determination of the protein content of the Pooled fractions.<br />
The protein content of the pooled fraction was assessed using the<br />
66
Biorad Protein assay, a modification of Bradfords dye binding assay<br />
(Bradford 1976). A standard curve was constructed using bovine<br />
serum albumin (BSA) standards ranging from 0 to l00pg/ml BSA (figure<br />
2.2). The protein content of the pooled fraction was calculated to be<br />
1.02mg/ml from the standard curve.<br />
2.3.4 Assessment of antibody purity by SDS-volyacrylamide gel<br />
electrophoresis.<br />
The purity of the protein in the pooled fraction was assessed by<br />
SDS-polyacrylamide gel electrophoresis using the discontinuous buffer<br />
system of Laemmli (1970).<br />
a) Reagents.<br />
1) Acrylamide stock solution. 30% acrylamide, 0.8% bis-acrylamide<br />
In distilled water. The solution was filtered and stored in the<br />
dark at 4" C.<br />
Ii) Reservoir buffer. 0.025M tris (PH 8.5), 0.05M glycine,<br />
0.1% SDS.<br />
iii) Sample buffer. 0.1M tris (pH 8.0), 0.75 mM EDTA. 1% SDS, 20%<br />
glycerol. For reducing gels. 5% mercaptoethanol was added.<br />
iv) Stacking gel buffer x4.0.6M tris-HC1 (pH 6.8). 0.4% SDS.<br />
v) Separating gel buffer x4.1.5M tris-HC1 (pH 8.8). 0.4% SDS.<br />
vi) Stain. 0.2% Coomassie blue (Sigma) in 95% ethanol. The stain was<br />
mixed with an equal volume of 20% acetic acid immediately before<br />
use.<br />
57
Figure 2.2. Standard curve for the determination of protein<br />
1.1<br />
1.0<br />
0.9<br />
E 0'6<br />
C<br />
t11<br />
0.7<br />
C<br />
m<br />
0.6<br />
0.5<br />
0 N<br />
ä 0.4<br />
0.3<br />
0.2<br />
0.1<br />
0<br />
a<br />
02468 10 12 14 16 18 20<br />
Bovine serum albumin jug/ml<br />
58
) Method.<br />
A discontinuous gel 1.5mm thick was cast between two glass<br />
plates. The separation gel (10% acrylamide) was overlaid with ai cm<br />
depth of stacking gel (5% acrylamide) cast around a comb to form sample<br />
application wells.<br />
The cast gel was run in a vertical gel tank with the upper and lower<br />
reservoirs filled with reservoir buffer. Protein was dissolved in sample<br />
buffer by boiling for 5 minutes, and loaded onto the gel in the sample<br />
application wells. A standard mixture comprising proteins of known<br />
molecular weights (Sigma; SDS-6H) was also loaded. Electrophoresis<br />
conditions were 40mA constant current for approximately 4 hours at<br />
room temperature or until the dye front had reached the bottom of the<br />
gel.<br />
The gel was released from the plate assembly and stained for 1<br />
hour. Protein bands were revealed by destaining in several changes of<br />
10% methanol, 10% acetic acid in water. Destained gels were dried under<br />
vacuum onto filter paper sheets. Under non-reducing conditions a single<br />
band at 15OkD was observed and under reducing conditions single bands<br />
at 50kD and 25kD molecular weight were observed representing heavy<br />
and light chains (Plate 2.1).<br />
69
Plate 2.1. <strong>An</strong>alysis of the purity of the 321 antibody standard<br />
polyacrylamide gel electrophoresis<br />
The plate shows the result of polyacrylamide gel electrophoresis of the<br />
321 antibody standard under reducing (lane 3) and non-reducing<br />
conditions (lanes 4 and 5). Lane 2 shows spent medium from the 321<br />
hybridoma before affinity chromatography. Lane 1 shows molecular<br />
weight standard marker mixture (Sigma SDS-6H) comprising<br />
ß-galactosidase (mw 116kD), phosphorylase b (mw 97kD), bovine<br />
albumin (mw 66kD). egg albumin (mw 45kD) and carbonic anhydrase (mw<br />
29kD).<br />
60
Plate 2.1<br />
kD<br />
116<br />
97 -<br />
69-<br />
45-%<br />
29-ýº<br />
123<br />
me<br />
r<br />
61<br />
45<br />
rrv -H+L<br />
-H<br />
-L
2.3.5 Assessment of antibody purity by high performance liquid<br />
chromatography.<br />
The purity of the antibody was also assessed by high<br />
performance liquid chromatography (HPLC). A TSK 4000 column was<br />
equilibrated in O. 1M sodium phosphate buffer pH 6.8. Samples were<br />
injected through a 20p1 loop at a flow rate of lml/minute and<br />
absorbance at 280nm was measured with a Beckman detector and<br />
recorded by a BBC microcomputer.<br />
Figure 2.2 shows absorbance traces<br />
of the purified protein sample and the protein standards (molecular<br />
weight markers for gel filtration; Sigma MW-GF-200) used to calibrate<br />
the column. Integration of the relative peak areas showed <strong>that</strong> the<br />
l5OkD peak represented 90% of the protein.<br />
62
--. -. -. -- _, mmß<br />
Figure 2.3. HPLC analysis of the purified 321 antibody<br />
20111 samples containing approximately 10pg of protein were loaded In<br />
each case. Absorbance profiles and retention times (Rt) are shown for<br />
the purified 321 antibody standard and for standard protein solutions<br />
of known molecular weight. The detector sensitivity was set to a full<br />
scale deflection of 0.1 absorbance units.<br />
63
Figure 2.3<br />
Purified 321 antibody<br />
JRt75s<br />
f3-amylase<br />
--k -<br />
Alcohol dehydrogenase<br />
Bovine serum albumin<br />
Carbonic anhydrase<br />
J\R675s<br />
1200s<br />
64<br />
Rt=545s<br />
Rt=575s<br />
Rt=603s
Chapter 3<br />
The Automated Assay System<br />
3.1 Requirements for an automated assay system.<br />
The optimisation of a cell culture system requires <strong>that</strong> regular and<br />
precise measurements of process variables can be made and <strong>that</strong> these<br />
measurements can be applied to control of the process. Whilst<br />
parameters such as pH and oxygen concentrations can be readily<br />
measured and controlled in bioreactors (Harris and Spier, 1985), the<br />
detection and quantification of proteins and other macromolecular<br />
products requires off-line assays which often precludes the direct<br />
control of their production. The initial aim of this project therefore, was<br />
to develop a system for the automated on-line quantification of<br />
monoclonal antibody concentration In bloreactors and to apply the<br />
system to the identification of parameters which Influence antibody<br />
production by hybridomas.<br />
In order to be effective as a monitoring system for antibody<br />
production in fermenters the system must fulfil three main<br />
requirements.<br />
i) Sensitivity. The assay must be sufficiently sensitive to detect small<br />
changes in antibody concentration over the concentration range seen in<br />
a typical culture. This may vary from 1-1000pg/ml depending on the<br />
hybridoma line and the process intensity.<br />
ii) Reproducibility. The assay should give accurate and reproducible<br />
results because it will not be possible to replicate samples in a<br />
dynamic process.<br />
65
iii) Reliability. The monitoring of product formation in bloreactors<br />
requires <strong>that</strong> the automated assay will run reliably for several days or<br />
weeks.<br />
3.1.1 Methods for the monitoring of product formation in bloreactors.<br />
High performance liquid chromatography (HPLC) and fast protein<br />
liquid chromatography (FPLC) are both fast and reproducible methods<br />
-for the separation and quantification of protein and because they<br />
work on a flow through basis they can be readily automated. The main<br />
disadvantages of such systems are <strong>that</strong> they are expensive for use In<br />
a dedicated monitoring system and the identity of the protein is<br />
assumed by its retention time and may be confused with molecular<br />
species with similar retention times.<br />
A direct sensing device would represent the ideal situation whereby<br />
the device would generate a detectable signal only on contact with<br />
the desired molecule. In reality the device has to be sensitised with a<br />
highly specific mediator which will convert the analyte into a product<br />
whose activity can be determined by more conventional sensors . such<br />
as ion selective probes or conductimetric, thermometric or light<br />
sensitive devices.<br />
Enzymes have received considerable attention as mediators due to<br />
the specificity of their catalytic activity and the ability of the<br />
appropriate enzyme to generate detectable moieties from its interaction<br />
with the analyte. The most common example of this type of sensor is the<br />
enzyme electrode where enzyme is bound directly to the porous<br />
membrane of an electrode. The probe is selective for ions generated<br />
66
y the specific interaction of the enzyme with its substrate and because<br />
the reaction takes place in the immediate vicinity of the probe it is a<br />
highly sensitive system. A typical example of this type of probe is an<br />
enzyme pH electrode to detect glucose by immobilised glucose<br />
oxidase (Nilsson et al., 1972).<br />
However the use of enzymes is limited because it is necessary to<br />
have a well . characterised enzyme-substrate interaction which will<br />
also elicit a detectable response. Such enzymes are readily available<br />
for simple molecules such as glucose or amino acids but more<br />
complex or novel molecules present considerable difficulties in the<br />
Identification and characterisation of an enzyme system.<br />
<strong>An</strong> alternative to the enzyme is the use of specific antibodies<br />
to capture the analyte. This in itself will not generate a detectable<br />
response for conventional probes, although research is progressing<br />
into the use of direct sensing devices such as sensitised- piezo<br />
electric crystals (Roedere and Bastiaans, 1983) or antibodies bound<br />
to fibre optics (Sutherland et al., 1984) which will directly detect<br />
antibody antigen interactions. It is therefore necessary to introduce<br />
a second component into the assay. This, could be either labelled<br />
antigen in a competitive assay or labelled second antibody in a<br />
sandwich assay. The labels could be isotopic, fluorescent or enzymic<br />
in nature making the assay analogous to the solid phase immunoassay<br />
which is widely used in research and clinical applications. The main<br />
limitation with conventional solid-phase assays is In the time<br />
required for the assay due to the small available surface area and<br />
long diffusion distances encountered in the tubes or microwell plates<br />
which are generally used. The use of a suspension of small<br />
particles as the solid phase in ELISA provides a much greater surface<br />
67
area for a given volume of fluid and allows more rapid interactions<br />
between free and surface-bound molecules. Sepharose appears well<br />
suited as a solid phase with a small particle size of less than 100um and<br />
a well characterised surface chemistry allowing the covalent coupling<br />
of proteins. Sepharose beads formed the basis of the ELISA devised by<br />
Engvall and Perlman (1971). Washing stages however required<br />
the separation of beads from the suspension at each stage making the<br />
process difficult to automate although an automated ELISA using<br />
membrane separation of the beads during washing has been developed<br />
(Ismail et al., 1981).<br />
The use of a packed bed of Sepharose would eliminate the need<br />
for the separation of Sepharose from the reactants in <strong>that</strong> the bed<br />
could be perfused sequentially with the reactants and wash buffers<br />
and would facilitate automation. Such systems have been used for the<br />
assay of protein molecules, for example Mattfasson et al. (1977) used<br />
anti-human albumin antibody bound to Sepharose in a competitive<br />
ELISA for human albumin. Bound enzyme-antibody conjugate was<br />
quantified using a thermistor to detect the heat generated from the<br />
enzyme reaction with a substrate. They were able to repeatedly<br />
regenerate the bed (>30 times) in order to assay further samples.<br />
In addition Preston and Spier (unpublished results) demonstrated<br />
the feasibility of a sandwich ELISA with Sepharose-bound antibody<br />
for the detection of foot and mouth disease virus antigen on a<br />
continuous basis.<br />
The initial part of this investigation was to modify and develop this<br />
type of assay with the aim of producing a fully automated ELISA for<br />
the detection of monoclonal antibody in culture. For the purposes of<br />
the assay a colorimetric determination of enzyme activity was adopted<br />
68
as a simple detection system which could be readily automated. In the<br />
system of Preston and Spier peroxidase-labelled second antibody was<br />
used to develop the chromogen whereas in this study the use of<br />
alkaline phosphatase was adopted due to the greater stability of the<br />
substrate (p-nitrophenyl phosphate).<br />
3.2 Immunosorbent preparation.<br />
3.2.1 Preparation of IgG fraction from sheep serum.<br />
Sheep anti-mouse immunoglobulin was obtained from the<br />
Scottish <strong>An</strong>tibody Production Unit. The IgG fraction was prepared by<br />
anion exchange chromatography as follows.<br />
Washed DE52 cellulose (Whatman) was poured into a 2.6 cm<br />
diameter glass column to a bed height of 30cm. The column was then<br />
equilibrated overnight against 0.0175M sodium phosphate buffer<br />
pH6.4. A lOml aliquot of sheep anti-mouse serum was dialysed<br />
against the same buffer overnight. The serum was then centrifuged at<br />
1800xg for 10 minutes to remove any precipitate and the clarified serum<br />
was pipetted directly onto the surface of the column bed. The bed was<br />
then eluted with sodium phosphate buffer at a flow rate of<br />
iml/minute and 2m1 fractions were collected. The, absorbance at<br />
280nm of the column effluent was monitored using a imm pathlength<br />
flow cell (LKB) in an LKB Ultrospec spectrophotometer. The data was<br />
recorded using a BBC microcomputer connected - via the RS232<br />
port of the spectrophotometer: The absorbance of a 1mg/ml solution<br />
of IgG was taken as 0.14 for a 1mm pathlength flowcell. Under these<br />
conditions the IgG fraction of the serum eluted at the void volume<br />
69
of the column whilst other serum proteins were retained. Bound<br />
proteins were desorbed with 0.4M sodium phosphate buffer (pH 6.8) and<br />
the column was then re-equilibrated in 0.0175M phosphate buffer as<br />
above.<br />
The mouse immunoglobulin-specific titre of each fraction was<br />
assessed by competitive ELISA. Each fraction was titrated against<br />
mouse IgG with alkaline phosphatase-labelled anti-mouse IgG as the<br />
competing antibody. Figure 3.1 shows the recorded absorbance and the<br />
mouse immunoglobulin specific antibody titre of the collected<br />
fractions.<br />
Those fractions showing anti-mouse immunoglobulin activity were<br />
assessed for purity by SDS-polyacrylamide electrophoresis. Plate 3.1<br />
shows a non-reducing gel of the IgG fraction from the ion exchange<br />
column. Essentially all proteins have been removed except for a protein<br />
band at 150kD corresponding to immunoglobulin. The bands visible at<br />
5OkD and 25kD suggest <strong>that</strong> there was some degradation to the heavy<br />
and light chain components of IgG.<br />
3.2.2 Coupling antibody to Sepharose CL4B.<br />
Immunoglobulin was bound to Sepharose CL4B by a modification of<br />
the periodate oxidation method of Wilson and Nakane (1976).<br />
The required amount of Sepharose was washed with distilled<br />
deionised water to remove preservatives and fine particles. The<br />
Washed Sepharose was added to 100 mg/ml aqueous sodium periodate<br />
solution and mixed gently for three hours at room temperature. The<br />
70
Figure 3.1. Purification of the IgG fraction of sheep anti-mouse serum<br />
m<br />
x<br />
aJ<br />
C-<br />
-+--<br />
: F-<br />
IV<br />
0<br />
.c<br />
c<br />
Q<br />
using anion exchange chromatography.<br />
5<br />
4<br />
3<br />
2<br />
1<br />
0<br />
70 80 90 100 110<br />
Elution volume (ml)<br />
0.5<br />
0.4<br />
0.3<br />
0.2<br />
0.1<br />
The figure shows the elution profile obtained from a DEAE ion exchange<br />
column loaded with 10ml sheep serum and eluted using 1r . 5mM sodium<br />
phosphate buffer (pH6.4).<br />
<strong>An</strong>ti-mouse immunoglobulin titre as determined by<br />
competitive ELISA.<br />
Absorbance at 280nm. 0.1cm path length.<br />
71<br />
0<br />
E<br />
C<br />
O<br />
CO<br />
N<br />
GJ<br />
Li<br />
C<br />
O<br />
N<br />
.O<br />
a
Plate 3.1 PAGE analysis of the protein fractions obtained from the DEAE<br />
cellulose column<br />
The plate shows the result of PAGE analysis of fractions obtained by<br />
anion exchange chromatography of sheep anti-mouse IgG serum. Lanes<br />
1-5 show fractions obtained from the DEAE cellulose column<br />
corresponding to the major protein peak as shown in figure 3.1. Lane 6<br />
shows dialysed sheep serum before fractionation and lane 7 shows<br />
molecular weight standard marker mixture (Sigma SDS-6H) comprising<br />
myosin (mw 205kD), ß-galactosidase (mw 116kD), phosphorylase b (mw<br />
97kD), bovine albumin (mw 66kD), egg albumin (mw 45kD) and carbonic<br />
anhydrase (mw 29kD).<br />
72
Plate 3 .1<br />
12345 67<br />
ýýý<br />
6.. m -<br />
73<br />
+ýw<br />
r<br />
ýº - - 200<br />
4-<br />
-116<br />
_ 97<br />
- 69<br />
.. -29<br />
45
gel was then washed quickly with saline, followed by 10% aqueous<br />
ethanediol and finally coupling buffer (0.1M carbonate buffer pH9.5).<br />
A 1mg/ml solution of immunoglobulin in coupling buffer was added to<br />
the activated Sepharose at a ratio of 5m1 per gram dry weight of<br />
Sepharose and the suspension was mixed gently overnight at 40 C. After<br />
coupling, any remaining aldehyde groups were reduced with<br />
sodium borohydride. This also served to stabilise the Schiff bases<br />
formed during coupling and made the matrix less prone to leakage of<br />
antibody. The amount of antibody coupled by this procedure was<br />
assessed' by subtracting the amount of protein remaining in solution<br />
from the initial concentration before coupling.<br />
The gel was finally washed with copious quantities of phosphate<br />
buffered saline (PBS, pH7.2) and stored in PBS+0.01 % thimerosal<br />
(Sigma) until required.<br />
3.2.3 Assessment of the Immunosorbent In the ELISA.<br />
Conditioned medium from a 48 hour culture of the 321 hybridoma was<br />
used as a source of mononclonal antibody. The medium was assayed by<br />
conventional ELISA (see section 2.2.5) using purified 321 antibody as a<br />
standard and was found to contain 100pg/ml of IgG. The medium was<br />
stored at- -2011 C in 5m1 aliquots and was used throughout the<br />
characterisation of the immunosorbent.<br />
Conditioned medium was diluted from neat to 1/10.000 in fresh<br />
growth medium. A 60p1 aliquot of packed immunosorbent beads was<br />
added to 1.5m1 centrifuge tubes containing iml aliquots of each<br />
medium dilution and a medium control of fresh medium only. The tubes<br />
74
were mixed by rolling for 1 hour at room temperature. The<br />
beads were washed twice with Iml aliquots of PBS containing 0.1%<br />
Tween20. <strong>An</strong> appropriate dilution of alkaline phosphatase labelled<br />
sheep anti-mouse IgG In PBS was added to each tube and mixed for a<br />
further hour. The beads were washed again with PBS Tween then 0.5m1<br />
of a 1mg/ml solution of p-nitrophenyl phosphate in 0.1M carbonate<br />
buffer pH9.5 was added to each tube. The tubes were then mixed for<br />
30 minutes to allow the colour to develop. After centrifuging, 100p1<br />
samples from each tube were transferred to a microtitre plate and the<br />
absorbance at 405nm read with a Dynatech plate reader.<br />
To ensure <strong>that</strong> the effects were not due to nonspecific<br />
interaction on the Sepharose two control experiments were also set<br />
up. The first control was normal sheep serum bound to Sepharose by<br />
the same method and the second was similarly treated Sepharose but<br />
with no bound protein. Figure'3.2 shows absorbance readings obtained<br />
for each experiment.<br />
It was apparent <strong>that</strong> there was a significant increase In<br />
absorbance with increasing monoclonal antibody concentration for the<br />
sheep anti-mouse immunosorbent. The assay was sensitive to a<br />
concentration of 100ng/ml of antibody but the absorbance fell again<br />
at high concentration indicating <strong>that</strong> the column had become saturated<br />
with mouse monoclonal antibody. The controls showed no increase in<br />
absorbance with increasing monoclonal antibody concentration<br />
indicating <strong>that</strong> there was little non-specific interaction with the<br />
Sepharose.<br />
76
Figure 3.2. ELISA using anti-mouse IgG bound to Sepharose as the solid<br />
phase<br />
1.4<br />
1.2<br />
p 1.0<br />
0<br />
a<br />
v<br />
C<br />
0.8<br />
0.6<br />
ä 0.4<br />
0.2<br />
0<br />
0.001 0.01 0.1 1 10 100<br />
321 <strong>An</strong>tibody (, ug/ml)<br />
The figure shows the absorbance obtained at 410nm for diluted medium<br />
samples containing 0.001-100pg 321 antibody/ml.<br />
0 Sepharose with immobilised anti-mouse IgG.<br />
Sepharose with immobilised normal sheep serum.<br />
0 Sepharose without bound protein.<br />
76
3.2.4 Continuous flow ELISA.<br />
The use of Sepharose with covalently bound sheep anti-mouse<br />
Immunoglobulin for ELISA has been demonstrated in tubes and it was<br />
necessary to demonstrate <strong>that</strong> the ELISA could be run on a continuous<br />
flow principle using a packed bed of immunosorbent beads.<br />
Initial experiments were carried out with a 3mm id x 100mm glass<br />
column (Omnifit Ltd) with a bed volume of 600p1. The column was filled<br />
with immunosorbent and equilibrated with phosphate buffered saline<br />
(pH7.2). The flow rate through the column was maintained at<br />
0.25m1/minute by a Gilson peristaltic pump. Samples were injected onto<br />
the column using a iml loop accessed via a 3-way valve (figure 3.3) and<br />
were washed through with 2m1 PBS. Alkaline phosphatase labelled<br />
anti-mouse IgG was then introduced through the sample loop<br />
followed by a further wash of PBS. ' Finally p-nitrophenyl<br />
phosphate was injected through the sample loop and allowed to react<br />
on the column for 10 minutes. The reacted substrate was then passed<br />
through a flow cell (1mm pathlength) in an LKB Ultrospec<br />
spectrophotometer and absorbance readings were recorded at 10<br />
second intervals. In the initial experiments the column was<br />
regenerated with a 2ml wash with 3M sodium thiocyanate between<br />
samples.<br />
Dilutions of conditioned medium samples were assayed using the<br />
continuous flow ELISA. Figure 3.4 shows a typical set of data from<br />
the ELISA and figure 3.5 shows peak area plotted against antibody<br />
concentration for the same data. The assay was sensitive to<br />
concentrations of 321 antibody between 1 and 100 jig/ml and although<br />
77
Figure 3.3 The continuous flow ELISA system<br />
Spectrophotometer<br />
78<br />
Buffer<br />
lp
Figure 3.4. Absorbance traces for the continuous flow ELISA<br />
The absorbance traces were obtained using the continuous flow ELISA<br />
for the assay of diluted medium samples containing a)1001ig, b)1011g,<br />
c)111g, d)O. lpg 321 antibody and e) a medium control without antibody.<br />
The assay was performed using a 3mm ID glass column containing 600u1<br />
Sepharose with 4.5mg Immobilised anti-mouse IgG/g Sepharose.<br />
79
E0<br />
C<br />
L, f1<br />
O<br />
0.2<br />
0.1<br />
0.1<br />
0<br />
0.1<br />
0<br />
Figure 3.4<br />
0<br />
.123 -0<br />
123.4<br />
Eluent volume (ml)<br />
-<br />
80
Figure 3.5. Assay of medium samples using the continuous flow ELISA<br />
1.6<br />
1.4-<br />
E 1.2<br />
C<br />
I:::<br />
1.0<br />
< 0.4<br />
0.2<br />
0<br />
0 0.1 1.0 10 100<br />
321 antibody (jig Iml)<br />
The ELISA curve was obtained using the continuous flow ELISA for<br />
diluted medium samples containing 0-100lig/ml 321 antibody. The assay<br />
was performed using a 3mm ID glass column containing 600µl Sepharose<br />
with 4.5mg Immobilised anti-mouse IgG/g Sepharose. Each point<br />
represents the area of the substrate peak measured for each sample.<br />
81
the background absorbance was considerably higher than <strong>that</strong> found<br />
with the tube assay it served to demonstrate <strong>that</strong> the assay could be<br />
performed on the column.<br />
3.3 The automated assay.<br />
Having demonstrated the feasibility of a continuous flow ELISA<br />
it was possible to develop a fully automated system operated by<br />
computer. A BBC microcomputer was adopted for operation of the<br />
assay because the BBC lends itself well to the input/output operations<br />
required for the assay and because software for the control of the<br />
LKB spectrophotometer had already been developed and could be<br />
readily modified for the purposes of the automated assay (see section<br />
3.3.1).<br />
The system designed (figure 3.6) utilised 12v miniature solenoid<br />
valves (Lee Engineering) to actuate the various additions of<br />
reagents and a peristaltic pump (Gilson) to determine the flow rate.<br />
A sample loop ensured <strong>that</strong> a constant volume of sample was added in<br />
each assay cycle whilst all other reagents were added by a timed<br />
sequence at constant flow rate.<br />
The solenoid valves were operated by the computer via an<br />
interface which provides a 12 volt power supply in response to a +b<br />
volt signal from the computer. The interface was designed and built by<br />
Karel Newman, Department of Microbiology. University of Surrey (see<br />
Appendix I).<br />
82
Figure 3.6. Schematic diagram of the automated continuous flow ELISA<br />
system<br />
Key to numbered parts.<br />
1) Reservoir containing phosphate buffered saline.<br />
2) Sample loop.<br />
3) Reservoir containing alkaline phosphatase-labelled anti-mouse IgG.<br />
4) Reservoir containing p-nitrophenyl phosphate solution (lmg; ml).<br />
5) Reservoir containing the column regenerating buffer (see text for<br />
details).<br />
6) Immunosorbent column containing Sepharose with immobilised<br />
anti-mouse IgG.<br />
7) Spectrophotometer.<br />
8) BBC microcomputer.<br />
9) RS232 interface.<br />
10) Sample injection point.<br />
83
%D<br />
t4nrl<br />
d<br />
all<br />
m<br />
4-- 0)<br />
N<br />
. i-<br />
t0 N<br />
3 vu<br />
84<br />
N<br />
4-<br />
H<br />
3
3.3.1 Computer operation of the assay.<br />
The BBC microcomputer was programmed in BBC basic. The<br />
program is listed in Appendix II. The timed control of the solenoid<br />
valves was made by reference to the computers internal clock. The<br />
clock was set to zero at the beginning of the assay and was referred<br />
to constantly to provide a record of elapsed time. The solenoid<br />
valves were operated via the 8 bit input/output port (user port).<br />
The user port is memory mapped by the 6622 VIA (versatile Interface<br />
adapter) and switching of any of the 8 lines was achieved by writing<br />
to the user port memory area designated SHEILA. This is achieved<br />
using an operating system byte (OSBYTE) call with the A register<br />
containing &FFF4 (write to memory) and the x and y registers<br />
containing the address and the byte to be written respectively. Each<br />
of the 8 output lines operated one valve so all of the 8 valves were<br />
operated independently.<br />
The computer also controlled the LKB spectrophotometer via the<br />
RS232 serial data interface and data was sent back to the computer by<br />
the same route. When coloured substrate was passed through the flow<br />
cell in the spectrophotometer the absorbance was recorded by the<br />
computer at 5 second intervals. This data was stored until all<br />
readings had been taken then the computer calculated the area of the<br />
substrate peak and stored the result on disc with the time of the<br />
reading. The VDU screen displayed a graph of substrate peak area<br />
against time which was updated each time an assay cycle was<br />
completed. Because all data was stored on disc it was possible to<br />
retrieve and display data from previous runs.<br />
85
3.3.2 Sequence of events during the automated assay.<br />
1) Sample was drawn from the sample reservoir into a lml sample<br />
loop. Buffer already in the loop was run to waste until the<br />
loop contained the sample only.<br />
ii) The sample was run onto the Immunosorbent column followed by<br />
PBS which flushed the sample loop. The column was washed with<br />
3m1 of PBS to remove any unbound material.<br />
Mouse monoclonal<br />
antibody in the sample was bound by the immunosorbent column.<br />
iii) Alkaline phosphatase labelled anti-mouse IgG was then run<br />
onto the column. <strong>An</strong>ti-mouse IgG will bind to any mouse<br />
monoclonal antibody on the column.<br />
iv) The column was washed with a further 3m1 of PBS.<br />
v) Enzyme substrate (p-nitrophenyl phosphate) was then run onto<br />
the column.<br />
vi) The flow through the column was stopped and the substrate<br />
allowed to react for 10 minutes.<br />
vii) Reacted substrate was washed off the column through a flow<br />
cell in the LKB spectrophotometer.<br />
viii) The column was regenerated by eluting the antibody complex.<br />
ix) The column was washed with 3m1 PBS before the next sample was<br />
applied.<br />
The entire assay was carried out at a flow rate of<br />
0.3m1/minute. The valve sequence was designed so <strong>that</strong> the<br />
peristaltic pump was operating continuously eliminating the need for<br />
a second interface to control the pump. This also alleviated power<br />
86
spikes caused by the switching of high Inductive loads such as pumps.<br />
The RS232 interface had been found to be sensitive to power spikes on<br />
previous occasions but in the configuration described there were no<br />
instances of program failure.<br />
3.4 Optimisation of the automated assay.<br />
3.4.1 Determination of the optimum labelled antibody dilution.<br />
The optimum antibody dilution for alkaline phosphatase labelled<br />
anti-mouse IgG was determined by comparing absorbance values for<br />
medium containing 100ug/ml 321 antibody with fresh medium<br />
containing no antibody for a range of dilutions of labelled antibody.<br />
The optimum dilution was considered to be <strong>that</strong> which produced the<br />
greatest ratio between background and sample readings.<br />
Figure 3.7 shows background absorbance levels for labelled<br />
antibody dilutions between 1/250 and 1/2000. Labelled antibody<br />
dilutions of 1/750 and 1/1000 gave the lowest background level and<br />
1/1000 was used as the optimum dilution in subsequent experiments.<br />
3.4.2 Buffer composition.<br />
The high background absorbance observed In the automated ELISA<br />
was initially thought to be due to insufficient washing of the<br />
immunosorbent. Increasing washing times with PBS between the various<br />
additions of reagents did not significantly reduce the background<br />
level. The inclusion of 0.1% Tween 20 in the wash buffer reduced<br />
the background absorbance only slightly. The use of high ionic<br />
87
Figure 3.7. Determination of the optimal enzyme-labelled second<br />
C<br />
M<br />
O<br />
L<br />
antibody dilution<br />
100<br />
75<br />
Li 50<br />
m<br />
ol<br />
0<br />
25<br />
0<br />
The assay was performed using a 6mm ID glass column containing 500{1<br />
Sepharose with 4.5mg immobilised anti-mouse IgG/g dry weight<br />
Sepharose. The bars represent the substrate-peak area measured at<br />
405nm for fresh medium without antibody expressed as a percentage of<br />
the peak area obtained for a sample containing 100ug 321 antibody. The<br />
background absorbance levels were compared for a range of dilutions of<br />
the enzyme-labelled second antibody.<br />
250 500 750 1000 2000<br />
Labelled antibody 'dilution<br />
88
strength buffers with 0.5M salt reduced overall absorbance readings<br />
but the ratio between background absorbance and sample readings was<br />
not greatly increased.<br />
It appeared <strong>that</strong> the nature of the background seen In the column<br />
ELISA was not due to non-specific binding of antibody nor was it due<br />
to insufficient washing of the Immunosorbent. It had been shown<br />
previously <strong>that</strong> there was little non-specific interaction with<br />
Sepharose in the tube experiments (Section 3.2.3). It was observed<br />
however <strong>that</strong> the background level in the first assay cycle was<br />
considerably lower than in subsequent cycles. This would suggest<br />
<strong>that</strong> one or more of the assay components was not being fully eluted<br />
from the column by the use of 3M sodium thiocyanate. In order to<br />
determine which of the assay components was not being fully eluted a<br />
fresh immunosorbent column was used.<br />
Absorbance values for the following reagent combinations were<br />
recorded on two successive assay cycles.<br />
1. Substrate only.<br />
2. Labelled antibody and substrate.<br />
3.100pg 321 antibody, labelled antibody and substrate.<br />
Figure 3.8 shows absorbance values for each step.<br />
The background due to substrate alone did not increase on the<br />
second cycle indicating <strong>that</strong> the labelled antibody was being fully<br />
eluted. However the background due to labelled antibody + substrate<br />
was considerably higher on the second cycle than on the first implying<br />
<strong>that</strong> the 321 monoclonal antibody was not being completely eluted<br />
from the column. The sample absorbance was similar on successive<br />
cycles.<br />
89
Figure 3.8. Determination of the nature of the high background levels<br />
observed in the continuous-flow<br />
ELISA<br />
The assay was performed using a 6mm ID glass column containing 500it1<br />
Sepharose with 4.5mg immobilised anti-mouse IgG/g dry weight<br />
Sepharose. The bars represent the substrate peak area measured at<br />
405nm. The background levels for freshly prepared Sepharose (bars A.<br />
B and C) were compared with the background levels for Sepharose In the<br />
second assay cycle (D, E and F).<br />
A and D Substrate only<br />
B and E Enzyme labelled second antibody + substrate<br />
C and F 100pg 321 antibody + enzyme labelled second antibody +<br />
substrate.<br />
90
0<br />
E 3<br />
cv<br />
a)<br />
m<br />
Y<br />
f0<br />
GJ<br />
a.<br />
a 1.<br />
Figure 3.8<br />
A B C 0 E F<br />
91<br />
1
The computer program was modified to determine whether increased<br />
elution time resulted, in more antibody being eluted from the<br />
immunosorbent column. The percentage background was assessed for<br />
medium containing 100µg/ml 321 antibody after elution cycles of<br />
varying duration. However it was found <strong>that</strong> increased elution time<br />
had no effect on the amount of antibody desorbed from the column<br />
(figure 3.9).<br />
Other agents were investigated for their effectiveness in eluting<br />
bound antibody from the column. Glycine-HC1 (0.2M, pH 2.5) is<br />
commonly used for the desorption of proteins in affinity<br />
purification but it was found to be only slightly more effective<br />
than 3M sodium thiocyanate (figure 3.10). The use of 0.5M acetic acid<br />
was recommended by Smith et al. (1977) as being more effective than<br />
chaotropic agents in the elution of bound antigens whilst Janatova<br />
and Gobel (1984) advocate the use of 1M acetic acid. The effectiveness<br />
of acetic acid for column regeneration and its effect on column stability<br />
were investigated. The use of 1M acetic acid was found to be most<br />
effective in desorbing antibody (figure 3.10) reducing background<br />
readings to 20-25% of the 100ug/ml sample reading. Furthermore, 1M<br />
acetic acid did not have any immediate deleterious effects on the<br />
stability of the immunosorbent because the substrate peak area for<br />
100pg 321 antibody remained the same over a period of 24 hours (figure<br />
3.11).<br />
Molar acetic acid was therefore used as an eluting agent for the<br />
automated ELISA. All other conditions were as described previously<br />
with the exception <strong>that</strong> 0.1% Tween 20 was included in the wash<br />
buffer to prevent any accumulation of protein on the valve surfaces.<br />
92
Figure 3.9. The effect of increasing the volume of 3M sodium thiocyanate<br />
used to elute bound antibody.<br />
100<br />
90<br />
aj 80<br />
u<br />
C<br />
70<br />
L<br />
O<br />
60<br />
50<br />
0<br />
L- 40<br />
u<br />
m 30<br />
20<br />
10<br />
0<br />
02468 10 12<br />
Etuent volume (ml)<br />
The assay was performed using a 6mm ID glass column containing 500µ1<br />
Sepharose with 3.9mg immobilised anti-mouse IgG/g dry weight<br />
Sepharose. The volume of 3M NaSCN used to elute the bound antibody<br />
complex was Increased during successive assay cycles. The points<br />
represent the substrate peak area measured at 405nm for fresh medium<br />
without antibody expressed as a percentage of the peak area obtained<br />
for a sample containing 10011g 321 antibody.<br />
93
Figure 3.10. Assessment of the effectiveness of different elution buffers<br />
The assay was performed using a 6mm ID glass column containing 500$11<br />
Sepharose with 3.9mg immobilised anti-mouse IgG/g dry weight<br />
Sepharose. The bars represent substrate peak areas recorded for medium<br />
samples containing 100ug 321 antibody and medium samples containing<br />
no antibody (hatched bars). Each bar is the average of two readings<br />
obtained in successive assay cycles using the following elution buffers:<br />
A 3M sodium thiocyanate<br />
B 0.2M glycine/HC1 pH 2.5<br />
C 0.5: ß1 acetic acid<br />
D iM acetic acid<br />
94
E<br />
C<br />
ýn<br />
02<br />
to<br />
a<br />
f0<br />
GJ<br />
0<br />
0<br />
Figure 3.10<br />
ABC0<br />
95
Figure 3.11. The effect of different elution buffers on the assay stability<br />
The assay was performed using a 6mm ID glass column containing 5O0µ1<br />
Sepharose with 4.5mg immobilised anti-mouse IgGig dry weight<br />
Sepharose. Each set of data points represents the peak area at 405nm<br />
recorded over a 24 hour period for a medium sample containing 100pg/ml<br />
321 antibody.<br />
Elution buffer<br />
O 3M NaSCN<br />
p 0.5bi acetic acid<br />
Q 1M acetic acid<br />
96
9<br />
CD<br />
4J<br />
c0<br />
cu<br />
Q_<br />
3<br />
1<br />
oý<br />
0<br />
Figure 311<br />
5 10 15 20 25<br />
Time -- (hours)<br />
97
3.5 Assay performance.<br />
To assess the usefulness of the assay for the detection of<br />
monoclonal antibody in culture supernatant a standard curve was<br />
constructed by assaying increasing concentrations of the 321<br />
monoclonal antibody over a period of 36 hours.<br />
A 100ml gradient mixer (Biorad) was used for the experiment with<br />
the starting buffer consisting of fresh medium and the limiting<br />
buffer consisting of conditioned medium diluted to contain 100pg/ml<br />
of 321 antibody. As samples of constant volume were drawn from the<br />
reservoir, the Increase in antibody concentration could be calculated.<br />
The experiment was left to run automatically for 36 hours and<br />
absorbance readings were plotted against concentration on<br />
completion of the run. Figure 3.12 shows a typical antibody<br />
concentration curve obtained with the automated ELISA. The plot of<br />
antibody concentration against absorbance was linear over the range<br />
of 5-100pg/ml of monoclonal antibody and analysis of the curve by<br />
linear regression gave a correlation coefficient of 0.99.<br />
The reproducibility of the automated assay was assessed by<br />
repeated determinations of antibody In two samples containing 25 and<br />
100pg/ml respectively. The samples were assayed alternately with 6<br />
replicates for each sample.<br />
Table 3.1 shows absorbance readings for samples of medium<br />
containing 25 and 1001jg/ml. These readings corresponded to 28 and<br />
92pg/ml as calculated from the standard curve above.<br />
98
Figure 3.12. Standard curve for the continuous flow ELISA<br />
E<br />
c<br />
0<br />
It<br />
2.5<br />
2.0<br />
IV 1.5<br />
L<br />
f0<br />
a-<br />
1.0<br />
0.5<br />
I<br />
The assay was performed using a 6mm ID glass column containing 500µ1<br />
Sepharose with 4.5mg immobilised anti-mouse IgG/g dry weight<br />
Sepharose. The curve represents the substrate peak area recorded for<br />
each sample plotted against the calculated antibody concentration for<br />
<strong>that</strong> sample.<br />
0 10 20 30 40 50 60 70 80 90 100<br />
321 antibody pg /ml<br />
99<br />
)
Table 3.1 Reproducibility of the automated ELISA<br />
Determination<br />
Peak area<br />
321 <strong>An</strong>tibody Baseline<br />
25}ßg/ml 100}ßg/ml<br />
1 1.21 2.06 0.75<br />
2 1.23 2.05 0.81<br />
3 1.20 2.03 0.78<br />
4 1.25 1.99 0.72<br />
5 1.23 1.99 074<br />
6 1.30 2.08 0.74<br />
Mean 1.24 2.03 0.76<br />
Standard<br />
deviation<br />
0.036 0.037 0.035<br />
100
3.6 The use of the automated ELISA for monitoring bioreactors.<br />
The principle of using an immunosorbent column for automated<br />
ELISA has been demonstrated under experimental conditions. The<br />
reproducibility of the assay was comparable to a conventional plate<br />
ELISA with a coefficient of variation of less than 6% for a limited<br />
number of samples. The sensitivity of the assay was limited by time<br />
and sample size but would detect paräquat antibody to bug/ml In<br />
the configuration described. Greater sensitivity could be obtained by<br />
increasing the sample size but this caused column saturation at the<br />
higher antibody concentrations seen in late batch cultures of the 321<br />
hybridoma.<br />
When the assay was applied to monitoring of bloreactors however,<br />
a number of problems were encountered.<br />
3.6.1 Column comoresslon.<br />
After prolonged use the column packing became compressed. This<br />
typically, occured between 36 and 48 hours resulting in a reduction<br />
of flow rate and a consequent loss of accuracy and reproducibility. It<br />
was also found <strong>that</strong> the packing was Irreversible In <strong>that</strong> the<br />
Immunosorbent could not be readily redispersed within the column.<br />
Reversing the direction of buffer flow through the column merely caused<br />
the compacted plug of Sepharose to move down the column without<br />
dispersing. Several attempts were made to alleviate the compression<br />
of the immunosorbent.<br />
i) Immunosorbent column dimensions. The dimensions of the column were<br />
101<br />
7i
a compromise between the speed and sensitivity of the assay. The<br />
immunosorbent volume was kept to a minimum to allow a rapid assay<br />
and economical use of reagents. The sensitivity of the assay dictated<br />
the minimum volume of immunosorbent <strong>that</strong> could be used.<br />
By increasing the cross-sectional area of the column whilst<br />
maintaining the same bed volume, the pressure drop through the bed<br />
could be reduced which In turn reduces the compression of the<br />
immunosorbent. In early experiments a 3mm ID xlOOmm column which<br />
held 6001i1 of immunosorbent was used. The maximum flow rate <strong>that</strong><br />
could be achieved was 0.3m1/minute but such flow rates caused rapid<br />
compression of the column packing and increased back pressure. In<br />
an attempt to improve the flow characteristics of the column a 6mm ID<br />
glass column was adopted. With 500p1 of immunosorbent the flow rate<br />
could be maintained for longer periods of time but compression of the<br />
Immunosorbent still occured after approximately 3 days. It was not<br />
possible to increase the column diameter further without increasing<br />
the volume of Immunosorbent and increasing the assay time.<br />
11) Flow rate. Reducing the flow rate through the column would also<br />
serve to reduce compaction of the Immunosorbent. However a<br />
reduction in the flow rate increases the time required for the assay<br />
of a single sample. A cycle of the assay takes 76 minutes at a flow<br />
rate of 0.3ml/minute and the need to check baseline and standard<br />
samples at regular intervals increases the time between samples to<br />
approximately<br />
2 hours.<br />
iii) Direction of buffer flow. All reagents and buffers were routinely run<br />
upwards through the Sepharose bed in an attempt to alleviate<br />
102
compression due to gravity. This had very little effect at the flow<br />
rates required for the assay as these were considerably more than the<br />
settling velocity of the Sepharose. Reversing the direction of buffer<br />
flow by inverting the column at regular intervals did not alleviate<br />
the problem of column packing.<br />
iv) Solid phase. The problems encountered were largely due to the<br />
compressible nature of the Sepharose which was being used as the solid<br />
phase. It would therefore appear <strong>that</strong> a more rigid and less cohesive<br />
solid phase would overcome these problems. The use of a rigid particle<br />
would also allow the assay to carried out more rapidly.<br />
Preliminary experiments with silanised porous glass as a solid<br />
phase were carried out. The activated porous glass was kindly provided<br />
by Dr P. Kwasowski of the Department of Biochemistry. University of<br />
Surrey. The IgG fraction of sheep anti-mouse antibody was coupled to<br />
the porous glass by cross linking with glutaraldehyde and any<br />
remaining groups were blocked by the addition of 1M ethanolamine.<br />
These preliminary experiments however showed very high background<br />
levels which masked any specific interaction between sheep anti-mouse<br />
and 321 monoclonal antibody. The high background levels were<br />
probably due to non-specific interactions with the modified<br />
surface chemistry of the glass. It is possible <strong>that</strong> such non-specific<br />
interactions could be reduced or eliminated by modification of the<br />
surface chemistry of the glass or by the use of other blocking agents<br />
but this would need much further investigation.<br />
The coupling of proteins to other rigid particles such as modified<br />
polystyrene (Neurath and Strick. 1981). nylon (Morris et al.. 1975;<br />
Hendry and Herrmann, 1980) or various inorganic matrices<br />
103
(Weetall, 1976) has been described and may prove useful as the solid<br />
phase in ELISA but would need extensive investigation and<br />
characterisation.<br />
<strong>An</strong> alternative to solid phase immunoassays is the use of<br />
homogeneous enzyme immunoassays. Such assays do not require<br />
separation of reagents because the enzyme activity is directly<br />
modulated by antibody antigen reactions. The most common form is<br />
widely known under the trade name EMIT (Syva Corporation) and was<br />
first developed by Rubenstein etal. (1972). This system is effective only<br />
with smaller antigens such as drugs due to the configuration of the<br />
assay.<br />
A more promising technique for larger antigens such as antibody<br />
molecules is the proximal linkage system where two monoclonal<br />
antibodies against different epitopes on the same antigen are<br />
labelled with different enzymes (Ngo and Lenhoff, 1981). In this<br />
system, the product of one enzyme is the substrate of the other and<br />
significant substrate conversion only occurs when both antibodies<br />
react with the antigen bringing the labels close together.<br />
Homogeneous enzyme immunoassays are rapid and readily<br />
automated and could provide a powerful technique for the<br />
monitoring of fermentation products. The main limitations with such<br />
techniques is <strong>that</strong> the assay requires specifically designed reagents for<br />
each antigen and the sensitivity<br />
3.6.2 On-line sampling of the bloreactor.<br />
is often low.<br />
Sampling of the bloreactor is a major limitation in any on-line<br />
system where small and reproducible samples are required. There are<br />
104
two main requirements in sampling the fermenter which are firstly<br />
avoiding contamination of the culture fluid and secondly the<br />
generation of a sample free of cells and debris for the assay. The use<br />
of a 0.2µm pore diameter filter would appear to fulfil both these<br />
requirements, however membrane filters are very susceptible to<br />
blocking which limits their long term use in fermenters. In an attempt<br />
to overcome this problem a cross-flow filter was developed<br />
(Appendix III). The device was designed to recirculate fluid from the<br />
fermenter across the membrane to flush any debris from the<br />
membrane surface. Samples would then be periodically drawn<br />
through the membrane to be assayed In the automated ELISA. The<br />
cross-flow filter could be operated maintenance-free for several days<br />
using conditioned medium containing cells and cell debris but<br />
blocking of the membrane could not be completely eliminated.<br />
Furthermore, when applied to hybridoma cultures It was discovered<br />
<strong>that</strong> circulation of cells and medium at flow rates sufficient to<br />
prevent blockage of the membrane was detrimental to cell growth.<br />
Figure 3.13 shows the growth of cells in a1 litre fermenter<br />
(Gallenkamp) with and without medium recirculation.<br />
The recirculation of cell-free medium from a fermenter would<br />
eliminate cell damage but would generate the same problems<br />
encountered with the filter device in <strong>that</strong> large numbers of relatively<br />
small particles would have to be retained in the reactor by some<br />
porous barrier. Spinning filters have been used to retain hybridomas in<br />
perfusion reactors (Tolbert et al., 1985; Reuveny et al.. 1986) and could<br />
provide a cell-free stream of medium which could then be sampled for<br />
the automated assay. A further possible solution to this problem would<br />
be the use, of an immobilised cell reactor. Immobilised cell reactors<br />
105
Figure 3.13. The effect of medium recirculation on hybridoma growth<br />
1.0<br />
0.9<br />
0.8<br />
p 0.7<br />
C)<br />
0.6<br />
0.5<br />
0.4<br />
C, 0.3<br />
0.2<br />
01<br />
0<br />
Each curve represents the number of viable cells in a 500m1 stirred<br />
culture recorded over 100 hours either with (0) or without(Ö) medium<br />
recirculation.<br />
0 10 20 30 40 50 60 70 80 90 100<br />
Time (hours)<br />
106
can be perfused by cell free medium which can be sampled by<br />
tangential or cross-flow filters with high flow rates. However the main<br />
limitation with these systems for the investigation of production<br />
kinetics is <strong>that</strong> the measurements of cell numbers or biomass necessary<br />
to determine specific production kinetics is impracticable in such<br />
systems.<br />
3.7 Conclusions. I<br />
1) The use of a packed bed of Sepharose with covalently bound<br />
anti-mouse antibody could be employed as a solid phase for a sandwich<br />
ELISA. The increased surface area and reduced diffusion distances in a<br />
packed bed greatly reduced the time for the ELISA to approximately 75<br />
minutes/sample. The assay could be operated on a continuous flow basis<br />
and was readily automated using a microcomputer.<br />
ii) The reproducibility of the assay was comparable to a microplate<br />
ELISA with a coefficient of variation between samples of 30 assay cycles)<br />
without loss of sensitivity.<br />
107
v) Column compaction occured due to the compressible nature of<br />
Sepharose at high flow rates. Attempts to alleviate this problem by<br />
changes in the bed geometry or periodically reversing the buffer flow<br />
were unsuccessful. This limitation makes the assay impracticable for the<br />
long term monitoring of bloreactors in its present configuration.<br />
The development of a system based on a more rigid solid phase would<br />
overcome this problem and allow higher flow rates and hence faster<br />
assay times. However such a development would require extensive<br />
investigation and it was considered <strong>that</strong> this would diverge from the<br />
main aim of this investigation which was to investigate factors<br />
affecting antibody production by hybridomas in culture.<br />
vi) Difficulties were experienced in producing a cell-free sample from<br />
the fermenter. Recirculation of medium through a cross flow filter<br />
provided a cell free sample stream but caused a loss of cell viability at<br />
the flow rate necessary to prevent filter blockage.<br />
It was therefore decided adopt a more conventional ELISA system<br />
using microwell plates to assay manually taken samples. Although the<br />
conventional ELISA is a time consuming technique it does allow the<br />
simultaneous testing of large numbers of samples and standards and<br />
can be replicated to reduce the influence of assay errors.<br />
108<br />
ý,
Chapter 4<br />
Hybridoma growth and antibody production kinetics in batch culture.<br />
4.1 Introduction.<br />
Many studies have been centred around the improvement of<br />
hybridoma growth characteristics in culture (Low and Harbour. 1985a;<br />
Low and Harbour, 1985b; Reuveny et a!., 1986a; Reuveny et al., 1986b;<br />
Glacken et a!., 1986; Hu et a!., 1987). These strategies have led to<br />
greater cell yields and improved cell survival with a consequent<br />
increase in antibody yields. It has also become apparent <strong>that</strong> antibody<br />
production characteristics vary depending on the hybridoma line. Merten<br />
has separated hybridomas into two groups, low producers where the<br />
antibody production rate falls rapidly during growth resulting In low<br />
antibody titres (( 1 jig/ml) and high producers where the rate of antibody<br />
production is sustained throughout the cell growth phase and also<br />
during the stationary or decline phase. The latter type of production<br />
kinetics suggests <strong>that</strong> monoclonal antibody production is not<br />
growth-associated, a view supported by the results of continuous<br />
culture studies by Birch et al. (1985b) and Miller et al. (1988a).<br />
The effect of environmental factors on antibody production rate has<br />
received less attention in the literature although some trends may be<br />
discerned from various studies. Enhanced antibody production has been<br />
noted in low serum or serum free medium (Glassy et al., 1988), reduced<br />
oxygen concentrations (Reuveny et al., 1986a; Phillips et al.. 1987) low<br />
pH (Miller et a!., 1988) or at low growth rates (Birch et a!., 1985b; Miller<br />
et al., 1988a) although the underlying mechanisms have yet to be<br />
elucidated.<br />
109
The purpose of this investigation was therefore to determine the<br />
effect of environmental factors on the production of antibodies by the<br />
321 hybridoma and to investigate possible mechanisms for, some of the<br />
effects described above.<br />
4.2 Materials and methods.<br />
Determinations of cell number and viability, all metabolite<br />
determinations and media for cell growth were as stated in Chapter 2.<br />
<strong>An</strong>y modifications made are described where relevant in the text.<br />
4.3 Results.<br />
4.3.1 Hybrldoma growth and antibody Production in static flasks.<br />
The study of cell growth In static batch culture was carried out in<br />
150cm2 tissue culture flasks. Cells were Inoculated at a density of<br />
2x10⁵ per ml in 100 ml RPMI 1640 supplemented with 10% newborn calf<br />
serum. Cells were cultured at 37° C with 5% C0z /95% air. Cell number<br />
and viability were evaluated daily and samples for monoclonal<br />
antibody, glucose, lactate, glutamine and ammonia determinations<br />
were taken simultaneously and stored at -20° C for later analysis.<br />
Figure 4.1 shows a typical cell growth curve for the 321 hybridoma<br />
in a static flask. Maximum cell density was achieved after<br />
approximately 60 hours with a subsequent rapid loss in cell viability<br />
leading to total cell death after 120-140 hours. There was no<br />
apparent stationary phase with the 321 hybridoma cells. Maximum cell<br />
densities achieved under the conditions described were typically<br />
7-9x10⁵/ml with a mean specific growth rate of 0.025h-1.<br />
110
Figure 4.1. Growth of the 321 hybridoma in static flasks<br />
The figures represent typical growth, metabolism and antibody<br />
production profiles for the 321 hybridoma in"static culture. Cells were<br />
cultured in 100ml RPMI 1640 supplemented with 10% newborn calf serum<br />
in 150cm2 tissue culture flasks.<br />
a) O Viable cells<br />
Q Non-viable cells<br />
0 321 antibody concentration<br />
b)O Glucose<br />
" Lactate<br />
D Glutamine<br />
Ammonia<br />
111
0.9<br />
0.8<br />
0-7<br />
0.6<br />
0.5<br />
x0.4<br />
E<br />
-. 00.3<br />
E<br />
E6<br />
u<br />
C-<br />
03<br />
0.2<br />
0.1<br />
0<br />
10<br />
9<br />
8<br />
5<br />
4<br />
`- 2<br />
ü<br />
J<br />
0<br />
0<br />
Figure 4.1<br />
b<br />
20 40 6080 100 120 140<br />
Time (hours)<br />
0 20 40 60 80<br />
Time<br />
(hours)<br />
112<br />
101<br />
100 120 140<br />
s<br />
1.8<br />
y,<br />
.O<br />
C<br />
Q<br />
1-6 , N<br />
N<br />
1.4 E<br />
E-<br />
1-2 m<br />
1.0 "ý<br />
0.8 C- L<br />
0.6 c<br />
E<br />
0.4<br />
LM<br />
D"2
With an initial concentration of 11mM the glucose was never<br />
exhausted by the 321 hybridoma with 25-50% remaining in the medium<br />
after cell growth had ceased. By contrast glutamine was exhausted by<br />
about 60 hours after which there was no further increase in cell number.<br />
Lactate accumulated in the medium reaching a plateau<br />
concentration of 8-10mM shortly after the peak in cell density. In<br />
static flasks approximately 1.5 moles of lactate were produced for each<br />
mole of glucose consumed. Ammonia also accumulated In the medium<br />
and reached a maximum concentration (1.5 mM) when Blutamine was<br />
exhausted. The increase in ammonia concentration corresponded to<br />
the decrease In glutamine concentration with approximately 1 mole of<br />
ammonia liberated for each mole of glutamine metabolised.<br />
<strong>An</strong>tibody was produced throughout the growth phase and it was<br />
notable <strong>that</strong> antibody continued to accumulate in the medium after the<br />
peak cell concentration. Furthermore the mean antibody production rate<br />
(jig antibody/106 cells/hour) during the decline phase was higher than<br />
during the growth phase (table 4.1) and approximately<br />
60% of antibody<br />
was accumulated in the latter half of the culture. <strong>An</strong>tibody titres of<br />
160-180pg/ml were achieved in these cultures.<br />
4.3.2 Hybridoma growth and antibody production in stirred batch<br />
culture.<br />
The study of cell growth in stirred batch culture was carried out in<br />
a llitre Gallenkamp fermenter which was modififled by replacing butyl<br />
rubber seals with silicone rubber and agitated using a large magnetic<br />
follower mounted through the stirrer shaft. Aeration was provided by a<br />
.1<br />
113
a<br />
L<br />
. 4-<br />
u<br />
L u<br />
. cý<br />
'a<br />
C<br />
C<br />
N<br />
C<br />
ra<br />
1<br />
4-<br />
CD<br />
4-<br />
C<br />
N<br />
OJ<br />
f9<br />
L<br />
C<br />
O<br />
-t-<br />
u<br />
0<br />
4-<br />
c<br />
ri<br />
L<br />
C<br />
ru<br />
0<br />
t7<br />
T: -<br />
-4t<br />
a<br />
Fý<br />
a-<br />
ö<br />
: a-<br />
u<br />
><br />
O<br />
-o C)<br />
Co<br />
Öy<br />
O<br />
rn<br />
O<br />
+1<br />
m<br />
rn<br />
m<br />
4 a ö<br />
t<br />
ü<br />
c<br />
d<br />
+. u a<br />
O<br />
ö<br />
Ci<br />
+1<br />
M<br />
p. p. N<br />
N<br />
C)<br />
41<br />
-4-<br />
c0<br />
L<br />
i-<br />
o<br />
-<br />
O<br />
O<br />
+1<br />
C<br />
N<br />
m<br />
a<br />
r Ln<br />
c14<br />
O<br />
ö<br />
c<br />
a)<br />
114<br />
u<br />
. ý-<br />
c/)<br />
C-<br />
't<br />
m<br />
O<br />
N<br />
Lfi<br />
in<br />
O<br />
ö<br />
d<br />
E<br />
Cu<br />
LL
95% air 5% COz mixture passed through the headspace at a flow rate of<br />
50ml/minute. With an agitation rate of 100rpm and a working volume of<br />
500m1 a KLa value of 1.19h-1 was achieved (see Appendix IV). pH was<br />
monitored with a sterilisable pH probe (Russell).<br />
Cells were inoculated at a density of 2x10⁵ per ml in 500 ml RPMI<br />
1640 supplemented with 10% newborn calf serum. Cell number and<br />
viability were evaluated daily and samples for antibody, glucose,<br />
lactate, glutamine and ammonia determinations were taken<br />
simultaneously and stored at -201 C for later analysis.<br />
Figure 4.2 shows a typical growth curve for a stirred batch culture<br />
of the 321 hybridoma. Cell growth rates were higher in stirred culture<br />
than in static culture and cell densities of 0.9-1.1 x10⁶ /ml were<br />
achieved after 40-48 hours with a mean specific growth rate of<br />
0.035h-1. The decline of the culture was also rapid and total cell death<br />
was seen after approximately 100 hours.<br />
Glucose consumption and lactate production were similar to <strong>that</strong><br />
seen in static batch cultures. Glutamine was again completely depleted<br />
by the end of the growth phase although cell densities achieved in<br />
stirred culture were higher than in static culture. The pH of the culture<br />
declined during the growth phase reaching a final pH of 6.7 which<br />
probably reflects the large amount of lactic acid produced by these cells.<br />
<strong>An</strong>tibody titres achieved in stirred batch culture were generally<br />
lower than those seen in static cultures with titres of approximately 120<br />
jig/ml. Mean antibody production rates during the growth phase were<br />
also lower in the fermenter than in static flask cultures (table 4.1). As<br />
before, the mean specific antibody production rate durl1flg the decline<br />
phase was higher than during the growth phase.<br />
116
Figure 4.2. Growth of the 321 hybridoma in stirred culture<br />
The figures represent growth, metabolism and antibody production<br />
profiles for the 321 hybridoma in stirred batch culture. Cells were<br />
cultured in 500m1 RPMI 1640 + 10% newborn calf serum in a1 litre<br />
Gallenkamp fermenter.<br />
a)O Viable cells<br />
" Non-viable cells<br />
13 321 antibody' concentration 't<br />
pH<br />
b)O Glucose<br />
" Lactate<br />
Q Glutamine<br />
Ammonia<br />
116
1.0<br />
0.9<br />
0.8<br />
0.7<br />
0.6<br />
° 0.5<br />
x<br />
E 0.4<br />
cu<br />
u 0.3<br />
c<br />
0<br />
E6<br />
°1<br />
to<br />
u<br />
0<br />
0<br />
u2<br />
LV<br />
0.2<br />
0.1<br />
0<br />
10<br />
9<br />
8<br />
1<br />
0<br />
Figure 4.2<br />
a<br />
0 10 20 30 40 50 60 70 80 90 100<br />
b<br />
0 10 20 30 40 50 60 70 80 90 100<br />
-<br />
Time(hours)<br />
117<br />
I<br />
pH<br />
r7.2<br />
7.0<br />
6.8<br />
6.6<br />
120 6.4<br />
100<br />
-80<br />
60 E<br />
o,<br />
40 :: `<br />
>14<br />
Icl<br />
20<br />
0Q<br />
2.0<br />
1.4 E<br />
E-<br />
1-2 m<br />
1.0 E<br />
0.8<br />
ro<br />
0.6 "E<br />
0.4<br />
0.2<br />
0
4.3.3 The effect of Blutamine on cell growth and antibody production,<br />
In the previous studies the onset of the decline phase<br />
in batch<br />
cultures of the 321 hybridoma coincided with the exhaustion of<br />
glutamine. <strong>An</strong>tibody production rates were also higher during this<br />
phase.<br />
Stirred batch cultures at initial glutamine concentrations of 2,1.3,<br />
0.6 and 0.3mM (0.3,0.2.0.1 and 0.05mg/ml) were set up in parallel.<br />
Duran bottles (250m1) were used for 100mi cultures and were agitated<br />
with a magnetic follower at 100rpm.<br />
Figure 4.3 shows cell growth curves for each glutamine<br />
concentration. Glutamine was exhausted in each case and cell growth<br />
ceased at the same time. The initial growth rate was similar for each<br />
glutamine concentration and the maximum cell density declined with<br />
decreasing glutamine concentration, demonstrating the requirement for<br />
glutamine in proliferating cells.<br />
The mean specific uptake rate of glutamine was greatly reduced at<br />
lower glutamine concentrations (table 4.2) which suggests <strong>that</strong><br />
glutamine uptake rate is influenced by the glutamine concentration in<br />
the medium. Ammonia concentrations reached maximum levels when all<br />
the glutamine had been utilised except for the lowest initial glutamine<br />
concentration of 0.3mM where only small amounts of ammonia were<br />
detectable.<br />
The total amount of glucose utilised by cells was similar at 2,1.3<br />
and 0.6 mM glutamine whereas the mean specific consumption rate<br />
increased at the lower Blutamine concentrations (table 4.2). At<br />
0.3mMglutamine, glucose consumption rate was reduced.<br />
118
Figure 4.3. The effect of reduced glutamine concentration on hybridoma<br />
growth and antibody production<br />
Cells were cultured in 100m1 stirred suspension cultures In RPMI 1640<br />
+ 10% newborn calf serum with glutamine concentrations of 2.0, (0);<br />
1.3 (0); 0.6 (0) and 0.3 (0) mM.<br />
The figures represent a) viable cells, b) 321 antibody concentration, c)<br />
glutamine, d) ammonia, e) glucose and f) lactate.<br />
119
1.0<br />
0.9<br />
0.8<br />
0.7<br />
E 0.6<br />
'O 0.5<br />
x<br />
- 04<br />
0)<br />
u<br />
0.3<br />
m<br />
> 0.2<br />
E<br />
4-<br />
0.1<br />
0<br />
200<br />
180<br />
160<br />
140<br />
.<br />
120<br />
100<br />
60<br />
60<br />
40<br />
20<br />
0<br />
Figure 4.3<br />
0 10 20 30 40 50 60 70 80 90 100<br />
Time (hours)<br />
0 10 20 30 40 50 60 70 80 90 100<br />
Time (hours)<br />
120<br />
I/
2-0<br />
1.8<br />
1.6<br />
1.4<br />
1-2<br />
E 1.0<br />
a<br />
tu 08<br />
L3 0.6<br />
0.4<br />
0.2<br />
0<br />
2.0<br />
1.8<br />
1.6<br />
1.4.<br />
1.2<br />
E 1.0<br />
R<br />
0-8<br />
ä 0.6<br />
0.4<br />
o-2<br />
0<br />
(Cl<br />
0 10 20 30 40 50 60 70 80 90 100<br />
(d)<br />
Time (hours)<br />
0 10 20 30 40 50 60 70 80 90 100<br />
Time (hours)<br />
121
10<br />
9<br />
8<br />
E 6<br />
N,<br />
d<br />
O<br />
E6<br />
E<br />
°J<br />
}5<br />
v4<br />
4<br />
3<br />
2<br />
1<br />
0<br />
12<br />
11<br />
10<br />
9<br />
8<br />
3<br />
2<br />
1<br />
0<br />
(e)<br />
0 10 20 30 40 50 60 70 80 90 100<br />
0 10 20 30 40 50 60 70 80 90 100<br />
Time (hours)<br />
122
C<br />
O<br />
LI<br />
'D<br />
O<br />
C-<br />
0<br />
A<br />
0<br />
c<br />
rv<br />
c<br />
ro<br />
L<br />
4-<br />
rn<br />
E<br />
0<br />
. n`<br />
C<br />
O<br />
C<br />
O<br />
} t9<br />
C<br />
LI<br />
u<br />
C<br />
ü<br />
a<br />
C_<br />
E<br />
ro<br />
y--<br />
V-<br />
a<br />
i--<br />
G/<br />
.D<br />
ro<br />
F--<br />
i<br />
c<br />
O<br />
u<br />
ä<br />
Cv<br />
1<br />
-<br />
ü<br />
rn<br />
Si<br />
:ö<br />
m<br />
Co N m<br />
w Ö !<br />
-in<br />
f ß ' 1<br />
I, "- O O O O<br />
O<br />
u cm<br />
aJ<br />
. a...<br />
d<br />
(9<br />
. ý.<br />
a<br />
d<br />
c %-<br />
.E<br />
rn<br />
l7<br />
N<br />
n<br />
0<br />
%o<br />
ö<br />
o 0<br />
ö ö, ö c><br />
} ;o LM un r-<br />
3 , N N N N<br />
O O O O<br />
O ,ý<br />
p O O O<br />
(D<br />
. r1<br />
"<br />
I. 7<br />
=<br />
E<br />
I<br />
,<br />
123<br />
Ln<br />
fýI N C. O<br />
O Ö<br />
ni<br />
ru<br />
C-<br />
ro<br />
a<br />
-t-<br />
N<br />
c<br />
GJ<br />
L.<br />
rp<br />
c..<br />
N<br />
L<br />
GJ<br />
L<br />
E<br />
D<br />
Z<br />
a;<br />
Np<br />
ý<br />
C<br />
CL.<br />
3<br />
0<br />
1<br />
on<br />
rn<br />
c<br />
a<br />
ro<br />
cx<br />
41
<strong>An</strong>tibody production rates for the growth phase of the culture<br />
and overall production rates were calculated and are shown in table<br />
4.2. The antibody production rate was , similar for initial glutamine<br />
concentrations of 2,1.3 and . 0.6 mM but with a significant decrease<br />
in the mean antibody production rate at the lowest glutamine<br />
concentration.<br />
It was also notable <strong>that</strong> the mean antibody production rate for the<br />
growth phase of the culture was lower than the overall antibody<br />
production rate, which was in keeping with earlier observations <strong>that</strong><br />
the antibody production rate increases during the decline phase of the<br />
culture.<br />
4.3.4 The effect of nH on cell growth and antibody production<br />
The effect of pH on cell growth and antibody production was<br />
investigated. The initial experiments were carried out by varying<br />
the sodium bicarbonate concentration to give the required pH values<br />
in equilibrium with 5% C02. The pH drifted rapidly due to the poor<br />
buffering capacity of low concentrations of sodium bicarbonate. In<br />
addition it has been suggested <strong>that</strong> bicarbonate is an Important<br />
nutrient for cell growth and may affect cell growth independently of<br />
pH (Geyer and Chang, 1958; McLimans, 1972). In order to overcome<br />
these problems 20 mM HEPES buffer was included in the medium and<br />
the sodium bicarbonate concentration was reduced to 5mM. To minimise<br />
the effect of pH drift cell growth rates were evaluated overnight from<br />
a culture of cells in exponential growth: Cells in early to mid<br />
exponential phase were harvested by centrifugation and<br />
124
esuspended in HEPES buffered RPMI1640 at pH values of 6.6,6.8.7.0,<br />
7.2,7.4 and 7.8. Cell growth and antibody production rates were<br />
determined after 18 hours incubation.<br />
Figure 4.4 shows cell numbers and antibody concentrations<br />
after 18 hours incubation. Whereas the optimum pH for cell growth was<br />
at pH 7.2 (figure 4.5a) with a growth rate of 0.051 h-1 (cell doubling time<br />
= 13.6 hours) the maximum antibody production rate was achieved at pH<br />
6.8 (figure 4.5b). <strong>An</strong>tibody production and cell growth were depressed at<br />
lower pH (pH 6.6) and high pH (pH 7.8).<br />
4.3.5 The effect of serum on cell growth and antibody production.<br />
The effect of varying newborn calf serum concentration on cell<br />
growth was investigated. Cells were seeded at a density of 2x10'<br />
cells/ml in 100ml RPMI1640 in a 150cm2 tissue culture flask.<br />
Experiments were set up at 1,2.5 and 10% newborn calf serum. Cell<br />
number and viability were recorded daily and samples were taken for<br />
antibody determination.<br />
Figure 4.6a shows "cell growth 'curves for each serum<br />
concentration. As serum concentration was reduced cell growth<br />
declined until at 1% serum there was little or no growth. There was<br />
little loss of viability at low serum concentrations and cell<br />
viability was maintained longer than with high serum<br />
concentrations. It is notable <strong>that</strong> cell yields were comparable for each<br />
concentration of serum.<br />
Figure 4.6b shows antibody accumulation for each serum<br />
concentration. The final antibody titres for each serum<br />
125
Figure 4.4. The effect of pH on hybridoma growth and antibody<br />
E<br />
o"7<br />
0-6<br />
0.5<br />
%0<br />
ö 0.4<br />
x<br />
r_<br />
ä<br />
.E0.3<br />
ä, 0.2<br />
u<br />
0.1<br />
0<br />
production.<br />
Cells were cultured in RPMI 1640 with 10% newborn calf serum, 5mM<br />
NaHCO3 and 20mM HEPES buffer. The pH wasadjusted to the values<br />
shown by the addition of either NaOH or HCI. The bars represent the cell<br />
number and antibody concentration. Error bars are the standard<br />
deviation (n=4).<br />
6.6 6.8 7.0 7.2 7.4 7.8<br />
pH<br />
126<br />
50<br />
40<br />
30<br />
20<br />
10<br />
0<br />
Q,<br />
M
Figure 4.5. The effect of pH on cell growth rate and antibody production<br />
rate<br />
0.06<br />
,-0.05<br />
-4- 0.04<br />
ru 0.03<br />
ý, 0.02<br />
LS<br />
0.01<br />
0<br />
6<br />
cJ 4<br />
u<br />
03<br />
rn<br />
0<br />
Figure 4.6. The effect of serum concentration on cell growth and<br />
antibody production.<br />
Cells were cultured in RPMI 1640 supplemented with 10% (0), 5% (13), 216<br />
(") or 1% (0) newborn calf serum. The figures represent a) viable cell<br />
numbers, b) antibody concentration and c) the specific antibody<br />
production rate (APR) as calculated from the data shown In figures 4.6a<br />
and 4.6b.<br />
128
1.0<br />
0-9<br />
0.8<br />
0.7<br />
J 0.6<br />
E<br />
0 0.5<br />
x 0.4<br />
ý-' 0.3<br />
0.2<br />
01<br />
0<br />
Figure 4.6<br />
(a)<br />
0 20 40 60 80 100 -120<br />
Time (hours)<br />
129<br />
140 160
E<br />
rn<br />
120<br />
100<br />
80<br />
>- 60<br />
0<br />
c<br />
40<br />
20<br />
0<br />
(b)<br />
0 20 40 60 80 100 120 140 160<br />
130<br />
Time (hours)
s<br />
O<br />
5<br />
4<br />
-' 3<br />
Q1<br />
ý' 2<br />
a<br />
0<br />
(c)<br />
0 20 40 60 80 100 120 140 160<br />
Time (hours)<br />
131
concentration were similar but the specific antibody production rate<br />
(figure 4.6c) showed a general trend of increasing antibody<br />
production rate with decreasing serum concentration.<br />
4.3.6 The effect of excess thymidine on cell growth and antibody<br />
production.<br />
The emerging trend from the previous experiments is <strong>that</strong><br />
conditions which are suboptimum for cell growth may enhance antibody<br />
production. There is some evidence <strong>that</strong> antibody production rate is<br />
enhanced at low cell growth rates (Birch et al., 1985; Miller et al.. 1988).<br />
The following experiments therefore investigate the effect of<br />
preventing cell proliferation by blocking DNA synthesis.<br />
, Excess thymidine acts as an inhibitor to DNA synthesis due to<br />
inhibition of nucleoside diphosphate reductase (Xeros, 1962). The effect<br />
of excess thymidine on the 321 hybridoma was investigated. 2mM<br />
thymidine has been found to be optimum for Inhibition of DNA<br />
synthesis In HeLa cells (Puck, 1964) and was found to be suitable for<br />
this investigation.<br />
Cells In early to mid exponential phase were harvested by<br />
centrifugation and resuspended in RPMI 1640 containing 2mM thymidine<br />
(Sigma). A control flask without thymidine was also set up.<br />
Figure 4.7 shows the effect of 2mM thymidine on cell growth. The<br />
control flask shows continued cell growth in the absence of thymidine<br />
(figure 4.7a) whilst cells treated with thymidine stop dividing after<br />
approximately 12 hours (figure 4.7b). A constant cell number was<br />
maintained for approximately 40 hours before cells began to die. The<br />
antibody titres were comparable despite the difference in cell number<br />
132
Figure 4.7. The effect of 2mM thymidine on cell growth and antibody<br />
production.<br />
Cells were cultured in 100ml RPMI + 10% newborn calf serum either a)<br />
without thymidine or b) with 2mM thymidine. The figures show cell<br />
numbers (0, ") and antibody concentrations (p, M) for each experiment.<br />
Solid and open symbols represent the results of two experiments.<br />
133
1.0<br />
0.9<br />
0.8<br />
0.7<br />
° 0.6<br />
x<br />
E<br />
0.5<br />
0.4<br />
ý; 03<br />
0.2<br />
0.1<br />
0<br />
1.0<br />
0.9<br />
0.8<br />
0.7<br />
0.6<br />
x 0.5<br />
E<br />
R 0.4<br />
LI; 0.3<br />
0.2<br />
0.1<br />
0<br />
Figure 4.7<br />
0<br />
200<br />
160<br />
0<br />
10 20 30 40 50 60 70 80 90 100<br />
Time (hours)<br />
0 10 20 30 40 50 60 70 80 90 100<br />
Time (hours)<br />
134<br />
60<br />
40<br />
20 E<br />
Cn<br />
100,<br />
30 . CM,<br />
i0<br />
0<br />
?0<br />
r200<br />
0<br />
io<br />
0<br />
E<br />
o cn<br />
0<br />
)<br />
Xa<br />
ä
ut the mean specific antibody production rate was higher in thymidine<br />
blocked cells (5.1±0.42pg/106 cells/h) than in the control culture<br />
(3.5±0.34pg/106 cells/h). These data indicate <strong>that</strong> not only does<br />
antibody production continue in non proliferating cells, but <strong>that</strong> the<br />
non-proliferative state appears to be more favourable for antibody<br />
production.<br />
4.3.7 The effect of glutamine concentration on thymidine-blocked cells.<br />
Maximum antibody production rates were observed in the decline<br />
phase of hybridoma cultures (Table 4.1). The onset of the decline phase<br />
was characterised by the depletion of glutamine and it is therefore<br />
possible <strong>that</strong> glutamine level affects the rate of antibody production in<br />
hybridoma cells perhaps by repression of antibody synthesis. However<br />
the effects of cell growth may obscure any specific effects of glutamine<br />
limitation on antibody production. The effect of glutamine on antibody<br />
production in non-proliferating cells was therefore investigated.<br />
Cells in early exponential phase were blocked with 2mM thymidine<br />
for 24 hours then harvested by centrifugation at 100xg for 5 minutes.<br />
The cells were resuspended in RPMI containing 5,2,1.0.5,0.25 and<br />
0.125 mM glutamine. Thymidine at 2mM was also Included in all media.<br />
After 24 hours. cell number and antibody titre were determined.<br />
Figure 4.8 shows cell number and antibody titre for each glutamine<br />
concentration after 24 hours incubation. Cell viability remained high at<br />
glutamine concentrations of 0.5 mM and above but there was a loss of<br />
cell viability at 0.25 and 0.125 mM indicating the requirement of<br />
non-proliferating cells for glutamine. <strong>An</strong>tibody titres were similar<br />
135
Figure 4.8. The effect of glutamine concentration on antibody production<br />
E<br />
x'0.3<br />
0.5<br />
Q,. u<br />
0.2<br />
41<br />
0-4<br />
0.1<br />
0<br />
in thymidine blocked cells.<br />
5210.5 0.25 0.125<br />
Glutamine mmöles/l<br />
50<br />
40<br />
30ý<br />
2U<br />
10<br />
Cells were cultured in RPMI 1640 with 10116<br />
newborn calf serum and 2m11<br />
thymidine at glutamine concentrations of 0.125 - 5.0 mM. The figure<br />
shows viable cell numbers and antibody concentrations measured after<br />
18 hours incubation.<br />
136<br />
0<br />
10<br />
0
etween 1 and 5 mM glutamine but declined at lower glutamine<br />
concentrations. This was reflected in the mean specific antibody<br />
production rates (figure 4.9). These data suggest <strong>that</strong> there is no<br />
repression of antibody synthesis by high levels of glutamine and <strong>that</strong><br />
glutamine is required for antibody synthesis as low levels of glutamine<br />
were accompanied by a reduction in the rate of antibody synthesis.<br />
4.3.8 The effect of nH on thymidine-blocked cells.<br />
Variations in pH have a profound effect on cell growth rate (figure<br />
4.5a) which In turn may influence antibody production. It is not possible<br />
to determine whether the effect of pH on antibody production is due to<br />
a direct effect on antibody synthesis or secretion. In order to eliminate<br />
the effects of cell growth rate the effect of pH on thymidine-blocked<br />
cells was investigated.<br />
Cells were prepared as described in section 4.2.7. The cells were then<br />
resuspended in HEPES buffered RPMI at pH values of 6.6,6.8,7.2,7.4<br />
and 7.8. All media also contained 2mM thymidine. After 24 hours<br />
incubation cell number and antibody concentration were determined for<br />
each pH value.<br />
Figure 4.10 shows cell number and antibody titre at each pH value.<br />
Cell viability was not affected by pH over the range tested. <strong>An</strong>tibody<br />
titres were highest within the pH range 7.0-7.4 with decreasing titres<br />
below pH 7.0 and at pH 7.8. Mean antibody production rates calculated<br />
from this data were also similar at pH 7.0-7.4 but were depressed<br />
outside this range (figure 4.11). This is in contrast to the situation seen<br />
in dividing cells where the optimum pH for antibody production was<br />
found to be 6.8.<br />
137
Figure 4.9. The effect of glutamine concentration on antibody production<br />
t<br />
a,<br />
.o<br />
0<br />
o,<br />
3,<br />
cl:<br />
ä2<br />
6<br />
1<br />
0<br />
rate in thymidine blocked cells.<br />
Glutamine mM<br />
The figure shows the effect of glutamine concentration on the mean<br />
specific antibody production rate as calculated from the data shown in<br />
figure 4.8.<br />
012345<br />
138
Figure 4.10. The effect of pH on antibody production In thymidine<br />
u<br />
C<br />
0.7<br />
0.6<br />
0.5<br />
0.4<br />
0.3<br />
0.2<br />
0.1<br />
0<br />
blocked cells.<br />
6.6 6.8 7.0 7.2 7.4 7.8<br />
pH<br />
50<br />
40<br />
30 E<br />
cn<br />
0<br />
20 C<br />
Cells were cultured in RPMI 1640 with 10% newborn calf serum, 2mM<br />
thymidine, 5mM NaHCO3 and 20mM HEPES buffer. The pH was adjusted to<br />
the values shown by the addition of NaOH or HCi. The figure shows the<br />
viable cell numbers and antibody concentrations measured after 18<br />
hours Incubation. Error bars are the standard deviation (n=4).<br />
139<br />
10<br />
0
Figure 4.11. The effect of pH on the antibody production rate in<br />
thymidine blocked cells.<br />
6<br />
5<br />
4<br />
3<br />
2<br />
1<br />
0<br />
pH<br />
The figure shows the effect of different pH values on the mean specific<br />
antibody production rate as calculated from the data shown in figure<br />
4.10.<br />
6.4 6.6 6.8 7.0 7.2 7.4 7.6 7.8 8.0<br />
140<br />
./
4.3.9 The effect of serum concentration on thymidine blocked cells<br />
As with pH, the serum concentration has a considerable effect on cell<br />
growth rate (figure 4.6a) which may obscure any direct effect of serum<br />
on antibody synthesis or secretion. The effects of serum in<br />
non-proliferating cells were therefore investigated.<br />
Cells were prepared as described in section 4.2.7 then incubated in<br />
RPMI with 2 mM thymidine and newborn calf serum concentrations of 0,<br />
1,2,5,10 and 20%. Cell numbers and antibody titres were determined<br />
after 24 hours incubation.<br />
Figure 4.12 shows cell number and antibody titre at each serum<br />
concentration. Cell viability was not affected by serum concentration<br />
except in the complete absence of serum where a loss of cell viability<br />
was observed. <strong>An</strong>tibody titres showed an increasing trend with<br />
increasing serum concentration in contrast to the results obtained in<br />
growing cultures. This implies <strong>that</strong> serum does not inhibit antibody<br />
production and the enhanced antibody production rate seen at high<br />
serum concentration (figure 4.13) suggests a possible role for serum in<br />
the synthesis or secretion of antibody.<br />
4.4 Discussion.<br />
The data presented in this chapter showed <strong>that</strong> antibody was<br />
produced continuously during cell growth but <strong>that</strong> there was an<br />
apparent increase In the mean specific production rate during the<br />
decline phase of the culture. This observation is consistent with the<br />
observations of several other authors who have found similar<br />
141
Figure 4.12. The effect of serum concentration on antibody production<br />
0.5<br />
D 0.4<br />
. oý<br />
a<br />
u<br />
0.3<br />
w 0.2<br />
.O<br />
0.1<br />
0<br />
in thvmidine blocked cells.<br />
0125 10 20<br />
Serum %<br />
70<br />
60<br />
50<br />
40<br />
30 0<br />
E<br />
rn<br />
.O<br />
20 Q<br />
Cells were cultured In RPMI 1640 with 10% newborn calf serum and 2mM1<br />
thymidine at serum concentrations of 0-20%. The figure shows cell<br />
numbers and antibody concentrations measured after 24 hours<br />
incubation. Error bars are the standard deviation (n=4).<br />
142<br />
10<br />
0
Figure 4.13 The effect of serum concentration on the antibody<br />
"6 r<br />
N<br />
GUI<br />
u4<br />
7<br />
`- 3<br />
cn<br />
0<br />
1<br />
0<br />
production rate in thymidine blocked cells.<br />
The figure shows the effect of different serum concentrations on the ,<br />
mean specific antibody production rate calculated from the data shown<br />
in figure 4.12.<br />
02468 10 12 14 16 18 20<br />
Serum<br />
143
production kinetics In hybridomas producing high monoclonal<br />
antibody titres (Birch et al., 1987; Emery et al., 1987; Reuveny et al.,<br />
1987). The explanations for this behaviour can be incorporated <strong>Into</strong><br />
two hypotheses. Emery et al. (1987) suggested <strong>that</strong> the increase in the<br />
apparent production rate was due the release of accumulated<br />
intracellular antibody from dying cells. They provided data<br />
which showed Increased Intracellular antibody concentrations during<br />
the latter phase of the cell culture. A similar investigation by Birch<br />
and colleagues (1987) did not show such accumulation and they<br />
concluded <strong>that</strong> the specific antibody production rate<br />
increases during<br />
the decline phase. Subsequent work (Renard et al., 1988) has linked<br />
antibody production kinetics to the integral of the viable cell growth<br />
curve which strongly suggests <strong>that</strong> antibody production during the<br />
decline phase is secreted by the viable cell population and not<br />
released from dying cells.<br />
It therefore seems <strong>that</strong> antibody production is not growth-associated<br />
and this is further supported by the finding in this investigation <strong>that</strong><br />
cells prevented from dividing by blocking with thymidine, continue to<br />
produce antibody. The antibody production rate was also higher in the<br />
non-dividing cells suggesting <strong>that</strong> a non-proliferative state Is more<br />
favourable for antibody production.<br />
It was also found <strong>that</strong> cell growth rates and cell yields were generally<br />
higher in stirred culture than In static culture but <strong>that</strong> antibody yields<br />
were often lower In stirred batch culture. The lower antibody yields were<br />
due In part to the lower antibody production rates observed during the<br />
growth phase In stirred cultures but may also have been contributed to<br />
by the more rapid decline of the stirred batch cultures which would<br />
144
educe the antibody yield. Various other comparisons between stirred<br />
and stationary cultures have been made. The results of Seaver et al.,<br />
(1984) were similar to those seen in this investigation. whereas Dodge<br />
and Hu (1986), found <strong>that</strong> growth rates and cell yields were similar in<br />
stirred and stationary cultures but did observe lower antibody titres in<br />
stirred batch culture. By contrast Fazekas de St Groth (1983) found<br />
lower growth rates but increased cell yields in stirred batch as<br />
opposed to stationary culture. This range of observations may reflect<br />
the behaviour of different hybridomas in stirred culture but may also be<br />
affected by the type of vessel used for the stirred culture experiments.<br />
The hydrodynamic environment may differ between the various types of<br />
vessel and comparisons between the performance of hybridomas in<br />
different vessels must therefore be treated with caution.<br />
Studies on the metabolism of the 321 hybridoma showed <strong>that</strong><br />
glutamine was consumed at a high rate and was exhausted at the point<br />
at which cell growth ceased. This suggested <strong>that</strong> glutamine was an<br />
essential nutrient for hybridoma proliferation and it was found <strong>that</strong><br />
the cell density achieved in stirred suspension culture<br />
decreased with decreasing glutamine concentration. Other studies on<br />
the amino acid utilisation by hybridomas have shown <strong>that</strong> growth is<br />
accompanied by the rapid utilisation of glutamine (Seaver et a1.. 1984;<br />
Miller et al., 1988a).<br />
The reduced Blutamine uptake rate at lower glutamine concentrations<br />
may be evidence of a change in the metabolism of glutamine which is<br />
supported by the reduced ammonia yield observed with low glutamine<br />
concentrations. At low glutamine concentrations glutamine nitrogen<br />
may be more efficiently utilised in the manufacture of cellular<br />
components accounting for the lower uptake rate and lower ammonia<br />
146
yields. However"in their study on human diploid cells, Glacken et<br />
al. (1986) found <strong>that</strong> whilst the glutamine uptake rate by MDCK cells<br />
was decreased at low glutamine concentration, the ammonia yield<br />
remained relatively<br />
constant.<br />
Glucose was never exhausted by the 321 hybridoma under the<br />
conditions described and glucose uptake ceased at the end of the<br />
growth phase. Lactate accumulation followed glucose uptake very<br />
closely with 1.5-2 moles of lactate formed for each mole of glucose<br />
consumed. The rapid conversion of glucose to lactate appears to be a<br />
characteristic of proliferating cells including hybridomas (Low and<br />
Harbour, 1985; Adamson et al., 1983) and causes a substantial pH drop<br />
which inhibits cell growth.<br />
The decreasing glutamine utilisation rate observed at low glutamine<br />
concentrations was accompanied by an increasing glucose uptake rate<br />
although glucose uptake was reduced at the lowest glutamine<br />
concentration.<br />
These observations may reflect the reciprocal regulation of<br />
glutamine and glucose metabolism which has been reported for other<br />
cell types (Kvamme and Svenneby, 1961; Zielke et al., 1978). A similar<br />
phenomenon has been observed in hybridoma cells by Hu et al. (1986)<br />
where glutamine utilisation was found to be increased at low glucose<br />
concentrations. This implies <strong>that</strong> hybridomas can switch between<br />
glucose and glutamine utilisation depending on the availability of<br />
each substrate. It is also possible <strong>that</strong> glycolysis is unable to<br />
proceed in the complete absence of glutamine because In this<br />
investigation, glucose utilisation ceased when glutamine was<br />
exhausted. This may also explain the apparently contradictory findings<br />
of Ardawi and Newsholme (1982) who found <strong>that</strong> glucose uptake was<br />
146
stimulated by glutamine In proliferating lymphocytes because they<br />
measured the uptake of each nutrient in the total absence of the other.<br />
<strong>An</strong>tibody production rates were not affected by high<br />
concentrations of glutamine in neither growing nor thymidine-blocked<br />
cells but low glutamine concentrations restricted antibody production.<br />
This is a surprising finding because antibody production continues for<br />
some considerable time after the exhaustion of glutamine In batch<br />
cultures. It may be the case <strong>that</strong> large pools of glutamate. aspartate<br />
and alanine <strong>that</strong> accumulate in cells grown on glutamine (Ardawi and<br />
Newsholme, 1983; Seaver et al., 1984; Merten et al., 1986) provide<br />
sufficient Intermediates for protein synthesis but without stimulation<br />
of cell division. This may be due to the effect of glutamine limitation on<br />
the rate of purine and pyrimidine synthesis which In turn limits DNA<br />
synthesis effectively arresting cells In the G1 phase (Fontanelle and<br />
Henderson, 1969; Ley and Tobey, 1970; Zetterberg and Engstrom, 1981).<br />
The 321 hybridoma showed an optimum pH for growth of 7.2 whilst<br />
antibody production in growing cells was optimum at 6.8. This<br />
phenomenon has been noted by Miller et al. (1988a) who found specific<br />
antibody production rates were higher at pH 6.8 and 7.7 than at pH<br />
7.1-7.4. A similar increase in the specific rate of antibody<br />
production at low pH was also found in this investigation. This is<br />
perhaps surprising as both protein synthesis and cell growth have been<br />
found to be suppressed at low and high pH (Ceccarini and Eagle 1971)<br />
due perhaps to effects on nutrient uptake (Barton. 1971; Birch and<br />
Edwards, 1979; Miller et a1., 1988a). One explanation for this<br />
behaviour arises from the observation <strong>that</strong> the relative rate of<br />
immunoglobulin synthesis increases in myeloma cells in stationary phase<br />
although the overall rate of protein synthesis is suppressed (Kimmel.<br />
147
1971). This may be due to a preferential translation of immunoglobulin<br />
mRNA in stationary or nutrient starved myeloma cells (Sonenshein and<br />
Brawerman, 1976): This suggests <strong>that</strong> conditions which suppress cell<br />
growth do not necessarily suppress, and indeed may favour<br />
immunoglobulin synthesis.<br />
A further finding in this investigation was <strong>that</strong> <strong>that</strong> the optimum pH<br />
for antibody production in thymidine-blocked cells was different from<br />
<strong>that</strong> seen in proliferating cells with the optimum production rate at p11<br />
7.1-7.4. This suggests <strong>that</strong> the effect of low pH on antibody production<br />
rate-in proliferating cells may be a reflection of the changes in the<br />
demands on the cells energy and metabolite reservoir at low cell growth<br />
rate. A pH range of 7.1-7.4 provides a more favourable environment for<br />
protein synthesis as illustrated by a more rapid growth rate but in the<br />
absence of cell division this extra capacity for protein synthesis may be<br />
diverted to antibody production.<br />
The concentration of newborn calf serum in the medium had a<br />
significant effect on cell proliferation. Cell growth was supressed<br />
at lower serum concentrations suggesting <strong>that</strong> serum contains a<br />
component which is essential for cell proliferation. However as high cell<br />
viability was maintained for longer periods of time in low serum<br />
concentrations it would appear <strong>that</strong> high concentrations of the<br />
component are not necessary for cell survival.<br />
It was also found <strong>that</strong> specific antibody production rates in growing<br />
hybridoma cultures were enhanced in media containing less serum. This<br />
phenomenon has been noted by others who have found <strong>that</strong> the<br />
specific production rate for antibody is generally higher in<br />
serum-free or low serum media than in serum-supplemented media<br />
(Tharakan and Chau. 1986c; Glassy et al., 1988) which has led to the<br />
148
suggestion <strong>that</strong> factors in serum inhibit antibody production (Glassy<br />
et al., 1987). However it has been shown in this investigation <strong>that</strong> this<br />
is probably not the case because antibody production was found to be<br />
enhanced at high serum concentrations with thymidine-blocked cells.<br />
This would tend to suggest <strong>that</strong> the effects of serum on antibody<br />
production seen in proliferating cells may be due to the effect of the<br />
reduced cell growth rate at low serum concentrations.<br />
This hypothesis<br />
is supported in the review by Glassy et al (1988) where it was shown<br />
<strong>that</strong> hybridoma growth rates in serum-free media are generally lower<br />
than in serum-supplemented media. The increased antibody yields at<br />
high serum concentration<br />
in blocked cells may be due to the stimulation<br />
of nutrient uptake by serum factors such as growth factors (James and<br />
Bradshaw, 1984) or insulin (Schubert, 1979) providing a larger<br />
metabolite pool for protein synthesis.<br />
The various findings discussed above suggest <strong>that</strong> the production<br />
of antibody by hybridomas is affected by the both the rate of cell<br />
proliferation and the metabolic state of the cell. It appears <strong>that</strong> more<br />
slowly growing or non-dividing cells have a higher rate of antibody<br />
production. This may be due to a change in the demands on the cell's<br />
metabolite pool as the rate of cell growth is reduced. At high growth<br />
rates the rapid synthesis of structural components for cell growth and<br />
division places a greater demand on the cell's energy or metabolite pool<br />
at the expense of antibody synthesis.<br />
It has been shown in this investigation <strong>that</strong> while certain conditions<br />
which were suboptimal for growth increased the apparent rate of<br />
antibody production in growing cells, the optimum conditions for<br />
antibody production In thymidine-blocked cells were similar to the<br />
optimum conditions for growth in dividing cells. This may be due to<br />
149
enhanced cell metabolism or nutrient uptake in ideal conditions which<br />
would normally lead to rapid cell division. In the absence of cell division<br />
the metabolic state of the cell will greatly influence antibody<br />
production.<br />
The influence of cell growth rate on antibody production makes it<br />
difficult to determine the effects on antibody production of<br />
environmental factors which also affect the growth rate. In order to<br />
investigate more fully the effect of cell physiology on antibody<br />
production rate it would therefore be necessary to maintain cells at a<br />
constant growth rate. In the next chapter therefore, the effect of cell<br />
growth rate on antibody production and cell physiology was examined<br />
under steady state conditions which were achieved using chemostat<br />
culture.<br />
150
5.1 Introduction.<br />
Chapter 5<br />
Continuous culture<br />
The data generated from batch cultures in the previous chapter<br />
suggests <strong>that</strong> factors <strong>that</strong> affect the growth rate of hybridomas may<br />
be important in the production of monoclonal antibody. The nature of<br />
batch cultures however means <strong>that</strong> metabolite concentrations and<br />
physiological conditions are continuously changing making it difficult<br />
to accurately identify those factors which influence cell productivity.<br />
In order to investigate the effects of growth rate or environment on<br />
cell metabolism it is desirable to maintain cells in a constant<br />
environment. This can be achieved by the use of a chemostat.<br />
The theory of cell growth in continuous culture is based on the<br />
principle of Monod (1942). <strong>that</strong> at submaximal growth rates, the growth<br />
rate of a cell is determined by the concentration of a single<br />
growth-limiting nutrient. Monod showed <strong>that</strong> the growth of an organism<br />
on a limiting nutrient can be described by the equation:<br />
p= ileax S (1)<br />
S+ Ka<br />
where p is the growth rate, s is the substrate concentration, pm. x is<br />
the maximum growth rate and Ks is the substrate affinity constant. This<br />
equation is analogous to the Michaelis-Menten model of enzyme<br />
151
kinetics with Ks equivalent to K..<br />
The chemostat, which was first demonstrated by Monod (1960)<br />
and Independently by Novick and Szliland (1950), is a reactor which<br />
maintains a constant volume with a constant rate of medium addition<br />
such <strong>that</strong> cells'and medium are removed at the same rate. The medium<br />
feed has a single growth limiting nutrient so <strong>that</strong>' at feed rates less<br />
than the maximum growth rate of the cell the cell growth rate is<br />
determined by the feed rate or dilution rate (D). At a 'constant dilution<br />
rate a steady state will be established during which the cell number<br />
and the physiological environment are constant, and the growth rate<br />
(p) is equal to the dilution rate. The theoretical principles of<br />
chemostat culture have been discussed more fully by Pirt (1975) and<br />
Herbert et al. (1956).<br />
Attempts to grow mammalian cells in a chemostat were made as<br />
early as 1958 by Cooper et al. but the limited success by early workers<br />
in maintaining a stable steady state may explain why comparatively<br />
few studies of animal cell physiology have employed the chemostat.<br />
Most of the chemostat studies <strong>that</strong> have been made have used glucose<br />
as a limiting substrate (Moser and Vecchio, 1967; Tovey and<br />
Brouty-Boye, 1976, Tovey 1980) although in many cases the limiting<br />
nutrient was not known (Griffiths and Pirt, 1967; Van Hemert et al.,<br />
1969; Fazekas de St Groth, 1983). Tovey and Brouty-Boye (1976)<br />
showed <strong>that</strong> it was possible to maintain long term steady states and<br />
<strong>that</strong> the'growth of animal cells in chemostats correlates well with the<br />
Monod equation (equation 1).<br />
There is still little published work on the growth of hybridoma<br />
cells in chemostats but Birch's group in the UK (Boraston et al., 1982,<br />
Birch et al., 1986b) and Millers group (Miller et al., 1988a, b, 1989a, b)<br />
162
in the USA have published data derived from chemostat culture. These<br />
studies have suggested <strong>that</strong> antibody production is not directly linked<br />
to cell growth rate and there is evidence <strong>that</strong> antibody production<br />
declines at high growth rates.<br />
In this study chemostat culture has been used to investigate<br />
the effect of growth rate on monoclonal antibody production by 321<br />
hybridoma cells. The data indicate <strong>that</strong> antibody production rate<br />
decreases at higher growth rates. The utilisation of Blutamine and<br />
glucose and the production of ammonia and lactate have also been<br />
monitored and the effect of growth rate on the metabolic quotients for<br />
these metabolites is discussed. The monitoring of these major<br />
metabolites should provide information on the changes in cell metabolic<br />
activity at different growth rates.<br />
Glutamine was selected as the limiting nutrient for these<br />
studies as the results of the previous chapter suggest <strong>that</strong> glutamine is<br />
the first nutrient to be exhausted In batch cultures and the<br />
stationary/decline phase begins at <strong>that</strong> time. It was therefore decided<br />
<strong>that</strong> a glutamine-limited chemostat might provide useful information<br />
on the production of antibody under steady state conditions with low<br />
glutamine concentrations.<br />
5.2 Materials and methods.<br />
5.2.1 Apparatus for continuous culture of hybridoma cells.<br />
The vessel used for chemostat culture was a1 litre glass<br />
reactor with a stainless steel headplate (Gallenkamp). The temperature<br />
in the vessel was maintained by a water jacket connected to a<br />
163
circulating water bath at 37° C. Agitation was provided by a large<br />
Teflon-coated stirrer bar fixed through the stirrer shaft and driven by<br />
magnetic coupling. The agitator speed was maintained at 100rpm.<br />
Aeration and pH control of the culture was achieved by passing<br />
95% air 5% C02 through the headspace at 311tres/h.<br />
The pH was monitored by a Russell autoclavable pH probe<br />
connected via an amplifier to a BBC microcomputer. The computer was<br />
programmed to record pH data at 30 minute intervals. The data was<br />
displayed on screen with the elapsed time and also stored on disc so<br />
<strong>that</strong> it could be retrieved at a later date.<br />
Medium was fed to the reactor from a 2litre reservoir which could<br />
be refilled via a sterile coupling. The medium reservoir was kept at<br />
between 0 and 40C. Waste medium was collected in a 1011tre vessel<br />
which was connected via a sterile coupling so <strong>that</strong> the vessel could be<br />
replaced when full. The medium flow rate was controlled by a<br />
peristaltic pump (Gilson). Figure 6.1 shows the apparatus used for the<br />
continuous culture of the 321 hybridoma.<br />
5.2.2 Continuous culture.<br />
For the continuous culture a 500m1 working volume was used.<br />
The medium comprised RPMI 1640 supplemented with 2g/I sodium<br />
hydrogen carbonate and 10% newborn calf serum with glutamine as<br />
the limiting nutrient. The actual glutamine concentrations used are<br />
mentioned at the relevant points In the results section. Cell numbers<br />
and viability were determined daily and samples were also taken for<br />
antibody, glucose, lactate, glutamine and ammonia determinations.<br />
154
Figure 5.1. Apparatus used for the chemostat culture<br />
Samp<br />
port<br />
155<br />
Waste reservoir<br />
it
. Sample volumes were typically 5m1 representing 1% of the culture<br />
volume. Steady state was said to be achieved when five consecutive<br />
samples gave comparable cell counts and metabolite concentrations.<br />
5.2.3 Metabolic quotients.<br />
The metabolic quotient (q) for a metabolite is the specific rate<br />
of uptake or production of <strong>that</strong> metabolite under steady state<br />
conditions.<br />
If perfect mixing within the reactor is assumed such <strong>that</strong> the<br />
concentration of a metabolite (C) in the outlet is the same as the<br />
concentration of C within the reactor, the production rate (P) for a<br />
metabolite could be described as follows:<br />
P=FCout -FCin +VdCout<br />
where F is the flow rate, Ci a is the concentration of a metabolite<br />
in the inlet, Cout is the concentration of a metabolite in the<br />
outlet, V is the volume of the chemostat and dCo ut /dt is the rate of<br />
change of concentration of metabolite in the reactor.<br />
At steady state however Co ut is constant and dCo ut /dt =0<br />
Furthermore the concentration of a product in the inlet is also zero<br />
therefore:<br />
P=FCout<br />
156<br />
dt
The specific production rate qp is<br />
qp = FCont<br />
where x is the number of cells/ml<br />
Because the dilution rate is given by D= F/V<br />
then<br />
Vx<br />
qp = DCout. (2)<br />
The rate of uptake (U) at steady state can similarly be described by:<br />
U=FCIn -FCout,<br />
and the specific uptake rate (qu) by:<br />
x<br />
qu = D(Cin - Cout). (3)<br />
R<br />
It should be noted <strong>that</strong> these equations hold true only if cells and<br />
metabolites are perfectly mixed and adherence of cells to the walls of<br />
the vessel can cause deviations from these equations. However,<br />
adhesion of the 321 hybridoma to the vessel walls did not occur and<br />
perfect mixing was assumed.<br />
157
5.3 Results.<br />
5.3.1 Establishment of steady state growth.<br />
The vessel was seeded at a cell density of 2x10⁵ cells/ml. The<br />
cells were grown initially without the medium feed for 24 hours to<br />
allow cells to attain the exponential phase. Medium containing 0.7 mM<br />
glutamine was then introduced at a flow rate of 20.8 ml/hour<br />
corresponding to a dilution rate of 0.042h-1. The cell number at this<br />
point was 3x10⁵ cells/ml with 98% viable. Figure 6.2 shows the progress<br />
of the hybridoma during the initial stages of the continuous culture,<br />
The cells quickly reached equilibrium at 3.6xl05 cells/ml and<br />
measurements of the glutamine concentration showed residual levels<br />
of 0.2 mM. Increasing the glutamine feed concentration to 1mM did not<br />
result in an increase in cell number which Indicated <strong>that</strong> the cells were<br />
not glutamine limited. However when the dilution rate was reduced to<br />
0.024h-1 there was an immediate increase in cell number to 6.0x10⁵/ml<br />
and the residual glutamine concentration fell below detectable levels.<br />
A glutamine pulse confirmed <strong>that</strong> cells were substrate limited because<br />
the addition of 75mg of glutamine to the fermenter led to a transient<br />
Increase in cell number which then returned to the previous steady<br />
state level on depletion of the excess glutamine (figure 5.3). It was<br />
also observed <strong>that</strong> when the dilution rate was subsequently increased<br />
back to 0.042h-1 the cell number was maintained at the higher<br />
level (6.0x10⁵/ml).<br />
168
Figure 5.2. Initiation of the chemostat culture of the 321 hybridoma<br />
0.8<br />
ö 0'7<br />
0.6<br />
X 0.5<br />
y 0.4<br />
0.3<br />
C, 0.2<br />
0.1<br />
0<br />
O<br />
Q: Pooo<br />
Q<br />
Q<br />
Q°<br />
bo<br />
O<br />
00O<br />
0<br />
Q 13<br />
Q<br />
00 OOO0 ,0<br />
0<br />
0 100 200 300 400<br />
Time (hours)<br />
0<br />
x<br />
2.0 E<br />
C,<br />
m<br />
1.0 LD<br />
The figure shows the viable cell numbers and the residual Blutamine<br />
concentrations observed during the Initial stages of the chemostat<br />
culture. The nutrient feed comprised initially RPMI 1640,10°o newborn<br />
calf serum and 0.7mM glutamine introduced at a dilution rate of 0.042<br />
h-1 after 24 hours (first arrow). The glutamine feed concentration was<br />
adjusted to 1. OmM/l after 96 hours (second arrow). The dilution rate<br />
was reduced to 0.024h-1 after 180 hours (third arrow).<br />
159
Figure 5.3. The effect of a glutamine pulse on the cell concentration<br />
%0<br />
I<br />
O<br />
e--<br />
X<br />
E<br />
H<br />
a<br />
u<br />
ö E<br />
E<br />
a<br />
E<br />
m<br />
Z)<br />
l_7<br />
i<br />
AA<br />
- 30 =20 -10 0 10 20 30 40 50 60 70 80 90<br />
Time (hours)<br />
The figure shows cell numbers (0) and residual glutamine<br />
concentrations (0) after a pulse addition of 0.26mmoles of glutamine to<br />
the fermenter.<br />
160
5.3.2 The effect of the specific growth rate on the metabolism of the 321<br />
hybridoma.<br />
Steady states were established at three specific growth rates of<br />
0.024,0.033, and 0.042h-1 while cell washout occured at a dilution<br />
rate of 0.05h-1. Figure 5.4 shows cell growth and metabolite<br />
concentrations<br />
during successive steady states. Steady state values for<br />
cell number and glucose. lactate, Blutamine, ammonia and antibody<br />
concentrations were determined for each growth rate as shown in<br />
table 5.1. Steady state growth was established for each of the three<br />
dilution rates on at least two occasions and was found to be<br />
reproducible. The data in table 6.1 represents the mean ± standard<br />
deviation for at least 10 data points determined during two or more<br />
steady states for each dilution rate.<br />
Table 5.2 shows metabolic quotients for antibody, glucose,<br />
lactate, glutamine and ammonia for each specific growth rate.<br />
5.3.2.1 Cell numbers and viability.<br />
Cell numbers were comparable at each dilution rate and the cell<br />
viability did not drop below 99%. A dilution rate of 0.05h-1 caused<br />
loss of cells due to washout (figure 6.5). The rate of cell loss at<br />
washout is related to the maximum growth rate (po. x) by the following<br />
equation:<br />
p ax = lnxt -Inxo +D (4)<br />
t- to<br />
161
Figure 5.4. Steady state cell and metabolite concentrations at different<br />
growth rates<br />
The figure shows steady state cell numbers (0) and steady state<br />
concentrations of antibody (O), lactate (Q) and glucose (") at dilution<br />
rates of 0.024,0.033 and 0.042 h-1. The arrows represent the times at<br />
which the dilution rate was changed.<br />
162
X0.5<br />
0.8<br />
0.7<br />
0.6<br />
N 0'4<br />
0.3<br />
120<br />
Q 100<br />
T 80<br />
-0<br />
0<br />
-c 60<br />
< 40<br />
-r<br />
E6<br />
+- 2<br />
fU<br />
ö<br />
E<br />
U,<br />
0<br />
0<br />
10<br />
Lm 2<br />
Figure 5.4<br />
0<br />
°°QQ<br />
0.024 0.033 0.042<br />
0 00 00 000000 ooö<br />
0 0<br />
°Q<br />
Q<br />
Q<br />
i 00000 0 00<br />
4 1"""<br />
"<br />
"<br />
"""""<br />
""<br />
°<br />
°<br />
013<br />
°°<br />
000000 00<br />
690 790 890 990 1090<br />
"""<br />
Time (hours)<br />
163<br />
""<br />
""<br />
°°<br />
o00 000<br />
°Q° J°Q<br />
00 000 000<br />
""<br />
"<br />
"" "<br />
1190 1290
p<br />
O<br />
"1_<br />
CD<br />
-: C<br />
a<br />
L)<br />
C<br />
O<br />
u<br />
a<br />
0<br />
4-<br />
a<br />
E<br />
rv<br />
Cu<br />
. 4-<br />
N<br />
tu<br />
a<br />
in<br />
C<br />
0<br />
a)<br />
. 4-<br />
fU<br />
L<br />
c<br />
0<br />
'4 --<br />
0<br />
F--<br />
LI<br />
.n<br />
co<br />
-<br />
rv<br />
E E<br />
c<br />
ý<br />
+-<br />
E<br />
m m ö#<br />
-oI<br />
ö 0<br />
+I +1 +1<br />
m<br />
O O +I<br />
3 o<br />
m<br />
--J<br />
ö<br />
E<br />
o<br />
Ln<br />
N<br />
O O O<br />
+1 +I +1<br />
CC) T<br />
N<br />
It<br />
L! 1<br />
N m<br />
0<br />
o<br />
+t<br />
+1<br />
3 E<br />
O<br />
N o o<br />
n<br />
LO .ö %0 %0<br />
0<br />
E<br />
OD O N<br />
m cv m<br />
-ý ` +I +I +1<br />
a- o<br />
Q<br />
co<br />
E<br />
M<br />
C<br />
E<br />
Iö'<br />
o<br />
ö<br />
+I<br />
ö<br />
ö<br />
+1<br />
ö<br />
cD<br />
+I<br />
w<br />
V-<br />
x ý<br />
ö<br />
Ln<br />
o<br />
n<br />
Ln i<br />
cD<br />
' ö<br />
0'<br />
m<br />
ö<br />
.c .<br />
ö ö ö<br />
164<br />
N<br />
ö
N<br />
a)<br />
-F-<br />
fU<br />
C-<br />
s<br />
0<br />
C-<br />
rn<br />
-1-<br />
C<br />
Q)<br />
L-<br />
a)<br />
V--<br />
'v<br />
-I-<br />
(U<br />
N<br />
4-<br />
(1)<br />
:Z<br />
O<br />
u<br />
0<br />
. 13<br />
N<br />
a<br />
Lll<br />
a)<br />
rv<br />
F-<br />
(0<br />
-C N +'t ýt<br />
4<br />
O<br />
E o<br />
E ö ö ö<br />
a<br />
c<br />
N<br />
0<br />
CC)<br />
En<br />
"%O<br />
O L p O CD<br />
p1 O O O<br />
0<br />
C!<br />
u<br />
rv<br />
ü ö N<br />
m<br />
a<br />
N<br />
O r-<br />
N<br />
A<br />
Qj<br />
co --t<br />
rn<br />
Ö Ö<br />
O<br />
'ej<br />
o Ln - m<br />
ru Z<br />
'O<br />
ö<br />
ö<br />
m<br />
0<br />
6<br />
0<br />
6<br />
165
Figure 5.5. Cell washout kinetics at high dilution rate<br />
1.0<br />
0.9<br />
0.8<br />
0.7<br />
0.6<br />
X 0.5<br />
N 0.4<br />
C,<br />
ý-' 0.3<br />
0.2<br />
0.1<br />
0<br />
140 1480 152 0 1560 1600 1640<br />
The figure shows the effect on cell numbers of increasing the dilution<br />
rate from 0.042 to 0.05h-1. The cell numbers recovered after adjusting<br />
the dilution rate to 0.024h-1. The arrows represent the times at which<br />
the dilution rate was changed.<br />
Time (hours)<br />
166
where xo is the population at time=0 and xt the population at time=t.<br />
This gave a theoretical p ax of 0.040h-1 which is slightly lower<br />
than the highest growth rate achieved in the chemostat. This value<br />
is somewhat lower than the maximum growth rate achieved in batch<br />
cultures but this may reflect the fact <strong>that</strong> the chemostat was<br />
operating at a pH of between 7 and 7.1 which is slightly below the<br />
optimal pH of 7.2 (Chapter 4, figure 4.5a).<br />
5.3.2.2 Glutamine and ammonia.<br />
Residual glutamine concentrations<br />
in the fermenter were below the<br />
limit of detection (
Sumbilla et al. (1981), which was of the order of 2-3x10⁻⁴ M.<br />
5.3.2.3 Glucose and lactate.<br />
Steady state concentrations of glucose remained relatively<br />
constant for all three dilution rates while lactate concentration<br />
increased approximately twofold from the lowest to the highest dilution<br />
rate. While the metabolic quotients for glucose and lactate increased<br />
with increasing dilution rate the ratio of qi sctat, to qo iucoss was not<br />
constant in <strong>that</strong> the amount of lactate liberated for each molecule of<br />
glucose consumed increased at higher growth rates.<br />
5.3.2.4 <strong>An</strong>tibody.<br />
The steady state concentration of antibody in the culture<br />
decreased with increasing dilution rate and q. nt Icody in was 5.4,4.6<br />
and 3.8pg/106cells/h at dilution rates of 0.024,0.033 and 0.042h-1<br />
respectively.<br />
Cell yields for glutamine were similar for each dilution rate<br />
but product yields (mg antibody/mg glutamine) declined at higher<br />
dilution rates (table 5.3).<br />
5.3.3 Hybridoma stability.<br />
The chemostat culture of the 321 hybridoma was maintained<br />
for 112 days representing approximately 100 generations. At<br />
comparable dilution rates and cell density the specific antibody<br />
168
CL)<br />
C<br />
_<br />
.E<br />
4-<br />
41-<br />
E<br />
0<br />
L<br />
4-<br />
a<br />
.T<br />
-F-<br />
u<br />
0<br />
L-<br />
CL<br />
ft,<br />
Li<br />
Lfl<br />
4!<br />
I--<br />
. cj<br />
a'<br />
C_<br />
E<br />
°'<br />
,0<br />
L) 0<br />
c<br />
CL)<br />
C<br />
: " E<br />
a ru<br />
3<br />
o<br />
C-<br />
U)<br />
rn<br />
cn<br />
Q,<br />
u<br />
ý<br />
.c<br />
CO LO ro<br />
ö 0 0<br />
CP ap o`<br />
nm m Cn<br />
rn<br />
ö<br />
c<br />
ö 0<br />
ö ö ö<br />
169
production rate was similar throughout the chemostat culture. This<br />
implies <strong>that</strong> the production of antibody by the 321 hybridoma was<br />
stable under continuous culture conditions which are highly selective<br />
due to the limitation of an essential nutrient.<br />
5.4 Discussion.<br />
A glutamine limited chemostat culture of 321 hybridoma cells was<br />
maintained at three different dilution rates over a period of 4 months.<br />
Cell numbers were comparable at each dilution rate and cell viability<br />
remained above 99% during each steady state. The high cell viability<br />
can in part be attributed to the washout of non-viable cells and the<br />
dilution of toxic metabolites.<br />
Batch culture experiments had indicated a maximum growth<br />
rate of 0.051h-1 but this could not be achieved in continuous<br />
culture in <strong>that</strong> washout of cells occurred at a dilution rate of 0.05h-<br />
1. Calculation of Amax by washout kinetics suggested a maximum<br />
theoretical growth rate of 0.04h-1. This is slightly lower than growth<br />
rates already achieved in the chemostat. This behaviour may be a<br />
result of the increasing lactate concentrations observed at higher<br />
growth rates. This in Itself might suppress growth rates by inhibition<br />
(Glacken et al., 1986) and it has indeed been demonstrated <strong>that</strong> lactate<br />
inhibits the growth of the 321 hybridoma cell independently of pH (J.<br />
S. Thorpe. personal communication). However it is also likely <strong>that</strong> the<br />
sub optimal pH in the chemostat is suppressing cell growth. It has<br />
been demonstrated in the previous chapter <strong>that</strong> small deviations<br />
from the optimum pH of 7.2 lead to a substantial decrease in the<br />
170
growth rate of the 321 hybridoma. The data generated in the previous<br />
chapter (figure 4.5a) suggest <strong>that</strong> at pH 7.0 the maximum specific growth<br />
rate would be 0.04h-1 which agrees with the growth rate calculated by<br />
washout kinetics.<br />
The cell yield from glutamine observed in chemostat cultures<br />
was similar for each dilution rate and was . higher than achieved in<br />
batch cultures. The observation <strong>that</strong> glutamine limitation results in<br />
increased cell yields agrees with the findings in batch cultures where<br />
the lowest initial glutamine concentrations gave the highest cell yields<br />
(figure 4.3).<br />
In batch cultures with high Initial glutamine concentrations,<br />
as demonstrated in the previous chapter, there was typically 1 mole<br />
of ammonia liberated for each mole of glutamine consumed whereas In<br />
the chemostat the ratio was 0.5 at p=0.024h-1 and decreased with<br />
increasing dilution rate to 0.3 at p=0.042h-'. These observations<br />
suggest <strong>that</strong> the route for the metabolism of glutamine may be<br />
influenced by glutamine concentration. At low glutamine<br />
concentrations it is likely <strong>that</strong> there is more efficient incorporation of<br />
glutamine nitrogen into biomass. At high glutamine<br />
concentrations, increased ammonia concentrations and lower cell<br />
yields suggest <strong>that</strong> there is greater oxidative degradation of<br />
glutamine. This Is in agreement with the findings of Glacken et al.<br />
(1986) who found <strong>that</strong> maintaining low glutamine concentrations by<br />
periodic feeding greatly reduced the ammonia yield.<br />
Greater utilisation of exogenous glutamate under glutamine<br />
limitation would reduce the amount of ammonia liberated due less<br />
degradation of glutamine. It has been suggested <strong>that</strong> the<br />
171
glutamate: 2-oxocarboxylate aminotransferases are more important<br />
than glutamate dehydrogenase in the conversion of glutamate to<br />
a-ketogiutarate in proliferating lymphocytes (Ardawl and Newsholme,<br />
1982) implying <strong>that</strong> ammonia is primarily a result of glutaminase<br />
activity. It has also been suggested <strong>that</strong> exogenous glutamate is<br />
primarily transaminated to a-ketoglutarate whereas glutamate<br />
derived from glutamine is oxidatively deaminated by glutamate<br />
dehydrogenase (Borst, 1962; Kovacevic, 1971; Schoolwerth and<br />
LaNoue, 1980). This may be an effect of compartmentation<br />
because both<br />
glutaminase and glutamate dehydrogenase are located within the<br />
mitochondrion 'while the transaminases are located predominantly in<br />
the cytosol.<br />
There is also evidence to suggest <strong>that</strong> the flux through the<br />
metabolic pathways used to catabolise glucose and glutamine change<br />
with increasing dilution rate. As the dilution rate is increased the ratio<br />
of glactate: qglucoaa increases 'while the ratio of<br />
qa o n1a : qo 1utamine decreases. A number of explanations for this<br />
behaviour could be put forward.<br />
i) More glucose is converted to lactate at higher growth rates. It has<br />
been noted <strong>that</strong> in batch cultures of hybridomas the number of moles<br />
of lactate formed from each mole of glucose Increases with growth rate<br />
(Luan et al.. 1987; Hu et a1.. 1987). It also appears <strong>that</strong> as the rate of<br />
glucose uptake is increased carbohydrate molecules are Increasingly<br />
shunted through glycolysis to lactate (Zielke et a!.. 1978). At slower<br />
rates of glucose uptake or with more slowly metabolised sugars such<br />
as galactose or fructose it has been suggested <strong>that</strong> more carbohydrate<br />
172
is shunted through the pentose phosphate cycle with the formation of<br />
less lactate (Reitzer et al., 1979). The data generated in this<br />
investigation would support such a hypothesis.<br />
In his studies on mouse LS cells in chemostat culture, Sinclair 0 980)<br />
found <strong>that</strong> while the amount of glucose converted to lactate was<br />
variable, the amount of glucose oxidised was constant over a wide range<br />
of growth rates. Based on his calculation <strong>that</strong> the metabolic quotient for<br />
glucose oxidised = qo 1acos e- 0.5(gi act. to), a similar constant value<br />
is obtained at the 3 growth rates studied in this investigation (qg iacoae<br />
0.5(gi actat e) = 0.14-0.16 )imol/106 cells/h). This suggests <strong>that</strong> at a<br />
glucose uptake rate of 0.14-0.16 pmol/106 cells/h there should be no net<br />
yield of lactate but such a prediction was not tested.<br />
Ii) More glutamine is incompletely oxidised to lactate at higher growth<br />
rates. Zielke and colleagues (1980) discovered <strong>that</strong> 13% of glutamine<br />
carbon was converted to lactate in HeLa cells but the contribution to<br />
qi act ate from glutamine might be expected to be small and it is likely<br />
<strong>that</strong> much of the increase in gi. ct. t. is attributable to increased<br />
glycolytic activity.<br />
iii) Since mammalian cells utilise glutamlne in the synthesis of<br />
asparagine, purines, pyrimidines and amino sugars (Levintow et al.,<br />
1957; Salzman et a!., 1957; Meister, 1962) it is likely <strong>that</strong> the.<br />
requirements for glutamine increase in more rapidly growing<br />
cells. The metabolic quotient for glutamine does indeed increase with<br />
dilution rate in the chemostat whereas q... o. i. was similar at all three<br />
growth rates. The decreasing ammonia yield from glutamine in the<br />
173
chemostat suggests <strong>that</strong> a greater proportion of glutamine nitrogen is<br />
being incorporated into cell biomass. However this investigation has<br />
also demonstrated <strong>that</strong> the cell yield from glutamine is constant over<br />
the range of dilution rates which may be evidence <strong>that</strong> glutamine carbon<br />
is accumulating in amino acid pools such as glutamate or alanine (Seaver<br />
et al.. 1984; Merten, 1986; Miller et al.. 1988a).<br />
iv) There is evidence <strong>that</strong> an increasing flux through the glycolytic<br />
pathway inhibits glutamine oxidation (Zielke et al., 1978; Hu et al.,<br />
1987). The reduced yield of ammonia from glutamine seen in this<br />
investigation would be consistent with a reduction in the oxidative<br />
deamination of glutamine. The mechanisms of such regulation have not<br />
been elucidated but it is known <strong>that</strong> increased rates of glycolysis inhibit<br />
oxidation via the Krebs cycle (Frame and Hu, 1984; Glacken et al., 1986)<br />
possibly due to an increased cytosolic ATP/ADP ratio (Miller et al.,<br />
1988a). Recently Glacken (1988) has postulated <strong>that</strong> the increased rate<br />
of ATP production from glycolysis depletes the intracellular phosphate<br />
pool which leads to a reduction in phosphate-regulated glutaminase<br />
activity.<br />
<strong>An</strong>tibody production showed a decreasing specific production<br />
rate and product yield from glutamine, with increasing dilution rate.<br />
This is consistent with other observations on the production of<br />
monoclonal antibodies 'by hybridomas. Higher specific production<br />
rates have been noted in perfusion culture systems with low cell<br />
growth rates (Van Wezel et al., 1985; Reuveny et al., 1986b) and Miller<br />
and colleagues (1988a) showed a similar relationship between growth<br />
rate and the specific production rate of antibody in a glucose limited<br />
174
chemostat culture. Birch and colleagues (1985b) also made similar<br />
observations in chemostat cultures of hybridomas under oxygen or<br />
glucose limitation but contrary to the findings in this investigation<br />
they found <strong>that</strong> antibody production was depressed at low growth<br />
rates under glutamine limitation. The reasons for this difference are<br />
unclear and a lack of data concerning the culture conditions under<br />
which Birch and colleagues made these observations make it difficult<br />
to identify possible contributing factors.<br />
In general it appears <strong>that</strong> low growth rates favour higher<br />
antibody production rates in hybridomas. A number of hypotheses<br />
could be put forward to explain this behaviour.<br />
1) The capacity for macromolecular synthesis by hybridomas Is finite<br />
and monoclonal antibodies take up a substantial proportion of the<br />
cells capacity for protein synthesis. Hybridomas may produce in excess<br />
of 1000 molecules immunoglobulin/cell/second (Merten, 1987). It would<br />
therefore be reasonable to assume <strong>that</strong> at higher growth rates more<br />
of the cells synthetic capacity would be diverted towards<br />
macromolecular synthesis for the processes of cell division at the<br />
expense of antibody synthesis. The changing fate of glucose and<br />
glutamine at higher growth rates may be evidence of this change in the<br />
metabolic balance. The Increased efficiency of nitrogen incorporation at<br />
high growth rates may reflect the increasing demands on the cell<br />
metabolite pool while the increasing conversion of glucose to lactate<br />
could be supplying the increased energy needs of the cell.<br />
ii) <strong>An</strong>tibody synthesis is repressed or inhibited by a metabolite. If<br />
antibody synthesis is being adversely affected by a metabolite such as<br />
176
glucose, glutamine, lactate or ammonia, then increased rates of uptake<br />
or production at high growth rates could account for the decline in the<br />
rate of antibody synthesis.<br />
If such a phenomenon exists in hybridomas it is a complex process<br />
as many factors have been shown to influence antibody production.<br />
Glucose, oxygen (Birch et al., 1985b; Miller et al., 1988a) and glutamine<br />
(this investigation) limited chemostat cultures show decreasing<br />
antibody production rates with increasing growth rate. There is some<br />
evidence to suggest <strong>that</strong> these effects are not due to<br />
inhibition/repression in <strong>that</strong> Miller et al. (1987) have noted <strong>that</strong> the<br />
optimum oxygen concentration for cell growth was different from <strong>that</strong><br />
for antibody production but g91ta. init , goiuco.. and goxYoen were<br />
maximal at the highest qa ntibodV which would not be consistent<br />
with inhibition or repression by any of nutrients. In addition glucose<br />
does not affect antibody production in batch culture (Low and Harbour,<br />
1985; Tharakan and Chau, 1986), Bodeker et al. (1988) found antibody<br />
production by immobilised hybridomas was favoured at high oxygen<br />
consumption rates and in this investigation high glutamine<br />
concentrations had little effect on antibody production in batch cultures<br />
(Chapter 4, sections 4.2.3 and 4.2.7).<br />
Ammonia has been found to inhibit the production of viruses (Eaton<br />
and Scala, 1961; Jensen and Liu, 1961), interferon (Ito and McLimans,<br />
1981) and antibody production (Reuveny et a1., 1986a) but in this case<br />
q... o nia remains unaltered at each dilution rate and steady state<br />
ammonia concentrations decline at high growth rates. It therefore seems<br />
unlikely <strong>that</strong> inhibition by ammonia Is responsible for the decline In<br />
antibody production rate observed in the chemostat.<br />
176
Increasing concentrations of lactate at higher growth rates may<br />
Inhibit antibody production as suggested by Glacken et al. (1986).<br />
however Reuveny et al. (1986a) and Miller et al.<br />
(1988b) have found<br />
<strong>that</strong> lactate levels above 20mM did not affect antibody production. It<br />
Is also notable <strong>that</strong> the highest rates of antibody production often<br />
occur In the latter stages of batch cultures when lactate<br />
concentrations are highest (see Chapter 4).<br />
iii) Cell cycle distribution. It has been reported <strong>that</strong> some<br />
lymphoblastold cell lines produce antibody in a cell-cycle<br />
dependent fashion with the highest production during the Gi phase<br />
(Buell and Fahey, 1969; Takahashi et al., 1969, Byars and Kidson,<br />
1970, Garatun-Tjeldsto et al., 1976; Turner et al., 1986). It has also<br />
been found <strong>that</strong> the distribution of cells throughout the cell cycle<br />
changes with growth rate where the S, Gz and M phases remain<br />
relatively constant and variations in the length of the cell cycle can<br />
be attributed to variations in the length of Gi. This has also been<br />
demonstrated in chemostat culture with yeast (Bailey et al., 1982;<br />
Scheper et al., 1988). They showed <strong>that</strong> proportionately more cells<br />
were in the Gi phase at low growth rates. If the synthesis of<br />
antibody by hybridomas is restricted to the Gi phase then it would<br />
follow <strong>that</strong> the rate of antibody synthesis would be higher at low<br />
growth rates. This could also account for the higher production rates<br />
observed in stationary phase or in Gi arrested cells (Chapter 4). It is not<br />
known whether immunoglobulin synthesis by hybridomas is under cell<br />
cycle regulation but this possibility was entertained by Low and Harbour<br />
(1985a) who detected a sub-population of hybridomas which were not<br />
177
secreting antibody. Furthermore they found <strong>that</strong> the proportion of<br />
non-secreting cells did not change after subsequent cloning suggesting<br />
<strong>that</strong> non-secreting cells may have been passing through a<br />
non-productive stage of the cell cycle.<br />
Preliminary investigations have been carried out to determine<br />
whether such a phenomenon exists in hybridomas and the findings are<br />
described in the next chapter.<br />
Conclusions.<br />
1. Higher cell and antibody yields from glutamine were achieved in<br />
chemostat culture suggesting <strong>that</strong> glutamine utilisation<br />
is more efficient<br />
at low concentrations. The lower ammonia yields observed in the<br />
chemostat were also evidence of a more efficient incorporation of<br />
glutamine nitrogen.<br />
2. Glucose uptake rate increased at higher growth rates. The proportion<br />
of glucose converted to lactate was also increased at higher growth<br />
rates suggesting <strong>that</strong> energy production from aerobic glycolysis<br />
increases in rapidly growing cells.<br />
3. Glutamine uptake rate increased at high growth rates. The amount of<br />
ammonia liberated from each molecule of glutamine declined at high<br />
growth rates suggesting <strong>that</strong> glutamine nitrogen was being more<br />
efficiently incorporated into biomass at high growth rates.<br />
4. The specific production rate for antibody declined at high growth<br />
rates. This may be evidence <strong>that</strong> the increased demands on energy and<br />
178
metabolite pools by rapidly growing cells is detrimental to antibody<br />
synthesis. Alternatively it may be evidence <strong>that</strong> antibody is only<br />
produced during the GL phase of the cell cycle, which is shorter at high<br />
growth rates, and hence represents a smaller proportion of the cell<br />
cycle.<br />
179
6.1 Introduction.<br />
Chapter 6<br />
Synchronised culture.<br />
There is a considerable weight of evidence to suggest <strong>that</strong> many<br />
metabolic functions, including protein synthesis, are cell cycle-<br />
dependent (Mitchison, 1971; Lloyd et al., 1982; Denhardt et al., 1986).<br />
Many proteins which show cell cycle-dependent expression can be<br />
related to specific functions within the cell cycle, for example<br />
thymidine kinase (Liu et al., 1986) and histone synthesis (Delisle et al.,<br />
1983; Artishevsky et al., 1984) are usually tightly coupled to DNA<br />
synthesis. However the expression of other proteins may not be so<br />
readily linked with the process of cell replication and immunoglobulin<br />
synthesis falls within this category.<br />
Based on the evidence from cell synchronisation experiments<br />
using different synchronisation procedures on different<br />
immunoglobulin secreting cell lines several investigators have<br />
suggested <strong>that</strong> the bulk of immunoglobulin production Is produced In<br />
the late Gi early S phases of the cell cycle (Byars and Kidson. 1970;<br />
Buell and Fahey. 1969; Takahashi. 1969; Garatun-Tjeldsto et al.. 1976;<br />
Turner et al.. 1985). Other investigators have disputed this finding in<br />
<strong>that</strong> they found no evidence for such variation with cell cry Je. (Cowan<br />
and Milstein. 1972; Liberti and Baglioni. 1973) although the latter<br />
authors observed <strong>that</strong> immunoglobulin synthesis was depressed during<br />
mitosis. It was also suggested <strong>that</strong> the variation was due to the<br />
synchronisation procedure and not a true reflection of protein<br />
expression in normally growing cells. This view was supported by<br />
180
Damiani and collegues (1979) who investigated the production of<br />
immunoglobulin in an adherent myeloma cell line. Using a physical<br />
rather than chemical selection procedure to synchronise the cells they<br />
could find no variation in immunoglobulin expression during the cell<br />
cycle. However Killander et al. (1977) used cytophotometry to<br />
examine the production of IgE in asynchronous cultures of human<br />
myeloma cells and in At least some of their experiments there was an<br />
apparent increase in the accumulation of IgE in Gi with a subsequent<br />
decrease during S phase.<br />
There are therefore several different observations concerning the<br />
relationship between cell cycle and immunoglobulin production but<br />
the observations <strong>that</strong> the G, phase contributes much of the variability<br />
to the duration of the cell cycle and <strong>that</strong> cells, including hybridomas<br />
(Schliermann et al., 1987). tend to accumulate in Gi in sub-optimal<br />
growth conditions suggest <strong>that</strong> higher antibody production rates in G1<br />
could contribute to the variability seen in immunoglobulin production<br />
by hybridomas.<br />
In order to investigate the possibility <strong>that</strong> immunoglobulin<br />
synthesis or secretion is restricted to particular phases of the<br />
hybridoma cell cycle it is necessary to produce a population of cells<br />
which are predominantly in the same part of the cell cycle at one time.<br />
Cell synchronisation allows this approach in <strong>that</strong> a population of cells<br />
can be induced to perform the mechanisms of cell division in synchrony.<br />
The methods available for synchronisation of animal cells depends<br />
on the type of cell and a number of methods have been applied.<br />
181
61 .1 Physical selection methods.<br />
1) Mitotic selection. The selection of cells in mitosis is a method which<br />
produces a population of cells with a high degree of synchrony<br />
(Terasima and Tolmach. 1963). The tendency for anchorage dependent<br />
cells to become - rounded and hence more loosely attached to the<br />
substrate during mitosis means <strong>that</strong> they are more readily shaken<br />
free of the surface and can be separated from the more strongly<br />
attached cells. This technique only produces a small number of cells<br />
and cannot be applied to suspension cells such as hybridomas.<br />
ii) Size selection. In progressing from one mitosis to the next a cell<br />
doubles in size. In fact there Is a gradual Increase in cell volume from<br />
Gi to M (Grazitt et al., 1978) and this has been used to separate cells<br />
by density gradient centrifugation (Mitchell and Tupper, 1977).<br />
iii) Cell sorting by cytofluorimetry. Fluorescence measurements of the<br />
DNA content of cells can be made at rates of 104 cells per second in a<br />
flow cytofluorimeter (Kamentsley et al., 1965) which allows the<br />
frequency distribution analysis of the cell cycle in randomly dividing<br />
cells. Cell subpopulations can thus be selected and the physical sorting<br />
of cells in particular phases can be achieved as the cells leave the flow<br />
chamber. Cells are isolated in tiny droplets and selected cells are<br />
electrostatically charged and deflected into a separate collection vessel<br />
for further analysis (Horan and Wheeless, 1977; Schaap et al., 1979).<br />
182
6.1.2 Growth arrest.<br />
Other synchronisation procedures depend on the accumulation of cells<br />
at a particular point in the cell cycle by the use of inhibitors or<br />
nutrient starvation.<br />
1) Nutrient starvation. Under adverse environmental conditions<br />
mammalian cells have a tendency to accumulate in the Gi phase and this<br />
phenomenon has been used to synchronise cells. For example cells<br />
starved of isoleucine or glutamine (Ley and Tobey, 1970) or serum<br />
(Burk, 1970) arrest in Gi and subsequent addition of the missing<br />
nutrient can induce the cells to divide in synchrony.<br />
11) Inhibition. The use of metabolic inhibitors to specifically block an<br />
event necessary for the progress of the cell through the division cycle<br />
can be used to gather cells at a particular point in the cell cycle.<br />
Release from a reversible inhibitor can result in the synchronous growth<br />
of the cells. The use of colcemid to gather cells at metaphase by the<br />
Inhibition of spindle formation (Stubblefield, 1964). is useful In<br />
gathering greater numbers of anchorage dependent cells for mitotic<br />
selection but is not useful for suspension cells because exposure to<br />
colcemid for longer than 2-3 hours causes irreversible damage to the<br />
cells (Stubblefield, 1968). Inhibitors of DNA synthesis are more useful<br />
for suspension cells. Methotrexate (Rueckert and Mueller, 1960) or<br />
6-fluorodeoxyuridine (Littlefield, 1962) inhibit DNA synthesis by<br />
interfering with the methylation of thymidine. High<br />
concentrations of thymidine (Xeros, 1962). deoxyadenosine or<br />
183
deoxyguanosine (Mueller and Kajiwara, 1966) inhibit DNA synthesis by<br />
feedback effects on other nucleotide precursors. Such methods will<br />
arrest cells at any point in the S-phase and consequently a single block<br />
will only produce a high degree of synchrony in cells where the<br />
S-phase represents only a small fraction of the complete division<br />
cycle. More rapidly growing cells such as hybridomas where the<br />
S-phase occupies a relatively large proportion of the cell cycle<br />
require a double block. The first block arrests cells in S-phase while<br />
cells in other phases complete the cycle and gather at the end of the<br />
Gi phase. The cells are then released from the block until all cells<br />
have traversed the S-phase then blocked a second time such <strong>that</strong> the<br />
majority of cells collect at the boundary between the Gi and S phases.<br />
On release the cells should resume growth in synchrony.<br />
Thymidine blocking of 321 hybridoma cells has already been<br />
successfully used in this investigation (see Chapter 4). The double<br />
thymidine block method was therefore adapted for the<br />
synchronisation of 321 hybridoma cells.<br />
6.2 Materials and methods.<br />
6.2.1 Synchronisation of the 321 hybridoma.<br />
The synchronisation of the 321 hybridoma was carried out<br />
according to the method of Puck (1964). The method was modified for<br />
the hybridomas.<br />
Cells growing in early to mid exponential phase were arrested<br />
by the addition of thymidine to 2mM. After 30 hours under the<br />
184
thymidine block the cells were washed and resuspended in thymidine<br />
free medium at a density of 2.6x10⁵ cells/ml. After 6 hours incubation<br />
2mM thymidine was added to the culture and the cells were incubated<br />
for a further 18 hours. The cells were resuspended at a density of<br />
2.5x10⁵ /ml in thymidine free medium and the cell growth and<br />
productivity were measured for 2 cell divisions.<br />
6.2.2 Radiolabelling of proteins.<br />
" Glasgows modification of Eagles medium was used for the protein<br />
radiolabelling experiments. This was formulated to contain only<br />
3mg/l of methionine and was obtained from the Institute of Virology,<br />
University of Glasgow.<br />
For labelling experiments an aliquot containing 106 cells was<br />
washed twice with PBS at 37° C and resuspended in 200pl GMEM<br />
containing 35 S-methionine (Amersham) at a concentration of<br />
20liCi/ml. The cells were incubated with the radiolabel for one hour<br />
then lysed by the addition of 200p1 of sample buffer (100mM tris HCl<br />
pH6.8,10% 2-mercaptoethanol, 4% sodium dodecyl sulphate and 20%<br />
glycerol) and each sample was boiled for 6 minutes before storage at<br />
-2011 C.<br />
6.2.3 Radiolabelling of DNA.<br />
Periods of DNA synthesis were assessed by harvesting aliquots<br />
of 5x10⁵ cells and resuspending them in iml RPMI containing<br />
3 H-thymidine (Amersham) at 6pCi/ml. The cells were incubated for 30<br />
185
minutes then collected by centrifugation. The supernatant was<br />
discarded and 0.5 ml distilled water was added to resuspend the cells<br />
which were then lysed by the addition of 0.5m1 SDS-EDTA (0.01M NaCl;<br />
0.01M Tris chloride, pH 7.0; 1% SDS and 0.05M EDTA).<br />
Aliquots of the lysed cell suspension were placed onto filter<br />
paper strips and precipitated with ice cold 10% trichloracetic acid<br />
(TCA). The strips were washed in three changes of 10% TCA. Each<br />
strip was placed in a vial containing 4m1 Aqualuma scintillation fluid<br />
(LKB) and counted in a scintillation counter (LKB Rackbeta).<br />
6.2.4 SDS-Polyacrylamide gel electrophoresis.<br />
SDS-polyacrylamide gel electrophoresis was carried out as<br />
described in section 2.3.4. except <strong>that</strong> following electrophoresis the gel<br />
was fixed in a solution of 40% acetic acid, 30% methanol in water (v/v)<br />
for one hour then impregnated with En3 Hance (New England Nuclear) for<br />
one hour and finally washed in distilled water for one hour. The gel was<br />
then dried onto filter paper under vacuum.<br />
6.3 Results.<br />
6.3.1 Determination of the S-phase.<br />
The double block method of synchronising animal cells requires<br />
some prior knowledge of the length of S-phase so an experiment was<br />
devised which would give an estimate of the duration of the S-phase.<br />
Cells in the exponential phase of growth were blocked by adding<br />
thymidine to a final concentration of 2mM. After 24 hours the cells<br />
186
were resuspended in thymidine-free medium. At this time and at<br />
subsequent 1 hour intervals, an aliquot of cells was removed and<br />
thymidine was added again to a final concentration of 2mM. After a<br />
further 24 hours incubation in thymidine the cells in each aliquot were<br />
counted. Assuming <strong>that</strong> there was no delay at the boundary between the<br />
Gi and S phases, the time at which the cell number reaches a plateau<br />
will correspond to the time taken for all cells to escape the S-phase<br />
and hence the duration of the S-phase.<br />
Figure 6.1 shows viable cell counts obtained during the thymidine<br />
block and release experiment. Cells were initially at a concentration<br />
of 3x10⁵ cells/ml before release. After 5 hours a plateau for the cell<br />
concentration was reached indicating <strong>that</strong> it required approximately<br />
5 hours for all the cells to escape from the S-phase and hence an<br />
approximate duration of 5 hours for the S-phase. Based on this<br />
experiment it was possible to design a protocol for cell synchronisation.<br />
6.3.2 Cell synchronisation.<br />
Figures 6.2 and 6.3 show the results of synchronisation<br />
experiments with the 321 hybridoma. The data shown in figure 6.2 was<br />
the result of a single synchronisation experiment whilst figure 6.3<br />
represents the mean of three experiments. Figure 6.2 is shown<br />
separately as it was the highest degree of synchrony achieved with<br />
the 321 cells.<br />
In each experiment the cells were released from the thymidine<br />
- block at a density of 2.5x10⁵/ml. The cell number remained constant<br />
for 9 hours after which time there was a rapid increase in cell number<br />
187
Figure 6.1. Determination of the duration of S-phase<br />
E<br />
.o<br />
1<br />
0<br />
IC-<br />
C-<br />
a<br />
c<br />
cii<br />
u<br />
o""<br />
o"<br />
0"<br />
0"<br />
0123456789 10<br />
Time from release (hours)<br />
Cells were blocked with 2mM thymidine for an initial period of 24 hours.<br />
The graph shows the effect of of releasing cells from the thymidine block<br />
for increasing periods of time before blocking again with 2mM thymidine.<br />
188
Figure 6.2. Cell growth and antibody production after release from the<br />
double thymidine block.<br />
The figure shows a) viable cell numbers, b) antibody concentration and<br />
c) the specific antibody production rate (APR) calculated from the data<br />
shown in figures 6.2a and 6.2b.<br />
189
x<br />
8<br />
7<br />
Li 3<br />
E<br />
Q<br />
2<br />
140<br />
120<br />
100<br />
80<br />
60<br />
40<br />
20<br />
0<br />
14<br />
12<br />
10<br />
6<br />
a- 6<br />
4<br />
2<br />
Figure 6 .2<br />
a<br />
b<br />
0<br />
0 0 10 20 30 40<br />
Time (hours)<br />
190<br />
ý,
Figure 6.3. Cell growth and antibody production after release from the<br />
double thymidine block.<br />
The figure shows a) viable cell numbers, b) antibody concentration and<br />
c) the specific antibody production rate (APR) calculated from the data<br />
shown in figures 6.3a and 6.3b. Each point represents the mean of three<br />
separate experiments. Error bars are the standard deviation (n=3).<br />
191
E5<br />
8<br />
7<br />
6<br />
Li 3<br />
2<br />
80<br />
70<br />
60<br />
E<br />
öm50<br />
ö 40<br />
0<br />
30<br />
20<br />
10<br />
0<br />
10<br />
8<br />
6<br />
4<br />
2<br />
0<br />
Figure 6.3<br />
0 10 20 30<br />
Time (hours)<br />
192<br />
40
due to a high proportion of the cells dividing simultaneously. The<br />
cells reached a new constant level by which time 70-75% of the cells<br />
had undergone mitosis. The proportion of cells dividing at any one<br />
mitosis never exceeded 75% in these experiments and there was<br />
no significant accumulation of dead cells suggesting <strong>that</strong> the shortfall<br />
was not due to cell death. The second division occured some 13 hours<br />
later with approximately 70% of the cells undergoing mitosis. There<br />
was considerable loss of synchrony at the second cell division and<br />
this was especially noticeable in figure 6.3a.<br />
It was possible with the Information generated with these<br />
experiments to make estimates for the duration of some of the phases<br />
in the 321 cell cycle. The difference in the time to the first division<br />
and the time between the first and second divisions represents the<br />
duration of the Gi phase assuming <strong>that</strong> the duration of (S+G2 +M) was<br />
constant in subsequent division cycles. The point at which 50% of the<br />
cells had undergone mitosis was taken as the end of the division<br />
cycle. The approximate duration for Gi from these data was therefore<br />
3 hours and because the duration of the S-phase had been previously<br />
determined as 5 hours the G2 +M phases were regarded as occupying the<br />
remainder of the cell cycle which was 5 hours.<br />
<strong>An</strong>tibody accumulation in the medium was assayed by the<br />
sandwich ELISA as previously described (Chapter 2, Section 2.2.5).<br />
Figures 6.2b and 6.3b show the accumulation of antibody in the medium<br />
of a synchronised culture of the 321 hybridoma. The rate of<br />
production of antibody was not constant because there were detectable<br />
gradient changes on the antibody curve. Figure 6.2c and 6.3c<br />
Illustrate the variation in antibody production rate during the 321<br />
193
cell cycle. The antibody production rate (APR) was expressed In jig/106<br />
cells/h and was calculated from the cell number and antibody<br />
accumulation curves. Both curves show decreased production rates<br />
coinciding with the M phase and in figure f. 2c there appears to be<br />
a second decrease in production rate which corresponds with the<br />
estimated position of the S-phase. In figure 6.3c the second decrease<br />
In accumulation rate is less apparent which may be the result of the<br />
poorer synchrony achieved in these experiments.<br />
These data however are based only on the accumulation of<br />
antibody in the culture medium and give no indication of the rate of<br />
synthesis of antibody within the cell. To investigate the rate of<br />
synthesis of antibody throughout the cell cycle, the<br />
incorporation of radiolabelled methionine into antibody was<br />
monitored at intervals throughout the cell cycle.<br />
6.3.3 The incorporation ofS-methionine into antibody.<br />
A synchronised culture was initiated at 2.5x10⁵ cells/ml and aliquots<br />
of cells were removed at 90 minute intervals to measure the rate of<br />
incorporation of 35 S-methionine into 321 antibody.<br />
Figure 6.4a shows cell number in a synchronised culture of 321 cells<br />
over a period of 18 hours. Figures 6.4b and 6.4c show respectively, the<br />
incorporation of 3 H-thymidine <strong>Into</strong> DNA and the incorporation of<br />
30 S-methionine into protein over the same period. The rate of<br />
incorporation of thymidine was initially high but decreased after<br />
approximately 5 hours which is in agreement with previous estimates of<br />
the duration of the S phase. There was a subsequent increase in the<br />
194
Figure 6.4. Incorporation of 3 H-thymidine and 35 S-methionlne býsynchronised<br />
hybridomas.<br />
The figure shows a) viable cell numbers, b) 3 H-thymidine incorporation<br />
into acid precipitable material and c) 35 S-methionine incorporation into<br />
acid precipitable material.<br />
195
u,<br />
X<br />
53<br />
N<br />
G!<br />
Li<br />
°5<br />
x<br />
w<br />
Ln<br />
03<br />
r<br />
4<br />
2<br />
6<br />
cu 4<br />
Li<br />
a- 2<br />
V<br />
0<br />
;n 14<br />
0 12<br />
N<br />
ü 10<br />
Ln<br />
08<br />
CL- 6<br />
, __, 4<br />
Figure 6.4<br />
a<br />
p<br />
0<br />
O<br />
b o<br />
c<br />
024 6' 8 10 12 14 16 18<br />
0<br />
0<br />
0<br />
Time from release (hours)<br />
CPM=<br />
counts per minute<br />
196
ate of thymidine incorporation with a 60% maximum point 13 hours<br />
from the release from the thymidine block.<br />
Plate 6.1 shows an autoradlograph developed from an<br />
SDS-polacrylamide gel of radlolabelled proteins from a synchronised<br />
culture of 321 cells. The heavy chain of the antibody was obscured by<br />
other bands around the same position on the gel and its relative<br />
density could not be readily determined. The light chain however was<br />
a easily distinguishable band with a molecular weight of 25kD. The<br />
relative density of the light chains was determined using a Quantimet<br />
970 image analyser (Cambridge Instruments) programmed to measure<br />
grey levels along an individual track. The variation in intensity<br />
between tracks was compensated for by dividing the intensity of the<br />
light chain peak by the average intensity of the entire track. The<br />
resulting graph (figure 6.5) shows <strong>that</strong> the incorporation of<br />
35 S-methionine into antibody light chains shows a similar periodicity "<br />
to the accumulation of antibody in the medium. Furthermore because<br />
both intracellular and secreted antibody was measured by this method<br />
it suggests <strong>that</strong> the observed fluctuations are due to the rate of<br />
antibody synthesis. The relative rates of antibody synthesis and<br />
secretion were not determined in this investigation but could be<br />
measured by pulse-chase radlolabelling experiments.<br />
6.3.4 The effect of PH on the cell cycle.<br />
In order to explain the variation in antibody production rate due<br />
to growth rate as a result of the periodic production of antibody within<br />
the cell cycle it would be necessary to demonstrate <strong>that</strong> variations in<br />
cell growth rate can be attributed to variations in the duration of<br />
197
Plate 6.1 Autoradlograph of the separated 321 hybrldoma proteins.<br />
The plate shows an autoradlograph of the 321 hybridoma proteins<br />
which have incorporated 35S-methionine during a 60 minute pulse<br />
labelling of cells in a synchronous division cycle. Each lane represents<br />
a separate time interval after release from the thymidine block as shown<br />
by the times above the individual lanes. Molecular weight markers are<br />
14 C-labelled proteins (myosin, 200kD; phosphorylase-b, 92.6kD; bovine<br />
serum albumin, 69kD; ovalbumin, 46kD; carbonic anhydrase, 3OkD;<br />
lysozyme, 14.3kD; Amersham CFA 626).<br />
198
Plate 6.1<br />
Molecular weight<br />
markers (kD)<br />
45-- raw<br />
29<br />
Time from release (hours)<br />
o Ln CD Ln D Ln<br />
rNLn CO<br />
°<br />
Ln 9 c. n o9<br />
om Co<br />
r- v- r-<br />
F "' Ir p'I * '+<br />
199<br />
-. "-_- --<br />
H<br />
-H<br />
-L
Figure 6.5 Changes in the incorporation of 35 S-methionine into<br />
antibody light chains.<br />
a-<br />
a,<br />
2.4<br />
2.2<br />
2.0<br />
1.8<br />
1.6<br />
v 1.4<br />
1.2<br />
1.0<br />
02468 10 12 14 16 18<br />
Time from release (hours)<br />
The figure shows the relative density of the light chain bands observed<br />
on an autoradlograph of a PAGE gel loaded with protein samples from the<br />
synchronised culture described in figure 6.4. The relative density of the<br />
bands was determined by image analysis using the Quantimet image<br />
analyser (Cambridge Instruments).<br />
200
particular phases of the cell cycle.<br />
It has previously been shown <strong>that</strong> pH had a significant effect on<br />
the growth rate of the 321 hybridoma (Chapter 4, Section 4.2.4). For this<br />
reason the effect of pH on the cell cycle was investigated using a<br />
synchronised culture of 321 cells. Synchronised cells were prepared<br />
as previously described and were resuspended in HEPES buffered RPMI<br />
at initial pH values of 6.6,7.2. and 7.8.<br />
Figure 6.6 shows cell counts taken over 34 hours. It was observed<br />
<strong>that</strong> the cells underwent the first mitosis after release simultaneously<br />
and reached the same cell density. This implies <strong>that</strong> the S, G2, and M<br />
phases seem unaffected by a this pH range. However at the second<br />
mitosis cells at pH 7 underwent division some hours earlier than those<br />
cells at pH 7.8 whilst cells at pH 6.6 underwent division some hours<br />
later than cells at pH 7.8. If it is assumed <strong>that</strong> the S, G2 and M phases<br />
are still constant then the Gi phase appears to be contributing to the<br />
Increase In length of the cell cycle under unfavourable conditions of pH.<br />
6.4 Discussion.<br />
Synchronisation of the 321 hybridoma was achieved using the<br />
double thymidine block method. The cell cycle was approximately 13<br />
hours in length under these conditions and this agreed favourably with<br />
the maximum specific growth rate in batch culture of 0.051 h-1 which is<br />
equivalent to a cell doubling time of 13.6 hours. <strong>An</strong>alysis of the data<br />
from several experiments showed <strong>that</strong> the S phase was 5 hours long, the<br />
combined G2 +M phase 5 hours long suggesting <strong>that</strong> the minimum duration<br />
of the Gi phase was 3 hours.<br />
201
Figure 6.6. The effect of pH on the duration of the cell cycle<br />
Ln<br />
ö<br />
Irl-<br />
x<br />
-4 E<br />
-i a<br />
u2<br />
8<br />
7<br />
6<br />
1<br />
0 0 10 20 30 40<br />
Time from release (hours)<br />
The figure shows viable cell numbers determined for synchronised<br />
hybridoma cultures at pH 6.6 (0). pH 7.2 (0) and pH 7.8 (Q). The cells<br />
were cultured in RPMI 1640 with 10% newborn calf serum, 5mM NaHCO3<br />
and 20mM HEPES. The pH was, adjusted to the above values by the<br />
addition of NaOH or HCI.<br />
202
The data generated from cell synchronisation experiments on<br />
the 321 hybridoma suggested <strong>that</strong> the rate of production of<br />
immunoglobulin was not constant throughout all phases of the cell<br />
cycle. In particular there was a marked and reproducible drop in the<br />
antibody accumulation rate during mitosis with evidence of a second<br />
decrease in the S phase.<br />
Depression of protein synthesis during mitosis has been described<br />
in many mammalian cells (eg. Prescott and Bender, 1962; Scharff and<br />
Robbins, 1966; Lloyd et al., 1976). This may be due in part to the well<br />
documented stop of RNA synthesis at mitosis (Feindengen et al., 1960;<br />
Terasima and Tolmach, 1963; Schiff, 1965) but some cell lines have<br />
been shown to continue protein synthesis during mitosis (Konrad,<br />
1963). Evidence has been produced to suggest <strong>that</strong> where a decrease<br />
in protein synthesis occurs it is due to inhibition of the translation<br />
of mRNAs which persist in the cytoplasm during mitosis (Fan and<br />
Penman, 1970).<br />
In this <strong>Investigation</strong> total protein synthesis was assessed by<br />
the Incorporation of 35 S-methionine <strong>Into</strong> TCA precipitable protein.<br />
On release from the thymidine blockade there was an Initial increase<br />
in the incorporation of the radiolabel until mitosis at which point<br />
there was a 35% decrease. The rate of 35 S-methlonlne Incorporation did<br />
not recover after mitosis but continued at the lower level. It was<br />
therefore difficult to determine whether there was a decrease in the<br />
rate of protein synthesis during mitosis.<br />
The incorporation of 3a S-methionine into Immunoglobulin<br />
light chains however, showed a decrease during mitosis with a<br />
203
subsequent increase in the following Gi phase. This is in agreement<br />
with the observations of several authors who noted <strong>that</strong> the<br />
production of antibody was lowest during mitosis (Takahashi et al.<br />
1969; Buell and Fahey, 1969; Lerner and Hodge, 1970; Libertl and<br />
Baglioni, 1973; Turner et al., 1985). Several of these workers also<br />
showed <strong>that</strong> peak rates of antibody production in late Gi and during S<br />
phase were followed by a gradual decrease during G2 and mitosis: in<br />
both human lymphoblastoid cells (Buell and Fahey, 1969; Takahashi et<br />
al., 1969; Turner et al., 1985) and, mouse myeloma cells (Byars and<br />
Kidson, 1970; Garatun-Tjeldsto et al., 1976).<br />
However, in contrast to the patterns described above, the<br />
antibody accumulation rate In the synchronised hybridoma remained<br />
high during the latter half of the cell cycle. In one experiment two<br />
peaks in the rate of antibody accumulation could be resolved. These<br />
peaks corresponded to the estimated positions of the Gi and G2 phases<br />
with an apparent decrease in the antibody production rate during S<br />
phase. This is consistent with - the patterns of immunoglobulin<br />
production which have been observed in human myelomas by Killander<br />
et al. (1977) and in human lymphoblastold cells by Watanabe et al<br />
(1973). These authors found high production rates in Gi, decreased<br />
production rates during S phase and a later recovery in G2.<br />
Many experiments in this investigation did not show this decrease<br />
in antibody production rate during S-phase although there was an<br />
abrubt increase -corresponding to the G2 phase. However in the<br />
radiolabelling experiment, there was an apparent reduction in the<br />
incorporation of 3° S-methionine into antibody light chains coinciding<br />
with the peak rate of 3H-thymidine incorporation into DNA. This<br />
204
suggests <strong>that</strong> there was a reduction in antibody production during the<br />
S phase which may have been obscured in some experiments by a<br />
lower degree of cell synchrony. However the reduction in the rate of<br />
antibody synthesis during S phase must be either partial or confined to<br />
a small portion of the S phase. If antibody production stopped completely<br />
for the duration of the S phase (40% of the cell cycle) the change In the<br />
rate of antibody accumulation might be expected to be greater than<br />
observed in this <strong>Investigation</strong>.<br />
The Increased rate of immunoglobulin synthesis seen In G2 In many<br />
experiments may be a reflection of increases in cell size and protein<br />
content due to cell growth. The dry weight of 'a cell increases<br />
continuously during the cell cycle and pulse labelling<br />
with amino acids shows an increasing rate of incorporation<br />
(Zetterberg and Killander, 1965). The rate of RNA synthesis also<br />
doubles between mitoses (Scharff and Robbins, 1966; Enger and Tobey.<br />
1969; Lloyd et al., 1982). This suggests <strong>that</strong> the specific rate of<br />
protein synthesis per cell increases and may account for the higher rate<br />
of antibody accumulation during the G2 phase. The incorporation of<br />
35S-methionine did show an initial increase in the rate of uptake on<br />
progression from S to M in the first cycle but this was not repeated in<br />
the second cycle. This may have been due to nutrient depletion causing<br />
a slowing of protein synthesis.<br />
The abrupt increase in antibody accumulation rate which was<br />
frequently observed immediately after the S phase might also be<br />
explained by a gene dosage effect. Several authors have noted <strong>that</strong> the<br />
rate of RNA synthesis doubles during S phase and this has been ascribed<br />
to a doubling of the gene complement after DNA replication which leads<br />
205
to Increased rates of transcription (Zetterberg and Killander, 1966;<br />
Stambrook and Sisken, 1972). Further investigation would be required<br />
to confirm this hypothesis, such as the measurement of heavy or light<br />
chain immunoglobulin messenger RNAs by suitable cDNA probes to<br />
show whether there is increased transcription of immunoglobulin genes<br />
following DNA duplication. The same approach might equally be<br />
applied to all phases of the cell cycle to investigate whether the<br />
levels of immunoglobulin mRNA reflect the pattern of<br />
immunoglobulin synthesis during the cell cycle.<br />
The validity of data generated from synchronisation<br />
experiments has been questioned by a number of authors<br />
(Mitchison, 1971; Cowan and Milstein, 1973, John et al., 1981; Lloyd,<br />
1986) due to the techniques used to obtain synchronised cells. In<br />
particular methods of Induction synchrony require the maintenance of<br />
cells in restrictive conditions often for long periods of time. It Is<br />
known <strong>that</strong> many of the inhibitors of DNA synthesis, including<br />
thymidine (Xeros, 1962), allow continued RNA and protein synthesis<br />
and it has been suggested <strong>that</strong> blocking with inhibitors of DNA<br />
synthesis only synchronises those events which depend on or are<br />
coupled to DNA synthesis (Mueller, 1969) whilst protein and RNA<br />
synthesis remain asynchronous. This suggests <strong>that</strong> cell growth and DNA<br />
synthesis can be uncoupled from one another as first proposed by<br />
Mitchison (1971) however there is a considerable amount of evidence<br />
which suggests <strong>that</strong> the intiation of DNA synthesis is dependent<br />
ultimately on an event linked to cell size (Shields et al., 1978, Nurse and<br />
Fantes. 1981).<br />
With due regard to reservations concerning cell<br />
synchronisation methods the data presented In this investigation<br />
206
indicate <strong>that</strong> antibody production rate is not constant throughout the<br />
cell cycle. However further work is required in order to confirm <strong>that</strong> the<br />
variations observed are not a result disturbances in cell metabolism due<br />
to the synchronisation method. Methods of synchronising cells which do<br />
not rely on perturbation of cell metabolism (e. g. density gradient<br />
separation) will provide a more accurate impression of antibody<br />
production patterns during the cell cycle. In an attempt to overcome<br />
perturbations introduced by cell synchronisation techniques, Altshuler<br />
et al.. 1986 examined the immunoglobulin content of an asynchronous<br />
population of hybridomas by flow cytometry. They observed two peaks<br />
in the intracellular concentration distribution of immunoglobulin which<br />
might suggest a cell cycle dependence for antibody synthesis. However<br />
they also showed with dual staining techniques for DNA and antibody<br />
content <strong>that</strong> both antibody peaks appeared to be present throughout<br />
the cell cycle and concluded <strong>that</strong> there was no simple on/off<br />
dependence of immunoglobulin production on cell cycle. However flow<br />
cytometry only measures the amount of antibody associated with a cell<br />
at a particular point in time and does not provide Information on the<br />
rate of antibody production. Thus their investigation may only have<br />
demonstrated the existence of two populations of hybridoma cells.<br />
It has not been ascertained' in this <strong>Investigation</strong> whether<br />
variations in the rate of antibody production were due a temporal<br />
regulation of antibody synthesis during the cell cycle or were a<br />
reflection of the changing demands for macromolecular synthesis during<br />
certain phases of the cell cycle. For example many enzymes involved in<br />
DNA synthesis increase in activity during S phase (Kit, 1976; Nakamura<br />
et al., 1984; Eriksson et al., 1984; Denhardt et al., 1986) and histone<br />
synthesis may account for 10% of total protein synthesis during this<br />
207
period (Denhardt et al., 1986). This could account for a decrease in the<br />
rate of immunoglobulin synthesis during S phase.<br />
Variations in the rate of uptake of nutients during the cell cycle<br />
could also account for variations in the rate of antibody synthesis.<br />
Increased rates of amino acid uptake have been described during Gt' in<br />
human lymphocytes (Glassy and Furlong, 1981) and during mitosis in<br />
HeLa cells (Macmillan and Wheatley, 1981). Further studies on the rates<br />
of nutrient uptake, energy balance and metabolite pools during the<br />
hybridoma cell cycle may clarify the relationship between cell growth<br />
and monoclonal antibody production. Studies on the relative rates of<br />
immunoglobulin gene transcription and translation would be necessary<br />
to reveal whether antibody synthesis was regulated at the gene level or<br />
at a later stage.<br />
The other aim of this <strong>Investigation</strong> was to determine whether<br />
changes in cell growth rate were attributable to changes in the length<br />
of the Gi phase. It was found <strong>that</strong> conditions of adverse pH which have<br />
been shown to reduce the growth rate of the 321 hybridoma had little<br />
affect on the time taken to traverse the cell cycle when started from a<br />
point after the Gi phase but significantly lengthen the time taken<br />
to complete the cell cycle when the Gi phase Is present. This Implies<br />
<strong>that</strong> the Gi phase is more sensitive to the physiological environment<br />
which is in accord with the proposed restriction point of Pardee (1974)<br />
who showed <strong>that</strong> several different blocking conditions (low serum,<br />
amino acid starvation, elevated intracellular AMP and density<br />
dependent Inhibition) arrested cells at the same point In G1.<br />
These findings are consistent with the idea <strong>that</strong> changes in cell<br />
growth rate are due to variations in the length of the Gi phase and <strong>that</strong><br />
208
the proportions of cells in different phases of the cell cycle must<br />
therefore change with growth rate. This has been demonstrated In yeast<br />
cells growing in chemostat culture where the proportion of cells in the<br />
Gi phase was found to increase at low growth rates (Sheper et al.. 1987).<br />
This implies <strong>that</strong> the rate of synthesis of proteins which are linked to<br />
particular phases of the cell cycle, will also change with growth rate. It<br />
was not possible to make accurate estimates of the magnitude or<br />
duration of the changes in antibody production rate observed during the<br />
cell cycle of the 321 hybridoma due to imperfect synchrony and therefore<br />
any models of antibody production kinetics based on such data would be<br />
tentative. However it does illustrate <strong>that</strong> environmental parameters<br />
which affect cell growth rate may have profound effects on the<br />
distribution of cells in the cell cycle which in turn may affect the<br />
relative rate of production of any cell cycle associated proteins. The<br />
relatively high rate of antibody production in Gi would be consistent<br />
with the observation <strong>that</strong> Gi arrested cells or more slowly growing cells<br />
exhibit higher rates of antibody production.<br />
6.5 Conclusions.<br />
The purpose of this investigation was to determine,<br />
1) whether immunoglobulin synthesis was associated with the G1 phase<br />
of the cell cycle as shown in other Immunoglobulin synthesising cell<br />
lines and,<br />
11) if cell cycle regulated immunoglobulin synthesis could account for<br />
the increased rate of immunoglobulin synthesis observed at low growth<br />
209
ates due to changes in the distribution of cells in the various phases<br />
of the cell cycle.<br />
In an attempt to answer these questions the 321 hybridoma was<br />
synchronised by the double thymidine block technique. Using this<br />
technique It has been found <strong>that</strong> whilst there is evidence of variation<br />
in the rate of immunoglobulin synthesis at different phases of the cell<br />
cycle. immunoglobulin synthesis did not appear to be restricted to the<br />
Gi phase. <strong>An</strong>tibody production was observed during the Gz phase but<br />
may be produced at a lower rate during the S phase than during the Gi<br />
or Gz phases. There was a reproducible drop in the rate of antibody<br />
production during the M phase which may be due to a general reduction<br />
in the rate of protein synthesis during this phase although this has not<br />
been conclusively demonstrated in this investigation.<br />
The consequences of such variation on monoclonal antibody<br />
production kinetics have not been ascertained unequivocally but it has<br />
been found <strong>that</strong> conditions which are detrimental to cell growth such as<br />
low or high pH Increase the length of the cell cycle in a manner which<br />
suggests <strong>that</strong> this was due to an increase in the length of the Gi phase.<br />
This in turn suggests <strong>that</strong> the cell cycle distribution changes with<br />
growth rate and <strong>that</strong> the relative rate of production of cell cycle<br />
associated proteins may change accordingly. This is therefore a possible<br />
mechanism which could explain the effects of certain environmental<br />
parameters such as pH. oxygen or serum concentration on antibody<br />
production by hybridomas.<br />
210
7.1 Summary.<br />
Chapter 7<br />
Summary and Recommendations<br />
A survey of the literature has shown <strong>that</strong> the kinetics of antibody<br />
production by hybridomas varies greatly between different cell lines.<br />
Many hybridomas show continued antibody production during both the<br />
growth and decline phases of a batch culture and are characteristically<br />
high producers (see for example Birch et al., 1987, Reuveny et al..<br />
1986a) while others show declining rates of antibody production during<br />
the growth phase and are characteristically<br />
low producers (Merten et al.,<br />
1987). While many of these differences may be due to the characteristics<br />
of the myeloma and B-cell parent cells and any genetic recombination<br />
following cell fusion (Westerwoudt, 1986), some generalisations can be<br />
made. For example it has been found <strong>that</strong> restriction of the rate of cell<br />
proliferation by nutrient limitation or by other suboptimal physiological<br />
conditions, often enhances the specific rate of antibody production by<br />
hybridoma cells. This suggests <strong>that</strong> there is an underlying relationship<br />
between cell growth and antibody production in hybridomas but the<br />
mechanisms of such a relationship have yet to be elucidated. The<br />
purpose of this investigation was therefore to examine the effects of the<br />
culture environment on cell proliferation, cell metabolism and antibody<br />
production in an attempt to determine the relationship between<br />
hybridoma growth and antibody production.<br />
It was considered <strong>that</strong> the relationship between antibody<br />
production and cell growth could best be evaluated by the use of an on-<br />
line assay to monitor continuously product formation under a variety of<br />
211
experimental conditions. In chapter 3, the development and evaluation<br />
of an automated on-line ELISA system for the determination of antibody<br />
concentrations in bioreactors was described. The assay employed a<br />
packed bed of Sepharose covalently linked to anti-mouse IgG and all<br />
the reaction and washing steps of the ELISA were effected by passing<br />
the reagents through the packed bed. It was demonstrated <strong>that</strong> such a<br />
system could produce accurate and reproducible data. However the<br />
application of the system to the monitoring of product formation in<br />
bloreactors was limited by the compression of the Sepharose bed after<br />
several assay cycles which reduced the accuracy of the assay. Further<br />
difficulties were experienced in producing a cell-free sample stream for<br />
the assay while maintaining the sterility of the reactor. The<br />
recirculation of cells and medium through a cross-flow filter device was<br />
found to be detrimental to cell growth.<br />
In chapter 4 the growth and antibody production kinetics for the<br />
321 hybridoma were examined. The 321 hybridoma was found to produce<br />
large amounts of antibody with titres of 120-200pg/ml achieved in batch<br />
culture and in common with other highly productive hybridomas, the<br />
production of antibody continued during the decline phase. Furthermore<br />
the specific rate of antibody production was higher during the decline<br />
phase and approximately 60% of the total antibody yield was produced<br />
during this phase. Glutamine was exhausted by the end of the growth<br />
phase suggesting <strong>that</strong> glutamine may not be necessary for the continued<br />
production of antibody. One possible explanation for the increased<br />
antibody production rate after glutamine depletion was <strong>that</strong> glutamine<br />
or products of glutamine metabolism may have been Inhibiting or<br />
repressing antibody synthesis. However while lower giutamine<br />
concentrations led to decreased cell numbers illustrating the importance<br />
212
of glutamine for hybridoma growth (figure 4.3), an inhibitory effect of<br />
glutamine on antibody production was not apparent. Indeed, there was<br />
some evidence to suggest <strong>that</strong> antibody production was depressed at low<br />
glutamine concentrations. The continued production of antibody after<br />
the exhaustion of glutamine in batch cultures might be explained by the<br />
accumulation of amino acid pools during growth (Seaver et al., 1984,<br />
Merten et al.. 1986). These pools may be subsequently utilised for<br />
protein synthesis after depletion of exogenous amino acids such as<br />
glutamine (see for example Stoner and Merchant, 1972).<br />
There are several reports in the literature concerning the effect of<br />
serum on the production of antibody by lymphoblastold cell lines (as<br />
recently reviewed by Glassy et al.. 1988) and it has been observed<br />
frequently <strong>that</strong> antibody production rates are enhanced in serum-free<br />
or serum-depleted media. This has been interpreted by some to suggest<br />
<strong>that</strong> serum contains factors which are inhibitory to antibody production.<br />
In this <strong>Investigation</strong> it was found <strong>that</strong> the reduction of serum<br />
concentration retarded cell growth (figure 4.6a) and <strong>that</strong> the specific<br />
antibody production rate was enhanced at low serum concentrations<br />
which was in agreement with previous reports. However when cell<br />
proliferation was arrested by the inhibition of DNA synthesis with<br />
excess thymidine, the trend was reversed and the highest antibody<br />
production rates were observed at the highest serum concentration<br />
(figure 4.13). This suggested <strong>that</strong> the effect of serum on antibody<br />
production was not due to direct inhibition of antibody synthesis but<br />
was an indirect effect due to the effect of serum on cell growth. Glassy<br />
and colleagues have noted <strong>that</strong> cell growth rates in serum free media are<br />
generally lower than in serum containing media suggesting <strong>that</strong> low<br />
growth rates are more favourable for antibody production. The data from<br />
213
this investigation is consistent with such a hypothesis.<br />
The optimal pH for growth of the 321 hybridoma was found to be 7.2<br />
which is within the expected range of 6.9-7.4 reported for hybridomas<br />
(Harbour et al.. 1988). However optimal antibody production rates were<br />
found to be at pH 6.8. a phenomenon also reported by Miller et al.<br />
(1988a) suggesting <strong>that</strong> conditions optimal for cell growth are not<br />
necessarily optimal for antibody production. This effect has also been<br />
noted for oxygen concentration where the optimal oxygen concentration<br />
for antibody production was suboptimal for cell growth (Mizrahi et a).,<br />
1972; Reuveny et al.. 1986a; Phillips et al., 1987). In this investigation<br />
further evidence was provided which suggests <strong>that</strong> the effects of these<br />
physiological parameters are indirectly linked to antibody production<br />
through their effects on the cell growth rate. For example, when cell<br />
proliferation was arrested with excess thymidine, the optimal pH for<br />
antibody production was pH 7.2 rather than 6.8 indicating <strong>that</strong> in the<br />
absence of cell growth the most favourable pH for cell proliferation was<br />
also optimal for antibody production. Furthermore It was shown <strong>that</strong><br />
preventing cell proliferation by the inhibition of DNA synthesis led to<br />
an increase in the specific antibody production rate (section 4.3.6).<br />
Recently this has been further Illustrated by the observation <strong>that</strong> cyclic<br />
nucleotides which Inhibit hybridoma proliferation increase the specific<br />
rate of antibody production (Dalill and Ollis, 1988).<br />
Taken together, these observations Imply <strong>that</strong> low cell growth<br />
rates are favourable for antibody production and <strong>that</strong> those parameters<br />
which affect cell growth rate also affect the rate of antibody production.<br />
Several reports in the literature are consistent with this hypothesis. For<br />
example in high cell density perfusion culture systems where cell growth<br />
is restricted by nutrient supply, higher specific antibody production<br />
214
ates have been observed (Van Wezel et al., 1985; Reuveny et al., 1986b)<br />
and higher antibody production rates have been associated with low<br />
growth rates in both glucose-limited and oxygen-limited chemostat<br />
cultures (Birch et al., 1985; Miller et al., 1988).<br />
In chapter 5a glutamine-limited chemostat culture of the 321<br />
hybridoma was studied in an attempt to determine the effects of cell<br />
growth rate on antibody production and cell metabolism. In common with<br />
the reports cited above it was found <strong>that</strong> antibody production rates were<br />
higher at low growth rates (table 5.3) and antibody yields from )<br />
glutamine were also considerably higher at low growth rates. Three ý<br />
possible explanations for this behaviour were put forward.<br />
1) The metabolic costs of cell growth are high and there is greater<br />
competition for the energy and metabolite pools available for<br />
biosynthesis at high growth rates. These increased demands might be<br />
expected to be reflected by changes in cell metabolism and indeed<br />
studies on the steady state metabolism of the 321 hybridoma in<br />
chemostat culture showed <strong>that</strong> the fate of glutamine and glucose<br />
changed markedly with growth rate. High growth rates were accompanied<br />
by an increased rate of glucose uptake with an increased conversion of<br />
glucose to lactate. This is in agreement with the observations of Hu<br />
et al., 1987 and Luan et al. (1987b) who noted <strong>that</strong> there was an<br />
apparent relationship between growth rate and the yield of lactate from<br />
glucose in batch cultures of hybridomas. This increased flux through<br />
glycolysis may be a reflection of an increased demand for glycolytic<br />
intermediates in rapidly growing cells as suggested by Hume et al.<br />
(1977). Alternatively Lazo (1981) has suggested <strong>that</strong> many cells may<br />
derive much of their energy requirements from aerobic glycolysis and the<br />
215
increased lactate yield at high growth rates may be, evidence of<br />
increased energy requirements especially as the alternative energy<br />
source (glutamine) was limiting in these cultures.<br />
The incorporation of glutamine nitrogen into cell biomass was also<br />
more efficient at high growth rates as illustrated by lower ammonia<br />
yields and was further evidence for an increasing demand for metabolic<br />
Intermediates.<br />
2) Products of cell metabolism are inhibiting or repressing antibody<br />
synthesis possibly due to feedback regulation of biosynthetic pathways.<br />
Whether this is the case for the 321 hybridoma has not been ascertained<br />
as only s limited number of metabolites were monitored at steady state.<br />
However there was no evidence <strong>that</strong> glutamine was inhibitory to<br />
antibody production from the batch culture experiments (chapter 4). The<br />
metabolic quotient for ammonia did not change at the higher growth<br />
rates (Table 5.3) and was therefore unlikely to be responsible for the<br />
reduced antibody production rate. The increased metabolic quotients for<br />
glucose and lactate at high growth rates suggest <strong>that</strong> repression of<br />
antibody synthesis by glucose or products of glucose catabolism might<br />
occur as suggested by Glacken et al. (1986). However several workers<br />
have examined the effect of glucose and lactate on antibody production<br />
by hybridomas and have found no evidence of any such repression (Low<br />
and Harbour, 1985; Tharakan and Chau, 1986; Reuveny 'et al.. 1986a;<br />
Miller et al., 1989a).<br />
3) <strong>An</strong>tibody production is cell cycle related and changes in the cell<br />
population distribution at different growth rates may account for the<br />
changes in antibody production rate. The possibility <strong>that</strong> antibody<br />
216<br />
S'a
production might be restricted to certain phases of the cell cycle was<br />
investigated in chapter 6. In this chapter it was shown <strong>that</strong> the rate<br />
of production of antibody by a synchronised culture of the 321<br />
hybridoma varied during the cell cycle. <strong>An</strong>tibody production did not<br />
appear to be restricted to the G1 phase of the cell cycle as reported for<br />
other lymphoblastold cell lines (Buell and Fahey. 1969; Takahashi et al..<br />
1969; Byars and Kidson. 1970; Garatun-Tjeldsto et a!., 1976; Turner et<br />
a!.. 1985) but continued during the G2 phase. There was a reproducible<br />
decline in the rate of antibody synthesis observed at mitosis (figures 6.2<br />
and 6.3) with some evidence of a further decline during the S phase<br />
although this was variable. It was also shown <strong>that</strong> pH conditions which<br />
were sub-optimal for cell growth, increased the length of the cell cycle<br />
(figure 6.6) in a manner which was consistent with the Idea <strong>that</strong> the GI<br />
phase contributes much of the variability to cell cycle times (Pardee,<br />
1978; Scheper et a!., 1988). The observation <strong>that</strong> the rate of antibody<br />
production may be depressed during the S and M phases when coupled<br />
with the observation <strong>that</strong> the proportion of cells in these phases is<br />
increased in rapidly growing cells (Schliermann et al., 1987) suggests<br />
<strong>that</strong> cell cycle related antibody expression cannot be discounted as a<br />
possible mechanism for the growth related effects observed in this and<br />
other studies on immunoglobulin production by hybridomas.<br />
In conclusion it has been found <strong>that</strong> physiological conditions which<br />
restrict the growth of hybridomas generally enhance the rate of<br />
antibody synthesis. The precise relationship between growth rate and<br />
antibody production rate has not been elucidated but may be a reflection<br />
of the changes in cell metabolism at low growth rates which favour<br />
antibody synthesis. The optimisation of antibody production in large<br />
217
scale bloreactors might therefore be achieved by designing the process<br />
to maintain the cells at the most favourable metabolic state for antibody<br />
production. This might be achieved by the controlled feeding of a<br />
limiting nutient either in a batch or, continuous flow system. The<br />
controlled feeding of nutrients also increases the efficiency of the<br />
process as demonstrated by increased yields of both cells and antibody<br />
in chemostat culture and reduces the accumulation of waste metabolites<br />
such as ammonia and lactate which may be inhibitory.<br />
7.2 Recommendations.<br />
Much of the evidence presented in this invetigation strongly rý<br />
suggests <strong>that</strong> factors which influence the growth rate of the 321<br />
hybridoma also affect the rate of antibody, production although the<br />
explicit mechanisms behind this relationship have not been elucidated.<br />
Future studies would therefore be centred around the definition of this<br />
relationship and a number of approaches might be considered.<br />
1) Studies on the steady state metabolism of hybridomas in chemostat<br />
culture<br />
It has been hypothesised above <strong>that</strong> the increased rate of antibody<br />
production at low growth rates is due to a more favourable metabolic<br />
state for antibody production. At steady state the effects of specific<br />
metabolites on cell metabolism and antibody production could be<br />
monitored independently of growth rate. ' Changes in the steady<br />
state concentrations of nutrients such as glucose, glutamine or other<br />
amino acids should affect the relative flux through different metabolic<br />
pathways as suggested by several studies on cell metabolism (Reitzer et<br />
218
al.. 1979). Changes in the metabolic balance could be identified by<br />
monitoring the products of metabolism such as lactate. ammonia,<br />
alanine, pyruvate and ATP and by changes in oxygen uptake. For<br />
example Glacken et al. (1986) have suggested <strong>that</strong> the relative yields<br />
of ATP from glycolysis or oxidative metabolism can be calculated by the<br />
yield of lactate from glucose and by oxygen uptake rates. Miller and<br />
colleagues have recently reported on the results of step and pulse<br />
changes of glucose, Blutamine, lactate and ammonia in steady state<br />
cultures of hybridomas and have shown <strong>that</strong> such an approach provides<br />
an insight into the regulation of cell metabolic pathways (Miller et al.,<br />
1988aß 1988b, 1989). The effects of these changes on antibody<br />
production was not assessed by these authors but such an approach<br />
should prove invaluable in determining the effect of the metabolic state<br />
of the cell on antibody production. The effects of possible inhibitory<br />
metabolites such as lactate and ammonia could also be assessed<br />
independently of any effects on cell growth using the chemostat.<br />
2) Studies to identify the level at which antibody production is<br />
regulated.<br />
The possibility of cell cycle regulated expression of immunoglobulin<br />
genes in hybridoma cells has not been ruled out (see Chapter 6).<br />
Furthermore it has been shown <strong>that</strong> immunoglobulin mRNA may be more<br />
efficiently translated under nutrient starvation (Sonenshein and<br />
Brawerman, 1976) suggesting <strong>that</strong> post-transcriptional control of<br />
antibody synthesis may occur. Monitoring of the relative rates of gene<br />
transcription and translation should reveal whether immunoglobulin<br />
synthesis is regulated at the gene level or at a later stage by nutrient<br />
or energy limitation. Gene transcription could be monitored by measuring<br />
219
immunoglobulin messenger RNA levels by suitable cDNA probes and<br />
translation by the rate of incorporation of radiolabelled amino acids into<br />
antibody. The possibility of nutrient or catabolite repression of<br />
immunoglobulin genes could also be investigated by monitoring the<br />
relative rates of gene transcription in the presence of high and low<br />
concentrations of metabolites such as glucose or lactate..<br />
3) Studies on the hybridoma cell cycle.<br />
It has not been ascertained whether the variation in antibody<br />
production rate observed in synchronised cultures of the 321 hybridoma<br />
was due to a genuine cell cycle regulation of antibody synthesis or due<br />
to perturbations caused by the synchronisation method. Studies on the<br />
cell cycle of hybridomas by flow cytometry using double labelling<br />
techniques for DNA and antibody content as described by Altshuler et<br />
al., 1987 may provide evidence of cell cycle related immunoglobulin<br />
expression. However such a technique will not provide information on<br />
the relative rates of synthesis or secretion. It would thus be necessary<br />
to study cell populations at particular, phases of the cell cycle with the<br />
minimum perturbation of cell metabolism. This could perhaps best be<br />
achieved by the use of density gradient centrifugation (Mitchell and<br />
Tupper, 1977) or by fluorescence activated cell sorting. Cell populations<br />
thus selected could be analysed using the molecular techniques<br />
described above.<br />
220
References.<br />
Aasen, P. and Listowsky, I. (1980) Iron transport and storage proteins.<br />
<strong>An</strong>n. Rev. Biochem. 49,357-393.<br />
Alberts, A. W., Ferguson, K., Hennessy. S., and Vagelos, P. R. (1974)<br />
Regulation of lipid synthesis in cultured animal cells.<br />
J. Biol. Chem. 249,5241-5249.<br />
Altshuler, G. L., Dilworth, R., Sowek, J. and Belfort, G. (1986)<br />
Hybridoma analysis at the cellular level.<br />
Blotechnol. Bioeng. Symp. 17,725-736.<br />
Altshuler, G. L., Dziewulski, D. M., Sowek, J. A. and Belfort, G. (1986)<br />
Continuous hybridoma growth and monoclonal antibody production In<br />
hollow fibre reactors-separators.<br />
Biotechnol. Bioeng. 28,646-658.<br />
<strong>An</strong>son, D. S., Austen, D. E. G. and Brownlee, G. G. (1986) Expression of<br />
active human clotting Factor IX from recombinant DNA clones In<br />
mammalian cells.<br />
Nature 315,683-685.<br />
Ardawi, M. S. M. and Newsholme, E. A. (1982a) Glutamine metabolism In<br />
the lymphocytes of the rat.<br />
Biochem J. 212,835-842.<br />
Ardawi, M. S. M. and Newsholme, E. A. (1982b) Maximum activities of<br />
some enzymes of glycolysis, the TCA, and ketone body and glutamine<br />
utilization pathways in lymphocytes of the rat.<br />
Blochem. J. 208, "143-748.<br />
Arnold, J. (1887) Ueber theilunsvoigange an der wanderzellen ihre<br />
progressiven und regressiven metamorphosen.<br />
Arch. Mikrosk. <strong>An</strong>t. 30,205-310.<br />
Artishevsky, A., Delegeane, A. M. and Lee, A. S. (1984) Use of a cell cycle<br />
mutant to delineate the critical period for the control of histone mRNA<br />
levels in the mammalian cell cycle.<br />
Mol. Cell. Biol. 4,2364-2369.<br />
Bailey, J . E., Agar, D. W. and Hjortso, M. A. (1982) In Computer<br />
Applications in: Fermentation Technology, Society of Chemical Industry,<br />
London p. 167.<br />
Baker, P., Knoblock, K., Noll, L., Wyatt, D. and Lydersen, B. (1984) A<br />
serum independent medium effective in all aspects of hybridoma<br />
technology and immunological applications.<br />
Develop. biol. Standard. 60,63-72.<br />
Ballou, C. E. (1982) The yeast cell wall and cell surface In: The Molecular<br />
Biology of the yeast Saccharomyces vol 2. Metabolism and gene<br />
expression (Strathern, J., ed. ) Cold Spring Harbour Laboratory. pp. 63-<br />
92.<br />
221
Barnes, D. and Sato, G. (1980) Methods for growth of cultured cells in<br />
serum-free medium.<br />
<strong>An</strong>al. Biochem. 102,255-270.<br />
Barseghian, G., Papoian, T., Hwang, D. L., Roitman, A., and Let-Ran, A.<br />
(1984). Ethanolamine mimics insulin effects in vitro.<br />
Biochem. Biophys. Res. Commun. 121,413-421.<br />
Barton, M. E. (1971) Effect of pH on the growth cycle of HeLa cells in<br />
culture without oxygen control.<br />
Biotechnol. Bioeng. 13,471-492.<br />
. Bast, R. C. Jr., Ritz, J., Lipton, J. M., Feeney, M., Sallan, S. E.. Nathan, D.<br />
G. and Schlossman, S. F. (1983) Elimination of leukemic cells from human<br />
bone marrow using monoclonal antibody and complement.<br />
Cancer Res. 43,1389-1394.<br />
Bebbington, C. and Hentschel, C. (1985) The expression of recombinant<br />
DNA products In mammalian cells.<br />
Trends in Biotechnology 3,314-317.<br />
Bell, E., Sher, S., Hull, B., Merrill, C., Rosen, S., Chanson, A., Asselinean,<br />
D., Dubertret, L., Ceulomb, B. C., Lapiere, C., Nusgens, B. and Nevenx, Y.<br />
(1983) The reconstitution of living skin.<br />
J. Investigative Dermatol. 81,25-105.<br />
Berman, P. W., Gregory, T., Crase, D. and Laskey, L. (1985) Protection from<br />
genetic herpes simplex virus type 2 injection by vaccination with cloned<br />
type 1 glycoprotein D.<br />
Science 227,1490-1492.<br />
Berman, P. W. and Lasky, L. A. (1985) Engineering glycoproteins for use<br />
as pharmaceuticals. Trends in Biotechnology 3,51-63.<br />
Birch, J. R. and Hopkins, D. W. (1977) The serine and glycine<br />
requirements of cultured human lymphocyte lines In: Cell culture and Its<br />
Application (Acton, R. T. and Lynn, J. T., eds. ), Academic Press, New<br />
York. pp. 503-511.<br />
Birch, J. R. and Edwards, D. J. (1980) The effect of pH on the<br />
growth and metabolism of a lymphoblastoid cell line.<br />
Develop. biol. Standard. 46,69-63.<br />
Birch, J. R., Boraston, R. and Wood, L. (1985a) Bulk production of<br />
monoclonal antibodies in fermenters.<br />
Trends in Biotechnology 3,162-166.<br />
Birch, J. R., Thompson. P. W. Lambert, K. and Boraston, R. (1986b)<br />
The large scale cultivation of hybridoma cells producing monoclonal<br />
antibodies In: Large-Scale Mammalian Cell Culture (Feder, J. and<br />
Tolbert, W. R., eds. ) Academic Press, pp. 1-18.<br />
Birch, J. R., Thompson, P. W., Boraston, R., Oliver, S. and Lambert, K.<br />
(1987) The large scale production of monoclonal antibodies in airlift<br />
222
fermenters in: Plant and <strong>An</strong>imal Cells : Process Possibilities (Webb, C.<br />
and Mavituna, F., eds. ) Ellis Horwood Ltd., Chichester, pp. 162-171.<br />
Bishop, J. M. (1983) Cellular oncogenes and retroviruses.<br />
<strong>An</strong>n. Rev. Blochem. 52,301-354.<br />
Bodeker, B. G. D., Hubner, G. E., Hewlett, G. and Schlumberger,<br />
H. D. (1987) Production of human monoclonal antibodies from immobilised<br />
cells in the Opticell culture system.<br />
Develop. biol. Standard. 66,473-479.<br />
Boraston, R., Thompson, P. W., Garland, S. and Birch, J. R. (1984) Growth<br />
and oxygen requirements of antibody producing mouse hybridoma cells<br />
in suspension culture. Develop. biol. Standard. 55,103-111.<br />
Borrebaeck, C. A. K. (1986) In vitro immunization for production<br />
of murine and human monoclonal antibodies: present status.<br />
Trends in Biotechnology 4,147-153.<br />
Borst, P. (1962) The pathway of glutamate oxidation by<br />
mitochondria Isolated from different tissues.<br />
Blochim. Blophys. Acta 67,256-269.<br />
Boullanne, G. L., Hozumi, N. and Shulman, M. J. (1984) Production of<br />
functional chimaeric mouse/human antibody.<br />
Nature 312,643-646.<br />
Bradford, M. M. (1976) A rapid sensitive method for the quantitation of<br />
microgram quantities of protein utilising the principle of protein-dye<br />
binding.<br />
<strong>An</strong>al. Biochem. 72,248-254.<br />
Bravo, R. and Cells, J. E. (1980) A search for differential poly peptide<br />
synthesis throughout the cell cycle of HeLa cells.<br />
J. Cell Biol. 84,795-802.<br />
Bree, M. A., Dhurjati, P., Geoghegan. R. F. and Robnett, B. (1988)<br />
Kinetic modelling of hybridoma cell growth and Immunoglobulin<br />
production in large scale suspension culture.<br />
Biotechnol. Bioeng. 32,1067-1072.<br />
Brooks, R. F. (1975) The kinetics of serum-induced initiation of<br />
DNA synthesis in BHK 21/c13 cells and the influence of exogeneous<br />
adenosine.<br />
J. Cell. Physiol. 86,369-378.<br />
Brosemer, R. W. and Rutter, W. J. (1961) The effect of oxygen<br />
tension on the growth and metabolism of a mammalian cell.<br />
Exp. Cell Research 25,101-113.<br />
Buchegger, F., Haskell, C. H., Schereyer, M., Scazziga, B. R.,<br />
Randin, S., Carrel, S. and Mach, J. P. (1983) Radiolabelled fragments of<br />
223
monoclonal antibodies against carcinoembryonic antigen for localization<br />
of human colon carcinoma grafted <strong>Into</strong> nude mice.<br />
J. Exp. Med. 158,413-427.<br />
Buell. D. N. and Fahey, J. L. (1969) Limited periods of gene expression in<br />
Immunoglobulin-synthesizing cells.<br />
Science 164,1624-1525.<br />
Burk, R. R. (1970) One step growth cycle for BHK21/C13 hamster<br />
fibroblasts.<br />
Exp. Cell Res. 63,309-316.<br />
Burnet, F. M. (1957) A modification of Jernes theory of antibody<br />
production using the concept of clonal selection.<br />
Austral. J. Sc!. 20,67.<br />
Burrows, M. T. (1910) The cultivation of tissues of the chick embryo<br />
outside the body.<br />
J. Amer. Med. Ass. 55,2057-2058.<br />
Butler. M. and Spier, R. E. (1984) The effects of glutamine utilisation and<br />
ammonia production on the growth of BHK cells In microcarrier cultures.<br />
J. Blotechnol. 1,187-196.<br />
Byars, N. and Kidson, C. (1970) Programmed synthesis and export of<br />
immunoglobulin by synchronised myeloma cells.<br />
Nature 226,648-650.<br />
Byers, V. S. and Baldwin, R. W. (1988) Therapeutic strategies with<br />
monoclonal antibodies and immunoconjugates.<br />
Immunology 65,3,329-336.<br />
Calabresi, P., McCarthy. K. L., Dexter, D. L., Cummings, F. J. and Rotman,<br />
B. (1981) <strong>Monoclonal</strong> antibody production in artificial capillary cultures.<br />
Proc. Am. Assoc. Cancer Res. 22,362.<br />
Campbell, A. M. (1984) Laboratory techniques in biochemistry and<br />
molecular biology, vol 13. <strong>Monoclonal</strong> antibody technology. (Burdon. R.<br />
H. and van Knippenberg. P. H. ). Elsevier, Oxford.<br />
Carrel, A. and Burrows, M. T. (1911) On the physicochemical regulation<br />
of the growth of tissues. The effects of the dilution of the medium on the<br />
growth of the spleen. J. Exp. Med. 13,562-570.<br />
Ceccarini C. and Eagle, H. (1971) Induction and reversal of contact<br />
inhibition of growth by pH modification.<br />
Nature, New Biol. 223,271-273.<br />
Chang, T. H., Steplewski, Z. and Koprowski, H. (1980) Production of<br />
monoclonal antibodies in serum-free medium.<br />
J. Immunol. Methods 39,369-376.<br />
Cleveland. W. L., Wood, I. and Erlanger, B. F. (1983) Routine large-scale<br />
production of monoclonal antibodies In a protein-free culture medium.<br />
J. Immunol. Methods 56,221-234.<br />
224
Cole, S. P. C., Vreeken, E. H. and Roder, J. C. '(1985) <strong>An</strong>tibody production<br />
by human x human hybridomas in serum free medium.<br />
J. Immunol. Methods 78,271-279.<br />
Conrad, A. H. (1971) Thymidylate synthetase activity In cultured<br />
mammalian cells.<br />
J. Biol. Chem. 246,1318-1323.<br />
Cooper. P. D., Burt, A. M. and Wilson, J. M. (1958) Critical effect of<br />
oxygen tension on rate of growth of animal cells in continuous<br />
suspended culture. Nature 182,1508-1609.<br />
Cowan, N. J. and Milstein, C. (1972) Automatic monitoring of biochemical<br />
parameters in tissue culture. Studies on synchronously growing mouse<br />
myeloma cells.<br />
Biochem. J. 128,445-454.<br />
Crabtree, H. G. (1929) Observations on the carbohydrate metabolism of<br />
tumours.<br />
Biochem. J. 23,536-645.<br />
Crawford, J. and Cohen, H. J. (1985) The essential role of L-glutamine<br />
in lymphocyte differentiation in vitro.<br />
J. Cell. Physiol. 124,275-282.<br />
Crowley, C. W.. Liu, C. C. and Levinson, A. D. (1983) Plasmid-directed<br />
synthesis of hepatitis B surface antigen in monkey cells.<br />
Mol. Cell. Biol. 3,44-55.<br />
Dalili, M. and Ollis, D. F. (1988) The influence of cyclic nucleotides on<br />
hybridoma growth and monoclonal antibody production.<br />
Biotech. Lett. 10,781-786.<br />
Damlani, G. Cosulich, E. and Bargellesi, A. (1979) Synthesis and<br />
secretion of IgG in synchronised mouse myeloma cells.<br />
Exp. Cell Res. 118,295-303.<br />
Darfler, F. J. and Insel, P. A. (1982) Serum-free culture of resting,<br />
PHA-stimulated and transformed lymphoid cell lines including<br />
hybridomas.<br />
Exp. Cell Res. 138,287-295.<br />
Davidson, R. L., O'Malley, K. A. and Wheeler, T. B. (1976) Polyethylene<br />
glycol-induced mammalian cell hybridisation: Effect of polyethylene<br />
glycol molecular weight and concentration.<br />
Somatic Cell Genet. 2,271-279.<br />
De'Lisle, A. J. Graves, R. A., Marzluff, W. F. and Johnson, L. F. (1983)<br />
Regulation of histone mRNA production and stability In<br />
serum-stimulated mouse 3T6 fibroblasts.<br />
Mol. Cell Biol. 3,1920-1929.<br />
225
Denhardt, D. T., Edwards, D. R. and Parfett, C. L. J. (1986) Gene<br />
expression during the mammalian cell cycle.<br />
Blochim. Blophys. Acta 865,83-125.<br />
Diderholm, H., Stenvist, B., Ponten, J. and Wesslen, T. (1965)<br />
Transformation of bovine cells In vitro after inoculation of Simian virus<br />
40 or its nucleic acid.<br />
Exp. Cell Res. 37,452-459.<br />
Dodge, T. C. and Hu, W. -S. (1986) Growth of hybridoma cells under<br />
different agitation conditions.<br />
Biotech. Lett. 8,683-686.<br />
Dodge, T. C. Ji, G. -Y., and Hu, W. -S. (1987) Loss of viability in<br />
hybridoma culture: a kinetic study.<br />
Enzyme Microb. Technol. 9,607-610.<br />
Donnelly, M. and Scheffler, I. E. (1976) Energy metabolism in<br />
respiration-deficient and wild-type chinese hamster fibroblasts in<br />
culture.<br />
J. Cell. Physiol. 89,39-62.<br />
Dube, S., Fisher, J. W. and Powell, J. S. (1988) Glycosylation at specific<br />
sites of erythropoietin is essential for biosynthesis, secretion and<br />
biological function.<br />
J. Biol. Chem. 263,17616-17521.<br />
Eagle, H. (1955b) The specific amino acid requirements of a mammalian<br />
cell (strain L) in tissue culture.<br />
J. Biol. Chem. 214,839-852.<br />
Eagle, H. (1955a) Nutrition needs of mammalian cells in tissue culture.<br />
Science 122,501-504.<br />
Eagle, H. (1959) Amino acid metabolism In mammalian cell cultures.<br />
Science 130,432-437.<br />
Eagle, H. (1971) Buffer combinations for mammalian cell culture.<br />
Science 174,500-503.<br />
Eagle, H. (1973) Effect of environmental pH on the growth of normal and<br />
malignant cells.<br />
J. Cell. Physiol. 82,1-8.<br />
Eagle, H., Barban, S., Levy, M. and Schulze, H. O. (1958) The utilization<br />
of carbohydrates by human cell cultures.<br />
J. Biol. Chem. 233,551-558.<br />
Eagle, H., Oyama, V. I., Levy, M., Horton, C. L. and Fleischman, R. (1956)<br />
The growth response of mammalian cells in tissue culture to L-glutamine<br />
and L-glutamic acid. J. Biol. Chem. 218,607-616.<br />
226
Eagle, H. and Piez, K. (1962) The population-dependent requirement by<br />
cultured mammalian cells for metabolites which they can synthesize.<br />
J. Experimental Medicine 116,29-43.<br />
Eaton, M. D. and Scala, A. R. (1961) Inhibitory effect of glutamine and<br />
ammonia on replication of Influenza virus in ascites tumor cells.<br />
Virology 13,300-307.<br />
Eigenbrodt, E., Fister, P. and Reinacher, M. (1985) New perspectives on<br />
carbohydrate metabolism in tumor cells in: Regulation of Carbohydrate<br />
Metabolism Vol. II (Beitner, R. Ed. ) CRC, Boca Raton, FL pp. 141-179.<br />
Emery, A. N., Lavery, M., Williams, B. and Handa, A. (1987) Large scale<br />
hybridoma culture In: Plant and <strong>An</strong>imal Cells : Process Possibilities<br />
(Webb, C. and Mavituna, F., eds. ) Ellis Horwood Ltd., Chichester. pp.<br />
137-148.<br />
Enders, J. R., Weler, T. H. and Robbins, F. C. (1949) Cultivation of the<br />
Lansing strain of poliomyelitis virus in cultures of various human<br />
embryonic tissues.<br />
Science 109,85-86.<br />
Enger, M. D. and Tobey, R. A. (1969) RNA synthesis in Chinese hamster<br />
cells. II. Increase in the rate of RNA synthesis during G1.<br />
J. Cell Biol. 42,308-315.<br />
Engvall, E. and Perlmann, P. (1971) Enzyme-linked immunosorbent assay<br />
(ELISA) : quantitative assay of immunoglobulin G.<br />
Immunochemistry 8,871-874.<br />
Epstein, N and Epstein, M. (1986) The hybridoma technology : I.<br />
Production of monoclonal antibodies in: Advances in Biotechnological<br />
Processes vol. 6 (Mizrahi, A., ed. ) Alan R. Liss Inc. pp. 179-218.<br />
Epstein, N., Kobiler, D. and Epstein, M. (1986) The hybridoma<br />
technology : II. Applications of hybrid cell products : <strong>Monoclonal</strong><br />
antibodies and lymphokines In: Advances in Biotechnological Processes<br />
vol. 6 (Mlzrahi, A., ed. ) Alan R Liss Inc. pp. 219-251.<br />
Eriksson, S., Graslund. A., Skog, S., Thelander, L. and Tribukait. B.<br />
(1984) Cell cycle dependent regulation of mammalian ribonucleotide<br />
reductase.<br />
J. Biol. Chem. 259,11695-11700.<br />
Fan, H. and Penman, S. (1970) Regulation of protein synthesis in<br />
mammalian cells. II. Inhibition of protein synthesis at the level of<br />
initiation during mitosis.<br />
J. Mol. Biol. 50,655-670.<br />
Fantes, P. A. and Nurse, P. (1981) Division timing : controls, models and<br />
mechanisms in: The Cell Cycle (John, P. C. L. ed. ) Cambridge University<br />
Press, Cambridge. pp. 11-34.<br />
227
Fazekas de St. Groth, S. and Scheidegger, D. (1980) Production of<br />
monoclonal antibodies : Strategies and tactics.<br />
J. Immunol. Meth. 35,1-21.<br />
Fazekas de St. Groth, S. (1983) Automated production of monoclonal<br />
antibodies in a cytostat.<br />
J. Immunol. Meth. 57,121-136.<br />
Feinendegen, L. E., Bond, V. P., Shreeve, W. W. and Painter, R. B. (1960) RNA<br />
and DNA metabolism in human tissue culture cells studied with tritiated<br />
cytidine.<br />
Exp. Cell Res. 19,443-469.<br />
Feteris, W. A. (1965) A serum glucose method without protein<br />
precipitation.<br />
Am. J. Med. Technol. 31,17-24.<br />
Fischer, A (1948) Amino acid metabolism of tissue cells in vitro.<br />
Biochem. J. 43,491-497.<br />
Fischer, A. et al. (1948) Growth of animal tissue cells in artificial media.<br />
Proc. Soc. Exp. Biol. Med. 67,40-46.<br />
Fleishaker, R. J. and Sinskey, A. J. (1981) Oxygen demand and supply in<br />
cell culture.<br />
Eur. J. Appl. Microblol. Biotech. 12,193-197.<br />
Frame K. K. and Hu, W. S. (1985) Oxygen uptake of mammalian cells in<br />
microcarrier culture response to changes in glucose concentration.<br />
Blotechnol. Lett. 7,147-161.<br />
Fung, Y. K., Crittenden, L. B., Farley, A. A. and Kung, H. J. (1983) Tumor<br />
induction by direct injection of clonal v. src DNA.<br />
Proc. Natl. Acad. Sc!. USA 80,353-357.<br />
Garatun-Tjeldsto, 0., Pryme, I. F., Weltman, J. K. and Dowben, R. M. (1976)<br />
Synthesis and secretion of light-chain Immunoglobulin In two successive<br />
cycles of synchronised plasmacytoma cells.<br />
J. Cell Biol. 68,232-239.<br />
Gazitt, Y. (1979) Early decrease of 2-deoxyglucose and alpha-amino<br />
Isobutyric acid transport are among the first events in differentiating<br />
synchronised murine erythroleukemia cells.<br />
J. Cell Physiol. 99,407-416.<br />
Gerhard, W., Yewdell, J., Frankel, M. E. and Webster, R. (1981) <strong>An</strong>tigenic<br />
structure of influenza virus haemagglutinin defined by hybridoma<br />
antibodies.<br />
Nature, 290,713-717.<br />
Geyer, R. P. and Chang, R. S. (1958) Bicarbonate as an essential for<br />
human cells in vitro. Arch. Biochem. Blophys. 73,500-506.<br />
228
Gilliland, D. G., Steplewski, Z., Collier, R. J., Mitchell, K. F., Chang, T. H.<br />
and Koprowski, H. (1980) <strong>An</strong>tibody-directed cytoxic agents : use of<br />
monoclonal antibody to direct the action of toxin A chains to colorectal<br />
carcinoma cells.<br />
Biochemistry 77,4539-4543.<br />
Glacken, M., Fleischaker, R. and Sinskey, A. (1983) Mammalian cell<br />
culture : Engineering principles and scale-up.<br />
Trends in Biotechnology 1,102-108.<br />
Glacken, M. W., Fleischaker, R. J. and Sinskey, A. J. (1986) Reduction of<br />
waste product excretion via nutrient control : Possible strategies for<br />
maximising product and cell yields on serum in cultures of mammalian<br />
cells.<br />
Biotechnol. Bioeng. 28,1376-1389.<br />
Glacken, M. W. (1988) Catabolic control of mammalian cell culture.<br />
Blo/Technology 6,1041-1050.<br />
Glassy, M. C. (1987) Immortalization of human lymphocytes from a tumor-<br />
involved lymph node.<br />
Cancer Res. 47,5181-5188.<br />
Glassy, M. C. and Furlong, C. E. (1981) Neutral amino acid transport<br />
during the cell cycle of cultured human lymphocytes.<br />
J. Cell Physiol. 107,69-74.<br />
Glassy, M. C., Peters, R. E. and Mikhalev, A. (1987) Growth of human-<br />
human hybridomas in serum-free medium enhances antibody secretion.<br />
In Vitro, 23,745-749.<br />
Glassy, M. C., Tharakan, J. P. and Chau, P. C. (1988) Serum-free media In<br />
hybridoma culture and monoclonal antibody production.<br />
Biotechnol. Bioeng. 32,1015-1028.<br />
Glazer, R. I., Vogel, C. I.., Potel, I. R. and <strong>An</strong>thony, P. P. (1974) Glutamate<br />
dehydrogenase activity related to histopathological grade of<br />
hepatocellular carcinoma in man.<br />
Cancer Res. 34,2975-2986.<br />
Goding, J. W. (1983) <strong>Monoclonal</strong> antibodies : Principles and practice.<br />
Academic Press. New York.<br />
Goldstein, G., Schindler, J., Tsai, H., Cosimi, A. B., Russell, P., Norman, D.<br />
et al. (1985) A randomised clinical trial of OKT3 monoclonal antibody for<br />
acute rejection of cadaveric renal transplants.<br />
New Engl. J. Med. 313,337.<br />
Graff. S.. Moser. H., Kastner, 0., Graff, A. M. and Tannenbaum, M. (1965)<br />
The significance of glycolysis.<br />
J. Natl. Cancer Inst. 34,511-519.<br />
Green. H., Kehinde, 0. and Thomas, J. (1979) Growth of cultured human<br />
epidermal cells into multiple epithelia suitable for grafting.<br />
Proc. Natl. Acad. Sci. 76,5665-5669.<br />
229
Griffiths, J. B. and Pirt, S. J. (1967) The uptake of amino acids by mouse<br />
cells (strain LS) during growth in batch culture and chemostat culture:<br />
the influence of cell growth rate.<br />
Proc. Roy. Soc. B 168,421-438.<br />
Griffiths, J. B. (1986) Can cell culture medium costs be reduced?<br />
Strategies and possibilities.<br />
Trends in Biotechnology 4,268-272.<br />
Guilbert, L. J. and Iscove, N. N. (1976) Partial replacement of serum by<br />
selenite, transferrin, albumin and lecithin in haemopoietic cell cultures.<br />
Nature 263,594-695.<br />
Ham, R. G. and McKeehan, W. L. (1979) Media and growth requirements in:<br />
Methods in Enzymology vol 58 (Jakoby, W. B. and Pastan, I. H., eds)<br />
Academic Press, New York pp. 44-93.<br />
Handa, A., Emery, A. N. and Spier, R. E. (1987) On the evaluation of<br />
gas-liquid Interfacial effects on hybridoma viability In bubble column<br />
bioreactors.<br />
Develop. biol. Standard. 66,241-253.<br />
Harris, J. L. and Spier, R. E. (1985) Physical and chemical parameters:<br />
Measurement and control in: <strong>An</strong>imal Cell Biotechnology (Spier, R. E. and<br />
Griffiths, J. B., eds) Academic Press, London pp. 283-319.<br />
Harrison, R. G. (1907) Observations on the developing living nerve fibre.<br />
Proc. Soc. Exp. Biol. Med. 4,140-143.<br />
Hendry, R. M. and Herrmann, J. E. (1980) Immobilization of antibodies on<br />
nylon for use in enzyme-linked immunoassay.<br />
J. Immunol. Methods 35,285-296.<br />
Himmelfarb, P. Thayer, P. S. and Martin, H. E. (1969) Spin filter culture:<br />
The propagation of mammalian cells in suspension.<br />
Science 164,555-567.<br />
Himmler, G., Palfl. G., Ruker, F.. Katinger, H. and Scheirer, W. (1984) A<br />
laboratory fermenter for agarose Immobilized hybridomas to produce<br />
monoclonal antibodies.<br />
Develop. biol Standard. 60,291-296.<br />
Holley, R. W., Armour, R. and Baldwin, J. H. (1978) Density dependent<br />
regulation of growth of BSC-1 cells in cell culture: Control of growth by<br />
low molecular weight nutrients.<br />
Proc. Natl. Acad. Sci. USA 75,339-341.<br />
Holmes, B. E. and Watchorn, E. (1927) Studies in the metabolism of tissues<br />
growing in vitro. I. Ammonia and urea production by kidney.<br />
Biochem. J. 21.327-334.<br />
Hopkinson, J. (1985) Hollow fibre cell culture systems for economical<br />
cell-product manufacturing.<br />
Bio/Technology 3,226-230.<br />
230
Horan, P. K. and Wheeless, L. L. Jr. (1977) Quantitative single cell<br />
analysis and sorting. Science 198,149-157.<br />
Howard, A. and Pelc, S. R. (1953) Synthesis of desoxyribonucleic acid in<br />
normal and irradited cells and its relation to chromosome breakage.<br />
Heredity Suppl. 6,261-273.<br />
Hsuing, H. M., Mayne, N. G. and Becker, G. W. (1986) High level<br />
expression, efficiency, secretion and folding of human growth hormone<br />
in Escherlchia coll. Blo/Technology 4,991-995.<br />
Hu, W. -S. and Dodge, T. C. (1985) Cultivation of mammalian cells in<br />
bioreactors.<br />
Biotechnol. Progress 1,209-215.<br />
Hu, W. -S., Dodge, T. C., Frame, K. K. and Himes, V. B. (1987)<br />
Effect of glucose on the cultivation of mammalian cells.<br />
Develop. biol. Standard. 66,279-290.<br />
Hume, D. A., Radik, J. L. Ferber, E. and Weidemann, M. J. (1978) Aerobic<br />
glycolysis and lymphocyte transformation.<br />
Biochem. J. 174,703-709.<br />
Hurrell, J. G. R. (1982) <strong>Monoclonal</strong> hybridoma antibodies: Techniques and<br />
applications. CRC Press, Boca Raton, Florida.<br />
Hyvarinen, A. and Nikkila, E. (1962) Specific determination of blood<br />
glucose with o-toluidine.<br />
Clin. Chem. Acta 7,140-149.<br />
Imamura, T., Crespi, C. L., Thilly, W. G. and Brunnengraber, H. (1982)<br />
Fructose as a carbohydrate source yields stable pH and redox parameters<br />
In microcarrier cell culture.<br />
<strong>An</strong>al. Biochem. 124,353-358.<br />
Iscove, N. N. and Melchers, F. (1978) Complete replacement of serum by<br />
albumin, transferrin and soybean lipids in cultures of lipopolysaccharide<br />
reactive cultures of B-lymphocytes.<br />
J. Exp. Med. 147,923-933.<br />
Ismail, A. A. A., West, P. M. Goldie, D. J. and Poole, A. C. (1981) <strong>An</strong><br />
improved fully automated continuous flow system for immunoassays.<br />
<strong>An</strong>n. Clin. Biochem. 18,287-294.<br />
Israel, M., Chan, H. W., Hourihan, S. L., Rowe, W. P. and Martin, M. A. (1979)<br />
Biological activity of polyoma viral DNA in mice and hamsters.<br />
J. Virol. 29,990-996.<br />
Ito, M. and McLimans, W. F. (1981) Ammonia inhibition of interferon<br />
synthesis.<br />
Cell Biol. Int. Rep. 5,661-666.<br />
231
Jacobs, R. A. and Majerus, P. W. (1973) The regulation of fatty acid<br />
synthesis in human skin fibroblasts. Inhibition of fatty acid synthesis<br />
by free fatty acids. J. Biol. Chem. 248,8392-8401.<br />
Jacobs, K., Shoemaker, C., Rudersdorf, R., Neill, S. D., Kaufman, R. J.,<br />
Mufson, A., Seehra, J., Jones, S. S., Hewick, R., Fritsch, E. F., Kawakita,<br />
M., Shimizu, T. and Hiyake, T. (1985) Isolation and cloning of genomic<br />
and cDNA clones of human erythropoietin.<br />
Nature 313,806-809.<br />
Jaffres, G. J., Fuller, T. C., Cosimi, A. B., Russell, P. S., Winn, H. J. and<br />
Colvin, R. B. (1986) <strong>Monoclonal</strong> antibody therapy. <strong>An</strong>ti-idiotypic and<br />
non-anti-idlotypic antibodies to OKT3 arising despite intense<br />
immunosupression.<br />
Transplantation 41,578-582.<br />
James. K. and Bell, G. T. (1987) Human monoclonal antibody production.<br />
Current status and future prospects.<br />
J. Immunol. Methods 100,5-40.<br />
James, R. and Bradshaw, R. A. (1984) Polypeptide growth factors.<br />
<strong>An</strong>n. Rev. Biochem. 53,259-292.<br />
Janatova, J. and Gobel, R. J. (1984) Rapid optimisation of<br />
immunoadsorbent characteristics.<br />
Biochem. J. 221.113-120.<br />
Jarvis and Grdina, T. (1983)<br />
microencapsulated living cells.<br />
Biotechniques<br />
Production of biologicals from<br />
1,22-27.<br />
Jensen. E. M. and Liu, 0. C. (1961) Studies of Inhibitory effects of<br />
ammonium ions in several virus-tissue culture systems.<br />
Proc. Soc. Exp. Biol. Med. 107,834-838.<br />
John, P. C. L., Lambe, C. A., McGookin, R. and Orr, B. (1981) Accumulation<br />
of protein and messenger RNA molecules in the cell cycle in: The Cell<br />
Cycle (John, P. C. L., ed. ) Cambridge University Press, Cambridge. pp.<br />
185-222.<br />
Johnson, I. S. (1983) Human Insulin from recombinant DNA technology.<br />
Science 219,632-637.<br />
Johnson, L. F., Fuhrman, C. L. and Wiedman, L. M. (1978) Regulation of<br />
dihydrofolate reductase gene expression in mouse fibroblasts during<br />
transition from resting to growing state.<br />
J. Cell. Physiol. 97,397-406.<br />
Kadourl, A. and Bohak, Z. (1985) Production of plasminogen activator by<br />
cells in culture in: Advances in Biotechnological Processes, Vol 5<br />
(Mizrahl, A. and van Wezel, A. L., eds) Alan R Liss, New York<br />
pp. 275-292.<br />
232
Kamentsky, L. A., Melamed, M. R. and Derman, H. (1965)<br />
Spectrophotometer: new Instrument for ultrarapid cell analysis.<br />
Science 160,630-631.<br />
Karkare, S. B., Phillips, P. G., Burke, D. H. and Dean, R. C. (1985)<br />
Continuous productionof monoclonal antibodies by chemostatic and<br />
immobilized hybridoma culture in: Large-Scale Mammalian Cell Culture<br />
(Feder, J. and Tolbert, W. R., eds) Academic Press, New York. pp 128-150.<br />
Katinger, H. W. D. and Bliem, R. (1983) Production of enzymes and<br />
hormones by mammalian cell culture in: Advances in Biotechnological<br />
Processes, vol. 5 (Mizrahi, A. and van Wezel, A. L., eds) Alan R Liss, New<br />
York. pp. 61-95.<br />
Katinger, H. and Scheirer, W. (1985) Mass cultivation of animal cells in:<br />
<strong>An</strong>imal Cell Biotechnology. vol 1 (Spier, R. E. and Griffiths, J. B., eds)<br />
Academic Press, London pp. 167-193.<br />
Katinger, H. (1987) Principles of animal cell fermentation.<br />
Develop. biol. Standard. 66,195-209.<br />
Kaufmann, S. H. E., Eichmann, K., Muller, I. and Wrazel, L. J. (1985)<br />
J. Immunol. 134,4123-4127.<br />
Kaufman, R. J., Wasley, L. C., Spiliates, A. J., Gossels, S. D., Latt, S. A.,<br />
Larsen, G. R. and Kay, R. M. (1985) Co-amplification and co-expression<br />
of human tissue-type plasminogen activator and murine dihydrofolate<br />
reductase sequences in Chinese hamster ovary cells.<br />
Mol. Cell. -Biol. 5,1750-1769.<br />
Kawamoto, T., Sato, J. D., McClure, D. B. and Sato, G. H. (1986)<br />
Serum-free medium for the growth of NS- 1 mouse myeloma cells and the<br />
isolation of NS-1 hybridomas In: Methods in Enzymology, vol 121<br />
(Langone, J. J. and van Vunakis, H., eds) Academic Press, London<br />
pp. 266-277.<br />
Kenealy, W. R., Gray, J. E., Ivanoff. L. A., Tribe, D. E., Reed, D. L., Korant,<br />
B. D. and Petteway, S. R. (1987) Solubility of proteins overexpressed in<br />
Escherichla coll.<br />
Developments in Industrial Microbiology 28,45-52.<br />
Kernan, N. A., Byers, V. S., Scannon, P. J., Mischak, R. P., Brockstein, J.,<br />
Dupont, B. and O'Reilly, R J. (1988) Treatment of steroid resistant<br />
graft-vs-host disease by in vivo administration of an anti-T-cell ricin<br />
A chain Immunotoxin.<br />
J. Amer. Med. Assoc. 259,3154-3157.<br />
Kilburn, D. G. and Webb, F. C. (1968) The cultivation of animal cells at<br />
controlled dissolved oxygen partial pressure.<br />
Biotechnol. Bioeng. 10,801-814.<br />
Killander, D., Nilsson, K., Lundin, L. and Fabriclus, H. -A. (1977)<br />
Cytoplasmic levels of IgE in human myeloma cells in different phases of<br />
the cell cycle.<br />
Eur. J. Immunol. 7,786-791.<br />
233
Kim, W., Tsao, D., Itzkowitz, S. H. and Kim, Y. S. (1985) Production and<br />
clinical utility of carcinoembryonic antigen In: Advances In<br />
Biotechnological Processes, vol 4 (Mizrahi, A., and van Wezel, A. L., eds. )<br />
Alan R Liss, New York pp. 151-181.<br />
King, M. E. and Spector, A. A. (1981) Lipid metabolism In cultured cells<br />
In: The Growth Requirements of Vertebrate Cells in vitro (Waymouth, C.,<br />
Ham, R. G. and Chapple, P. J., eds. ) Cambridge University Press, London<br />
pp. 293-312.<br />
Kingsman, S. M.. Kingsman, A. J. and Mellor, J. (1987) The production of<br />
mammalian proteins In Saccharomyces cerevisiae.<br />
Trends In Biotechnology 5,53-67.<br />
Kit, S. (1976) Thymidine kinase, DNA synthesis and cancer.<br />
Mol. Cell. Biochem. 11,161-182.<br />
Kitos, P. A., Sinclair, R. and Waymouth, C. (1962) Glutamine metabolism<br />
by animal cells growing in a synthetic medium.<br />
Exp. Cell Res. 27,307-316.<br />
Klein, F., Ricketts, R., Pickle, D. and Flickinger, M. C. (1983)<br />
Interleukin-2 and interleukin-3: Suspension cultures of constitutive<br />
producer lines in: Advances in Biotechnological Processes, vol 2<br />
(Mlzrahi, A. and van Wezel, A. L., eds. ) Alan R Liss, New York pp.<br />
111-134.<br />
Klement, G., Scheirer, W. and Katinger, H. W. D. (1987) Construction of a<br />
large scale membrane reactor system with different compartments for<br />
cells, medium and product.<br />
Develop. biol. Standard. 66,221-226.<br />
Kluft, C., van Wezel, A. L., van der Velden, C. A. M., Emels, J. J., Verheilen,<br />
J. H. and Wljngaards, G. (1983) Large-scale production of extrinsic<br />
(tissue-type) plasminogen activator from human melanoma cells in:<br />
Advances in Biotechnological Processes Vol. 2. (Mizrahl, A. and van<br />
Wezel, A. L. eds. ) Alan R. Liss, New York. pp 97-110.<br />
Knazek, R. A., Gullino, P. M., Kohler, P. 0. and Dedrick, R. L. (1972) Cell<br />
culture on artificial capillaries: an approach to tissue growth in vitro:<br />
Science 178,65-67.<br />
Kohler, G. and Milstein, C. (1975) Continuous cultures of fused cells<br />
secreting antibody of predefined specificity.<br />
Nature 256,495-497.<br />
Konrad, C. G. (1963) Protein synthesis and RNA synthesis during mitosis<br />
in animal cells.<br />
J. Cell Biol. 19,267-277.<br />
Kovacevic, Z. (1971) The pathway of glutamine and glutamate oxidation<br />
in isolated mitochondria from mammalian cells.<br />
Biochem. J. 125,757-763.<br />
234
Kovacevic, Z. and Morris, H. P. (1972) The role of glutamine in the<br />
oxidative metabolism of malignant cells.<br />
Cancer Res. 32,326-333.<br />
Kovar, J. and Franek, F. (1985) Hybridoma cultivation in defined<br />
serum-free media: Growth supporting substances I. Transferrin.<br />
Folia biologica (Praha) 31,167-175.<br />
Kovar, J. (1986) Hybridoma cultivation in defined serum-free medium:<br />
Growth supporting substances II. Insulin and other hormones and growth<br />
factors.<br />
Folia blologica (Praha) 32.304-310.<br />
Kovar, J. (1987) Hybridoma cultivation in defined serum-free medium:<br />
Growth supporting substances III. Ethanolamine, vitamins and other low<br />
molecular weight nutrients.<br />
Folia biologica (Praha) 33,369-376.<br />
Kris, R. M., Libermann, T. A., Avivi, A. and Schlesinger, J. (1985) Growth<br />
factors, growth factor receptors and oncogenes.<br />
Bio/Technology 3,135-140.<br />
Krolick, K. A., Uhr, J. W. and Vitetta, E. S. (1982) Selective killing of<br />
leukaemia cells by antibody-toxin conjugates: Implications for<br />
autologous bone marrow transplantation.<br />
Nature 295,604-605.<br />
Kromer, E. and Katinger, H. W. D. (1982) Effects of glucose-feeding on<br />
glucose and oxygen requirement, energy charge and interferon<br />
production of human lymphoid cells.<br />
Develop. biol. Standard. 50,349-354.<br />
Kruse, P. F. Jr., Miedema, E. and Carter, H. C. (1967) Amino acid<br />
utilizations and protein synthesis at various proliferation rates,<br />
population densities and protein contents of perfused animal cells and<br />
tissue cultures.<br />
Biochemistry 6,949-955.<br />
Ku, K., Kuo, M. J., Delente, J., Wildi, B. S. and Feder, J. (1981)<br />
Development of a hollow fibre system for large-scale culture of<br />
mammalian cells.<br />
Blotechnol. Bioeng. 23,79-95.<br />
Kuhlmann, W. (1987) Optimization of a membrane oxygenation system for<br />
cell culture In stirred tank reactors.<br />
Develop. biol. Standard. 66,263-268.<br />
Kvamme, E. and Svenneby, G. (1961) The effect of glucose on glutamine<br />
utilization by Ehrlich ascites tumor cells.<br />
Cancer Res. 21,92-98.<br />
Laemmli, U. K. (1970) Cleavage of structural proteins during the<br />
assembly of the head of bacteriophage T4.<br />
Nature 227,680-685.<br />
235
Lambe, C. A. and Walker, A. G. (1987) Reactor requirements for animal<br />
cells in: Plant and <strong>An</strong>imal Cells : Process Possibilities (Webb, C. and<br />
Mavituna, F., eds) Ellis Horwood, Chichester. pp. 116-124.<br />
Lavery, M., Kearns, M. J., Price, D. G., Emery, A. N., Jefferis, R. and<br />
Nienow, A. W. (1985) Physical conditions during batch culture of<br />
hybridomas in laboratory scale stirred tank reactors.<br />
Develop. biol. Standard. 60,199-206.<br />
Lavietes, B. B., Regan, D. H. and Demopoulos, H. B. (1974) Glutamate<br />
oxidation of 6C3HED lymphoma: Effects of L-asparaginase on sensitive<br />
and resistant lines.<br />
Proc. Natl. Acad. Sc!. USA 71,3993-3997.<br />
Lazar, A. (1983) Interferon production by human lymphoblastold cells In:<br />
Advances In Biotechnological Processes, vol 2 (Mlzrahl. A. and van<br />
Wezel, A. L. eds. ) Alan R Liss, New York pp. 179-208.<br />
Lazar, A., Reuveny, S., Geva, J.. Marcus, D., Silberstein, L., Ariel, N.,<br />
Epstein, N., Altbaum, Z., Sinai, J. and Mizrahi, A. (1987) Production of<br />
carcinoembryonic antigen from a human colon adenocarcinoma cell line.<br />
1. Large scale cultivation of carcinoembryonic antigen-producing cells<br />
on cylindric cellulosic-based microcarriers.<br />
Develop. Biol. Standard 66,423-428.<br />
Lazo, P. A. (1981) Amino acids and glucose utilization<br />
metabolic pathways in ascites-tumour cells.<br />
Eur. J. Biochem. 117,19-25.<br />
by different<br />
Lehmann, J.. Piehl, G. W. and Schulz, R. (1987) Bubble-free cell culture<br />
aeration with porous moving membranes.<br />
Develop. biol. Standard. 66,227-240.<br />
Lerner, R. A. and Hodge, L. D. (1970) Gene expression In synchronised<br />
lymphocytes: Studies on the control of synthesis of immunoglobulin<br />
polypeptides.<br />
J. Cell. Physiol. 77,265-276.<br />
Levintow, L., Eagle, H. and Piez, K. A. (1957) The role of glutamine in<br />
protein biosynthesis in tissue culture.<br />
J. Biol Chem. 227,929-941.<br />
Levintow, L. and Eagle, H. (1961) Biochemistry of cultured mammalian<br />
cells.<br />
<strong>An</strong>n. Rev. Blochem. 30,605-640.<br />
Levy, R. and Miller, R. A. (1983) Tumor therapy with monoclonal<br />
antibodies.<br />
Fed. Proc. 42,2650-2656.<br />
Lewis, M. R. and Lewis, W. H. (1912) The cultivation of chick tissues in<br />
media of known composition.<br />
<strong>An</strong>at. Rec. 6.207-211.<br />
236
Lewis, M. R. (1922) Importance of dextrose in the medium for tissues<br />
cultures.<br />
J. Exp. Med. 53,317-322.<br />
Ley. K. D. and Tobey, R. A. (1970) Regulation of DNA synthesis in chinese<br />
hamster cells. II. Induction of DNA synthesis and cell division by<br />
isoleucine and glutamine in G1-arrested cells In suspension<br />
culture.<br />
J. Cell Biol. 47,453-459.<br />
Liberti, P. and Baglioni, C. (1973) Synthesis of immunoglobulin and<br />
nuclear protein in synchronised mouse myeloma cells.<br />
J. Cell. Physiol. 82,113-120.<br />
Lim, F. and Sun, A. (1980) Microencapsulated Islets as bloartificial<br />
endocrine pancreas. Science 210,908-910.<br />
Littlefield, J. W. (1964) Selection of hybrids from matings of fibroblasts<br />
in vitro and their presumed recombinants.<br />
Science 145,709-710.<br />
Littlefield, J. W. (1966) The periodic synthesis of thymidine kinase in<br />
mouse fibroblasts.<br />
Biochim. Biophys. Acta 114,398-403.<br />
Lloyd, D. (1986) Biochemistry of the cell cycle.<br />
Biochem. J. 242.313-321.<br />
Lloyd. D., Poole, R. K. and Edwards, S. W. (1982) The Cell Division Cycle:<br />
Temporal Organization and Control of Cellular Growth and Reproduction.<br />
Academic Press, London.<br />
Lord, J. M. Roberts, L. M., Thorpe, P. E. and Vitetta, E. S. (1985)<br />
Immunotoxins.<br />
Trends In Biotechnology 3,176-179.<br />
Low, K. and Harbour. C. (1985a) Growth kinetics of hybridoma cells: 1.<br />
The effects of varying foetal calf serum levels.<br />
Develop. biol. Standard. 60,17-24.<br />
Low, K. and Harbour. C. (1985b) Growth kinetics of hybridoma cells: 2.<br />
The effects of varying energy source concentrations.<br />
Develop. biol. Standard. 60,73-79.<br />
Lowder. J. N., Meeker, T. C., Campbell, M., Garcia, C. F., Gralow, J., Miller,<br />
R. A.. Warnke, R. and Levy. R. (1987) Studies on B lymphoid tumours<br />
treated with monoclonal anti-idlotype antibodies: Correlation with<br />
clinical responses. Blood 69,199-213.<br />
Luan, Y. T. Mutharasan, R. and Magee, W. E. (1987a) <strong>Factors</strong> governing<br />
lactic acid formation in long term cultivation of hybridoma cells.<br />
Biotech. Lett. 9,761-756.<br />
237
Luan, Y. T. Mutharasan, R. and Magee, W. E. (1987b) Strategies to extend<br />
longevity of hybridomas In culture and promote yield of monoclonal<br />
antibodies.<br />
Biotech. Lett. 9.691-696.<br />
Lubiniecki. A. S. (1987) Pharmaceutical applications of recombinant<br />
DNA-modified mammalian cells.<br />
Developments in Industrial Microbiology 28,<br />
133-138.<br />
Lydersen, B. K., Putnam, J., Bognar, E., Patterson, M., Pugh, G. G. and<br />
Noll, L. A. (1985) The use of a ceramic matrix in a large scale cell culture<br />
system in: Large-Scale Mammalian Cell Culture (Feder, J. and Tolbert,<br />
W. R., eds) Academic Press, New York pp. 39-58.<br />
Macmillan, J. C. and Wheatley, D. N. (1981) Amino acid pools In mitotic<br />
and Interphase HeLa cells.<br />
Exp. Cell Res. 133,470-475.<br />
Marsani, B. D., Slate, D. L. and Schimke, R. T. (1981) S phase-specific<br />
synthesis of dihydrofolate reductase in Chinese hamster ovary cells.<br />
Proc. Natl. Acad. Sc!. USA 78,4985-4989.<br />
Marston, F. A. O. (1986) The purification of eukaryotic polypeptides<br />
synthesized in Escherichla cola.<br />
Biochem. J. 240,1-12.<br />
Mather, J. P. and Sato, G. H. (1979) The growth of mouse melanoma cells<br />
in hormone supplemented, serum-free medium.<br />
Exp. Cell Res. 120,191-200.<br />
Mather, J., Wu, R. and Sato, G. (1981) The role of hormones In the growth<br />
and regulation of cells in a serum-free medium in: The Growth<br />
Requirements of Vertebrate Cells in vitro (Waymouth, C., Ham, R. G. and<br />
Chapple, P. J., eds. ) Cambridge University Press, London pp. 244-251.<br />
Mattlasson, B., Borrebaeck, C., Sanfridson, B. and Mosbach, K. (1977)<br />
Thermometric enzyme-linked immunosorbent assay: TELISA.<br />
Biochim. Biophys. Acta 483.221-227.<br />
Maurer, H. R. (1986) Towards chemically-defined, serum-free media for<br />
mammalian cell culture In: <strong>An</strong>imal Cell Culture, a Practical Approach<br />
(Freshney, R. I., ed. ) IRL Press, Oxford pp. 13-32.<br />
McCarty, K. (1962) Selective utilization of amino acids by mammalian<br />
cell cultures.<br />
Exp. Cell Res. 27,230-240.<br />
McGee. R. and Spector. A. A. (1974) Short term effects of free fatty acids<br />
on the regulation of fatty acid biosynthesis in Ehrlich ascites tumour<br />
cells.<br />
Cancer Res. 34,3355-3362.<br />
McKeehan, W. L., Hamilton, W. G. and Ham, R. G. (1976) Selenium is an<br />
essential trace nutrient for growth of W138 diploid human fibroblasts.<br />
Proc. Natl. Acad. Sci. USA 73,2023-2027.<br />
238
McKeehan, W. L. (1986) Glutaminolysis in animal cells in: Carbohydrate<br />
Metabolism in Cultured Cells (Morgan. M. J., ed. ) Plenum Press pp.<br />
111-150.<br />
McLimans, W. F. (1972) The gaseous environment of the mammalian cell<br />
in culture in: Growth, Nutrition and Metabolism of Cells in Culture Vol.<br />
2 (Rothblat, G. H. and Cristofalo, V. J.. eds. ) Academic Press, London.<br />
pp. 137-170.<br />
Meister, A. (1962) Amide nitrogen transfer (survey).<br />
The Enzymes 6,247-266.<br />
Melvin, W. T., Burke, J. F. Slater. A. A. and Keir, H. M. (1979) Effect of<br />
amino acid deprivation on DNA synthesis in BHK-21/C13 cells.<br />
J. Cell. Physiol. 98,73-80.<br />
Merten. O. -W.. Reiter. S.. Himmler, G., Scheirer, W. and Katinger, H.<br />
(1985) Production kinetics of monoclonal antibodies.<br />
Develop. biol. Standard. 60.219-227.<br />
Merten, O. -W., Palfi, G. E. and Steiner, J. (1986) ??? In: Advances in<br />
Biotechnological Processes, vol 6 (Mizrahi, A., ed. ) Alan R Liss, New York<br />
pp. 111-178.<br />
Merten, O. -W. (1987) Concentrating mammalian cells I. Large-scale<br />
animal cell culture.<br />
Trends in Biotechnology 5.230-237.<br />
Milcarek, C. and Zahn, K. (1978) The synthesis of ninety proteins<br />
including actin throughout the cell cycle.<br />
J. Cell Biol. 79,833-838.<br />
Miller, R. A., Maloney, D. G., Warnke, R. and Levy, R. (1982) Treatment of<br />
B-cell lymphoma with monoclonal anti-idlotype antibody.<br />
New Engl. J. Med. 306 , 517-522.<br />
Miller, W. M., Wilke, C. R., and Blanch, H. W. (1987) Effects of dissolved<br />
oxygen concentration on hybridoma growth and metabolism In<br />
continuous culture. J. Cell. Physiol. 132,524-530.<br />
Miller. W. M., Blanch, H. W. and Wilke. C. R. (1988a) A kinetic analysis of<br />
hybridoma growth and metabolism in batch and continuous suspension<br />
culture: Effect of nutrient concentration, dilution rate and pH.<br />
Biotechnol. Bioeng. 32,947-965.<br />
Miller, W. M., Wilke, C. R. and Blanch, H. W. (1988b) Transient responses<br />
of hybridoma cells to lactate and ammonia pulse and step changes in<br />
continuous culture. Bloprocess Engineering 3,113-122.<br />
Miller, W. M., Wilke, C. R. and Blanch, H. W. (1989) Transient responses<br />
of hybridoma cells to nutrient additions in continuous culture: 1.<br />
Glucose pulse and step additions.<br />
Biotechnol. Bioeng. 33,477-486.<br />
239
Milstein, C. (1980) <strong>Monoclonal</strong> antibodies.<br />
Sci. Am. 243 (Oct), 56-64.<br />
Miltenburger, H. G. and Krieg, A. (1984) Bloinsecticides II. Baculovirldae<br />
in: Advances in Biotechnological Processes, vol 3 (Mlzrahi, A. and van<br />
Wezel. A. L., eds. ) Alan R Liss, New York pp. 291-313.<br />
Mitchell, B. F. and Tupper. J. T. (1977) Synchronisation of mouse 3T3 and<br />
SV40 3T3 cells by way of centrifugal elutriation.<br />
Exp. Cell Res. 106,351-355.<br />
Mitchison, J. M. (1971) The Biology of the Cell Cycle.<br />
" Cambridge University Press, Cambridge.<br />
Mlzrahl, A., Vosseller, G. V., Yagi, Y. and Moore, G. E. (1972) The effect<br />
of dissolved oxygen partial pressure on growth, metabolism and<br />
immunoglobulin production in a permanent human lymphocyte cell line<br />
culture.<br />
Proc. Soc. Exp. Biol. Med. 139,118-122.<br />
Mizrahi, A. (1988) Biologicals produced from animal cells in culture- an<br />
overview.<br />
Biotech. Adv. 6.207-220.<br />
Monod, J. (1942) Recherches sur la croissance des cultures bacteriennes.<br />
Hermann, Paris.<br />
Monod. J. (1950) La technique de culture continue; theorie et<br />
applications.<br />
<strong>An</strong>n. Inst. Pasteur Paris 79,390-410.<br />
Moreadith, R. W. and Lehninger, A. L. (1984) The pathway of glutamate<br />
and glutamine oxidation by tumour cell mitochondria: Role of<br />
mitochondrial NAD(P)+ dependent malic enzyme.<br />
J. Biol. Chem. 259.6215-6221.<br />
Morgan, J. F.. Morton, H: J. and Parker, R. C. (1950) Nutrition of animal<br />
cells In tissue culture. 1. Initial studies on a synthetic medium.<br />
Proc. Soc. Exp. Biol. Med. 73,1-8.<br />
Morgan, M. J. and Falk, P. (1986) The utilization of carbohydrates by<br />
animal cells in: Carbohydrate Metabolism in Cultured Cells (Morgan, M.<br />
J.. ed. ) Plenum Press pp. 29-75.<br />
Morris, D. L. Campbell, J. and Hornby, W. E. (1975) A chemistry for the<br />
immoblisation of enzymes on nylon: The preparation of nylon<br />
tube-supported hexokinase and glucose 6-phosphate dehydrogenase<br />
and the use of the co-immobilised enzymes in the automated<br />
determination of glucose.<br />
Blochem. J. 147,593-603.<br />
Morrison, S. L.. Johnson, M. J., Herzenberg, L. A. and 01. V. T. (1984)<br />
Chimeric human antibody molecules: Mouse antigen-binding domains<br />
with human constant region domains.<br />
Proc. Natl. Acad. Sci. USA 81,6851-6855.<br />
240
Morrison, S. L. (1985) Transfectomas provide novel chimeric antibodies.<br />
Science 229,1202-1207.<br />
Moser, H. and Vecchio, G. (1967) The production of stable steady states<br />
in mouse ascites mast cell cultures maintained in the chemostat.<br />
Experlentia 23,1-10.<br />
Mueller, G. C. (1969) Biochemical events in the animal cell cycle.<br />
Fed. Proc. 28,1780-1789.<br />
Mueller. G. C. and Kajiwara, K. (1966) Early- and late-replicating<br />
deoxyribonucleic acid complexes in HeLa cell nuclei.<br />
Biochim. Biophys. Acta 114,108-115.<br />
Murakami, H., Masui, H., Sato, G. H., Sueoka, N., Chow, T. P. and<br />
Kano-Sueoka. T. (1982) Growth of hybridoma cells in serum-free<br />
medium: Ethanolamine is an essential component.<br />
Proc. Natl. Acad. Sci. USA 79,1158-1162.<br />
Murdin, A. D., Thorpe. J. S.. Kirkby, N., Groves, D. J. and Spier, R. E.<br />
(1987) Immobilisation and growth of hybridomas in packed beds in:<br />
Bloreactors and Blotransformations (Moody, G. W. and Baker, P. B., eds)<br />
Elsevier, London. pp.. 99-110.<br />
Nakamura. H., Morita, T.. Masaki, S. and Yoshida, S. (1984) Intracellular<br />
localization and metabolism of DNA polymerase alpha In human cells<br />
visualized with monoclonal antibody.<br />
Exp. Cell Res. 151,123-133.<br />
Neurath, A. R. and Strick, N. (1981) Enzyme-linked fluorescence<br />
immunoassays using B-galactosidase and antibodies covalently bound<br />
to polystyrene plates.<br />
J. Virol. Meth. 3,155-165.<br />
Ngo. T. T. and Lenhoff, H. M. (1981) New approach to heterogeneous<br />
enzyme immunoassays using tagged enzyme-ligand conjugates.<br />
Biochem. Blophys. Res. Commun. 99,496-503.<br />
Nilsson, H.. Akerlund. A. -C. and Mosbach. K. (1973) Determination of<br />
glucose, urea and penicillin using enzyme-pH-electrodes.<br />
Blochim. Biophys. Acta 320,529-534.<br />
Nilsson, K. and Mosbach. K. (1980) Preparation of immobilized animal<br />
cells.<br />
FEBS Lett. 118,145-150.<br />
Nilsson, K., Scheirer, W., Merten, O. -W., Ostberg, L., Liehl, E.. Katinger,<br />
H. W. D. and Mosbach, K. (1983) Entrapment of animal cells for the<br />
production of monoclonal antibodies and other biomolecules.<br />
Nature 302,629-630.<br />
Novick. A. and Szilard. L. (1950) Description of the chemostat.<br />
Science 112,715-716.<br />
241
Pardee, A. B. (1974) A restriction point for the control of normal animal<br />
cell proliferation.<br />
Proc. Natl. Acad. Sci. USA 71,1286-1290.<br />
Pardee, A. B., Dubrow, R., Hamlin, J. L. and Kletzeln, R. F. (1978) <strong>An</strong>imal<br />
cell cycle.<br />
<strong>An</strong>n. Rev. Biochem. 47,715-750.<br />
Pardee, A. B., Coppock. D. L. and Yang, H. C. (1986) Regulation of cell<br />
proliferation at the onset of DNA synthesis.<br />
J. Cell Scl. Suppl. 4,171-180.<br />
Pasieka, A. E., Morton, H. J. and Morgan, J. F. (1960) The metabolism of<br />
animal tissues cultivated in vitro IV. Comparative studies on human<br />
malignant cells.<br />
Cancer Res. 20,362-367.<br />
Petricciani, J. C. (1987) Should continuous cell lines be used as<br />
substrates for biological products.<br />
Develop. biol. Standard. 66,3-12. -<br />
Phillips, A. W., Ball, G. D., Fantes, K. H., Finter, N. B. and Johnston, M. D.<br />
(1985) Experience in the cultivation of mammalian cells on the 80001<br />
scale in: Large-Scale Mammalian Cell Culture (Feder, J. and Tolbert, W. R.<br />
eds. ) Academic Press, New York pp. 87-96.<br />
Phillips, H. A., Scharer, J. M., Bols, N. C. and Moo-Young, M. (1987) Effect<br />
of oxygen on antibody productivity in hybridoma culture.<br />
Biotech. Lett. 9,745-750.<br />
Prescott. D. M. and Bender, M. A. (1962) Synthesis of RNA and protein<br />
during mitosis in mammalian tissue culture cells.<br />
Exp. Cell Res. 26,260-268.<br />
Puck. T. T. (1964) Phasing, mitotic delay and chromosomal aberrations<br />
in mammalian cells. Science 144,565-566.<br />
Radlett, P. J.. Telling. R. C., Whiteside, J. P. and Maskell, M. A. (1972)<br />
The supply of oxygen to submerged cultures of BHK 21 cells.<br />
Blotechnol. Bioeng. 14,437-445.<br />
Ramabhadran. T. V. (1987) Products from genetically engineered<br />
mammalian cells : benefits and risk factors.<br />
Trends in Biotechnology 5,175-179.<br />
Ratafia, M. (1987) Mammalian cell culture: Worldwide activities and<br />
markets.<br />
Blo/Technology 5,692-694.<br />
Reagan, K. J., Wunner, W. H., Wiktor, T. J. and Koprowski, H. (1983)<br />
<strong>An</strong>ti-idiotype antibodies induce neutralizing antibodies to rabies virus<br />
glycoprotein.<br />
J. Virol. 48,660-666.<br />
242
Regan, D. H., Lavietes, B. B., Regan, M. G., Demopoulos, H. B. and Morris,<br />
H. P. (1973) Glutamate-mediated respiration In tumors.<br />
J. Natl. Cancer Institute 51,1013-1017.<br />
Reitzer, L. J., Wice, B. M. and Kennell, D. (1979) Evidence <strong>that</strong> glutamine,<br />
not sugar, is the major energy source for cultured HeLa cells.<br />
J. Biol. Chem. 254,2669-2676.<br />
Renard, J. M., Spagnoli, R., Mazier, C., Salles, M. F. and Mandine, E.<br />
(1988) Evidence <strong>that</strong> monoclonal antibody production kinetics is related<br />
to the Integral of the viable cells curve in batch systems.<br />
Biotech. Lett. 10,91-96.<br />
Renner, E. D., Plagemann, P. G. W. and Bernlohr, R. W. (1972) Permeation<br />
of glucose by simple and facilitated diffusion by Novikoff rat hepatoma<br />
cells in suspension culture and its relation to glucose metabolism.<br />
J. Biol. Chem. 247,5765-6776.<br />
Reuveny, S., Velez, D., Riske, F., Macmillan, J. D., and Miller, L. (1985)<br />
Production of monoclonal antibodies In culture.<br />
Develop. biol. Standard. 60,185-197.<br />
Reuveny, S., Velez, D., Macmillan, J. D. and Miller, L. (1986a) <strong>Factors</strong><br />
affecting cell growth and monoclonal antibody production in stirred<br />
reactors.<br />
J. Immunol. Methods 86.53-59.<br />
Reuveny, S., Velez, D., Miller. L. and Macmillan, J. D. (1986b) Comparison<br />
of cell propagation methods for their effect on monoclonal antibody yield<br />
In fermenters.<br />
J. Immunol. Methods 86,61-69.<br />
Reuveny, S., Lazar, A., Mlzrahl, A., Marcus, D., Shahar, A. and Epstein,<br />
N. (1987a) Carcinoembryonic antigen (CEA) production in low protein<br />
growth medium In: Modern Approaches to <strong>An</strong>imal Cell Technology (Spier,<br />
R. E. and Griffiths, J. B., eds. ) Butterworths, London pp. 724-737.<br />
Reuveny, S., Velez, D., Macmillan, J. D. and Miller, L. (1987b) <strong>Factors</strong><br />
affecting monoclonal antibody production in culture.<br />
Develop. biol. Standard. 66,169-175.<br />
Rhodes, M. and Birch, J. R. (1988) Large-scale production of proteins<br />
from mammalian cells.<br />
Blo/Technology 6,518-522.<br />
Riechuran, L., Clark, M., Waldmann, H. and Winter, G. (1988) Reshaping<br />
human antibodies for therapy.<br />
Nature 332,323-327.<br />
Ringold, G., Dieckmann, B. and Lee, F. J. (1981) Co-expression and<br />
amplification of dihydrofolate reductase cDNA and Escherichla coil<br />
xGPRT gene in Chinese hamster ovary cells.<br />
Mol. Appl. Genet. 1,165-175.<br />
243
Roberts, R. S., Hsu, H. W., Lin, K. D. and Yang, T. J. (1976) Amino acid<br />
metabolism of myeloma cells in culture.<br />
J. Cell Sc!. 21,609-615.<br />
Roedere, J. E., and Bastlaans, G. J. (1983) Microgravimetric immunoassay<br />
with piezoelectric crystals.<br />
<strong>An</strong>al. Chem. 55,2333-2336.<br />
Roos, D. and Loos, J. A. (1973) Changes in the carbohydrate metabolism<br />
of mitogenically stimulated human peripheral lymphocytes II. Relative<br />
importance of glycolysis and oxidative phosphorylation on<br />
phytohaemagglutinin stimulation.<br />
Exp. Cell Res. 77,127-135.<br />
Rous, P. and Jones, F. S. (1916) A method for obtaining suspensions of<br />
living cells from the fixed tissues, and for the plating out of individual<br />
cells.<br />
J. Exp. Med. 23,549-555.<br />
Roux, W. (1885) Beitrage zur entwicklungsmechanik<br />
Z. Biol (Munich) 21,411-524.<br />
des embryo.<br />
Rubenstein, K. E., Schneider, R. S. and Ullman, E. F. (1972)<br />
"Homogeneous" enzyme immunoassay: A new immunochemical technique.<br />
Blochem. Blophys. Res. Commun. 47,846-851.<br />
Rupp, R. G. (1985) Use of cellular microencapsulation in large-scale<br />
production of monoclonal antibodies in: Large-Scale Mammalian Cell<br />
Culture (Feder, J. and Tolbert, W. R.. eds. ) Academic Press, New York pp.<br />
19-38.<br />
Sadowski, P. L. (1982) European Patent Application EPO 077734A2.<br />
Salzman, N. P., Eagle, H. and Sebring, E. D. (1958) The utilization of<br />
Blutamine, glutamic acid and ammonia for the biosynthesis of nucleic<br />
acid bases in mammalian cell cultures.<br />
J. Biol. Chem. 230,1001-1012.<br />
Schaap. G. H., van der Kamp, A. W., Ory, F. G. and Jongkind, J. F. (1979)<br />
Isolation of anucleate cells using a fluorescence activated cell sorter<br />
(FACS II).<br />
Exp. Cell Res. 122,422-426.<br />
Scharff, M. D. and Robbins, E. (1965) Synthesis of ribosomal RNA in<br />
synchronised HeLa cells.<br />
Nature 208,464-466.<br />
Scharff. M. D. and Robbins, E. (1966) Polyribosome disaggregatlon during<br />
metaphase.<br />
Science 151,992-995.<br />
Scheper, Th., Hoffmann, H. and Schugerl, K. (1987) Flow cytometric<br />
studies during culture of Saccharomyces cerevislae.<br />
Enzyme Microb. Technol. 9,399-405.<br />
244
Schiff, S. 0. (1965) Ribonucleic acid synthesis in neuroblasts of<br />
Chortophaga viridifasciata (de Geer) as determined by observations of<br />
individual cells in the mitotic cycle.<br />
Exp. Cell Res. 40,264-276.<br />
Schliermann, M., Beckers, C. and Miltenburger, H. G. (1987) Cell cycle<br />
analysis by flow cytometry in an antibody secreting cell line.<br />
Develop. biol. Standard. 60,101-109.<br />
Schlom, J. and Weeks, M. O. (1985) Important Advances in Oncology<br />
(DeVita, V. T., Hellman, S. and Rosenberg, S. A., eds. ) J. B. Lippincott Co.<br />
pp. 170-189.<br />
Schonherr. 0. T., van Gelder, P. T. J. A., van Hees, P. J., van Os, A. M. M.<br />
and Roelofs. H. W. M. (1987) A hollow fibre dialysis system for the In<br />
vitro production of monoclonal antibodies replacing in vivo production<br />
in mice.<br />
Develop. biol. Standard. 66,211-220.<br />
Schoolwerth, A. C. and Lanoue, K. F. (1980) The role of<br />
microcompartmentation in the regulation of glutamate metabolism by rat<br />
kidney mitochondria. J. Biol. Chem. 255,3403-3411.<br />
Schumperli, D. (1986) Cell-cycle regulation of histone gene expression.<br />
Cell 45,471-472.<br />
Scott, F. M., Sator de Serrano, V. and Castellino, F. J. (1987) Appearance<br />
of plasminogen activator activity during a synchronous cycle of a rat<br />
adenocarcinoma cell line, PA-Ill.<br />
Exp. Cell Res. 169,39-46.<br />
Seaver, S. S., Rudolph. J. L. and Gabriels, J. E. (1984) A rapid HPLC<br />
technique for monitoring amino acid utilization in cell culture.<br />
BioTechniques 2.254-260.<br />
Seaver, S. S. and Gabriels, J. E. (1985) A membrane-based system for<br />
the continuous production of monoclonal antibody in culture.<br />
Hybridoma 4,64.<br />
Secher, D. S. and Burke, D. C. (1980) A monoclonal antibody for<br />
large-scale purification of human leukocyte interferon.<br />
Nature 285,446-450.<br />
Sharath. M. D.. Rindernecht, S. B. and Weller, J. M. (1984) Human<br />
immunoglobulin synthesis in serum-free medium.<br />
J. Lab. Clin. Med. 103,739-748.<br />
Shields, R., Brooks, R. F., Riddle, P. N., Capellaro, D. F. and Delia, D.<br />
(1978) Cell size, cell cycle and transition probability in<br />
mouse -fibroblasts.<br />
Cell 15,469-474.<br />
Shoham, J. (1983) Production of human immune interferon in: Advances<br />
in Biotechnological Processes, vol 2 (Mizrahl, A. and van Wezel, A. L.,<br />
eds. ) Alan R Liss, New York pp. 209-269.<br />
245
Sinclair, R. (1980) Glucose metabolism and dehydrogenase activities in<br />
the cytosol and mitochondrion of mouse LS cells in chemostat culture.<br />
In Vitro 16,1076-1084.<br />
Smith, J. A.. Hurrell, J. G. R. and Leach, S. J. (1978) Elimination of<br />
nonspecific adsorption of serum proteins by Sepharose-bound antigens.<br />
<strong>An</strong>al. Biochem. 87.299-305.<br />
Sonenshein, G. E. and Brawerman, G. (1976) Differential translation of<br />
mouse myeloma messenger RNAs in a wheat germ cell-free system.<br />
Biochemistry 15,5501-5506.<br />
Spier. R. E. (1983) Production of veterinary vaccines in: Advances in<br />
Biotechnological Processes, vol 2 (Mizrahi, A. and van Wezel, A. L., eds)<br />
Alan R Liss, New York pp. 33-59.<br />
Spier, R. E. (1983) Modern approaches to vaccines- a report of a Cold<br />
Spring Harbor conference in modern approaches to vaccines Aug 1983.<br />
Vaccine 1,53-54.<br />
Spier, R. E. (1988) <strong>An</strong>imal cells in culture : moving into the exponential<br />
phase.<br />
Trends in Biotechnology 6,2-6.<br />
Spier, R. E. and Horaud, F. (1985) The biotechnological future for animal<br />
cells in culture in: <strong>An</strong>imal Cell Biotechnology, Vol 2. (Spier, R.<br />
E., and Griffiths, J. B., eds) Academic Press, London, pp. 431-458.<br />
Stambrook, P. J. and Sisken, J. E. (1972) Induced changes in the rates of<br />
urldine-3H uptake and incorporation during the G1 and S periods of<br />
synchronized Chinese hamster cells.<br />
J. Cell Biol. 52,514-525.<br />
Stoner, G. D. and Merchant, D. J. (1972) Amino acid utilisation by LM<br />
mouse cells in a chemically defined medium.<br />
In Vitro 7,330-343.<br />
Stubblefield, E. (1968) Synchronisation methods for mammalian cell<br />
culture In: Methods in Cell Physiology (Prescott, D. M., ed. ) Academic<br />
Press. New York pp. 25-43.<br />
Sutherland, R. M., Dahne, C. and Place, J. (1984) Preliminary results<br />
obtained with a no-label, homogeneous, optical Immunoassay for human<br />
immunoglobulin G.<br />
<strong>An</strong>al. Lett. 17,43-53.<br />
Takahashi, M., Yagi, Y., Moore, G. E. and Pressman, D. (1969)<br />
Immunoglobulin production in synchronised cultures of human<br />
haematopoletic cell lines 1. Variation of cellular immunoglobulin level<br />
with the generation cycle.<br />
J. Immunology 103,834-843.<br />
Talle, M. A., Allecar, N.. Makowski, M., Rae, P. E., Mittler, R. S. and<br />
Goldstein, G. (1983)<br />
Diagn. Immunol. 1,129-135.<br />
246
Tanno, Y., Aral, S. and Takishima, T. (1982)<br />
J. Immunol. Methods 52,255-261.<br />
Telling, R. C. and Elsworth, R. (1965) Submerged culture of hamster<br />
kidney cells in a stainless steel vessel.<br />
Biotechnol. Bioeng. 7,417-434.<br />
Terasima, T. and Tolmach, L. J. (1963) Growth and nucleic acid synthesis<br />
in synchronously dividing populations of HeLa cells.<br />
Exp. Cell Res. 30,344-362.<br />
Tharakan, J. P. and Chau, P. C. (1986a) IgG production kinetics in serum<br />
free media.<br />
Biotech. Lett. 8.529-534.<br />
Tharakan, J. P. and Chau, P. C. (1986b) Operation and pressure<br />
distribution of immobilized cell hollow fiber bloreactors.<br />
Biotechnol. Bioeng. 28,1064-1071.<br />
Tharakan, J. P. and Chau, P. C. (1986c) A radial flow hollow fiber<br />
bloreactor for the large-scale culture of mammalian cells.<br />
Blotechnol. Bioeng. 28,329-342.<br />
Tharakan, J. P., Lucas, A. and Chau, P. C. (1986) Hybrldoma growth and<br />
antibody secretion in serum-supplemented and low protein serum-free<br />
media.<br />
J. Immunol. Methods 94,226-235.<br />
Tolbert, W. R., Lewis. C., White, P. J. and Feder, J. (1985) Perfusion<br />
culture systems for production of mammalian cell biomolecules in:<br />
Large-Scale Mammalian Cell Culture (Feder, J. and Tolbert, W. R., eds. )<br />
Academic Press, New York pp. 97-124.<br />
Toole, J. J., Knoopf, J. L., Wozney, J. M., Sultzman, L. A., Buecker, J. L.,<br />
Pittman, D. D., Kaufman, R. D., Brown, E., Shoemaker, C. Orr, E. C.,<br />
Amphlett, G. W., Foster, W. B., Coe, M. L., Knutson, G. J., Foss, D. N. and<br />
Hewick, R. M. (1984) Molecular cloning of a cDNA encoding human<br />
antihemophilic<br />
factor.<br />
Nature 312,342-347.<br />
Tovey, M. G., Mathison, G. E. and Pirt, S. J. (1973) The production of<br />
interferon by chemostat cultures of mouse LS cells grown in<br />
chemically-defined, protein-free medium.<br />
J. Gen. Virol. 20,29-35.<br />
Tovey. M. and Brouty-Boye, D. (1976) Characteristics of the chemostat<br />
culture of murine leukemia L1210 cells.<br />
Exp. Cell Res. 101,346-354.<br />
Tovey, M. G. (1980) The cultivation of animal cells in the chemostat:<br />
Application to the study of tumor cell multiplication.<br />
Adv. Cancer Res. 33,1-37.<br />
247
Trowbridge, I. S. and Omary, M. B. (1981) Human surface glycoprotein<br />
related to cell proliferation is the receptor for transferrin.<br />
Proc. Natl. Acad. Sci. USA 78,3039-3043.<br />
Turner. K. J., Plozza, T. M. and Holt, P. G. (1985) Cell cycle-dependent<br />
fluctuations in IgE secretion in a human myeloma line.<br />
Clin. Immunol. Immunopath. 36,212-216.<br />
Vallera, D. A., Youle, R. J., Neville, D. M. and Kersey, J. H. (1982) Bone<br />
marrow translplantation across major histocompatibill ty barriers V.<br />
Protection of mice from lethal graft-vs-host disease by pretreatment of<br />
donor cells with monoclonal anti-Thy-1.2 coupled to the toxin ricin.<br />
J. Exp. Med. 155,949-954.<br />
Van Hemert. P., Kilburn, D. G. and van Wezel, A. L. (1970) Homogeneous<br />
cultivation of animal cells for the production of virus and virus<br />
products.<br />
Biotechnol. Bioeng. 11,875-895.<br />
Van Wauwe, J. and Goosens, J. (1981) <strong>Monoclonal</strong> anti-human<br />
T-lymphocyte antibodies: Enumeration and characterisation of T-cell<br />
subsets.<br />
Immunology 42,157-164.<br />
Van Wezel, A. L., van der Marel, P., van Beversen, C. P., Verma, I., Salk,<br />
P. L. and Salk, J. (1982) Detection and elimination of cellular nucleic<br />
acids in biologicals produced on continuous cell lines.<br />
Develop. biol. Standard. 50,59-69.<br />
Van Wezel, A. L. van der Velden de Groot, C. A. M., de Haan, H. H., van<br />
den Heuvel, N. and Schasfoort, R. (1985) Large scale animal cell<br />
cultivation for production of cellular biologicals.<br />
Develop. biol. Standard. 60,229-236.<br />
Velez, D.. Reuveny, S., Miller, L. and Macmillan, J. D. (1986) Kinetics of<br />
monoclonal antibody production in low serum growth medium.<br />
J. Immunol. Methods 86,45-52.<br />
Visek, W. J., Kolodny, G. M. and Gross, P. R. (1972) Ammonia effects in<br />
cultures of normal and transformed 3T3 cells.<br />
J. Cell. Physiol. 80,373-382.<br />
Vitetta, E. S., Fulton, R. J.. May, R. D., Till, M. and Uhr, J. W. (1987)<br />
Redesigning natures poisons to create anti-tumor reagents.<br />
Science 238,1098-1104.<br />
Voak, D. and Lennox, E. S. (1983)<br />
Biotest Bulletin 4,281-290.<br />
Warburg, 0. and Kubowitz, F. (1927) Stoffwechsel wachsender zellen.<br />
Biochem. Z. 189,242-248.<br />
Warburg, 0. (1930) The metabolism of tumours. Constable, London.<br />
248
Warburg, 0. (1956) On the origin of cancer cells.<br />
Science 123,309-314.<br />
Watanabe, S., Yagi, Y. , and Pressman, D. (1973) Immunoglobulin<br />
production in synchronised cultures of human hematopoletic cell lines<br />
II. Variation of synthetic and secretion activities during the cell cycle.<br />
J. Immunol. 111,797-804.<br />
Waymouth, C. (1981) Requirements for serum-free growth of cells:<br />
Comparison of currently available defined media in: The Growth<br />
Requirements of Vertebrate Cells in vitro (Waymouth, C., Ham, R. G. and<br />
Chapple, P. J.. eds. ) Cambridge University Press, London pp. 33-47.<br />
Weetall, H. H. (1976) Covalent coupling methods for Inorganic support<br />
materials in: Methods in Enzymology, vol 44. (Jakoby, W. B. and Pastan,<br />
I. H., eds. ) Academic Press, New York pp.<br />
Westerwoudt. R. J. (1986) <strong>Factors</strong> affecting production of monoclonal<br />
antibodies in Methods in Enzymology. vol 121. (Langone. J. and van<br />
Vunakis, H. eds. ) Academic Press, London pp. 3-18.<br />
Westwood, J. T., Wagenaar, E. B. and Church, R. B. (1986) Synthesis of<br />
unique low molecular weight proteins during late G2 and mitosis.<br />
J. Biol. Chem. 260,695-698.<br />
White, P. R. (1949) Prolonged survival of excised animal tissues in<br />
nutrients of precisely known constitution.<br />
J. Cell Comp. Physiol. 34,221-241.<br />
Wice, B. M., Reitzer, L. J. and Kennett, D. (1981) The continuous growth<br />
of vertebrate cells in the absence of sugar.<br />
J. 8101. Chem. 256,7812-7819.<br />
Wiemann, M. C., Ball, E. D., Fanger. M. W., Dexter, D. L., McIntyre, 0. R.,<br />
Brnier, G. and Calabresi, P. (1983) Human and murlne hybridomas: Growth<br />
and monoclonal antibody production in the artificial capillary culture<br />
system.<br />
Clin. Res. 31,611A.<br />
Wiktor. T. J. and Koprowski, H. (1978) <strong>Monoclonal</strong> antibodies against<br />
rabies virus produced by somatic cell hybridization: detection of<br />
antigenic variants. Proc. Natl. Acad. Scl. USA 75,3938-3942.<br />
Williams, D. C., Van Frank, R. M.. Muth, W. L. and Burnett, J. P. (1982)<br />
Cytoplasmic inclusion bodies In Escherichla cola producing biosynthetic<br />
human insulin proteins.<br />
Science 216,687-688.<br />
Wilson, M. B. and Nakane. P. K. (1976) The covalent coupling of proteins<br />
to periodate-oxidised Sephadex: A new approach to immunoadsorbent<br />
preparation.<br />
J. Immunol. Methods 12,171-181.<br />
249
Wood, C. R., Boss, M. A., Kenten, J. H., Calvert, J. E., Roberts, N. A. and<br />
Emtage, J. S. (1985) The synthesis and In vivo assembly of functional<br />
antibodies in yeast. Nature 314,446-449.<br />
Wood. W. I., Capon, D. J., Simonsen, C. C., Eaton, D. L., Glteschier<br />
, If.,<br />
Keyt, B., Seeburg, P. H., Smith, D. If., Hollingshead, P.,, Wion, K. L.,<br />
Delaware, K., Tuddenham, G. D., Vehar, G. A. and Lawn, R. M. (1984)<br />
Expression of active human factor VIII from recombinant DNA clones.<br />
Nature 312,330-337.<br />
Wright, A. F., Green, T. P. and Smith, L. L. (1987) The development of<br />
mouse monoclonal antibodies <strong>that</strong> bind and neutralize paraquat.<br />
Develop. blol, Standard. 66,496-601.<br />
Wynford-Thomas, D., Lamontagne, A., Marin, G. and Prescott, D. M.<br />
(1985) Location of the isoleucine arrest point In CHO and 3T3 cells.<br />
Exp. Cell Res. 168,625-632.<br />
Xeros, N. (1962) Deoxyriboside control and synchronisation of mitosis.<br />
Nature 194,682-683.<br />
Yabe, N., Kato, M., Matsuya, Y., Yamane, I., Izuka, M., Takayoshl, H. and<br />
Suzuki, K. (1987) Role of iron chelators in growth-promoting effect on<br />
mouse hybridoma cells in a chemically defined medium.<br />
In Vitro 23,816-820.<br />
Youle, R. J. and Neville, D. M. (1980) <strong>An</strong>ti-Thy-1.2 monoclonal antibody<br />
linked to ricin is a potent cell-type-specific toxin.<br />
Proc. Natl. Acad. Scl. USA 77,6483-6486.<br />
Zetterberg, A. and Engstrom, W. (1981) Glutamine and the regulation of<br />
DNA replication and cell multiplication In fibroblasts.<br />
J. Cell. Physiol. 108,365-373.<br />
Zetterberg, A. and Killander, D. (1965) Quantitative cytophotometric and<br />
autoradlographic studies on the rate of protein synthesis during<br />
interphase in mouse fibroblasts In vitro.<br />
Exp. Cell Res. 40,1-11.<br />
Zielke, H. R., Ozand, P. T., Tildon, J. T., Sevdallan, D. A. and Cornblath,<br />
M. (1978) Reciprocal regulation of glucose and Blutamine utilization by<br />
cultured human diploid fibroblasts.<br />
J. Cell. Physiol. 95,41-48.<br />
Zlelke, H. R., Sumbilla, C. M., Sevdallan, D. A., Hawkins, R. L. and Ozand,<br />
P. T. (1980) Lactate: a major product of glutamine metabolism by human<br />
diploid fibroblasts.<br />
J. Cell. Physiol. 104,433-441.<br />
Zimmerman, U., Vienken, J., Halfmann, J. and Emels, C. C. (1986)<br />
Electrofuslon, a novel hybridization technique In: Advances In<br />
Biotechnological Processes, vol 4 (Mizrahl, A. and van Wezel, A. L., eds. )<br />
Alan R Liss, New York pp. 79-94.<br />
260
NTT<br />
t, 2 V;;<br />
endie Sole od 113terface.<br />
Solenoid Interface<br />
12V Power Supply<br />
Solenoid Switching Unit<br />
251<br />
I<br />
regulator 7812<br />
4700uF 0.22 0.47<br />
solenoids<br />
(00006<br />
1ý<br />
+12V<br />
ov<br />
a. R kn<br />
v led'"
Appendix II. Automated ELISA control program.<br />
10 REM P. M. Hayter 1/11/85<br />
20 REM Online assay control program<br />
30<br />
40<br />
50 REM Set variables. Dimension arrays-Set up screen<br />
60 no% i<br />
70 DIM data(200)tDIM number%(100)tDIM time%(100)sDIM reading(100)<br />
80 MODE4, COLOUR 131tCOLOUR 0<br />
90<br />
100 REM Load graphics dump routine<br />
110 *LOAD"DUMP"<br />
120<br />
1ti0 REM Set all lines on user port for output<br />
140 PROCuser<br />
150<br />
160 REM Set up spectrophotometer<br />
170 PROCspec<br />
180<br />
190 REM Start routine<br />
200 PROCdetails<br />
210 PROCfi1e<br />
220 PROCgo<br />
230<br />
240 REM Control routine to switch solenoid valves and assay sample<br />
250 ON ERROR GOTO 326J<br />
260 PROCsampletF'ROCabsorb<br />
270<br />
280 REM Calculate peak area and store data<br />
290 PROCvalue<br />
300 PROCsavetPROCdelay(2)<br />
310<br />
320 REM Update graph showing progress of the culture<br />
330 FROCplot: PROCelute<br />
340<br />
350 REM Return to start of sequence<br />
360 no%-no%+i: GOT0260<br />
370<br />
380<br />
390 DEFFROCspec<br />
400 PROCcalibrate<br />
410 PROCsetup<br />
420 ENDFROC<br />
4Z0<br />
440<br />
450 DEFPROCsutup<br />
460 VDU121PRINT 7Aß(6.10)"Setting up spectrophotomettr"IFRINT TAE'1ýý12)"Flýeat<br />
e wait"<br />
470 PROCinitialisesFRCCdelav(2)<br />
480 commandt="W. 405"<br />
490 FROCsend(commandt)sF'RDCdelay(20)<br />
500 command$-"REF. "tPRCCsend(commandt)%PROCdolay(1)<br />
510 ENDFROC<br />
520<br />
530<br />
540 DEFPROCinitialise<br />
550 "FX7,2<br />
560 *FX8,2<br />
570 *FX2,0<br />
S8') *FX166,1,252<br />
590 ENDF*RCC<br />
252
-60o<br />
610<br />
620 DEFF'ROCsend(command. t)<br />
670 "FX:. 7<br />
640 PRINT command$; CHR$(10)i<br />
66O "FX3, O<br />
660 ENDPROC<br />
670<br />
680<br />
690 DEFPROCdelay(interva1%)<br />
700 time7. TIME+(100"intervwl%)<br />
710 REPEAT<br />
720 UNTIL TIME>time%<br />
730 ENDFROC<br />
740<br />
750<br />
760 DEFPROCwrvia(address%. valuv%)<br />
770 address%-address% AND &FF<br />
780 IF (address%&6F) THEN ENDFROC<br />
790 A%n&973X%-address%tY%wvalue'I. tCALL &FFF4<br />
800 ENDPROC<br />
810<br />
820<br />
8Z0 DEFF'ROCuser<br />
840 F'ROCwrvia(L<br />
11: 0 DEFF'ROCf ile<br />
1140 PRINT TAB(1.20)"Enter filename fo" data storage "tINPUT TAB(16,22)f1let<br />
1160 IF LEN(filei)>6 THEN VDU7sPRINT TAB(16,22)" "tGOTO 1140<br />
1100 IF filet-""THEN ENDPROC<br />
1170 ON ERROR GOTO 1240<br />
1180 channel-OPENIN filet<br />
1190 INFUT£channel, ES, E$, ES, ES<br />
1200 CLOSE channel<br />
1210 PRINT TAS(1,20)"** FILE IN USE-ENTER NEW NAME "*"1PRINT TA8(16.22)"<br />
1220 PROCdeley()<br />
1250 GOTO 1140<br />
1240 IF EFR222 THEN REFORTsON E'nF0 OF=iGOTO 210<br />
263
1250 ON EKRUR OFF<br />
1260 channel-OF"ENOUTfilet<br />
1270 PRINTEchannel, datet. timet. meds. dil$. cell*<br />
1280 GOTO 220<br />
1290<br />
1300<br />
1310 DEFPRDCgo<br />
1320 VDU12sINFUT TAS(5910)"Press RETURN to start sampling "AS<br />
1330 IFA$1"I THEN VDU7sGOT0 1320<br />
13 0 VDU12iT%=TIME<br />
1360 ENDPROC<br />
1370<br />
1380<br />
1390 DEFPROCsample s<br />
1400<br />
1410 REM Sample from vessel<br />
1420 PRINTsFRINT TAB(15)"Sampling vessel"<br />
1430 PROCwrvia(&60. &C3)<br />
1440 PROCdelay(SO)<br />
1450<br />
1460 REM Sample onto column<br />
1470 VDU12iPRINTsPRINT TA6(12)"Sample onto column"<br />
1480 PROCwrvia(&60. &20)<br />
1490 PROCdelay(30)<br />
1200<br />
1510 REM Conjugated antiserum onto column<br />
1520 VDUI2IPRINTIPRINT TAS(10)"<strong>An</strong>tiserum onto column"<br />
15; 0 PROCwrvia(&60. $. 27)<br />
1540 PROCdelay(20)<br />
1550<br />
1560 REM Buffer wash<br />
1570 VDU12sF'RINTtPRINT TAB(1S)"Suffer wash"<br />
1630 PROCwrvia(&60. &20)<br />
1690 PROCdelay(Z. 0)<br />
1600<br />
1610 REM Substrate onto column<br />
1620 VDUI2zPRINTsPRINT TAE(12)"Substrate onto column"<br />
1630 PROCwrvia(&60. &28)<br />
1640 PROCdelay(45)<br />
1650<br />
1660 REM React for 10 minutes<br />
1670 VDUI2iPRINTsPRINT TAb(16)"Substrate reaction"<br />
1680 PROCwrvia(&60. &A0)<br />
1690 PROCdelay(Z)<br />
1700<br />
1710 REM Buffer on<br />
1720 VDUI2sPRINTsPRINT TA9(15)"Reading absorbance"<br />
1730 PROCwrvia(&60, L
1920 8s=M1Dz'AS, 14, s)sdata(l)"VAL(B$)<br />
19-'0 *FX3,0<br />
1940 *FX2,0<br />
1950 ENDPRCC<br />
1960<br />
1970<br />
1950 DEFPROCvalue<br />
1990 a-Otmax-0<br />
2000 FOR I-1TOS0<br />
2010 a-data(I)<br />
2020 IF a>max THEN max-atpeak%-I<br />
2030 NEXT<br />
2040 FOR Impeak%-5 TO peak'!. -lsmax-max+data(I)sNEXT<br />
2050 FOR I=peak;: +1 TO peak7.. +5smax max+dataýI)sNEXT<br />
2060 reading(no%)-maxtr-max<br />
2070 ENDPROC<br />
2080<br />
2090<br />
2100 DEFPROCsav!<br />
2110 PRINT"Saving data"<br />
2120 time%(no%)-TIME-T%tt . time;: (no'l. )<br />
211-0<br />
2140<br />
n%. -no':<br />
PRINT£channel. n`/., t%, r<br />
2150<br />
2160<br />
2170<br />
ENDF"ROC<br />
2180<br />
2190<br />
DEFPRCCelute<br />
22t: 0 REM Elute with 3M NaSCN<br />
2210 PRINTsPRINT TAB(15)"Regenerating column"<br />
2220 PROCwrvia(&60, &. 3)<br />
22,0<br />
2240<br />
PRCCdelay(180)<br />
2250<br />
2260<br />
2270<br />
REM Wash with buffer<br />
PRINTtPRINT TAB(15)"Buffer<br />
PROCwrvia(w60. &20)<br />
wash"<br />
2280 PROCdelay(600)<br />
2290<br />
2300<br />
2310<br />
ENDPROC<br />
2320 DEFF"ROCmenu<br />
23.30 CLOSE£0<br />
2.3.40 VDU26.12iF"RINT TAB(2,5)"1. Ftle catalogue"<br />
2350 PRINT TAB(2,6)"2. Recall data"<br />
2360 PRINT TAB(2,7)"3. Plot data"<br />
2370 PRINT TAB(2,8)"4. Print graph"<br />
2380 PRINT TAB(2,9)"S. Restart program"<br />
2390 PRINT TAB(2,10)"6. Exit program"<br />
2400 PRINT TAB(2,20)"Current files"; filet<br />
2410 INPUT TAB(5,15)"Which"IA<br />
2420 ON A GOTO 24.30,2450,2470,2490,2600,2510<br />
2470 VDU121*.<br />
2440 PRINT TAB(5,20)"Press return for menu"sINFUT8IsIF D$-"" THEN 2340<br />
2450 PROCrecall<br />
2460 PRINT TAB(6920)"Press return for menu"sINPUTb$1IF 6i "" THEN 2340<br />
2470 PROCplot<br />
2480 PRINT TAB(5.1)"Press return for menu" iINPUTBtt IF @ts"" THEN 21.40<br />
2490 PROCprinttGOTO 2340<br />
2500 PROCrestartsENDPROC<br />
2510 VDUI2sPRINT TAB(20,10)"** END OF PROGRAM **"LEND<br />
2520 ENDF"ROC<br />
2530<br />
2540<br />
2550 DEFF'ROCrecal1<br />
2560 ON ERROR GOTO 3330<br />
2570 LOCAL Ill-l<br />
265
2580 VDUI2: PRINT TAr(14.10)"Enter filename": INPUT TAB(18.12)stcre$<br />
2--90 IF LEN(storeS)>6 THEN VDU7: GOTO2530<br />
2600 IF stores="" THEN ENDFGOC<br />
2610 channel=CPENIldstoret<br />
2620 INF, UT£channel. date$, timei, med1, dil$, cell3<br />
2630 REPEAT: INPUT£channel, number%(I), time%(I), reading(I): I=I+1: UNTIL EOF£channe<br />
1<br />
2640 CLOSE£channel: no'%=number%(I)SPRINT TAE+(10,15)"Data loaded"<br />
2650 ENDPROC<br />
2660<br />
2670<br />
2680 DEFPROCplot<br />
2690 PROCaxes<br />
2700 PROCdraw<br />
2710 ENDPROC<br />
2720<br />
2730<br />
2740 DEFPROCaxes<br />
2750 VDU28,0,31; 39,28: GCOL0,128: GCOL0,3: VDU16,12<br />
2760 MCVE260,31C: DRAW! 260,313: DRAW1260,1013sDRAW260,1013: DRAW260,313<br />
2770 FOR I=260TO1260STEP200: MOVE I, 313: DRAW I, 3Z0: MOVE I, 996; DRAW I, 1013: NEXT<br />
2780 FOR I=313TDIOIZSTEP140: MOVE260, I: DR.; W277,1: MOVE1260, I: DRAW124'-, I: NEXT<br />
2790 tmax%=(time'l. (no'! ))/360000: IF tmax%
3210<br />
32-10<br />
3240<br />
3250<br />
3260<br />
3270<br />
3280<br />
3: QV<br />
33100<br />
3310<br />
3320<br />
=30<br />
3340<br />
3350<br />
3360<br />
3270<br />
3x80<br />
3390<br />
3400<br />
3410<br />
DEFFR, OCrestart<br />
no%=ä<br />
ENDF"ROC<br />
REM *** Escape routine ***<br />
IF ERR17 THEN 3320<br />
VDU26,12<br />
PRCCmenu<br />
PROCelute<br />
ON ERROR OFF: GOTO 200<br />
PRINT TAB(2.10)"Error "; ERR; " at line "; ERL: REPORTzGOTO 3280<br />
REM *** Disc errors ***<br />
IF ERR=222 THEN E. $="**FILE NOT ON DISC-": E1$="ENTER AGAIN**"sGOTO 3400<br />
IF ERR=190 THEN ES="**CATALOGUE FULL-' GOTO 3390<br />
IF<br />
IF<br />
ERR=191<br />
ERR=198<br />
THEN ES="**DISC<br />
THEN ES '**DISC<br />
FULL-'aGOTO<br />
FULL-"<br />
3390<br />
4.<br />
IF ERR198 THEN REPORT: PRINT ERR: PRINT ERL%GOTOZ41O<br />
E1*="USE NEW DISC**"<br />
VDU7: PRINT TAB(2.1O)Et;: PRINT E13<br />
PROCdelay(5): ON ERROR OFF300TO 3290<br />
257
Appendix III Cross-flow filter<br />
iý<br />
ococo<br />
o- 4==b<br />
oo c==p<br />
o co 0o cý<br />
00ov<br />
I==<br />
Filtrate<br />
258<br />
i<br />
Silicone 0-ring<br />
0.22 pm fitter<br />
Fitter support<br />
Medium<br />
flow
Appendix IV. The determination of the volumetric mass transfer<br />
coefficient (KL a) for oxygen in the Gallenkamp fermenter.<br />
The volumetric mass transfer coefficient for 02 can be calculated<br />
by depleting the fermenter of oxygen by flushing with nitrogen and<br />
observing the rate of oxygen transfer when the oxygen supply is<br />
restored.<br />
The relationship between K,. a and the rate of oxygen transfer is<br />
described by the following equation:<br />
-KLat = ln(C, at - Ct)<br />
where Cs at is the oxygen concentration at air saturation and Ct is the<br />
oxygen concentration at time t. Thus Ki. a can be derived from a plot of<br />
ln(Cs at - Ct) versus time where -KL a is equal to the slope of the<br />
resulting graph.<br />
The graph below shows the determination of KL a for the<br />
Gallenkamp fermenter at stirrer speeds of 35 and 100 rpm. The fermenter<br />
contained 500m1 RPMI 1640 and the headspace was gassed with air at<br />
3litres/h. These determinations were carried out at 370 C using a<br />
Gallenkamp galvanic oxygen probe.<br />
259
u<br />
ä<br />
2.0<br />
1-8<br />
1.6<br />
1.4<br />
1.2<br />
1.0<br />
0.6<br />
0.4<br />
0.2<br />
0<br />
-0.2<br />
-0.4<br />
Kea determination in the Gallenkamp<br />
fermenter<br />
260<br />
U IVERSf1Y<br />
OF<br />
SUB<br />
BEY<br />
Lil it<br />
2.5