Drainage Overview - Maricopa County Department of Transportation
Drainage Overview - Maricopa County Department of Transportation
Drainage Overview - Maricopa County Department of Transportation

You also want an ePaper? Increase the reach of your titles
YUMPU automatically turns print PDFs into web optimized ePapers that Google loves.
TABLE OF CONTENTS<br />
DRAINAGE OVERVIEW<br />
1. INTRODUCTION .................................................................................................................................. 1<br />
1.1 Background and Study Need ......................................................................................... 1<br />
1.2 Study Area ...................................................................................................................... 2<br />
1.3 Document Purpose and Scope ....................................................................................... 2<br />
1.4 Design <strong>Drainage</strong> Criteria ............................................................................................... 2<br />
2. EXISTING STUDIES AND OTHER DATA SOURCES ............................................................................. 4<br />
2.1 Summary <strong>of</strong> <strong>Drainage</strong> Studies ...................................................................................... 4<br />
2.2 Summary <strong>of</strong> Other <strong>Drainage</strong> Documents and Data .................................................... 6<br />
3. WATERSHED FEATURES .................................................................................................................... 8<br />
3.1 Topography and Geology .............................................................................................. 8<br />
3.2 Soils .................................................................................................................................. 8<br />
3.3 Existing and Future Land Use .................................................................................... 11<br />
3.4 Flooding Hazards ......................................................................................................... 12<br />
3.5 Potentially Impacted Existing <strong>Drainage</strong> Structures .................................................. 16<br />
4. EXISTING HYDROLOGY ................................................................................................................... 19<br />
4.1 Summary <strong>of</strong> Hydrology Methods ................................................................................ 19<br />
4.2 Offsite Hydrology Results ............................................................................................ 23<br />
5. SUMMARY AND CONCLUSIONS ........................................................................................................ 25<br />
091337137, 2011-018, TT005 <strong>Maricopa</strong> <strong>County</strong> <strong>Department</strong> <strong>of</strong> <strong>Transportation</strong><br />
Technical Memorandum 3 Deer Valley Parkway Feasibility Study<br />
<strong>Drainage</strong> <strong>Overview</strong> i April 2012
LIST OF FIGURES<br />
TABLE OF CONTENTS<br />
DRAINAGE OVERVIEW<br />
Figure 1 – Study Area ................................................................................................................................ 3<br />
Figure 2 – Area <strong>Drainage</strong> Studies .............................................................................................................. 5<br />
Figure 3 – Topography ............................................................................................................................... 9<br />
Figure 4 – Soil Hydrologic Groups .......................................................................................................... 10<br />
Figure 5 – Regulatory Floodplains ........................................................................................................... 13<br />
Figure 6 – Offsite Hydrology Workmap .................................................................................................. 21<br />
LIST OF TABLES<br />
Table 1 – Significant Offsite <strong>Drainage</strong> Crossings .................................................................................... 20<br />
Table 2 – Offsite Hydrology Results ........................................................................................................ 24<br />
LIST OF APPENDICES<br />
Appendix TM3-01: Data Collection Summary<br />
Appendix TM3-02: City <strong>of</strong> Surprise Long Range Major Street Plan<br />
Appendix TM3-03: Existing Geologic Mapping<br />
Appendix TM3-04: Subsidence Documentation<br />
Appendix TM3-05: <strong>Drainage</strong> Field Photos<br />
Appendix TM3-06: Existing Geologic Flood Hazard Mapping<br />
Appendix TM3-07: Recommended Area <strong>Drainage</strong> Master Plan Improvements<br />
Appendix TM3-08: Existing Erosion Hazard Mapping<br />
Appendix TM3-09: Existing <strong>Drainage</strong> Structures Documentation<br />
Appendix TM3-10: Existing Hydrology Results Excerpts<br />
091337137, 2011-018, TT005 <strong>Maricopa</strong> <strong>County</strong> <strong>Department</strong> <strong>of</strong> <strong>Transportation</strong><br />
Technical Memorandum 3 Deer Valley Parkway Feasibility Study<br />
<strong>Drainage</strong> <strong>Overview</strong> ii April 2012
1. INTRODUCTION<br />
The Deer Valley Parkway Feasibility Study – US 60 to Wild Rose Parkway (hereafter referred to as “the<br />
study”) is one in a series <strong>of</strong> long-range transportation planning studies being conducted by the <strong>Maricopa</strong><br />
<strong>County</strong> <strong>Department</strong> <strong>of</strong> <strong>Transportation</strong> (MCDOT) to evaluate future parkways identified in the <strong>Maricopa</strong><br />
Association <strong>of</strong> Governments (MAG) framework studies. The framework studies are the initial<br />
transportation planning documents for large areas in <strong>Maricopa</strong> <strong>County</strong> that are expected to experience<br />
intense growth and development over the next 30 to 50 years.<br />
Technical Memorandum 3 (TM 3), entitled <strong>Drainage</strong> <strong>Overview</strong>, identifies and summarizes the existing<br />
drainage conditions, features, and hydrologic characteristics <strong>of</strong> the study area. Offsite concentration<br />
points and flow magnitudes prepared in previous studies and reports within the study area for the 100year<br />
storm event were compiled and are presented in this report. TM 3 is based on a review <strong>of</strong> available<br />
existing information, including previous drainage master plans and studies, floodplain delineation<br />
studies, roadway drainage reports, discussions with select stakeholders, and field observations.<br />
Additional detailed information about the study is included in companion documents: Existing and<br />
Future Features (TM 1), Environmental <strong>Overview</strong> (TM 2), Candidate Alignments and Evaluation (TM<br />
4), and Preferred Alignment (TM 5).<br />
1.1 Background and Study Need<br />
In July 2008, MAG completed the Interstate 10/Hassayampa Valley <strong>Transportation</strong> Framework<br />
Study (Hassayampa Framework Study), which recommended a comprehensive roadway network<br />
to meet the future traffic demands that result when the area west <strong>of</strong> the White Tank Mountains is<br />
completely developed (hereafter referred to as buildout travel demand). This long-range regional<br />
transportation network includes the “Arizona Parkway” as a new facility type to supplement more<br />
traditional roadway classifications in meeting projected travel demand.<br />
The Arizona Parkway, by design, is an enhanced arterial roadway which utilizes a distinct<br />
intersection treatment that prohibits left turns at major cross-street intersections and controls<br />
intersection traffic movements with two-phased traffic signal control. Left-turn movements are<br />
made indirectly using directional left-turn crossovers in the median immediately downstream <strong>of</strong><br />
cross-street intersections. This design improves the functionality <strong>of</strong> the parkway, allowing traffic<br />
to flow more freely. The improved functionality increases capacity while maintaining local<br />
access and a posted speed <strong>of</strong> 45 miles per hour (mph). The typical right-<strong>of</strong>-way width for an<br />
Arizona Parkway is 200 feet.<br />
The Hassayampa Framework Study recommended Deer Valley Parkway as an Arizona Parkway<br />
to meet buildout travel demands and provide a continuous parkway network.<br />
Although today’s land development and travel demands in the study area do not warrant a<br />
parkway in the short-term, the buildout forecast for future land development and travel demands<br />
does warrant a parkway in the long-term future. The potential for increased travel demand is<br />
evident in the approved development plans already underway converting the vacant lands within<br />
the study area to land uses that will generate future traffic.<br />
This feasibility study will provide <strong>Maricopa</strong> <strong>County</strong>, the City <strong>of</strong> Surprise, area property owners,<br />
developers, and other stakeholders with guidelines to preserve a 200-foot-wide right-<strong>of</strong>-way<br />
corridor to accommodate the typical Arizona Parkway design. This will require significant<br />
091337137, 2011-018, TT005 <strong>Maricopa</strong> <strong>County</strong> <strong>Department</strong> <strong>of</strong> <strong>Transportation</strong><br />
Technical Memorandum 3 Deer Valley Parkway Feasibility Study<br />
<strong>Drainage</strong> <strong>Overview</strong> 1 April 2012
coordination with various governing bodies, other public agencies, development interests, and the<br />
general public.<br />
1.2 Study Area<br />
The Deer Valley Parkway study area is approximately eleven miles long and two miles wide and<br />
is generally centered on the Deer Valley Road section line, from one-half mile west <strong>of</strong> the<br />
planned future Wild Rose Parkway (approximate 243 rd Avenue alignment) to one-half mile east<br />
<strong>of</strong> US 60. The study area boundary is shown in Figure 1.<br />
The planned Deer Valley Parkway, as shown in the Hassayampa Framework Study, continues<br />
another six miles west <strong>of</strong> Wild Rose Parkway to connect with Turner Parkway – this westerly<br />
segment was originally included as part <strong>of</strong> this study but has since been removed. Due to a<br />
number <strong>of</strong> ongoing Town <strong>of</strong> Buckeye planning efforts that will extend beyond the timeframe <strong>of</strong><br />
this study, this westerly segment will be examined in greater detail by the Town <strong>of</strong> Buckeye in a<br />
future study. The Town <strong>of</strong> Buckeye study should address the need for east/west transportation<br />
network continuity between Wild Rose Parkway and Turner Parkway and reflect the most recent<br />
Community Master Plans within the Buckeye Municipal Planning Area, including Spurlock<br />
Ranch, Festival Ranch, Sun City Festival, Festival Foothills, and Douglas Ranch.<br />
1.3 Document Purpose and Scope<br />
The purpose <strong>of</strong> the <strong>Drainage</strong> <strong>Overview</strong> is to describe the existing drainage conditions in the study<br />
area. The drainage study was limited to the collection and review <strong>of</strong> existing drainage reports and<br />
studies, existing geologic and groundwater mapping, discussion with stakeholders, and field<br />
observations <strong>of</strong> existing drainage patterns and structures included in, and adjacent to, the study<br />
area. Hydrologic information from previous drainage and floodplain studies was compiled to<br />
present watershed subbasins and previously determined peak flow rates draining to the study area.<br />
This information provides an overview <strong>of</strong> the physical features <strong>of</strong> the study area pertaining to<br />
drainage and will be used in the development <strong>of</strong> feasible alignment alternatives.<br />
1.4 Design <strong>Drainage</strong> Criteria<br />
<strong>Drainage</strong> design for the proposed parkway will follow criteria outlined in the <strong>Drainage</strong> Policies<br />
and Standards for <strong>Maricopa</strong> <strong>County</strong>, Arizona (<strong>Maricopa</strong> <strong>County</strong>, 2007) and Chapter 4.7 <strong>of</strong> the<br />
Roadway Design Manual (<strong>Maricopa</strong> <strong>County</strong>, 2004). A draft version <strong>of</strong> an update to the <strong>Drainage</strong><br />
Policies and Standards for <strong>Maricopa</strong> <strong>County</strong> was distributed by <strong>Maricopa</strong> <strong>County</strong> in July 2010.<br />
091337137, 2011-018, TT005 <strong>Maricopa</strong> <strong>County</strong> <strong>Department</strong> <strong>of</strong> <strong>Transportation</strong><br />
Technical Memorandum 3 Deer Valley Parkway Feasibility Study<br />
<strong>Drainage</strong> <strong>Overview</strong> 2 April 2012
Figure 1 – Study Area<br />
091337137, 2011-018, TT005 <strong>Maricopa</strong> <strong>County</strong> <strong>Department</strong> <strong>of</strong> <strong>Transportation</strong><br />
Technical Memorandum 3 Deer Valley Parkway Feasibility Study<br />
<strong>Drainage</strong> <strong>Overview</strong> 3 April 2012
2. EXISTING STUDIES AND OTHER DATA SOURCES<br />
Numerous drainage, geologic, and groundwater studies and other drainage-related documents have been<br />
prepared within or adjacent to the study area. A complete list <strong>of</strong> the existing documents reviewed is<br />
included in Appendix TM3-01. Summaries <strong>of</strong> the most relevant documents are provided in the<br />
following sections. The general order <strong>of</strong> presentation and discussion is from west to east.<br />
2.1 Summary <strong>of</strong> <strong>Drainage</strong> Studies<br />
A map depicting the drainage studies that are in the general vicinity <strong>of</strong> the study area is provided<br />
as Figure 2 at the end <strong>of</strong> this section. The drainage studies shown in Figure 2 that have direct<br />
relevance to the Deer Valley Parkway study area are briefly discussed below. These drainage<br />
studies were reviewed for descriptions <strong>of</strong> existing hydrology, drainage features, and existing<br />
drainage patterns. Most <strong>of</strong> these drainage studies were completed for the Flood Control District<br />
<strong>of</strong> <strong>Maricopa</strong> <strong>County</strong> (FCDMC).<br />
2.1.1 Sun Valley Area <strong>Drainage</strong> Master Plan Step 3 Recommended Alternative Report<br />
(2006)<br />
This Area <strong>Drainage</strong> Master Plan (ADMP) was prepared for the FCDMC as a follow-up to<br />
the Buckeye/Sun Valley Area <strong>Drainage</strong> Master Study completed in 2006. The ADMP<br />
contains seven volumes that document the last step <strong>of</strong> a three step process to develop a<br />
regional flood control master plan and present specific recommended regional drainage<br />
improvements for alluvial fans. The master plan watershed extends from the Hassayampa<br />
River to the White Tank Mountains. The Deer Valley Parkway study area crosses the<br />
Central Arizona Project (CAP) sub-area (Volume 2 <strong>of</strong> the ADMP).<br />
2.1.2 Sun Valley Area <strong>Drainage</strong> Master Plan Area 4 Hydrology Technical Data<br />
Notebook (2006)<br />
This study was prepared for the FCDMC in conjunction with the Sun Valley ADMP to<br />
provide hydrologic documentation for Area 4 (North Sun Valley Area). The Sun Valley<br />
study limits extend from the Hassayampa River to the White Tank Mountains. This overall<br />
watershed was subdivided into four hydrologically distinct areas, with the Deer Valley<br />
Parkway study area falling within Area 4 (North Sun Valley Area). Two washes cross the<br />
Deer Valley Parkway study area: Wash 1 and Wash 2.<br />
2.1.3 Wittmann Area <strong>Drainage</strong> Master Study Update (2005)<br />
This FCDMC Area <strong>Drainage</strong> Master Study Update (ADMSU) identifies drainage patterns<br />
and flooding within the Wittmann area and hydrology and alternatives analysis for<br />
McMicken Dam. The master plan watershed extends from the Hassayampa River to the<br />
Agua Fria River. Volume HY provides hydrologic documentation, Volume HD provides<br />
floodplain delineation reports, Volume MA provides the alternatives analysis for McMicken<br />
Dam, and Volume MD provides the McMicken Dam hydrology. This study includes the<br />
following washes that cross the Deer Valley Parkway study area: Wash 1, Wash 2, Wash 3,<br />
Wash 4, Wash 5, 5 West Wash, Iona Wash, Iona Wash (West Split), Trilby Wash, 2 West<br />
Wash, 1 West Wash, and 4 East Wash.<br />
091337137, 2011-018, TT005 <strong>Maricopa</strong> <strong>County</strong> <strong>Department</strong> <strong>of</strong> <strong>Transportation</strong><br />
Technical Memorandum 3 Deer Valley Parkway Feasibility Study<br />
<strong>Drainage</strong> <strong>Overview</strong> 4 April 2012
Figure 2 – Area <strong>Drainage</strong> Studies<br />
091337137, 2011-018, TT005 <strong>Maricopa</strong> <strong>County</strong> <strong>Department</strong> <strong>of</strong> <strong>Transportation</strong><br />
Technical Memorandum 3 Deer Valley Parkway Feasibility Study<br />
<strong>Drainage</strong> <strong>Overview</strong> 5 April 2012
2.1.4 Wittmann Area <strong>Drainage</strong> Master Plan (2008)<br />
This ADMP was completed as part <strong>of</strong> the McMicken Dam project to develop and evaluate<br />
the rehabilitation or replacement <strong>of</strong> McMicken Dam. As part <strong>of</strong> this study, the alternatives<br />
analysis for McMicken Dam was refined in Volume MA.<br />
2.1.5 Flood Insurance Study for Sun Valley Parkway North Portion <strong>of</strong> Town <strong>of</strong> Surprise<br />
and Unincorporated Areas <strong>Maricopa</strong> <strong>County</strong>, Arizona (1993)<br />
The purpose <strong>of</strong> this FCDMC study was to document the detailed 100-year floodplain and<br />
floodway limits <strong>of</strong> eight washes near Sun Valley Parkway North. Comments from the<br />
Federal Emergency Management Agency (FEMA) indicated that a detailed Zone AE was<br />
not considered appropriate for this area due to the potential breakout areas for many <strong>of</strong> the<br />
washes. The floodplain mapping was resubmitted to FEMA as an approximate Zone A<br />
flood hazard area. The data in this report represent the best available data on these washes,<br />
but do not reflect the accepted FEMA FIRM mapping.<br />
2.1.6 <strong>Drainage</strong> Report: Sun Valley Parkway Phase I (1987)<br />
This drainage report was prepared for the Adams Group in support <strong>of</strong> roadway design for<br />
the proposed Sun Valley Parkway, which has since been constructed. Sun Valley Parkway<br />
is located just south <strong>of</strong> the Deer Valley Parkway study area. Phase I was from Citrus Lane<br />
to approximately 255 th Avenue. The drainage report documents the amount <strong>of</strong> run<strong>of</strong>f that<br />
crosses Sun Valley Parkway and provides sizes for the proposed culverts and channels.<br />
2.1.7 <strong>Drainage</strong> Enhancements for Sun Valley Parkway (1988)<br />
This document discusses proposed enhancements to the drainage along Sun Valley Parkway<br />
due to damage from storms that occurred in August <strong>of</strong> 1988. The report includes the design<br />
approach used for collecting and routing run<strong>of</strong>f in an alluvial fan area for a roadway project.<br />
Because Sun Valley Parkway is located close to the Deer Valley Parkway study area, this<br />
information could be used in the design <strong>of</strong> drainage features for the proposed parkway.<br />
2.2 Summary <strong>of</strong> Other <strong>Drainage</strong> Documents and Data<br />
In addition to drainage studies, data sources such as geologic investigations and groundwater<br />
records were reviewed for information on other regional physical processes that could potentially<br />
impact the Deer Valley Parkway study area. Summaries <strong>of</strong> the more relevant data sources have<br />
been developed.<br />
2.2.1 City <strong>of</strong> Surprise Long Range Major Street Plan, Planning Areas 2 and 3 (2008)<br />
This plan provides conceptual roadway alignments for the City <strong>of</strong> Surprise. The maps<br />
include a conceptual alignment for Deer Valley Parkway and potential locations <strong>of</strong> future<br />
drainage structures like bridges, culverts, and a potential drainage easement. The potential<br />
drainage easement shown on the plan is similar to what may be needed for alternatives<br />
requiring channelization on the upstream side <strong>of</strong> the parkway. The final report <strong>of</strong> this study<br />
will identify where a drainage easement may be needed. Maps 5D through 5I encompass<br />
091337137, 2011-018, TT005 <strong>Maricopa</strong> <strong>County</strong> <strong>Department</strong> <strong>of</strong> <strong>Transportation</strong><br />
Technical Memorandum 3 Deer Valley Parkway Feasibility Study<br />
<strong>Drainage</strong> <strong>Overview</strong> 6 April 2012
the portion <strong>of</strong> the study area within the City <strong>of</strong> Surprise. The maps pertaining to the study<br />
area have been included as Appendix TM3-02.<br />
2.2.2 Surficial Geology Around the White Tank Mountains, Central Arizona (1991)<br />
The Arizona Geological Survey (AZGS) produced mapping and descriptions <strong>of</strong> alluvial<br />
deposits surrounding the White Tank Mountains. Two <strong>of</strong> the nine maps in the series, also<br />
known as Open File Report 91-8, include the study area. Six categories <strong>of</strong> alluvial surfaces<br />
are differentiated and mapped based on surface age.<br />
2.2.3 Geologic Mapping <strong>of</strong> Flood Hazards in Arizona: An Example From the White<br />
Tank Mountains Area, <strong>Maricopa</strong> <strong>County</strong> (1992)<br />
The AZGS developed a method for identifying flood hazard zones from geologic mapping<br />
and field investigations. The resulting product, also known as Open-File Report 91-10,<br />
presents a practical exercise <strong>of</strong> this process using the White Tank Mountains Area as an<br />
example. This example area encompasses part <strong>of</strong> the Deer Valley Parkway study area, most<br />
<strong>of</strong> which is identified as an area that may be subjected to frequent flooding.<br />
2.2.4 Earth Fissure Map <strong>of</strong> <strong>Maricopa</strong> <strong>County</strong>, Arizona (2009)<br />
The AZGS produced a map summarizing the earth fissure mapping that had been completed<br />
in <strong>Maricopa</strong> <strong>County</strong>. The map presents a graphical overview <strong>of</strong> the eight areas that had<br />
been found to have active earth fissures, none <strong>of</strong> which are within the study area.<br />
2.2.5 Active Land Subsidence Areas in Arizona Based on ADWR InSAR Data (2009)<br />
This working document shows active land subsidence areas monitored by the Arizona<br />
<strong>Department</strong> <strong>of</strong> Water Resources (ADWR). Interferometric synthetic aperture radar<br />
(InSAR) technology is used to measure temporal elevation changes in the Earth’s surface.<br />
The map covers the entire state <strong>of</strong> Arizona and identifies an active subsidence area in the<br />
West Valley, just southeast <strong>of</strong> the study area.<br />
2.2.6 Land Subsidence Areas in Western Metropolitan Phoenix (2010)<br />
This ADWR map shows subsidence in an area that extends east near 195 th Avenue and<br />
north to Happy Valley Road. Some <strong>of</strong> the active subsidence area is within the Deer Valley<br />
Parkway study area. The exhibit presents InSAR measurements <strong>of</strong> land subsidence between<br />
March 2004 and September 2010.<br />
2.2.7 Groundwater Site Inventory (GWSI) (2011)<br />
The GWSI is ADWR’s primary repository for statewide groundwater data. It contains<br />
historical well levels and other background information for each well in the database,<br />
including the wells within the study area. The GWSI is an online product that is<br />
continuously updated as new field data is collected.<br />
091337137, 2011-018, TT005 <strong>Maricopa</strong> <strong>County</strong> <strong>Department</strong> <strong>of</strong> <strong>Transportation</strong><br />
Technical Memorandum 3 Deer Valley Parkway Feasibility Study<br />
<strong>Drainage</strong> <strong>Overview</strong> 7 April 2012
3. WATERSHED FEATURES<br />
3.1 Topography and Geology<br />
The study area slopes north and south to large alluvial washes that generally convey flow to the<br />
southeast. The White Tank Mountains are located south <strong>of</strong> the study area. A land form slope<br />
analysis map is provided in Figure 3. The map shows the land slopes mildly north <strong>of</strong> these<br />
mountains.<br />
The Surficial Geology around the White Tank Mountains, Central Arizona (AZGS, 1991) maps<br />
and report delineate the distribution and age <strong>of</strong> alluvial deposits within the study area. According<br />
to the surficial geology maps, most <strong>of</strong> the study area south <strong>of</strong> Wash 1 contains younger deposits,<br />
which may indicate areas <strong>of</strong> occasional to frequent flooding. The remainder <strong>of</strong> the study area is<br />
typically defined as areas where only entrenched channels are subject to flooding, although other<br />
areas <strong>of</strong> low relief could become susceptible to flooding with relatively minor shifts in<br />
depositional patterns. The AZGS maps pertaining to the study area have been included as<br />
Appendix TM3-03.<br />
3.1.1 Land Subsidence and Earth Fissures<br />
ADWR has mapped an active land subsidence feature in the West Valley area based on<br />
measurements obtained between 2004 and 2010. The map entitled Land Subsidence in<br />
Western Metropolitan Phoenix (ADWR, 2010) indicates that there has been up to 2 cm (0.8<br />
inches) <strong>of</strong> subsidence within the study area east <strong>of</strong> 195 th Avenue. South <strong>of</strong> the study area,<br />
up to 6 cm (2.4 inches) <strong>of</strong> subsidence has been documented. The extent <strong>of</strong> the land<br />
subsidence is included in Appendix TM3-04. Land subsidence in Arizona typically occurs<br />
due to groundwater drawdown. While subsidence is not considered to be a significant issue<br />
within the study area at this time, as water demand changes with future development, the<br />
increased potential for land subsidence should be considered when building infrastructure.<br />
Based on a review <strong>of</strong> the Earth Fissure Map <strong>of</strong> <strong>Maricopa</strong> <strong>County</strong>, Arizona (AZGS, 2009),<br />
there are no earth fissures mapped within the study area. No surface evidence <strong>of</strong> fissures has<br />
been found, but this conclusion does not guarantee that hidden or future earth fissures are<br />
not present. According to the Wittmann ADMP McMicken Dam Project Alternatives<br />
Analysis (FCDMC, 2008), the northern end <strong>of</strong> McMicken dam, including the spillway, is in<br />
an area <strong>of</strong> low to moderate fissure risk. See Section 3.5.4 for further details.<br />
3.2 Soils<br />
The National Resources Conservation Service (NRCS) assigns soil map unit components to<br />
hydrologic soil groups to broadly indicate soils groups that have similar run<strong>of</strong>f characteristics.<br />
The locations <strong>of</strong> these hydrologic soil groups within the study area are shown in Figure 4. Most<br />
<strong>of</strong> the study area falls within Hydrologic Soil Group B: soils that have moderately low run<strong>of</strong>f<br />
potential when thoroughly wet. These areas typically have a large proportion <strong>of</strong> sands and allow<br />
unimpeded transmission <strong>of</strong> water through the soil. As shown in Figure 4, there are limited<br />
regions that fall within Hydrologic Soil Group C: soils with moderately high run<strong>of</strong>f potential.<br />
Soils in Group C typically have between 20 to 40 percent clay and less than 50 percent sands.<br />
Water movement through these soils is expected to be somewhat restricted.<br />
091337137, 2011-018, TT005 <strong>Maricopa</strong> <strong>County</strong> <strong>Department</strong> <strong>of</strong> <strong>Transportation</strong><br />
Technical Memorandum 3 Deer Valley Parkway Feasibility Study<br />
<strong>Drainage</strong> <strong>Overview</strong> 8 April 2012
Figure 3 – Topography<br />
091337137, 2011-018, TT005 <strong>Maricopa</strong> <strong>County</strong> <strong>Department</strong> <strong>of</strong> <strong>Transportation</strong><br />
Technical Memorandum 3 Deer Valley Parkway Feasibility Study<br />
<strong>Drainage</strong> <strong>Overview</strong> 9 April 2012
Figure 4 – Soil Hydrologic Groups<br />
091337137, 2011-018, TT005 <strong>Maricopa</strong> <strong>County</strong> <strong>Department</strong> <strong>of</strong> <strong>Transportation</strong><br />
Technical Memorandum 3 Deer Valley Parkway Feasibility Study<br />
<strong>Drainage</strong> <strong>Overview</strong> 10 April 2012
Two areas fall within Hydrologic Soil Group D: soils with high run<strong>of</strong>f potential when thoroughly<br />
wet. One area is bounded by Citrus Road and US 60. The second area extends from 211 th<br />
Avenue to the western limits <strong>of</strong> the study area. This area is generally north <strong>of</strong> 5 West Wash.<br />
Water movement in these soils is restricted or very restricted. Soils in Group D typically have<br />
greater than 40 percent clay or the depth to a water impermeable layer (such as rock) is less than<br />
20 inches. Descriptions <strong>of</strong> the hydrologic soil groups were taken from Chapter 7 <strong>of</strong> the NRCS<br />
National Engineering Handbook Part 630 Hydrology (2007). Contributing watersheds that<br />
contain Group D soils should be carefully analyzed when designing downstream structures or<br />
roadways since precipitation events may result in very quick run<strong>of</strong>f responses.<br />
Soils with low run<strong>of</strong>f potential (Hydrologic Soil Groups A and B) may generally have higher<br />
percolation rates than soils with high run<strong>of</strong>f potential (Hydrologic Soil Groups C and D).<br />
However, percolation rates can vary significantly depending on site specific conditions.<br />
Percolation tests should be obtained during final design.<br />
3.3 Existing and Future Land Use<br />
Technical Memorandum 1 (TM 1) presents a discussion <strong>of</strong> land ownership, zoning, existing land<br />
use, future land use, existing and planned developments, and existing and future transportation<br />
networks. The land use descriptions below are abbreviated versions <strong>of</strong> the TM 1 descriptions that<br />
pertain to drainage design.<br />
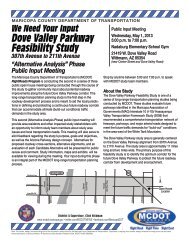
3.3.1 Existing Land Use<br />
The predominant existing land use within<br />
the study area is vacant land. There is a<br />
small rural low density residential area<br />
west <strong>of</strong> 219 th Avenue (Crozier Road).<br />
Industrial land uses include the<br />
Northwest Regional Landfill, located<br />
west <strong>of</strong> 195 th Avenue, and the Arizona<br />
Proving Ground, located east <strong>of</strong> 211 th<br />
Avenue. Desert Moon Elementary<br />
School, located on Pat Tillman<br />
Boulevard east <strong>of</strong> US 60 in the Asante<br />
master planned community, is the only<br />
school within the study area. Appendix<br />
TM3-05 provides photographs taken <strong>of</strong><br />
the land uses and major drainage features<br />
in the study area.<br />
Existing residential land use<br />
3.3.2 Future Land Use<br />
According to the <strong>Maricopa</strong> Association <strong>of</strong> Governments (MAG) general plan Geographic<br />
Information System (GIS) data provided by the Public Works <strong>Department</strong> <strong>of</strong> <strong>Maricopa</strong><br />
<strong>County</strong> and City <strong>of</strong> Surprise, existing vacant land within the study area is anticipated to be<br />
converted to primarily residential land uses at buildout. The land in the vicinity <strong>of</strong> the<br />
Arizona Proving Ground and Northwest Regional Landfill is planned as a business park.<br />
There are also large areas <strong>of</strong> planned retail, mixed use, and open space. These future land<br />
091337137, 2011-018, TT005 <strong>Maricopa</strong> <strong>County</strong> <strong>Department</strong> <strong>of</strong> <strong>Transportation</strong><br />
Technical Memorandum 3 Deer Valley Parkway Feasibility Study<br />
<strong>Drainage</strong> <strong>Overview</strong> 11 April 2012
use patterns incorporate the land use plans for the master planned communities in the study<br />
area vicinity.<br />
3.4 Flooding Hazards<br />
3.4.1 Regulatory Floodplains<br />
Floodplain and floodway delineations are based on the Flood Insurance Study, <strong>Maricopa</strong><br />
<strong>County</strong>, Arizona and Incorporated Areas, FIS No. 04013CV001A (Federal Emergency<br />
Management Agency, 2005) and inundation limits provided by the FCDMC. The FCDMC<br />
is the floodplain administrator for this area. Detailed hydrology was submitted to FEMA<br />
for the washes in the study area, which resulted in a Best Available Data (BAD) letter from<br />
FEMA. The FCDMC calculations <strong>of</strong> corresponding floodplain delineations represent the<br />
best available data, but due to the alluvial nature <strong>of</strong> the area, detailed hydrology was not<br />
accepted by FEMA. Figure 5 provides a map <strong>of</strong> the 100-year floodplain areas and also<br />
displays the Flood Insurance Rate Map (FIRM) panels containing the effective floodplain<br />
mapping. Per discussions with FCDMC, both FEMA effective and FCDMC floodplain<br />
limits are shown on this exhibit to show the most conservative floodplain limits. Appendix<br />
TM3-10 provides separate exhibits showing the FEMA floodplain zone designations and<br />
the FCDMC floodplain zone designations.<br />
Numerous floodplains drain through the study area. Washes 1 through 4 drain north and<br />
east within the study area to 5 West Wash, which conveys flow southeast to Trilby Wash.<br />
Iona Wash and Iona Wash (West Split) also convey flow southeast through the study area to<br />
Trilby Wash. Trilby Wash, 2 West Wash, 1 West Wash and 4 East Wash drain southeast<br />
through the study area to McMicken Dam, which outlets northeast to the McMicken Outlet<br />
Channel and ultimately discharges to the Agua Fria River.<br />
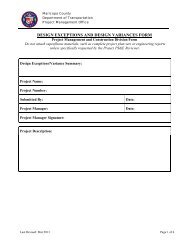
The study area contains numerous regulatory floodplains, including thirteen named washes.<br />
Floodplain encroachment is a consideration for the parkway alternatives, especially when<br />
crossing wide floodplains such as Wash 1, Wash 2, Trilby Wash and Iona Wash. The 100year<br />
floodplain for Wash 1 is approximately 3,000 feet wide while the Wash 2 100-year<br />
floodplain ranges from approximately 500 to 1,200 feet wide. The 100-year floodplains for<br />
Trilby and Iona Washes merge south <strong>of</strong> the Deer Valley Road alignment. The combined<br />
floodplain width <strong>of</strong> these two washes is<br />
approximately 3,000 feet wide. North <strong>of</strong> the<br />
Deer Valley Road alignment, the 100-year<br />
floodplain widths for Trilby Wash and Iona<br />
Wash are both approximately 1,000 feet.<br />
Photos 201 and 205 in Appendix TM3-05<br />
show the shallow, wide floodplains<br />
associated with Trilby Wash and Iona<br />
Wash. Crossing these wide floodplains<br />
while minimizing adverse impacts to the<br />
surrounding properties will be a challenge.<br />
Detailed hydraulic studies will be necessary<br />
during subsequent planning and design<br />
phases for the parkway.<br />
Trilby Wash floodplain<br />
091337137, 2011-018, TT005 <strong>Maricopa</strong> <strong>County</strong> <strong>Department</strong> <strong>of</strong> <strong>Transportation</strong><br />
Technical Memorandum 3 Deer Valley Parkway Feasibility Study<br />
<strong>Drainage</strong> <strong>Overview</strong> 12 April 2012
Figure 5 – Regulatory Floodplains<br />
091337137, 2011-018, TT005 <strong>Maricopa</strong> <strong>County</strong> <strong>Department</strong> <strong>of</strong> <strong>Transportation</strong><br />
Technical Memorandum 3 Deer Valley Parkway Feasibility Study<br />
<strong>Drainage</strong> <strong>Overview</strong> 13 April 2012
The crossings near 5 West Wash also deserve further attention when developing alignment<br />
alternatives because two tributaries join 5 West Wash near the Deer Valley Road alignment.<br />
Wash 1 confluences with 5 West Wash from the northeast and an unnamed tributary<br />
confluences with 5 West Wash from the south. Additionally, 5 West Wash is roughly<br />
parallel to the Deer Valley Road alignment for approximately 4,000 feet. All three washes<br />
have regulatory floodplains delineated. The combined floodplain width is approximately<br />
6,000 feet along the Deer Valley Road alignment. Significant coordination with FCDMC<br />
and FEMA may be needed because <strong>of</strong> the large extents <strong>of</strong> the regulatory floodplains, the<br />
proximity to the Deer Valley Road alignment, and the distributary nature <strong>of</strong> upstream<br />
flowpaths. For example, two dimensional modeling <strong>of</strong> the watershed may result in a more<br />
refined delineation <strong>of</strong> flood hazards, allowing for smaller drainage crossings.<br />
According to the Wittmann Area <strong>Drainage</strong> Master Study Update (ADMSU) Geomorphic<br />
and Sedimentation Analysis Report (FCDMC, 2005), there are locations within the study<br />
area that may require two-dimensional modeling. Typically these are flat areas with either<br />
braided channels or where no distinct channel is present. The soils in these areas are<br />
generally associated with active alluvial fans or alluvial plains. A map showing the location<br />
<strong>of</strong> the possible two-dimensional modeling areas has been included in Appendix TM3-08.<br />
3.4.2 Geologic Flood Hazards<br />
Flood hazard zones were defined for portions <strong>of</strong> the study area west <strong>of</strong> Trilby Wash in<br />
Geologic Mapping <strong>of</strong> Flood Hazards in Arizona: An Example from the White Tank<br />
Mountains Area, <strong>Maricopa</strong> <strong>County</strong> (1992). Excerpts <strong>of</strong> the mapping have been reproduced<br />
with regulatory floodplains and project boundaries overlaid on the AZGS flood hazard<br />
zones in Appendix TM3-06. Most areas within the study area are classified as areas <strong>of</strong> high<br />
flood potential, H2, which occurs in extensive young deposits where channels are small or<br />
nonexistent. The flooding in these areas is predominantly shallow sheet-flooding, with<br />
broad areas inundated in large flood events. The highest hazard zone, H1, occurs in<br />
extensive young deposits with a distributary channel system. Within the study area, small<br />
localized areas near the CAP were mapped as H1 hazard zones. Typically, proposed<br />
roadway alignments should avoid H1 flood hazard zones when possible. This designation<br />
indicates either an entrenched major drainage or a distributary flow area with potentially<br />
high flow velocities. Mitigation measures that include structural improvements built in<br />
these areas would likely need to be sized for large capacities and have increased<br />
maintenance needs.<br />
3.4.3 Alluvial Fans<br />
Active and inactive alluvial fan systems are located in the study area. These alluvial fans<br />
are sloping, fan-shaped landforms created over long periods <strong>of</strong> time by the transport and<br />
deposition <strong>of</strong> sediment as flows from the White Tank Mountains spread out. The alluvial<br />
fans in this area have been studied in detail as part <strong>of</strong> the Sun Valley Area <strong>Drainage</strong> Master<br />
Plan (SVADMP). The information presented in this section has been taken from the<br />
SVADMP Step 3 Recommended Alternative Report, the CAP Sub-Area (Volume 2)<br />
(FCDMC, 2006). Known problems associated with alluvial fan flooding include spatial<br />
uncertainty <strong>of</strong> water and sediment flow distribution, lack <strong>of</strong> containment within the<br />
relatively flat topographic relief laterally across the fan, avulsive movement <strong>of</strong> defined flow<br />
paths, distributary flow, sheet flooding, scour, and landform aggradation. Relatively steep<br />
091337137, 2011-018, TT005 <strong>Maricopa</strong> <strong>County</strong> <strong>Department</strong> <strong>of</strong> <strong>Transportation</strong><br />
Technical Memorandum 3 Deer Valley Parkway Feasibility Study<br />
<strong>Drainage</strong> <strong>Overview</strong> 14 April 2012
channel slopes at the base <strong>of</strong> the White Tank Mountains can result in high flow velocities<br />
with the energy to move significant volumes <strong>of</strong> sediment and debris during floods.<br />
The SVADMP analyzed several alternatives for mitigating the flood hazards <strong>of</strong> the alluvial<br />
fans including structural and non-structural strategies. The result <strong>of</strong> the alternatives<br />
evaluation process was to recommend large in-line detention basins at the apex <strong>of</strong> each<br />
alluvial fan together with downstream corridors protected by levees. The detention basins<br />
were designed to outlet 10 percent <strong>of</strong> the 100-year inflow volume from each alluvial fan.<br />
The corridors were designed to act as regional flood control trunk systems and were sized to<br />
include local drainage as well as sediment from adjacent watershed areas. Numerous drop<br />
structures would be constructed as part <strong>of</strong> the wash corridors. A conceptual cross-section <strong>of</strong><br />
the leveed corridor and the location <strong>of</strong> the recommended flood control improvements are<br />
included in Appendix TM3-07. The Deer Valley Parkway alignment will almost certainly<br />
cross the proposed leveed drainage corridor associated with alluvial fan #2. Similar to<br />
typical wash crossings, the final design <strong>of</strong> this crossing will need to accommodate the<br />
hydraulic design and sediment load anticipated within the corridor, including the effect <strong>of</strong><br />
contraction and expansion <strong>of</strong> flows at the structure.<br />
3.4.4 Scour and Sedimentation<br />
Transport and distribution <strong>of</strong> sediment within the study area are significantly impacted by<br />
the CAP canal according to the Wittmann Area <strong>Drainage</strong> Master Study Update (ADMSU)<br />
Geomorphic and Sedimentation Analysis Report (FCDMC, 2005). The CAP canal is<br />
located upstream <strong>of</strong> the eastern portion <strong>of</strong> the study area and traverses the western portion<br />
<strong>of</strong> the study area. Concrete drainage over-chutes convey storm run<strong>of</strong>f and sediment across<br />
the canal upstream <strong>of</strong> and within the study area. Typically, sediment is deposited upstream<br />
<strong>of</strong> the over-chutes and scour occurs downstream <strong>of</strong> the over-chutes. According to the<br />
Wittmann ADMSU Sedimentation Report, all <strong>of</strong> the areas upstream <strong>of</strong> the CAP canal<br />
within the 100-year floodplain should be considered to be depositional hazard areas.<br />
The report also identified several sedimentation problems that are common with roadways,<br />
including the following:<br />
� Undersized bridges or culverts can cause significant deposition to occur<br />
upstream <strong>of</strong> the roadway and erosion to occur downstream <strong>of</strong> the roadway;<br />
� Gathering numerous washes into a single wash to reduce bridge construction<br />
costs can disrupt existing drainage patterns and have significant impacts<br />
downstream; and<br />
� Trapping <strong>of</strong> debris can have a major impact on the ability <strong>of</strong> culverts and bridges<br />
to adequately convey run<strong>of</strong>f and sediment.<br />
Alluvial fans are built up from sediment that drops out <strong>of</strong> flood waters when flows start to<br />
spread out at the base <strong>of</strong> mountains. Therefore, excessive sedimentation can be expected in<br />
active alluvial fan areas.<br />
3.4.5 Lateral Erosion<br />
Bank erosion from flood events is another critical concern for potential Deer Valley<br />
Parkway infrastructure. Most <strong>of</strong> the soils in the study area are composed <strong>of</strong> sands and noncohesive<br />
materials that water can easily erode. Avulsions can readily occur where some<br />
091337137, 2011-018, TT005 <strong>Maricopa</strong> <strong>County</strong> <strong>Department</strong> <strong>of</strong> <strong>Transportation</strong><br />
Technical Memorandum 3 Deer Valley Parkway Feasibility Study<br />
<strong>Drainage</strong> <strong>Overview</strong> 15 April 2012
change in the terrain, manmade or natural, causes water to abandon a previously established<br />
channel in favor <strong>of</strong> a new drainage path. An example <strong>of</strong> an existing avulsion within the<br />
study area is shown in Figures GR-96 and GR-97 in Appendix TM3-08, taken from the<br />
Wittmann ADMSU Geomorphic and Sedimentation Analysis Report (FCDMC, 2005). The<br />
historic flowpath <strong>of</strong> 5 West Wash has been redirected by the power line access road.<br />
Avulsions like this could lead to downstream developed areas or infrastructure receiving<br />
unexpected increases in flood flows. Deer Valley Parkway should minimize changes to<br />
existing flow paths as much as possible and provide adequate structural protection <strong>of</strong> the<br />
roadway at all wash crossing locations.<br />
Erosion hazard zones were delineated for Trilby Wash, Iona Wash, Iona Wash (West Split),<br />
and 1 West Wash as part <strong>of</strong> the Wittmann ADMSU Geomorphic and Sedimentation Analysis<br />
Report. The erosion hazard delineations are included in Appendix TM3-08. The portions<br />
<strong>of</strong> Trilby Wash, Iona Wash, and Iona (West Split) Wash from Pinnacle Peak Road to the<br />
confluence near the Beardsley Road alignment were identified to have particularly high<br />
erosion hazard potential. The 1 West Wash has an area <strong>of</strong> high erosion hazard potential<br />
from Pinnacle Peak Road to McMicken Dam.<br />
Wherever possible, care must be taken to locate foundations and structures outside <strong>of</strong> the<br />
erosion hazard zones that have been delineated for Trilby Wash, Iona Wash, Iona Wash<br />
(West Split) and 1 West Wash. These drainage systems are highly dynamic and have a<br />
history <strong>of</strong> rapidly changing channels.<br />
3.5 Potentially Impacted Existing <strong>Drainage</strong> Structures<br />
3.5.1 CAP Canal<br />
The CAP canal is located upstream <strong>of</strong><br />
the eastern end <strong>of</strong> the study area and<br />
crosses through the western end <strong>of</strong> the<br />
study area. The location <strong>of</strong> the CAP<br />
canal is shown in Figure 5. Many <strong>of</strong><br />
the contributing watershed hydrographs<br />
are modified by the CAP canal due to<br />
significant storage along the upstream<br />
dikes protecting the canal. <strong>Drainage</strong><br />
run<strong>of</strong>f crosses the canal at select<br />
locations via culverts, over-chutes, or<br />
siphons. There are four culverts<br />
crossing the CAP canal east <strong>of</strong> US 60<br />
CAP canal near 243<br />
that convey flow to washes that cross<br />
US 60 and drain through the study area. Four concrete over-chutes west <strong>of</strong> US 60 are<br />
located upstream <strong>of</strong> the study area. One additional concrete over-chute conveys 5 West<br />
Wash across the CAP canal within the Deer Valley Parkway study area. The Deer Valley<br />
Parkway alignment may need to cross the CAP canal at the western end <strong>of</strong> the study area.<br />
If that is the case, it is recommended that the parkway be located far enough north such that<br />
the impacts to the floodplain upstream <strong>of</strong> the canal are minimized. If the Deer Valley<br />
Parkway alignment is located immediately downstream <strong>of</strong> the CAP canal, additional scour<br />
protection may need to be considered.<br />
rd Avenue alignment<br />
091337137, 2011-018, TT005 <strong>Maricopa</strong> <strong>County</strong> <strong>Department</strong> <strong>of</strong> <strong>Transportation</strong><br />
Technical Memorandum 3 Deer Valley Parkway Feasibility Study<br />
<strong>Drainage</strong> <strong>Overview</strong> 16 April 2012
3.5.2 Sun Valley Parkway<br />
The <strong>Drainage</strong> Report Sun Valley Parkway Phase I (The Adams Group, 1987) quantified the<br />
amount <strong>of</strong> run<strong>of</strong>f that would cross the roadway and sized proposed culverts and channels<br />
for Sun Valley Parkway. Excerpts <strong>of</strong> the culvert sizes and capacities from the report are<br />
included in Appendix TM3-09-1. Erosion protection for box culvert outlets consists <strong>of</strong><br />
grouted riprap aprons with minimum four-foot cut<strong>of</strong>f walls. The pavement and median<br />
drainage was designed for the 10-year storm. Cross drainage structures were designed for<br />
the 100-year, 1-hour event. Sun Valley Parkway will likely not be impacted by Deer Valley<br />
Parkway because Sun Valley Parkway is upstream <strong>of</strong> the study area.<br />
3.5.3 US 60<br />
Although the Deer Valley Parkway alignment will tie into US 60 at the eastern end <strong>of</strong> the<br />
study area, it is not anticipated that the drainage to US 60 will be impacted significantly by<br />
Deer Valley Parkway.<br />
3.5.4 McMicken Dam<br />
The easternmost watersheds <strong>of</strong> the study area drain southeast to McMicken Dam, which is<br />
located immediately upstream <strong>of</strong> the<br />
Beardsley canal and west <strong>of</strong> US 60.<br />
This earthen embankment was<br />
constructed in 1955 as the Trilby Wash<br />
Detention Basin to provide flood<br />
protection for Luke Air Force Base,<br />
Litchfield Park Naval Air Facility and<br />
downstream properties. The<br />
embankment is approximately ten miles<br />
long and outlets east into the Agua Fria<br />
River. The existing emergency spillway<br />
is located at the northern end <strong>of</strong> the dam<br />
and is approximately 2,000 feet long.<br />
Additional information on the dam is<br />
included in Appendix TM3-09-2.<br />
McMicken Dam<br />
Several remediation projects have been completed from 1977 to 2005 due to the<br />
identification <strong>of</strong> embankment cracking and earth fissures near the dam. The Wittmann<br />
ADMP McMicken Dam Project Alternatives Analysis (FCDMC, 2008) documents the most<br />
recent plan for remediation <strong>of</strong> the dam and includes modifications to the emergency<br />
spillway. According to this report, there is a low to moderate fissure risk zone from dam<br />
station 460+00 to the north end <strong>of</strong> the dam, including the emergency spillway. The<br />
recommended alternative includes removal <strong>of</strong> the existing emergency spillway and<br />
relocating it farther south from dam station 480+00 to 505+00. The recommended<br />
alternative is included in Appendix TM3-09-2. The FCDMC is currently planning on<br />
beginning the final design for rehabilitation <strong>of</strong> McMicken Dam in the near future. The<br />
updated design documents should be reviewed when they are made available. The fissure<br />
risk zone may not have an impact on the design <strong>of</strong> Deer Valley Parkway, but it indicates<br />
that future fissures could develop in this area and may impact the parkway.<br />
091337137, 2011-018, TT005 <strong>Maricopa</strong> <strong>County</strong> <strong>Department</strong> <strong>of</strong> <strong>Transportation</strong><br />
Technical Memorandum 3 Deer Valley Parkway Feasibility Study<br />
<strong>Drainage</strong> <strong>Overview</strong> 17 April 2012
The Deer Valley Parkway alignment should be located to minimize impacts to the dam<br />
flood pool, the approach section to the new spillway, and local inflows from major washes.<br />
Per discussions with FCDMC, it may be necessary to channelize flow north <strong>of</strong> the proposed<br />
parkway to direct flow into the McMicken Dam pool area.<br />
091337137, 2011-018, TT005 <strong>Maricopa</strong> <strong>County</strong> <strong>Department</strong> <strong>of</strong> <strong>Transportation</strong><br />
Technical Memorandum 3 Deer Valley Parkway Feasibility Study<br />
<strong>Drainage</strong> <strong>Overview</strong> 18 April 2012
4. EXISTING HYDROLOGY<br />
Various hydrologic studies have been completed that together encompass the entire study area. These<br />
existing studies were not necessarily performed to the same level <strong>of</strong> detail. Some studies – typically<br />
those intended for planning purposes – focused on broad drainage trends, featuring large subbasins and<br />
a limited number <strong>of</strong> concentration points. On the other hand, studies intended for floodplain delineation<br />
purposes typically used small subbasins and a large number <strong>of</strong> concentration points.<br />
To present a consistent level <strong>of</strong> hydrologic analysis throughout this study, <strong>of</strong>fsite flows were reported at<br />
each location where a regulatory 100-year floodplain or a USGS “blue line” stream crossed the study<br />
area centerline. Regulatory floodplains can be FEMA effective floodplains or 100-year floodplains that<br />
have been recognized and delineated by FCDMC. USGS “blue lines” refer to intermittent and perennial<br />
streams that are shown (in blue) on the commonly referenced USGS primary series quadrangle maps.<br />
Table 1 presents an overview <strong>of</strong> the <strong>of</strong>fsite hydrology concentration points examined for this report.<br />
The location <strong>of</strong> each <strong>of</strong>fsite drainage crossing is provided in Figure 6.<br />
4.1 Summary <strong>of</strong> Hydrology Methods<br />
Existing hydrology data for the study area was extracted for each <strong>of</strong> the 19 <strong>of</strong>fsite concentration<br />
points from the Wittmann Area <strong>Drainage</strong> Master Study Update Technical Data Notebook<br />
ADMSU Hydrology (FCDMC, 2004).<br />
Figure 6 shows subbasins within each watershed grouped by color. Concentration points in<br />
existing studies were used directly if located near the center <strong>of</strong> the study area. If a crossing was<br />
not near a published concentration point, the peak flow was calculated as the contributing area<br />
weighted portion <strong>of</strong> the next downstream published value. The methodology used in each existing<br />
study is summarized below. The watersheds are discussed from a west to east direction.<br />
4.1.1 Sun Valley Watershed<br />
This watershed was subdivided into multiple general areas with similar characteristics. Area<br />
4 is comprised <strong>of</strong> the area that drains directly to the Hassayampa River and encompasses the<br />
west end <strong>of</strong> the Deer Valley Parkway study area. The 100-year, 6-hour and 24-hour storm<br />
events for both existing and future land use conditions were modeled using HEC-1<br />
s<strong>of</strong>tware, in conjunction with methods and procedures described by FCDMC. <strong>Drainage</strong><br />
Design Management System for Windows (DDMSW) s<strong>of</strong>tware was utilized to prepare the<br />
input parameters for the HEC-1 models. National Oceanic and Atmospheric Administration<br />
(NOAA) Atlas 2 rainfall data was used to estimate the design rainfall depth for this study.<br />
Depth-area reduction factors were applied with the use <strong>of</strong> JD records. Rainfall distributions<br />
for the 6-hour storm were taken from the FCDMC Hydrology Manual. Soil Conservation<br />
Service (SCS) Type II precipitation distributions were used for 24-hour models. The Green<br />
and Ampt Method was utilized for the estimation <strong>of</strong> rainfall losses. The S-Graph method<br />
was used for the development <strong>of</strong> unit hydrographs.<br />
091337137, 2011-018, TT005 <strong>Maricopa</strong> <strong>County</strong> <strong>Department</strong> <strong>of</strong> <strong>Transportation</strong><br />
Technical Memorandum 3 Deer Valley Parkway Feasibility Study<br />
<strong>Drainage</strong> <strong>Overview</strong> 19 April 2012
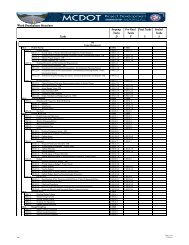
Crossing<br />
ID<br />
Table 1 – Significant Offsite <strong>Drainage</strong> Crossings<br />
Watercourse Name<br />
Nearest Cross<br />
Street<br />
Regulatory<br />
Floodplain<br />
USGS<br />
"Blue<br />
Line"<br />
1 Wash 1 251st Ave Yes Yes<br />
2 Wash 1 251st Ave Yes Yes<br />
3 Wash 2 243rd Ave Yes Yes<br />
4 Wash 1 243rd Ave Yes Yes<br />
5 Wash 3 231st Ave Yes Yes<br />
6 Wash 1 231st Ave Yes Yes<br />
7 5 West Wash 231st Ave Yes Yes<br />
8 5 West Wash 231st Ave Yes Yes<br />
9 Wash 4 227th Ave Yes Yes<br />
10 Wash 5 219th Ave Yes Yes<br />
11 5 West Wash 219th Ave Yes Yes<br />
12 Iona Wash (West Split) 211th Ave Yes Yes<br />
13 Iona Wash 211th Ave Yes Yes<br />
14a Trilby Wash 211th Ave Yes No<br />
14b Trilby Wash 211th Ave Yes No<br />
14c Trilby Wash 211th Ave Yes No<br />
15 Unnamed Tributary to Trilby Wash 203rd Ave Yes No<br />
16 2 West Wash 187th Ave Yes Yes<br />
17 1 West Wash Citrus Rd No Yes<br />
18 Unnamed Tributary to McMicken Dam Cotton Ln Yes Yes<br />
19 4 East Wash US 60 Yes No<br />
091337137, 2011-018, TT005 <strong>Maricopa</strong> <strong>County</strong> <strong>Department</strong> <strong>of</strong> <strong>Transportation</strong><br />
Technical Memorandum 3 Deer Valley Parkway Feasibility Study<br />
<strong>Drainage</strong> <strong>Overview</strong> 20 April 2012
Figure 6 – Offsite Hydrology Workmap<br />
091337137, 2011-018, TT005 <strong>Maricopa</strong> <strong>County</strong> <strong>Department</strong> <strong>of</strong> <strong>Transportation</strong><br />
Technical Memorandum 3 Deer Valley Parkway Feasibility Study<br />
<strong>Drainage</strong> <strong>Overview</strong> 21 April 2012
Normal depth (Modified Puls) channel routing methodology was used to route run<strong>of</strong>f<br />
through subbasins. An eight-point composite channel cross-section was estimated from 10ft<br />
topography, aerial photography, and field observations to represent typical wash crosssection<br />
conveyance. Reservoir routing was performed upstream <strong>of</strong> the CAP canal using<br />
stage-storage data from the Wagner Wash Floodplain Delineation Study Hydrology Report.<br />
Flow diversions were estimated as simple percentages for the entire range <strong>of</strong> discharges<br />
using the 10-ft topography, aerial photography, and field observations. Retention from the<br />
100-year, 2-hour storm event was diverted out <strong>of</strong> the future land use conditions models.<br />
4.1.2 Wittmann Watershed<br />
This watershed was divided into eight major sub-watersheds, four <strong>of</strong> which encompass the<br />
Deer Valley Parkway study area: the Sun Valley Parkway, Iona Wash, Trilby Wash, and<br />
Wittmann Wash sub-watersheds. The 100-year, 6-hour and 24-hour storm events for both<br />
the existing and ultimate development land use conditions were modeled using HEC-1<br />
s<strong>of</strong>tware. Methods and procedures were based on the FCDMC Hydrology Manual.<br />
Watershed Modeling System (WMS) s<strong>of</strong>tware was used to prepare the input parameters for<br />
the HEC-1 models.<br />
NOAA Atlas 2 rainfall data was used to estimate the design rainfall depth for this study.<br />
Depth-area reduction factors were applied with the use <strong>of</strong> JD records. FCDMC 6-hour local<br />
storm distributions for the 6-hour model and the SCS Type II precipitation distribution for<br />
the 24-hour model were used for HEC-1 rainfall distributions. The Green and Ampt Method<br />
was utilized for the estimation <strong>of</strong> rainfall losses. The Clark Unit Hydrograph was used for<br />
the development <strong>of</strong> unit hydrographs.<br />
Normal depth channel routing methodology was utilized in the hydrologic model to route<br />
surface run<strong>of</strong>f through subbasins. An eight-point composite channel cross-section was<br />
developed to represent typical wash cross-section conveyance. The longitudinal slopes and<br />
Manning’s “n” values were estimated based on topographic mapping, aerial photographs,<br />
and field reconnaissance estimates. Storage routing behind the CAP canal was modeled<br />
using level pool routing. Stage/discharge relationships for the over-chutes were developed<br />
assuming critical flow through the structure. Normal depth calculations were used to<br />
calculate most <strong>of</strong> the flow splits, although two-dimensional analyses were conducted for<br />
four complex split flow locations. Three <strong>of</strong> those split flow locations are in the Iona Wash<br />
sub-watershed upstream <strong>of</strong> the CAP canal. The fourth split flow is located north <strong>of</strong> the<br />
CAP canal and east <strong>of</strong> US 60. All four <strong>of</strong> the split flows modeled with two-dimensional<br />
analysis are located upstream <strong>of</strong> the study area. As mentioned in Section 3.4.1, there are<br />
additional areas within the Wittmann watershed that may require two-dimensional modeling<br />
due to the lack <strong>of</strong> identifiable drainage patterns.<br />
4.1.3 McMicken Dam Watershed<br />
Hydrologic modeling <strong>of</strong> the watershed contributing to McMicken Dam was conducted to<br />
assess flows entering the dam at key inflow locations. Therefore, although the watershed is<br />
very similar to the Wittmann Watershed, the subbasins are much larger. WMS s<strong>of</strong>tware<br />
was used to calculate run<strong>of</strong>f for the 100-, 200-, and 500-year, 24-hour storm events for both<br />
existing and future land use conditions. The 6-hour and 72-hour Probably Maximum Flood<br />
091337137, 2011-018, TT005 <strong>Maricopa</strong> <strong>County</strong> <strong>Department</strong> <strong>of</strong> <strong>Transportation</strong><br />
Technical Memorandum 3 Deer Valley Parkway Feasibility Study<br />
<strong>Drainage</strong> <strong>Overview</strong> 22 April 2012
(PMF) events were also calculated for the future land use condition. SCS Type II rainfall<br />
distribution was used for the 24-hour storm.<br />
Subbasin boundaries were placed along the CAP canal alignment so that the effects <strong>of</strong> the<br />
structure could be included in the model, but most roadways, including US 60, State Route<br />
74, and Sun Valley Parkway, were ignored. Rainfall losses were estimated using the Green<br />
and Ampt infiltration equation. The S-Graph method was found to be the most appropriate<br />
method developing unit hydrographs.<br />
Normal depth channel routing methodology was utilized in the hydrologic model to route<br />
surface run<strong>of</strong>f through subbasins. An eight-point composite channel cross-section was<br />
developed to represent typical wash cross-section conveyance. The longitudinal slopes and<br />
Manning’s “n” values were estimated based on topographic mapping, aerial photographs,<br />
and field reconnaissance estimates. Storage routing behind the CAP canal was modeled<br />
using level pool routing. Most flow splits were not considered important for the purposes<br />
<strong>of</strong> this model. One flow split upstream <strong>of</strong> the CAP and east <strong>of</strong> US 60 was included, which<br />
directs some flow into the study area and some flow away from the study area.<br />
4.2 Offsite Hydrology Results<br />
Detailed hydrologic analysis was not performed as part <strong>of</strong> this study. The existing peak 100-year<br />
flows for each major wash crossing within the study area depicted in Figure 6 are listed in Table<br />
2. The wash information presented previously is also included to provide a comprehensive<br />
summary <strong>of</strong> the <strong>of</strong>fsite hydrology at each wash crossing. Table 2 indicates if the peak flow was<br />
taken directly from an existing study or if the discharge was calculated by combining peak flows<br />
<strong>of</strong> published values. Combined values are conservative as the peak flows generally do not occur<br />
at the same time. The concentration point or subbasin identification and storm duration used in<br />
each existing study are also presented. Excerpts from the original source documents <strong>of</strong> each<br />
respective hydrologic study are included in Appendix TM3-10.<br />
As stated previously, concentration points were located at USGS “blue lines” and 100-year<br />
floodplains. There is no discharge reported for Wash 4 (Crossing 9). Because <strong>of</strong> the distributary<br />
nature <strong>of</strong> the area, it is difficult to determine the area contributing to this wash.<br />
Trilby Wash (Crossing 14) has a published effective FEMA discharge that differs from the value<br />
reported in the Wittmann ADMSU. The peak flows presented for this crossing in Table 2 report<br />
both the effective FEMA discharge from the Flood Insurance Study (FIS) as well as the discharge<br />
from the Wittmann ADMSU. The effective FEMA discharges reported in the FIS for Trilby<br />
Wash are higher than those published in the Wittmann ADMSU. It should be noted that the<br />
drainage areas recorded in the FIS are also significantly larger than the drainage areas in the<br />
Wittmann ADMSU.<br />
091337137, 2011-018, TT005 <strong>Maricopa</strong> <strong>County</strong> <strong>Department</strong> <strong>of</strong> <strong>Transportation</strong><br />
Technical Memorandum 3 Deer Valley Parkway Feasibility Study<br />
<strong>Drainage</strong> <strong>Overview</strong> 23 April 2012
Crossing<br />
ID Watercourse Name<br />
Nearest Cross<br />
Street<br />
<strong>Drainage</strong><br />
Area<br />
Table 2 – Offsite Hydrology Results<br />
Regulatory<br />
Floodplain<br />
USGS "Blue<br />
Line" Calculation Method Existing Study Name Existing Study ID<br />
091337137, 2011-018, TT005 <strong>Maricopa</strong> <strong>County</strong> <strong>Department</strong> <strong>of</strong> <strong>Transportation</strong><br />
Technical Memorandum 3 Deer Valley Parkway Feasibility Study<br />
<strong>Drainage</strong> <strong>Overview</strong> 24 April 2012<br />
Storm<br />
Duration<br />
Peak 100-<br />
Year Flow<br />
(mi 2 ) (cfs)<br />
1 Wash 1 251st Ave 1.68 Yes Yes combined values Wittmann ADMSU<br />
SV218, RSV250,<br />
RSV251<br />
6 1,548<br />
2 Wash 1 251st Ave 1.68 Yes Yes published value Wittmann ADMSU CSV218 6 1,834<br />
3 Wash 2 243rd Ave 2.82 Yes Yes combined values Wittmann ADMSU SV216, RSV244 6 3,155<br />
4 Wash 1 243rd Ave 4.01 Yes Yes published value Wittmann ADMSU CSV216 6 2,753<br />
5 Wash 3 231st Ave 6.82 Yes Yes combined values Wittmann ADMSU SV214, R242*, RSV236 6 5,393<br />
6 Wash 1 231st Ave 6.22 Yes Yes combined values Wittmann ADMSU<br />
SV214, R242*,<br />
RSV237, RSV216<br />
6 8,115<br />
7 5 West Wash 231st Ave 13.04 Yes Yes combined values Wittmann ADMSU SV220, RSV260 6 6,038<br />
8 5 West Wash 231st Ave 17.59 Yes Yes published value Wittmann ADMSU CSV220 24 7,844<br />
9 Wash 4 227th Ave 30.63 Yes Yes N/A 1 N/A 1 N/A 1 N/A 1 N/A 1<br />
10 Wash 5 219th Ave N/A Yes Yes published value Wittmann ADMSU R230* 6 3,271<br />
11 5 West Wash 219th Ave 3.91 Yes Yes published value Wittmann ADMSU CSV212 24 8,859<br />
12 Iona Wash (West Split) 211th Ave 38.68 Yes No published value Wittmann ADMSU SV202 6 1,323<br />
13 Iona Wash 211th Ave 1.44 Yes No published value Wittmann ADMSU CIW300 24 7,056<br />
14a Trilby Wash 219th Ave 67.16 Yes Yes published value FEMA FIS<br />
14a Trilby Wash 219th Ave 103.94 Yes Yes published value FEMA FIS<br />
150 ft downstream <strong>of</strong><br />
Deer Valley Road<br />
(Extended)<br />
500 ft downstream <strong>of</strong><br />
Deer Valley Road<br />
(Extended)<br />
14b Trilby Wash 211th Ave 24.18 Yes Yes published value Wittmann ADMSU CIW302 24 5,239<br />
14c Trilby Wash 211th Ave 54.75 Yes Yes published value Wittmann ADMSU C302* 24 10,663<br />
15 Unnamed Tributary to Trilby Wash 203rd Ave 2.87 No Yes published value Wittmann ADMSU CTW412 6 2,214<br />
16 2 West Wash 187th Ave 28.02 Yes Yes combined values Wittmann ADMSU TW400, RTW422 6 5,680<br />
17 1 West Wash Citrus Rd 35.84 Yes No published value Wittmann ADMSU CWI510 24 6,728<br />
18 Unnamed Tributary to McMicken Dam Cotton Ln 43.47 No Yes combined values Wittmann ADMSU WI500, RD508 6 2,268<br />
19 4 East Wash US 60 12.35 Yes Yes published value Wittmann ADMSU CWI506 24 2,956<br />
1 No flows were determined specifically for this wash in the Wittmann ADMSU. Prorating the drainage area was not done because <strong>of</strong> the distributary nature <strong>of</strong> the area.<br />
Not<br />
Listed<br />
Not<br />
Listed<br />
7,430<br />
11,499
5. SUMMARY AND CONCLUSIONS<br />
The purpose <strong>of</strong> TM 3 is to provide an overview <strong>of</strong> the existing drainage conditions and patterns,<br />
including peak flows, for the study area based on available studies and data. The findings <strong>of</strong> this<br />
memorandum will help determine the most appropriate alignment for the proposed Deer Valley<br />
Parkway. Major drainage structures and features in and around the study area have been identified and<br />
should be considered during the planning and design <strong>of</strong> the future parkway. Peak flows reported in this<br />
memorandum have been compiled for planning purposes only. Discharges should be evaluated based<br />
on FCDMC drainage criteria during final design <strong>of</strong> the parkway.<br />
The impacts <strong>of</strong> crossing the numerous washes in the study area should be a significant consideration<br />
when developing and evaluating potential parkway alignment alternatives. Alignment considerations<br />
will need to include the drainage structures, such as bridges and box culverts, that may be necessary to<br />
convey flood flows under the proposed parkway, particularly at Trilby Wash and Iona Wash. Floodplain<br />
widths for washes in the study area include approximately 1,200 feet for Wash 2 and 3,000 feet for<br />
Wash 1. The combined floodplain width <strong>of</strong> Trilby Wash and Iona Wash is also approximately 3,000<br />
feet. The combined floodplain width <strong>of</strong> 5 West Wash, Wash 1 and an unnamed tributary to 5 West<br />
Wash is approximately 6,000 feet. While an effort can be made to align the proposed Deer Valley<br />
Parkway to cross the washes at narrower floodplain locations, the selection <strong>of</strong> crossing locations should<br />
also take into account the dynamic nature <strong>of</strong> these watercourses and the significant potential for lateral<br />
migration <strong>of</strong> channels. Floodplain impacts and the potential need for detailed floodway studies should<br />
also be considered.<br />
The design <strong>of</strong> proposed drainage structures along the Deer Valley Parkway alignment will need to take<br />
into account the active and inactive alluvial fan systems in the study area. The uncertainty <strong>of</strong> flow<br />
distribution, distributary flow and potential for avulsions must be considered in future hydrologic<br />
analyses <strong>of</strong> these alluvial fans. Design <strong>of</strong> Deer Valley Parkway should also consider the recommended<br />
FCDMC drainage corridor associated with alluvial fan #2, which is in the study area.<br />
The impact <strong>of</strong> the CAP canal at the western end <strong>of</strong> the study area must be considered when selecting an<br />
alignment. The CAP canal acts as a barrier to flow and sediment. Alignment considerations north <strong>of</strong><br />
the canal must include 100-year flooding limits. Locations downstream <strong>of</strong> the CAP canal should<br />
consider the additional scour potential caused by sedimentation occurring upstream <strong>of</strong> the CAP canal.<br />
Sedimentation must be taken into account when designing the proposed drainage structures. Adequate<br />
erosion control as well as correct sizing and placement <strong>of</strong> structures to minimize sediment deposition<br />
will be necessary for the proposed drainage structures to convey flows properly throughout the service<br />
life <strong>of</strong> these structures. In addition, maintaining existing drainage patterns and sediment transport<br />
capacities will reduce maintenance costs and minimize the potential for causing erosion problems<br />
downstream <strong>of</strong> the study area.<br />
Washes that currently drain to McMicken Dam must continue to drain to the dam. Per discussions with<br />
FCDMC, it may be necessary to channelize flow north <strong>of</strong> the proposed parkway to direct flow into the<br />
McMicken Dam pool area. The location <strong>of</strong> the proposed modifications to the McMicken Dam spillway<br />
should also be taken into account so that impacts to the dam and dam pool are minimized. If possible, it<br />
is recommended that Deer Valley Parkway alignment completely avoids crossing the dam or spillway.<br />
The proposed Deer Valley Parkway may cause incremental increases in ponding and inundation on<br />
adjacent properties. The watershed is mostly undeveloped desert, but there are a few residential,<br />
industrial, and agricultural developments in the area. Increased inundation and ponding on developed<br />
091337137, 2011-018, TT005 <strong>Maricopa</strong> <strong>County</strong> <strong>Department</strong> <strong>of</strong> <strong>Transportation</strong><br />
Technical Memorandum 3 Deer Valley Parkway Feasibility Study<br />
<strong>Drainage</strong> <strong>Overview</strong> 25 April 2012
land should be avoided where feasible, and coordination with FCDMC and FEMA may be required.<br />
Care should be taken not to adversely affect the functions <strong>of</strong> the CAP canal during the drainage design<br />
for the parkway.<br />
In summary, the most critical drainage issue to be considered during the parkway alignment alternatives<br />
analysis is the location <strong>of</strong> crossings at Trilby Wash, Iona Wash, and other major washes. The selection<br />
<strong>of</strong> these crossing locations will need to consider the cost <strong>of</strong> the structures, hydraulic impacts upstream<br />
and downstream, lateral migration, and scour. The impact <strong>of</strong> the existing alluvial fans and<br />
corresponding drainage corridors on the proposed alignment are another important consideration. The<br />
two overarching goals <strong>of</strong> drainage design for Deer Valley Parkway are to minimize the impacts <strong>of</strong> the<br />
proposed parkway on existing drainage patterns and to minimize the impacts <strong>of</strong> drainage on the<br />
proposed parkway.<br />
091337137, 2011-018, TT005 <strong>Maricopa</strong> <strong>County</strong> <strong>Department</strong> <strong>of</strong> <strong>Transportation</strong><br />
Technical Memorandum 3 Deer Valley Parkway Feasibility Study<br />
<strong>Drainage</strong> <strong>Overview</strong> 26 April 2012
APPENDIX TM3-01<br />
DATA COLLECTION SUMMARY<br />
091337137, 2011-018, TT005 <strong>Maricopa</strong> <strong>County</strong> <strong>Department</strong> <strong>of</strong> <strong>Transportation</strong><br />
Technical Memorandum 3 Deer Valley Parkway Feasibility Study<br />
<strong>Drainage</strong> <strong>Overview</strong> April 2012
AZGS = Arizona Geological Survey<br />
ADOT = Arizona <strong>Department</strong> <strong>of</strong> <strong>Transportation</strong><br />
ADWR = Arizona <strong>Department</strong> <strong>of</strong> Water Resources<br />
FCDMC = Flood Control District <strong>of</strong> <strong>Maricopa</strong> <strong>County</strong><br />
FEMA = Federal Emergency Management Agency<br />
KHA = Kimley-Horn and Associates<br />
MAG = <strong>Maricopa</strong> Associated Governments<br />
MC - <strong>Maricopa</strong> <strong>County</strong><br />
MCDOT - <strong>Maricopa</strong> <strong>County</strong> <strong>Department</strong> <strong>of</strong> <strong>Transportation</strong><br />
LIBRARY<br />
KHA<br />
No.<br />
Title Description Author Date Source<br />
Format/<br />
File Type<br />
Collected<br />
By<br />
Discipline<br />
1<br />
Active Land Subsidence Areas in Arizona Based<br />
on ADWR InSAR Data<br />
map showing active subsidence areas ADWR Jul 2009 ADWR pdf BML Water<br />
2<br />
A Hydrologic Analysis <strong>of</strong> Wagner Wash<br />
Watershed<br />
description <strong>of</strong> hydrology methodology and results<br />
used for Wagner Wash FIS<br />
FCDMC Jan 1991 FCDMC pdf MAF <strong>Drainage</strong><br />
3 D.W.R. Hydrologic Map Series Report No. 27<br />
maps showing groundwater conditions in the<br />
Phoenix Active Management Area<br />
ADWR 1992 ADWR pdf BML Water<br />
4 D.W.R. Hydrologic Map Series Report No. 35<br />
maps showing groundwater conditions in the<br />
Phoenix Active Management Area<br />
ADWR<br />
Nov 2002-<br />
Feb 2003<br />
ADWR pdf BML Water<br />
5<br />
<strong>Drainage</strong> Design Report for Sun Valley Parkway<br />
<strong>Drainage</strong> Enhancement<br />
6 <strong>Drainage</strong> Enhancements for Sun Valley Parkway<br />
7 <strong>Drainage</strong> Report: Sun Valley Parkway Phase I<br />
8<br />
<strong>Drainage</strong> Report: Sun Valley Parkway Phase II<br />
(Station 410+00 - 1023+95)<br />
documentation for interceptor channel collector<br />
ditch, Wagner Wash outlet protection, detention<br />
basin ditch/inlets, and baffle block design.<br />
written in response to damage from August 1988<br />
storm event. Discusses storm frequency<br />
analysis, design approach, and proposed<br />
protection<br />
quantifies run<strong>of</strong>f that crosses roadway and sizes<br />
culverts/channels. Phase I starts at Citrus Ln<br />
and extends west to 255th Ave alignment.<br />
<strong>Drainage</strong> area map at end <strong>of</strong> document.<br />
Collar, Williams &<br />
White Engineering<br />
Collar, Williams &<br />
White Engineering<br />
Collar, Williams &<br />
White Engineering<br />
quantifies run<strong>of</strong>f that crosses roadway and sizes<br />
culverts/channels. Phase II starts at Northern Collar, Williams &<br />
Ave and extends north/east to Phase I. <strong>Drainage</strong> White Engineering<br />
area map at end <strong>of</strong> document.<br />
Dec 1988 FCDMC pdf BML <strong>Drainage</strong><br />
Oct 1988 FCDMC pdf BML <strong>Drainage</strong><br />
Apr 1987 FCDMC pdf BML <strong>Drainage</strong><br />
Apr 1987 FCDMC pdf BML <strong>Drainage</strong><br />
9 Earth Fissure Map <strong>of</strong> <strong>Maricopa</strong> <strong>County</strong>, Arizona mapping <strong>of</strong> earth fissures AZGS Dec 2009 AZGS pdf BML Geology<br />
10<br />
11<br />
12<br />
13<br />
Flood Insurance Study Iona Wash: From Trilby<br />
Wash to State Route 89<br />
Flood Insurance Study <strong>Maricopa</strong> <strong>County</strong>, Arizona<br />
and Incorporated Area<br />
Flood Insurance Study Sun Valley Parkway North<br />
Portion <strong>of</strong> Town <strong>of</strong> Surprise and Unincorporated<br />
<strong>Maricopa</strong> <strong>County</strong>, Arizona<br />
Geologic Map <strong>of</strong> the Daggs Tank 7.5'<br />
Quadrangle, <strong>Maricopa</strong> <strong>County</strong>, Arizona<br />
Summary Table <strong>of</strong> Documents Reviewed - Kimley-Horn and Associates<br />
Deer Valley Parkway<br />
Feasibility Study<br />
Data Collection Summary<br />
ITEM TRACKING<br />
Inundation mapping for Iona Wash CH2MHill Oct 1993 FCDMC pdf MAF <strong>Drainage</strong><br />
FIS No. 04013CV001A: description <strong>of</strong> general<br />
flooding issues in county, effective discharges,<br />
and flood pr<strong>of</strong>iles<br />
FIS prepared for eight washes north <strong>of</strong> Sun<br />
Valley Parkway. This was not accepted by<br />
FEMA, but is considered by the FCDMC to be the<br />
best available data on the washes for floodplain<br />
FEMA Sep 2005 KHA pdf BML <strong>Drainage</strong><br />
A-N West May 1993 FCDMC pdf MAF <strong>Drainage</strong><br />
regulation. Includes HEC-2 models<br />
DGM-39. mapped surface and bedrock units with<br />
AZGS<br />
descriptions<br />
Nov 2004 AZGS CD MAF Geology<br />
KHA Project No. 091337127<br />
K:\PHX_Systems\091337137-MCDOT_DeerValleyPkwy\DataCollection\Data Collection Summary.xls 1 <strong>of</strong> 4
AZGS = Arizona Geological Survey<br />
ADOT = Arizona <strong>Department</strong> <strong>of</strong> <strong>Transportation</strong><br />
ADWR = Arizona <strong>Department</strong> <strong>of</strong> Water Resources<br />
FCDMC = Flood Control District <strong>of</strong> <strong>Maricopa</strong> <strong>County</strong><br />
FEMA = Federal Emergency Management Agency<br />
KHA = Kimley-Horn and Associates<br />
MAG = <strong>Maricopa</strong> Associated Governments<br />
MC - <strong>Maricopa</strong> <strong>County</strong><br />
MCDOT - <strong>Maricopa</strong> <strong>County</strong> <strong>Department</strong> <strong>of</strong> <strong>Transportation</strong><br />
LIBRARY<br />
KHA<br />
No.<br />
14<br />
15<br />
Summary Table <strong>of</strong> Documents Reviewed - Kimley-Horn and Associates<br />
Deer Valley Parkway<br />
Feasibility Study<br />
Data Collection Summary<br />
ITEM TRACKING<br />
Title Description Author Date Source<br />
Geologic Mapping <strong>of</strong> Flood Hazards in Arizona:<br />
An Example From the White Tank Mountains<br />
Area, <strong>Maricopa</strong> <strong>County</strong><br />
Gila River and Tributaries, Arizona Agua Fria<br />
Project Lower Agua Fria River Trilby Wash<br />
Detention Basin and Appurtenances<br />
OFR 91-10: outlines methods used to map<br />
alluvial surfaces <strong>of</strong> different ages, then converted<br />
to five flood-hazards zones. Includes four<br />
24"x36" plates.<br />
Record drawings for Trilby Wash Detention Basin<br />
(McMicken Dam)<br />
Format/<br />
File Type<br />
Collected<br />
By<br />
Discipline<br />
AZGS Mar 1992 AZGS pdf MAF Geology<br />
Corps <strong>of</strong> Engineers,<br />
U.S. Army<br />
Jul 1956 FCDMC pdf MAF <strong>Drainage</strong><br />
16 GWSI Hydrograph Site ID 334028112361401<br />
historical groundwater levels at 251st Ave<br />
between Bearsley Parkway alignment and Sun<br />
Valley Parkway<br />
ADWR Dec 2010 ADWR pdf MAF Water<br />
17 GWSI Hydrograph Site ID 334112112371601<br />
historical groundwater levels at approximately<br />
255th Ave alignment north <strong>of</strong> CAP<br />
ADWR Mar 2009 ADWR pdf MAF Water<br />
18 GWSI Hydrograph Site ID 334136112273901<br />
historical groundwater levels at 187th Ave and<br />
Pinnacle Peak Rd<br />
ADWR Dec 2008 ADWR pdf MAF Water<br />
19 GWSI Hydrograph Site ID 334147112320301<br />
historical groundwater levels at 219th Ave and<br />
Pinnacle Peak Rd<br />
ADWR Dec 2010 ADWR pdf MAF Water<br />
20<br />
H3 Alluvial Fan Wittmann Area FLO-2D Model for memo and FLO-2D files for alluvial area north <strong>of</strong><br />
different inflow hyrographs<br />
CAP<br />
FCDMC Sep 2010 FCDMC pdf <strong>Drainage</strong><br />
21 Hassayampa Basin Gravity Survey shows points for depth to bedrock study ADWR unknown ADWR pdf BML Water<br />
22<br />
Iona Wash Floodplain Delineation Study<br />
Technical Support Data Notebook, 3 Volumes<br />
describes hydraulic analysis (Volume 2), includes<br />
HEC-2 files<br />
CH2MHill Oct 1993 FCDMC pdf MAF <strong>Drainage</strong><br />
23<br />
Land Subsidence in Western Metropolitan<br />
Phoenix, 01/22/2007 to 02/11/2008<br />
map showing 1.1 yr subsidence (0 to 3 cm) ADWR Feb 2008 ADWR pdf MAF Water<br />
24<br />
Land Subsidence in Western Metropolitan<br />
Phoenix, 01/22/2007 to 03/02/2009<br />
map showing 5.0 yr subsidence (0 to 5 cm) ADWR Mar 2009 ADWR pdf MAF Water<br />
25<br />
Land Subsidence in Western Metropolitan<br />
Phoenix, 02/11/2008 to 02/15/2010<br />
map showing 2.0 yr subsidence (0 to 4 cm) ADWR Feb 2010 ADWR pdf MAF Water<br />
26<br />
Land Subsidence in Western Metropolitan<br />
Phoenix, 02/11/2008 to 03/02/2009<br />
map showing 1.0 yr subsidence (0 to 3 cm) ADWR Mar 2009 ADWR pdf MAF Water<br />
27<br />
Land Subsidence in Western Metropolitan<br />
Phoenix, 03/02/2009 to 02/15/2010<br />
map showing 0.9 yr subsidence (0 to 3 cm) ADWR Feb 2010 ADWR pdf MAF Water<br />
28<br />
Land Subsidence in Western Metropolitan<br />
Phoenix, 03/08/2004 to 09/13/2010<br />
map showing 6.5 yr subsidence (0 to 10 cm) ADWR Sep 2010 ADWR pdf MAF Water<br />
29<br />
Land Subsidence in Western Metropolitan<br />
Phoenix, 03/13/2006 to 02/11/2008<br />
map showing 1.9 yr subsidence (0 to 6 cm) ADWR Feb 2008 ADWR pdf MAF Water<br />
30<br />
Land Subsidence in Western Metropolitan<br />
Phoenix, 07/10/1992 to 10/30/2000<br />
map showing 8.3 yr subsidence (0 to 35 cm) ADWR Oct 2000 ADWR pdf MAF Water<br />
31<br />
<strong>Maricopa</strong> <strong>County</strong> <strong>Drainage</strong> Policies and<br />
Standards<br />
drainage guidelines MC Jan 2007 KHA pdf BML <strong>Drainage</strong><br />
KHA Project No. 091337127<br />
K:\PHX_Systems\091337137-MCDOT_DeerValleyPkwy\DataCollection\Data Collection Summary.xls 2 <strong>of</strong> 4
AZGS = Arizona Geological Survey<br />
ADOT = Arizona <strong>Department</strong> <strong>of</strong> <strong>Transportation</strong><br />
ADWR = Arizona <strong>Department</strong> <strong>of</strong> Water Resources<br />
FCDMC = Flood Control District <strong>of</strong> <strong>Maricopa</strong> <strong>County</strong><br />
FEMA = Federal Emergency Management Agency<br />
KHA = Kimley-Horn and Associates<br />
MAG = <strong>Maricopa</strong> Associated Governments<br />
MC - <strong>Maricopa</strong> <strong>County</strong><br />
MCDOT - <strong>Maricopa</strong> <strong>County</strong> <strong>Department</strong> <strong>of</strong> <strong>Transportation</strong><br />
LIBRARY<br />
KHA<br />
No.<br />
Summary Table <strong>of</strong> Documents Reviewed - Kimley-Horn and Associates<br />
Deer Valley Parkway<br />
Feasibility Study<br />
Data Collection Summary<br />
ITEM TRACKING<br />
Title Description Author Date Source<br />
Format/<br />
File Type<br />
Collected<br />
By<br />
Discipline<br />
32<br />
National Engineering Handbook Part 630<br />
Hydrology<br />
Chapter 7 Hydrologic Soil Groups NRCS May 2007 NRCS pdf BML <strong>Drainage</strong><br />
33 Phoenix Active Management Area<br />
maps shows major infrastructure and<br />
grandfathered water rights<br />
ADWR Sep 2003 ADWR pdf BML Water<br />
34<br />
Sun Valley Area <strong>Drainage</strong> Master Plan Area 4<br />
Hydrology Technical Data Notebook<br />
hydrology report for area between Trilby Wash<br />
and Hassayampa River<br />
JE Fuller Aug 2006 FCDMC pdf BML <strong>Drainage</strong><br />
35<br />
outlines preliminary alternatives for flood<br />
Sun Valley Area <strong>Drainage</strong> Master Plan Step 1<br />
protection alternatives. CAP sub-area applies to<br />
Alternatives Formulation and Preliminary Analysis<br />
study area<br />
JE Fuller Aug 2006 FCDMC pdf BML <strong>Drainage</strong><br />
36<br />
Sun Valley Area <strong>Drainage</strong> Master Plan Step 2<br />
Proposed Alternatives Report<br />
7 volumes. Vol 1 provides overview <strong>of</strong> ADMP<br />
process, and Volume 2 contains alternatives for<br />
project area<br />
JE Fuller Sep 2006 FCDMC pdf BML <strong>Drainage</strong><br />
37<br />
Sun Valley Area <strong>Drainage</strong> Master Plan Step 3<br />
Recommended Alternative Report<br />
7 volumes. Vol 1 provides overview <strong>of</strong> ADMP<br />
process, and Volume 2 contains alternatives for<br />
project area<br />
JE Fuller Dec 2006 FCDMC pdf BML <strong>Drainage</strong><br />
38<br />
Sun Valley Area <strong>Drainage</strong> Master Plan Technical<br />
Data Notebook: Approximate Zone A Floodplain<br />
Delineation <strong>of</strong> White Tank Piedmont Appendix G<br />
compliation <strong>of</strong> AZGS gelogic reports/maps,<br />
NRCS soil surveys, and sediment yield analysis<br />
JE Fuller Sep 2006 FCDMC pdf BML <strong>Drainage</strong><br />
39 Sun Valley Parkway Correspondence<br />
contains various dcumentation regarding the<br />
damage from the Aug 1988 storm, Greiner<br />
reviews <strong>of</strong> CWW drainage reporst, variance from<br />
standard drainage design criteria --valuable<br />
lesson on building a roadway in this alluvial fan<br />
area<br />
FCDMC unknown FCDMC pdf BML <strong>Drainage</strong><br />
40<br />
Surficial Geology Around the White Tank<br />
Mountains, Central Arizona<br />
Technical Data Notebook (TDN) for Sun Valley<br />
OFR 91-8, includes report and nine quadrangle<br />
maps<br />
AZGS Nov 1991 KHA pdf MAF Geology<br />
41<br />
Parkway North Flood Insurace Study (Portion <strong>of</strong><br />
Town <strong>of</strong> Surprise and Unincorporated Areas,<br />
<strong>Maricopa</strong> <strong>County</strong>, Arizona<br />
includes general documentation and survey notes<br />
A-N West<br />
for Sun Valley Parkway North FIS<br />
May 1993 FCDMC pdf MAF <strong>Drainage</strong><br />
42 Wagner Wash Flood Delineation Study Inundation mapping for Wagner Wash HDR Nov 1991 FCDMC pdf MAF <strong>Drainage</strong><br />
43 Wagner Wash Flood Insurance Study<br />
description <strong>of</strong> Wagner Wash effective discharges<br />
and flood pr<strong>of</strong>iles<br />
includes general documentation, survey<br />
HDR Nov 1991 FCDMC pdf MAF <strong>Drainage</strong><br />
44 Wagner Wash Technical Data Notebook<br />
information, manning's n value selection report,<br />
notes on HEC-2 model, culvert calculations, and<br />
HEC-2 output,<br />
HDR unknown FCDMC pdf MAF <strong>Drainage</strong><br />
KHA Project No. 091337127<br />
K:\PHX_Systems\091337137-MCDOT_DeerValleyPkwy\DataCollection\Data Collection Summary.xls 3 <strong>of</strong> 4
AZGS = Arizona Geological Survey<br />
ADOT = Arizona <strong>Department</strong> <strong>of</strong> <strong>Transportation</strong><br />
ADWR = Arizona <strong>Department</strong> <strong>of</strong> Water Resources<br />
FCDMC = Flood Control District <strong>of</strong> <strong>Maricopa</strong> <strong>County</strong><br />
FEMA = Federal Emergency Management Agency<br />
KHA = Kimley-Horn and Associates<br />
MAG = <strong>Maricopa</strong> Associated Governments<br />
MC - <strong>Maricopa</strong> <strong>County</strong><br />
MCDOT - <strong>Maricopa</strong> <strong>County</strong> <strong>Department</strong> <strong>of</strong> <strong>Transportation</strong><br />
LIBRARY<br />
KHA<br />
No.<br />
45<br />
46<br />
47<br />
48<br />
49<br />
Summary Table <strong>of</strong> Documents Reviewed - Kimley-Horn and Associates<br />
Deer Valley Parkway<br />
Feasibility Study<br />
Data Collection Summary<br />
ITEM TRACKING<br />
Title Description Author Date Source<br />
geomorphic analysis is not detailed in project<br />
Wittmann Area <strong>Drainage</strong> Master Study Update area; includes 100-yr sediment yield for<br />
(ADMSU) Geomorpic and Sedimentation Analysis McMicken dam and erosioan hazard zone<br />
Report Volume GR<br />
analysis for Trilby Wash, Iona East Wash, Iona<br />
West Wash, and CAP-1 West Wash<br />
Wittmann Area <strong>Drainage</strong> Master Study Update<br />
ADMSU Floodplain Delineations Report Volume<br />
HD-1 thru 8<br />
Wittmann Area <strong>Drainage</strong> Master Study Update<br />
Technical Data Notebook ADMSU Hydrology<br />
Volume HY-1 thru 3<br />
Wittmann Area <strong>Drainage</strong> Master Study Update<br />
Technical Data Notebook ADMSU Hydrology<br />
Volume HY-Addendum<br />
Wittmann Area <strong>Drainage</strong> Master Plan Volume H,<br />
EC: Erosion Hazard Zone Re-Delineation<br />
Chapter, Iona Wash, <strong>Maricopa</strong> <strong>County</strong>, Arizona<br />
hydraulic analysis, floodplain delineation maps,<br />
and HEC-RAS models<br />
hydrology report and HEC-1 models Entellus<br />
updates hydrology based on detailed hydraulic<br />
analysis<br />
Updates the erosion hazard zone for section <strong>of</strong><br />
Iona Wash between CAP and Pinnacle Peak<br />
Road, includes GIS shapefiles<br />
West Consultants,<br />
Inc.<br />
Format/<br />
File Type<br />
Collected<br />
By<br />
Discipline<br />
Apr 2005 FCDMC pdf MAF <strong>Drainage</strong><br />
Entellus Jul 2005 FCDMC pdf MAF <strong>Drainage</strong><br />
Revised<br />
Oct 2004<br />
FCDMC pdf MAF <strong>Drainage</strong><br />
Entellus Final Jul 2005 FCDMC pdf MAF <strong>Drainage</strong><br />
JE Fuller Feb 2007 FCDMC pdf MAF <strong>Drainage</strong><br />
KHA Project No. 091337127<br />
K:\PHX_Systems\091337137-MCDOT_DeerValleyPkwy\DataCollection\Data Collection Summary.xls 4 <strong>of</strong> 4
APPENDIX TM3-02<br />
CITY OF SURPRISE LONG RANGE MAJOR STREET PLAN<br />
091337137, 2011-018, TT005 <strong>Maricopa</strong> <strong>County</strong> <strong>Department</strong> <strong>of</strong> <strong>Transportation</strong><br />
Technical Memorandum 3 Deer Valley Parkway Feasibility Study<br />
<strong>Drainage</strong> <strong>Overview</strong> April 2012
Deer Valley �������<br />
����� ����
Deer Valley �������<br />
����� ����
Deer Valley �������<br />
����� ����
Deer Valley �������<br />
����� ����
Deer Valley �������<br />
����� ����
��<br />
��<br />
��<br />
��<br />
��<br />
��<br />
��<br />
��<br />
��<br />
����������<br />
��������<br />
�������������<br />
����������<br />
��������<br />
�������������<br />
���������������������������<br />
���������������������������<br />
�������<br />
�������<br />
�������<br />
�������<br />
�������<br />
�������<br />
�������<br />
�������<br />
�������<br />
�������<br />
�������<br />
�������<br />
�������<br />
�������<br />
�������<br />
��������<br />
�������<br />
�������<br />
������� �������<br />
�������<br />
������� �������<br />
�������<br />
�������<br />
�������<br />
��������<br />
���������<br />
���������<br />
����������������<br />
����������������������������<br />
����������������������<br />
���� ������������<br />
��<br />
������<br />
�������������������<br />
�������<br />
�������<br />
��������������<br />
��������������<br />
����������������<br />
�������������<br />
������������<br />
��������������������������<br />
��������������������������<br />
������������������<br />
����������������<br />
�����������������<br />
�������������������<br />
�������������������������<br />
��������<br />
���������������������������<br />
�������������������������<br />
�������������������������<br />
��������<br />
���������������������������<br />
����������������������������<br />
������<br />
�����������<br />
���������������<br />
�����������������<br />
���������<br />
���������<br />
�������<br />
�������<br />
������<br />
����������������<br />
�����<br />
�����<br />
�����<br />
��������������������������<br />
���������������<br />
���������������<br />
��������������<br />
���������������<br />
�����������<br />
������������������<br />
�����<br />
�����<br />
�����<br />
����<br />
������������������<br />
��������<br />
��������������������<br />
��������<br />
����������<br />
������������<br />
������<br />
���������<br />
������������������<br />
��������<br />
��������<br />
�������������<br />
������������������<br />
�������������������<br />
��������<br />
������������������<br />
����������������<br />
�������������<br />
������<br />
����������������������<br />
�����������������������<br />
��������������<br />
��������<br />
���������������������������<br />
���������<br />
� ��� �����<br />
�������������<br />
��<br />
��<br />
��<br />
��<br />
��<br />
��<br />
��<br />
��<br />
��<br />
��<br />
��<br />
��<br />
��<br />
��<br />
��<br />
��<br />
��<br />
��<br />
��<br />
��<br />
��<br />
��<br />
��<br />
��<br />
��<br />
��<br />
��<br />
��<br />
��<br />
��<br />
��<br />
��<br />
��<br />
��<br />
��<br />
�����<br />
�����<br />
���� ������ �������<br />
����� ����
Deer Valley �������<br />
����� ����
Deer Valley �������<br />
����� ����
Deer Valley �������<br />
����� ����
Deer Valley �������<br />
����� ����
Deer Valley �������<br />
����� ����
Deer Valley �������<br />
����� ����
��<br />
��<br />
��<br />
��<br />
��<br />
�<br />
�<br />
�<br />
�����������������������������<br />
�������<br />
�������<br />
�������<br />
�������<br />
�������<br />
�������<br />
�������<br />
�������<br />
�������<br />
������<br />
�������<br />
�������<br />
�������<br />
�������<br />
�������<br />
�������<br />
�������<br />
��������<br />
�������<br />
�������<br />
�������<br />
�������<br />
��������<br />
�������<br />
�������<br />
�������<br />
�������<br />
��������<br />
���������<br />
�����<br />
�����<br />
�����<br />
����������������<br />
����������������������������<br />
����������������������<br />
���� ������������<br />
��<br />
������<br />
�������������������<br />
�������<br />
�������<br />
��������������<br />
��������������<br />
����������������<br />
�������������<br />
������������<br />
��������������������������<br />
��������������������������<br />
������������������<br />
����������������<br />
�����������������<br />
�������������������<br />
�������������������������<br />
��������<br />
���������������������������<br />
�������������������������<br />
�������������������������<br />
��������<br />
���������������������������<br />
����������������������������<br />
������<br />
�����������<br />
���������������<br />
�����������������<br />
���������<br />
���������<br />
�������<br />
�������<br />
������<br />
����������������<br />
�����<br />
�����<br />
�����<br />
��������������������������<br />
���������������<br />
���������������<br />
��������������<br />
���������������<br />
�����������<br />
������������������<br />
�����<br />
�����<br />
�����<br />
����<br />
������������������<br />
��������<br />
��������������������<br />
��������<br />
����������<br />
������������<br />
������<br />
���������<br />
������������������<br />
��������<br />
��������<br />
�������������<br />
������������������<br />
�������������������<br />
��������<br />
������������������<br />
����������������<br />
�������������<br />
������<br />
����������������������<br />
�����������������������<br />
��������������<br />
��������<br />
���������������������������<br />
���������<br />
� ��� �����<br />
�������������<br />
��<br />
��<br />
��<br />
��<br />
��<br />
��<br />
��<br />
��<br />
��<br />
��<br />
��<br />
��<br />
��<br />
��<br />
��<br />
��<br />
��<br />
��<br />
��<br />
��<br />
��<br />
��<br />
��<br />
��<br />
��<br />
��<br />
��<br />
��<br />
��<br />
��<br />
��<br />
��<br />
��<br />
��<br />
��<br />
�����<br />
�����<br />
���� ������ �������<br />
����� ����
APPENDIX TM3-03<br />
EXISTING GEOLOGIC MAPPING<br />
091337137, 2011-018, TT005 <strong>Maricopa</strong> <strong>County</strong> <strong>Department</strong> <strong>of</strong> <strong>Transportation</strong><br />
Technical Memorandum 3 Deer Valley Parkway Feasibility Study<br />
<strong>Drainage</strong> <strong>Overview</strong> April 2012
Deer Valley �������<br />
����� ����
Deer Valley �������<br />
����� ����
APPENDIX TM3-04<br />
SUBSIDENCE DOCUMENTATION<br />
091337137, 2011-018, TT005 <strong>Maricopa</strong> <strong>County</strong> <strong>Department</strong> <strong>of</strong> <strong>Transportation</strong><br />
Technical Memorandum 3 Deer Valley Parkway Feasibility Study<br />
<strong>Drainage</strong> <strong>Overview</strong> April 2012
Ranegras Valley<br />
McMullen Valley<br />
!<br />
!<br />
Harquahala Valley<br />
! Arizona Land Subsidence Areas<br />
Arizona Highways and Interstates<br />
Interstate<br />
US<br />
State<br />
!<br />
Gila Bend<br />
West Valley all<br />
Buckeye<br />
!<br />
!<br />
!<br />
!<br />
Scottsdale<br />
!<br />
Rainbow Valley<br />
!<br />
<strong>Maricopa</strong>-Stanfield<br />
1:2,832,259<br />
µ<br />
���� ������ �������<br />
����� ����<br />
Hawk Rock<br />
!<br />
!<br />
Picacho<br />
Tucson<br />
!<br />
!<br />
Green Valley<br />
0 15 30 60 90<br />
Miles<br />
120<br />
Fort Grant<br />
!<br />
!<br />
!<br />
Elfrida<br />
Bowie<br />
Kansas Settlement<br />
Active Land Subsidence Areas in Arizona Based on ADWR InSAR Data<br />
InSAR Data is Processed and Analyzed By the Geophysics/Surveying Unit <strong>of</strong> the Hydrology Division<br />
! !<br />
San Simon
03/08/2004 To 09/13/2010<br />
Subsidence<br />
Decorrelation/No Data<br />
8 To 10 cm<br />
6 To 8 cm<br />
4 To 6 cm<br />
2 To 4 cm<br />
0 To 2 cm<br />
Subsidence Feature<br />
Hardrock<br />
CAP Canal<br />
Highways and Interstates<br />
Interstate<br />
US<br />
State<br />
Roads<br />
Railway<br />
���� ������ �������<br />
����� ����<br />
rx 303<br />
Land Subsidence in Western Metropolitan Phoenix<br />
Based on ADWR EnviSat Time-Series InSAR Data<br />
Time Period <strong>of</strong> Analysis: 6.5 Years 03/08/2004 To 09/13/2010<br />
1:183,029<br />
µ<br />
rx 101<br />
Thunderbird Rd<br />
§¨¦ 10<br />
Happy Valley Rd<br />
© ESA 2004 - 2010<br />
0 1 2 4 6<br />
Miles<br />
8<br />
Decorrelation (white areas) are areas where the phase<br />
<strong>of</strong> the received satellite signal changed between<br />
satellite passes, causing the data to be unusable.<br />
This occurs in areas where the land surface has been<br />
disturbed (i.e. bodies <strong>of</strong> water, snow, agriculture areas,<br />
areas <strong>of</strong> development, etc).
APPENDIX TM3-05<br />
DRAINAGE FIELD PHOTOS<br />
091337137, 2011-018, TT005 <strong>Maricopa</strong> <strong>County</strong> <strong>Department</strong> <strong>of</strong> <strong>Transportation</strong><br />
Technical Memorandum 3 Deer Valley Parkway Feasibility Study<br />
<strong>Drainage</strong> <strong>Overview</strong> April 2012
Dixileta Dr<br />
Patton Rd<br />
Jomax Rd<br />
Happy Valley Rd<br />
Pinnacle Peak Rd<br />
Deer Valley Rd<br />
Beardsley Rd<br />
Union Hills Dr<br />
Bell Rd<br />
259th Ave<br />
251st Ave<br />
243rd Ave<br />
249<br />
912<br />
235th Ave<br />
914<br />
213, 217<br />
254<br />
243<br />
230<br />
Sun Valley Pkwy<br />
227th Ave<br />
209, 210<br />
219th Ave<br />
229<br />
205<br />
201 175 906 147, 148<br />
211th Ave<br />
203rd Ave<br />
Deer Valley Parkway<br />
Feasibility Study<br />
195th Ave<br />
165<br />
187th Ave<br />
Beardsley Canal<br />
Citrus Rd<br />
903<br />
Cotton Ln<br />
895<br />
0 0.25 0.5 1<br />
Appendix TM3-05. <strong>Drainage</strong> Field Photo Locations<br />
896<br />
Miles<br />
Study Area<br />
Photo Location/Number<br />
Dam<br />
Canals<br />
Wash<br />
River<br />
100-yr Floodplain<br />
(FEMA & FCDMC)<br />
Sarival Ave<br />
Reems Rd<br />
<strong>Maricopa</strong> <strong>County</strong>, Arizona
Photo 896: McMicken Dam spillway<br />
Photo 895: Culverts crossing Deer Valley Road at 4 East Wash looking downstream
Photo 903: Bridge over 1 West Wash<br />
Photo 147: Bridge over 2 West Wash looking downstream
Photo 148: 2 West Wash looking upstream<br />
Photo 165: Cracking in Deer Valley Road at the Northwest Regional Landfill
Photo 906: <strong>Drainage</strong> channel upstream <strong>of</strong> Deer Valley Road at the Northwest Regional Landfill<br />
Photo 175: Scour holes upstream <strong>of</strong> the Northwest Regional Landfill
Photo 201: Trilby Wash looking downstream<br />
Photo 205: Iona Wash looking downstream
Photo 209: Iona Wash (West Split) looking downstream<br />
Photo 210: Iona Wash (West Split) looking east
Photo 213: 5 West Wash looking upstream<br />
Photo 912: Wash 1 upstream <strong>of</strong> Deer Valley Rd alignment
Photo 217: Desiccation cracks near 5 West Wash<br />
Photo 229: Wash 5 at the power line corridor
Photo 230: Wash 4 at power line corridor looking downstream<br />
Photo 914: Wash 3 at Deer Valley Rd alignment
Photo 243: Scour near Wash 3<br />
Photo 249: Culverts crossing 243rd Ave at Wash 2
Photo 254: Wash 2 looking downstream
APPENDIX TM3-06<br />
EXISTING GEOLOGIC FLOOD HAZARD MAPPING<br />
WHITE TANK MOUNTAINS<br />
091337137, 2011-018, TT005 <strong>Maricopa</strong> <strong>County</strong> <strong>Department</strong> <strong>of</strong> <strong>Transportation</strong><br />
Technical Memorandum 3 Deer Valley Parkway Feasibility Study<br />
<strong>Drainage</strong> <strong>Overview</strong> April 2012
Plate 1a<br />
Plate 1b<br />
Background images from: White Tanks Mountains Flood Hazard Map<br />
(Arizona Geological Survey Open File Report 91-10) °<br />
������������Parkway<br />
Feasibility Study<br />
Study Area<br />
Regulatory Floodplain<br />
Appendix TM3-06. White Tanks Flood Hazard Map<br />
0 5,000<br />
2,500<br />
Feet<br />
<strong>Maricopa</strong> <strong>County</strong>, Arizona
Legend image from: White Tanks Mountains Flood Hazard Map<br />
(Arizona Geological Survey Open File Report 91-10)<br />
������������Parkway<br />
Feasibility Study<br />
<strong>Maricopa</strong> <strong>County</strong>, Arizona<br />
Appendix TM3-06. White Tanks Flood Hazard Map Legend
APPENDIX TM3-07<br />
RECOMMENDED AREA DRAINAGE MASTER PLAN IMPROVEMENTS<br />
ALLUVIAL FANS<br />
091337137, 2011-018, TT005 <strong>Maricopa</strong> <strong>County</strong> <strong>Department</strong> <strong>of</strong> <strong>Transportation</strong><br />
Technical Memorandum 3 Deer Valley Parkway Feasibility Study<br />
<strong>Drainage</strong> <strong>Overview</strong> April 2012
���� ������ �������<br />
����� ����
APPENDIX TM3-08<br />
EXISTING EROSION HAZARD MAPPING<br />
091337137, 2011-018, TT005 <strong>Maricopa</strong> <strong>County</strong> <strong>Department</strong> <strong>of</strong> <strong>Transportation</strong><br />
Technical Memorandum 3 Deer Valley Parkway Feasibility Study<br />
<strong>Drainage</strong> <strong>Overview</strong> April 2012
16. Rapid and significant changes in main channel geometry and<br />
capacity, particularly alternating single and highly braided<br />
reaches.<br />
An example where an avulsion has already taken place occurs in the area<br />
near where the Iona West Wash, the CAP-5 West Wash and the Trilby<br />
Wash converge. In this area, an access road for power lines wash was<br />
captured by the CAP-5 West Wash. This road converted into a channel<br />
has steep, vertical cutbanks as shown in Figure GR-96. For a short<br />
distance, the CAP-5 West Wash changes its flow path as it follows this<br />
access road. Historically, the CAP-5 West Wash flowed in a<br />
southeastern direction in this area. Now, the wash flows directly east<br />
along this road before it heads south. The new and historic flow paths<br />
are clearly visible in the aerial photograph shown in Figure GR-97.<br />
Figure GR-96. Access road that was captured by the channel (from WPT213 near the<br />
where the Iona West Wash, the CAP-5 West Wash, and the Trilby Wash converge)<br />
7-165
CAP- 5 WEST<br />
ACCESS ROAD<br />
Figure GR-97. The CAP-5 West Wash has captured the power line access road and<br />
changes its flow path<br />
To identify areas with high avulsion potential, the parameter dv 2 was<br />
calculated for the overbanks using the HEC-RAS hydraulic models. The<br />
necessary hydraulic parameters for Trilby Wash, Iona East Wash, Iona<br />
West Wash, and CAP-1 West Wash are shown in Table GR-31, Table<br />
GR-32, Table GR-33, and Table GR-34, respectively. The overbanks<br />
<strong>of</strong> the various washes were examined for areas in which the dv 2<br />
parameter was greater than 18 ft 3 /s 2 . These areas were flagged as areas<br />
<strong>of</strong> high avulsion potential. The dv 2 parameter was not the only thing<br />
considered when identifying areas <strong>of</strong> high avulsion potential; the other<br />
15 indicative characteristics listed from above were also considered.<br />
Using these characteristics, areas <strong>of</strong> high avulsion potential were<br />
identified as shown in Figure GR-111 for the Trilby/Iona system and in<br />
7-166
SUN VALLEY PKWY<br />
Deer Valley �������<br />
����� ����<br />
Figure GR-109. Recommended erosion hazard zone for the Trilby Wash, the Iona East Wash, and the Iona West Wash<br />
7-186
Deer Valley �������<br />
����� ����<br />
Figure GR-110. Recommended erosion hazard zone for the CAP-1 West Wash<br />
7-187
���� ������ �������<br />
����� ����
APPENDIX TM3-09-1<br />
EXISTING DRAINAGE STRUCTURE DOCUMENTATION<br />
SUN VALLEY PARKWAY CULVERTS<br />
091337137, 2011-018, TT005 <strong>Maricopa</strong> <strong>County</strong> <strong>Department</strong> <strong>of</strong> <strong>Transportation</strong><br />
Technical Memorandum 3 Deer Valley Parkway Feasibility Study<br />
<strong>Drainage</strong> <strong>Overview</strong> April 2012
APPENDIX TM3-09-2<br />
EXISTING DRAINAGE STRUCTURE DOCUMENTATION<br />
MCMICKEN DAM<br />
091337137, 2011-018, TT005 <strong>Maricopa</strong> <strong>County</strong> <strong>Department</strong> <strong>of</strong> <strong>Transportation</strong><br />
Technical Memorandum 3 Deer Valley Parkway Feasibility Study<br />
<strong>Drainage</strong> <strong>Overview</strong> April 2012
90+00<br />
80+00<br />
370+00<br />
360+00<br />
350+00<br />
340+00<br />
330+00<br />
320+00<br />
310+00<br />
300+00<br />
290+00<br />
280+00<br />
270+00<br />
260+00<br />
250+00<br />
240+00<br />
230+00<br />
220+00<br />
210+00<br />
200+00<br />
190+00<br />
180+00<br />
170+00<br />
160+00<br />
150+00<br />
140+00<br />
130+00<br />
120+00<br />
110+00<br />
100+00<br />
Legend<br />
District Property Boundary<br />
Earth Fissure Risk Zones<br />
High Risk<br />
Moderate Risk<br />
Low-Moderate Risk<br />
Low Risk<br />
���� ������ �������<br />
����� ����<br />
NOTE: Earth Fissure Risk Zones<br />
are for dam safety purposes only.<br />
Glendale Ave<br />
530+00<br />
520+00<br />
510+00<br />
500+00<br />
490+00<br />
480+00<br />
470+00<br />
460+00<br />
450+00<br />
440+00<br />
430+00<br />
420+00<br />
410+00<br />
400+00<br />
390+00<br />
380+00<br />
303<br />
60<br />
0.5 0.25 0 0.5 1<br />
Miles<br />
WITTMANN AREA DRAINAGE MASTER PLAN<br />
FLOOD CONTROL DISTRICT OF MARICOPA COUNTY<br />
MA-4.4.14<br />
EARTH FISSURE RISK ZONES<br />
Dsgn:KCF Drn:EMP Chk:BH
Proposed<br />
End <strong>of</strong> Dam<br />
Segment<br />
Remove<br />
Existing<br />
Dike<br />
Principal<br />
Outlet<br />
!(<br />
52000<br />
51500<br />
51000<br />
!(<br />
46500<br />
!(<br />
!(<br />
!(<br />
!(<br />
!(<br />
!(<br />
!(<br />
!(<br />
!(<br />
53400<br />
!(<br />
53000<br />
52500<br />
!(<br />
!(<br />
50500<br />
50000<br />
49500<br />
49000<br />
48500<br />
Remove Existing<br />
Shooting Range<br />
Facilities and<br />
Regrade<br />
(By Others)<br />
Proposed<br />
Training<br />
Dike<br />
48000<br />
!( 47500<br />
10+00<br />
47000 12+50<br />
Remove<br />
Existing<br />
Dike<br />
(By Others)<br />
25+00<br />
20+00<br />
Lengthen Existing<br />
Syphon<br />
30+00<br />
£¤ 60<br />
New Channel<br />
50+00 55+00<br />
45+00<br />
Raise Outlet Channel Levee<br />
SPILLWAY FLOWS:<br />
Q =90,92 5cfs<br />
p<br />
0 190 380 760<br />
Feet<br />
PMF<br />
Q =10,115 cfs<br />
500<br />
Q =2,395 cfs<br />
200<br />
90+00<br />
85+00<br />
80+00<br />
75+00<br />
70+00<br />
Legend<br />
FCDMC Property Li ne<br />
Index Contour<br />
2' Contour<br />
Q = 0 cfs<br />
100<br />
Emergency Spillway Cente rl ine<br />
McMi cken Dam Centerline<br />
McMi cken Dam Outlet Cha nnelCenterline<br />
Excess ROW<br />
Proposed Emergency Spill way<br />
Re move Existing Di ke (By Others)<br />
Dsgn : JS Dr n: C JC Chk: HAA<br />
WITTMANN A REA D RAINAGE MASTER PLAN<br />
FLOOD CON TROL DISTR ICT OF MARIC OPA C OUN TY<br />
FIGURE MA - 4.4.5A<br />
PROPOSED SPILLWAY CONFIGURATION
WITTMANN AREA DRAINAGE MASTER PLAN<br />
FLOOD CONTROL DISTRICT OF MARICOPA COUNTY<br />
FIGURE MA - 4.4.5B<br />
Proposed Emergency Spillway Typical Section
APPENDIX TM3-10-1<br />
EXISTING HYDROLOGY RESULTS<br />
EXCERPTS FROM WITTMANN ADMSU<br />
091337137, 2011-018, TT005 <strong>Maricopa</strong> <strong>County</strong> <strong>Department</strong> <strong>of</strong> <strong>Transportation</strong><br />
Technical Memorandum 3 Deer Valley Parkway Feasibility Study<br />
<strong>Drainage</strong> <strong>Overview</strong> April 2012
Table D.6: Summary <strong>of</strong> Peak Discharges<br />
100-yr 24-hr Storm 100-yr 6-hr Storm<br />
Model ID <strong>Drainage</strong> Area Exst. Cond. Fut. Cond. <strong>Drainage</strong> Area Exst. Cond. Fut. Cond.<br />
Appendix D.6 Page 1 <strong>of</strong> 13<br />
Controlling Storm<br />
Exst. Cond. Fut Cond.<br />
[mi 2 ] Q [cfs] Q [cfs] [mi 2 ] Q [cfs] Q [cfs] Storm Q [cfs] Storm Q [cfs]<br />
AF800 0.72 736 730 0.72 945 952 6-hour 945 6-hour 952<br />
AF802 0.39 425 452 0.39 618 671 6-hour 618 6-hour 671<br />
AF803 2.84 1,811 1,783 2.84 2,044 2,004 6-hour 2,044 6-hour 2,004<br />
AF805 0.63 572 564 0.63 810 805 6-hour 810 6-hour 805<br />
AF807 1.02 1,553 1,627 1.02 1,789 1,935 6-hour 1,789 6-hour 1,935<br />
AF810 2.12 1,393 1,553 2.12 1,543 1,820 6-hour 1,543 6-hour 1,820<br />
AF820 0.70 411 404 0.70 592 584 6-hour 592 6-hour 584<br />
AF830 0.27 244 236 0.27 356 349 6-hour 356 6-hour 349<br />
AF850 0.22 405 445 0.22 585 633 6-hour 585 6-hour 633<br />
AF852 0.17 340 341 0.17 479 481 6-hour 479 6-hour 481<br />
AF854 0.34 583 586 0.34 863 866 6-hour 863 6-hour 866<br />
AF860 0.36 319 369 0.36 476 543 6-hour 476 6-hour 543<br />
AF862 0.18 365 358 0.18 542 533 6-hour 542 6-hour 533<br />
AF864 0.09 79 74 0.09 116 108 6-hour 116 6-hour 108<br />
AF866 0.45 609 620 0.45 896 912 6-hour 896 6-hour 912<br />
C200* 42.48 7,752 9,392 42.48 7,146 9,128 24-hour 7,752 24-hour 9,392<br />
C205* 1.57 919 932 1.57 1,114 1,162 6-hour 1,114 6-hour 1,162<br />
C210* 40.83 7,445 9,095 40.83 6,969 8,907 24-hour 7,445 24-hour 9,095<br />
C216* 2.38 1,079 1,193 2.38 1,295 1,480 6-hour 1,295 6-hour 1,480<br />
C230* 3.91 3,546 3,549 3.91 3,331 3,427 24-hour 3,546 24-hour 3,549<br />
C242* 3.76 2,883 3,084 3.76 2,739 3,039 24-hour 2,883 24-hour 3,084<br />
C302* 54.75 10,663 10,627 54.72 9,848 9,876 24-hour 10,663 24-hour 10,627<br />
C350* 22.23 6,553 6,347 22.22 6,985 6,672 6-hour 6,985 6-hour 6,672<br />
C359* 1.45 778 780 1.45 990 1,004 6-hour 990 6-hour 1,004<br />
C363* 0.54 279 264 0.72 508 490 6-hour 508 6-hour 490<br />
C364* 16.90 5,271 5,346 16.95 5,401 5,578 6-hour 5,401 6-hour 5,578<br />
C390A 5.07 2,903 2,890 5.07 3,030 3,115 6-hour 3,030 6-hour 3,115<br />
C410* 104.45 14,102 15,013 104.42 11,834 12,703 24-hour 14,102 24-hour 15,013<br />
C430* 19.33 3,802 3,754 19.33 3,980 4,054 6-hour 3,980 6-hour 4,054<br />
C442* 12.26 3,831 3,721 12.29 4,121 4,221 6-hour 4,121 6-hour 4,221<br />
C446A 0.42 249 238 0.50 420 408 6-hour 420 6-hour 408<br />
C450B 6.35 2,786 2,834 6.38 3,226 3,447 6-hour 3,226 6-hour 3,447<br />
C452B 3.38 1,302 1,239 3.38 1,645 1,579 6-hour 1,645 6-hour 1,579<br />
C508* 40.64 7,495 8,068 41.72 6,337 7,058 24-hour 7,495 24-hour 8,068<br />
C530* 2.13 1,068 1,309 2.13 1,333 1,662 6-hour 1,333 6-hour 1,662<br />
C538A 2.02 1,278 1,268 2.02 1,595 1,598 6-hour 1,595 6-hour 1,598<br />
C562* 5.03 2,509 2,152 5.03 2,896 2,507 6-hour 2,896 6-hour 2,507<br />
* <strong>Drainage</strong> areas may differ between the 24-hour and 6-hour storms: the HEC-1 hard coding was performed separately for the 24-hour and 6-hour storms.
Table D.6: Summary <strong>of</strong> Peak Discharges<br />
100-yr 24-hr Storm 100-yr 6-hr Storm<br />
Model ID <strong>Drainage</strong> Area Exst. Cond. Fut. Cond. <strong>Drainage</strong> Area Exst. Cond. Fut. Cond.<br />
Appendix D.6 Page 2 <strong>of</strong> 13<br />
Controlling Storm<br />
Exst. Cond. Fut Cond.<br />
[mi 2 ] Q [cfs] Q [cfs] [mi 2 ] Q [cfs] Q [cfs] Storm Q [cfs] Storm Q [cfs]<br />
C576B 1.69 687 619 1.69 919 837 6-hour 919 6-hour 837<br />
C580A 3.13 2,218 1,878 3.13 2,424 2,129 6-hour 2,424 6-hour 2,129<br />
C600A 8.62 1,288 1,493 9.67 1,221 1,410 24-hour 1,288 24-hour 1,493<br />
C606A 4.08 363 375 3.55 368 396 6-hour 368 6-hour 396<br />
C624A 6.92 2,060 2,199 7.56 1,746 2,115 24-hour 2,060 24-hour 2,199<br />
C700* 302.88 6,286 7,625 302.88 4,027 5,534 24-hour 6,286 24-hour 7,625<br />
C708* 3.70 1,563 1,750 3.70 1,685 2,010 6-hour 1,685 6-hour 2,010<br />
C726* 41.19 3,037 3,389 36.10 2,672 3,211 24-hour 3,037 24-hour 3,389<br />
C726A 21.41 1,812 1,971 18.85 1,657 1,909 24-hour 1,812 24-hour 1,971<br />
C726B 19.77 1,298 1,654 17.24 1,229 1,695 24-hour 1,298 6-hour 1,695<br />
C802* 313.51 7,038 8,537 313.51 4,057 5,638 24-hour 7,038 24-hour 8,537<br />
CAF807 4.49 2,508 2,600 4.49 2,926 2,905 6-hour 2,926 6-hour 2,905<br />
CAF810 320.12 7,163 8,766 320.12 4,048 5,631 24-hour 7,163 24-hour 8,766<br />
CAF820 320.81 7,160 8,755 320.81 4,038 5,615 24-hour 7,160 24-hour 8,755<br />
CAF850 0.72 1,140 1,184 0.72 1,545 1,596 6-hour 1,545 6-hour 1,596<br />
CAF852 0.51 812 817 0.51 1,174 1,179 6-hour 1,174 6-hour 1,179<br />
CAF860 1.08 860 914 1.08 1,151 1,226 6-hour 1,151 6-hour 1,226<br />
CAF862 0.26 373 364 0.26 555 543 6-hour 555 6-hour 543<br />
CAP1* 53.75 14,390 15,575 53.76 13,205 14,655 24-hour 14,390 24-hour 15,575<br />
CAP2* 39.36 8,461 10,018 33.74 6,672 8,797 24-hour 8,461 24-hour 10,018<br />
CIW300 30.57 6,941 7,056 30.55 6,611 6,819 24-hour 6,941 24-hour 7,056<br />
CIW302 24.18 5,078 5,239 24.24 5,042 5,220 24-hour 5,078 24-hour 5,239<br />
CIW310 1.75 708 686 1.75 885 891 6-hour 885 6-hour 891<br />
CIW314 29.09 7,496 7,416 29.07 7,566 7,448 6-hour 7,566 6-hour 7,448<br />
CIW322 25.16 7,021 6,791 25.14 7,314 7,020 6-hour 7,314 6-hour 7,020<br />
CIW330 23.27 6,608 6,392 23.25 6,979 6,677 6-hour 6,979 6-hour 6,677<br />
CIW334 22.85 5,156 5,266 22.91 5,175 5,351 6-hour 5,175 6-hour 5,351<br />
CIW338 21.26 5,213 5,289 21.32 5,248 5,425 6-hour 5,248 6-hour 5,425<br />
CIW342 17.25 5,157 5,226 17.30 5,302 5,474 6-hour 5,302 6-hour 5,474<br />
CIW346 20.92 5,247 5,319 20.98 5,297 5,470 6-hour 5,297 6-hour 5,470<br />
CIW349 12.30 5,399 5,508 12.27 5,506 5,721 6-hour 5,506 6-hour 5,721<br />
CIW350 17.41 5,647 5,297 17.45 6,037 5,645 6-hour 6,037 6-hour 5,645<br />
CIW351 1.71 559 568 1.67 697 711 6-hour 697 6-hour 711<br />
CIW352 6.31 2,192 2,204 6.39 2,291 2,355 6-hour 2,291 6-hour 2,355<br />
CIW353 15.24 5,023 4,662 15.28 5,494 5,051 6-hour 5,494 6-hour 5,051<br />
CIW354 14.59 5,244 5,334 14.64 5,405 5,595 6-hour 5,405 6-hour 5,595<br />
CIW356 14.23 5,308 5,397 14.28 5,452 5,643 6-hour 5,452 6-hour 5,643<br />
* <strong>Drainage</strong> areas may differ between the 24-hour and 6-hour storms: the HEC-1 hard coding was performed separately for the 24-hour and 6-hour storms.
Table D.6: Summary <strong>of</strong> Peak Discharges<br />
100-yr 24-hr Storm 100-yr 6-hr Storm<br />
Model ID <strong>Drainage</strong> Area Exst. Cond. Fut. Cond. <strong>Drainage</strong> Area Exst. Cond. Fut. Cond.<br />
Appendix D.6 Page 4 <strong>of</strong> 13<br />
Controlling Storm<br />
Exst. Cond. Fut Cond.<br />
[mi 2 ] Q [cfs] Q [cfs] [mi 2 ] Q [cfs] Q [cfs] Storm Q [cfs] Storm Q [cfs]<br />
CPI615 6.21 701 798 7.20 952 982 6-hour 952 6-hour 982<br />
CPI618 5.48 629 656 6.46 661 866 6-hour 661 6-hour 866<br />
CPI621 10.22 1,200 1,397 11.70 1,028 1,287 24-hour 1,200 24-hour 1,397<br />
CPI624 8.57 1,837 2,360 9.21 1,564 2,243 24-hour 1,837 24-hour 2,360<br />
CPI628 4.11 750 763 4.75 594 1,057 24-hour 750 6-hour 1,057<br />
CPI633 241.94 3,906 3,160 246.48 2,199 2,865 24-hour 3,906 24-hour 3,160<br />
CPI635 223.30 2,908 677 225.17 1,523 2,123 24-hour 2,908 6-hour 2,123<br />
CPI639 0.37 173 184 0.43 288 310 6-hour 288 6-hour 310<br />
CPI645 11.72 4,921 4,890 11.72 5,320 5,404 6-hour 5,320 6-hour 5,404<br />
CPI651 7.26 3,455 3,308 7.26 3,894 3,811 6-hour 3,894 6-hour 3,811<br />
CPI654 6.34 3,103 2,831 6.34 3,587 3,352 6-hour 3,587 6-hour 3,352<br />
CPI660 2.31 986 906 2.31 1,270 1,172 6-hour 1,270 6-hour 1,172<br />
CPI672 6.98 2,266 2,407 6.98 2,483 2,753 6-hour 2,483 6-hour 2,753<br />
CPI675 14.77 6,454 6,800 14.77 6,471 7,156 6-hour 6,471 6-hour 7,156<br />
CPI678 19.55 9,081 9,528 19.55 8,723 9,652 24-hour 9,081 6-hour 9,652<br />
CPI681 18.72 9,687 10,027 18.72 9,152 10,009 24-hour 9,687 24-hour 10,027<br />
CPI684 17.73 10,128 10,632 17.73 9,384 10,270 24-hour 10,128 24-hour 10,632<br />
CPI687 16.99 10,065 10,688 16.99 9,390 10,250 24-hour 10,065 24-hour 10,688<br />
CPI689 9.98 6,934 7,340 9.98 6,591 7,228 24-hour 6,934 24-hour 7,340<br />
CPI690 14.71 6,673 7,007 14.71 6,659 7,346 24-hour 6,673 6-hour 7,346<br />
CSV200 99.52 14,084 14,856 99.49 11,885 12,735 24-hour 14,084 24-hour 14,856<br />
CSV212 38.68 7,363 8,859 38.68 6,822 8,643 24-hour 7,363 24-hour 8,859<br />
CSV216 6.82 2,345 2,364 6.82 2,621 2,753 6-hour 2,621 6-hour 2,753<br />
CSV218 2.82 1,692 1,668 2.82 1,767 1,834 6-hour 1,767 6-hour 1,834<br />
CSV219 1.14 1,104 1,112 1.14 1,122 1,150 6-hour 1,122 6-hour 1,150<br />
CSV220 30.63 6,753 7,844 30.63 6,403 7,777 24-hour 6,753 24-hour 7,844<br />
CSV244 1.62 720 804 1.62 917 1,053 6-hour 917 6-hour 1,053<br />
CSV246 0.76 395 421 0.76 514 555 6-hour 514 6-hour 555<br />
CSV256 0.44 340 391 0.44 484 564 6-hour 484 6-hour 564<br />
CSV260 16.99 5,765 6,663 16.99 6,422 7,564 6-hour 6,422 6-hour 7,564<br />
CSV264 4.82 2,264 2,474 4.82 2,714 3,000 6-hour 2,714 6-hour 3,000<br />
CSV272 3.84 1,566 1,843 3.84 1,966 2,342 6-hour 1,966 6-hour 2,342<br />
CSV276 7.41 3,247 3,634 7.41 3,738 4,303 6-hour 3,738 6-hour 4,303<br />
CSV280 9.54 3,723 4,203 9.54 4,248 4,905 6-hour 4,248 6-hour 4,905<br />
CSV284 1.82 1,157 1,270 1.82 1,449 1,635 6-hour 1,449 6-hour 1,635<br />
CTW400 163.05 17,339 21,188 163.08 11,450 14,523 24-hour 17,339 24-hour 21,188<br />
CTW402 135.09 16,124 19,464 135.06 11,555 14,148 24-hour 16,124 24-hour 19,464<br />
* <strong>Drainage</strong> areas may differ between the 24-hour and 6-hour storms: the HEC-1 hard coding was performed separately for the 24-hour and 6-hour storms.
Table D.6: Summary <strong>of</strong> Peak Discharges<br />
100-yr 24-hr Storm 100-yr 6-hr Storm<br />
Model ID <strong>Drainage</strong> Area Exst. Cond. Fut. Cond. <strong>Drainage</strong> Area Exst. Cond. Fut. Cond.<br />
Appendix D.6 Page 5 <strong>of</strong> 13<br />
Controlling Storm<br />
Exst. Cond. Fut Cond.<br />
[mi 2 ] Q [cfs] Q [cfs] [mi 2 ] Q [cfs] Q [cfs] Storm Q [cfs] Storm Q [cfs]<br />
CTW404 25.72 5,271 5,951 25.72 4,612 5,469 24-hour 5,271 24-hour 5,951<br />
CTW410 1.48 852 931 1.48 1,107 1,235 6-hour 1,107 6-hour 1,235<br />
CTW412 2.87 1,295 1,711 2.87 1,661 2,214 6-hour 1,661 6-hour 2,214<br />
CTW418 21.49 2,766 2,817 21.55 2,684 2,831 24-hour 2,766 6-hour 2,831<br />
CTW422 23.69 2,842 3,320 23.75 2,609 2,958 24-hour 2,842 24-hour 3,320<br />
CTW430 20.12 3,900 3,863 20.18 3,980 4,049 6-hour 3,980 6-hour 4,049<br />
CTW431 2.78 1,160 1,180 2.75 1,408 1,443 6-hour 1,408 6-hour 1,443<br />
CTW432 1.90 770 769 1.87 976 996 6-hour 976 6-hour 996<br />
CTW434 15.61 3,912 3,821 15.61 4,103 4,176 6-hour 4,103 6-hour 4,176<br />
CTW440 7.60 2,556 2,586 7.40 2,872 3,006 6-hour 2,872 6-hour 3,006<br />
CTW442 4.67 1,417 1,330 4.90 1,793 1,738 6-hour 1,793 6-hour 1,738<br />
CTW444 7.49 2,616 2,641 7.29 2,931 3,064 6-hour 2,931 6-hour 3,064<br />
CTW446 1.04 475 488 1.01 634 664 6-hour 634 6-hour 664<br />
CTW450 7.59 2,832 2,877 7.62 3,229 3,391 6-hour 3,229 6-hour 3,391<br />
CTW452 4.29 1,465 1,389 4.52 1,841 1,787 6-hour 1,841 6-hour 1,787<br />
CTW454 3.52 1,564 1,504 3.52 1,811 1,758 6-hour 1,811 6-hour 1,758<br />
CTW456 3.16 1,517 1,464 3.16 1,736 1,698 6-hour 1,736 6-hour 1,698<br />
CTW458 2.99 1,479 1,435 2.99 1,686 1,658 6-hour 1,686 6-hour 1,658<br />
CTW462 4.02 2,130 2,355 4.05 3,039 3,373 6-hour 3,039 6-hour 3,373<br />
CTW478 0.79 351 357 0.85 422 429 6-hour 422 6-hour 429<br />
CTW480 10.62 2,780 2,882 11.78 3,071 3,279 6-hour 3,071 6-hour 3,279<br />
CTW482 3.88 1,050 1,032 5.04 1,655 1,553 6-hour 1,655 6-hour 1,553<br />
CTW484 5.99 2,046 1,902 5.99 2,286 2,213 6-hour 2,286 6-hour 2,213<br />
CTW485 5.64 1,937 1,727 5.64 2,200 2,060 6-hour 2,200 6-hour 2,060<br />
CWI500 222.69 23,146 3,318 224.56 13,179 17,232 24-hour 23,146 6-hour 17,232<br />
CWI502 201.44 21,379 26,281 202.35 12,654 16,474 24-hour 21,379 24-hour 26,281<br />
CWI504 164.40 17,199 21,107 164.43 11,356 14,452 24-hour 17,199 24-hour 21,107<br />
CWI506 12.35 2,340 1,702 13.10 2,075 2,759 24-hour 2,340 6-hour 2,759<br />
CWI508 41.34 7,402 7,988 42.42 6,228 6,914 24-hour 7,402 24-hour 7,988<br />
CWI510 35.84 6,176 6,728 36.72 5,284 5,913 24-hour 6,176 24-hour 6,728<br />
CWI512 35.64 7,194 7,664 36.18 6,187 6,857 24-hour 7,194 24-hour 7,664<br />
CWI514 30.62 7,064 7,416 30.56 6,311 6,941 24-hour 7,064 24-hour 7,416<br />
CWI516 34.29 7,374 7,745 34.83 6,473 7,122 24-hour 7,374 24-hour 7,745<br />
CWI518 5.00 1,014 1,316 5.54 1,019 1,402 6-hour 1,019 6-hour 1,402<br />
CWI524 1.51 712 734 1.60 940 978 6-hour 940 6-hour 978<br />
CWI525 8.92 1,614 1,802 10.23 1,695 1,778 6-hour 1,695 24-hour 1,802<br />
CWI526 3.49 418 435 4.10 436 506 6-hour 436 6-hour 506<br />
* <strong>Drainage</strong> areas may differ between the 24-hour and 6-hour storms: the HEC-1 hard coding was performed separately for the 24-hour and 6-hour storms.
Table D.6: Summary <strong>of</strong> Peak Discharges<br />
100-yr 24-hr Storm 100-yr 6-hr Storm<br />
Model ID <strong>Drainage</strong> Area Exst. Cond. Fut. Cond. <strong>Drainage</strong> Area Exst. Cond. Fut. Cond.<br />
Appendix D.6 Page 9 <strong>of</strong> 13<br />
Controlling Storm<br />
Exst. Cond. Fut Cond.<br />
[mi 2 ] Q [cfs] Q [cfs] [mi 2 ] Q [cfs] Q [cfs] Storm Q [cfs] Storm Q [cfs]<br />
PI624A 2.81 1,630 1,827 2.81 1,577 1,953 24-hour 1,630 6-hour 1,953<br />
PI628 0.57 695 655 0.57 1,004 953 6-hour 1,004 6-hour 953<br />
PI633 0.34 280 297 0.34 383 411 6-hour 383 6-hour 411<br />
PI635 0.61 622 565 0.61 889 807 6-hour 889 6-hour 807<br />
PI636 0.43 384 373 0.43 576 566 6-hour 576 6-hour 566<br />
PI639 0.34 169 178 0.34 261 273 6-hour 261 6-hour 273<br />
PI642 0.24 162 184 0.24 247 278 6-hour 247 6-hour 278<br />
PI645 1.56 1,160 1,143 1.56 1,292 1,316 6-hour 1,292 6-hour 1,316<br />
PI645A 1.63 912 893 1.63 1,162 1,175 6-hour 1,162 6-hour 1,175<br />
PI648 1.73 1,035 969 1.73 1,286 1,246 6-hour 1,286 6-hour 1,246<br />
PI651 0.46 308 290 0.46 459 436 6-hour 459 6-hour 436<br />
PI654 4.03 2,372 2,194 4.03 2,695 2,599 6-hour 2,695 6-hour 2,599<br />
PI657 0.87 456 432 0.87 607 583 6-hour 607 6-hour 583<br />
PI660 0.84 339 320 0.84 455 432 6-hour 455 6-hour 432<br />
PI663 0.60 329 324 0.60 468 468 6-hour 468 6-hour 468<br />
PI669 0.29 144 145 0.29 219 223 6-hour 219 6-hour 223<br />
PI672 1.51 1,172 1,128 1.51 1,342 1,306 6-hour 1,342 6-hour 1,306<br />
PI675 0.06 72 72 0.06 106 106 6-hour 106 6-hour 106<br />
PI678 0.83 406 514 0.83 556 708 6-hour 556 6-hour 708<br />
PI681 0.99 598 585 0.99 792 798 6-hour 792 6-hour 798<br />
PI684 0.74 637 632 0.74 864 871 6-hour 864 6-hour 871<br />
PI687 7.01 4,139 4,342 7.01 4,123 4,438 24-hour 4,139 6-hour 4,438<br />
PI688 3.20 2,507 2,636 3.20 2,650 2,857 6-hour 2,650 6-hour 2,857<br />
PI689 6.78 4,688 4,972 6.78 4,695 5,150 6-hour 4,695 6-hour 5,150<br />
PI690 0.63 315 334 0.63 447 478 6-hour 447 6-hour 478<br />
PI693 0.84 756 732 0.84 1,003 980 6-hour 1,003 6-hour 980<br />
SV200 2.29 1,931 2,114 2.29 2,003 2,363 6-hour 2,003 6-hour 2,363<br />
SV202 1.44 1,078 1,032 1.44 1,323 1,314 6-hour 1,323 6-hour 1,314<br />
SV203 0.08 120 111 0.08 182 170 6-hour 182 6-hour 170<br />
SV205 0.50 747 739 0.50 1,102 1,095 6-hour 1,102 6-hour 1,095<br />
SV208 1.07 638 676 1.07 831 889 6-hour 831 6-hour 889<br />
SV210 0.72 1,189 1,216 0.72 1,553 1,606 6-hour 1,553 6-hour 1,606<br />
SV212 4.14 3,325 3,361 4.14 3,072 3,358 24-hour 3,325 24-hour 3,361<br />
SV214 1.87 1,910 1,944 1.87 2,019 2,185 6-hour 2,019 6-hour 2,185<br />
SV216 1.63 1,613 1,551 1.63 1,787 1,781 6-hour 1,787 6-hour 1,781<br />
SV218 1.29 1,039 986 1.29 1,258 1,225 6-hour 1,258 6-hour 1,225<br />
SV219 0.90 1,105 1,105 0.90 1,167 1,179 6-hour 1,167 6-hour 1,179<br />
* <strong>Drainage</strong> areas may differ between the 24-hour and 6-hour storms: the HEC-1 hard coding was performed separately for the 24-hour and 6-hour storms.
Table D.6: Summary <strong>of</strong> Peak Discharges<br />
100-yr 24-hr Storm 100-yr 6-hr Storm<br />
Model ID <strong>Drainage</strong> Area Exst. Cond. Fut. Cond. <strong>Drainage</strong> Area Exst. Cond. Fut. Cond.<br />
Appendix D.6 Page 10 <strong>of</strong> 13<br />
Controlling Storm<br />
Exst. Cond. Fut Cond.<br />
[mi 2 ] Q [cfs] Q [cfs] [mi 2 ] Q [cfs] Q [cfs] Storm Q [cfs] Storm Q [cfs]<br />
SV220 0.60 797 792 0.60 1,114 1,101 6-hour 1,114 6-hour 1,101<br />
SV230 0.85 1,276 1,261 0.85 1,582 1,580 6-hour 1,582 6-hour 1,580<br />
SV232 3.06 2,919 3,041 3.06 2,720 2,915 24-hour 2,919 24-hour 3,041<br />
SV236 0.59 521 527 0.59 763 760 6-hour 763 6-hour 760<br />
SV240 3.67 2,841 3,045 3.67 2,706 3,008 24-hour 2,841 24-hour 3,045<br />
SV242 0.09 63 63 0.09 93 94 6-hour 93 6-hour 94<br />
SV244 0.95 435 470 0.95 576 640 6-hour 576 6-hour 640<br />
SV246 0.16 200 197 0.16 287 285 6-hour 287 6-hour 285<br />
SV248 1.27 771 845 1.27 944 1,058 6-hour 944 6-hour 1,058<br />
SV250 0.12 107 104 0.12 156 157 6-hour 156 6-hour 157<br />
SV251 0.27 204 204 0.27 313 308 6-hour 313 6-hour 308<br />
SV252 0.15 104 108 0.15 158 162 6-hour 158 6-hour 162<br />
SV254 0.10 99 113 0.10 150 171 6-hour 150 6-hour 171<br />
SV256 0.06 68 79 0.06 104 121 6-hour 104 6-hour 121<br />
SV258 0.74 669 753 0.74 888 1,018 6-hour 888 6-hour 1,018<br />
SV260 1.26 1,154 1,091 1.26 1,404 1,354 6-hour 1,404 6-hour 1,354<br />
SV264 1.92 1,336 1,279 1.92 1,603 1,603 6-hour 1,603 6-hour 1,603<br />
SV264A 2.90 1,695 1,691 2.90 2,000 2,107 6-hour 2,000 6-hour 2,107<br />
SV268 1.38 1,349 1,292 1.38 1,628 1,618 6-hour 1,628 6-hour 1,618<br />
SV272 1.20 976 932 1.20 1,212 1,193 6-hour 1,212 6-hour 1,193<br />
SV276 0.92 678 643 0.92 905 874 6-hour 905 6-hour 874<br />
SV280 1.06 707 664 1.06 925 890 6-hour 925 6-hour 890<br />
SV284 0.28 337 341 0.28 491 495 6-hour 491 6-hour 495<br />
SV286 1.54 1,175 1,181 1.54 1,427 1,504 6-hour 1,427 6-hour 1,504<br />
SV290 0.81 653 664 0.81 881 914 6-hour 881 6-hour 914<br />
SV294 2.65 1,805 1,761 2.65 2,100 2,178 6-hour 2,100 6-hour 2,178<br />
SV298 1.08 506 493 1.08 672 667 6-hour 672 6-hour 667<br />
TW400 4.27 2,211 2,765 4.27 2,394 3,162 6-hour 2,394 6-hour 3,162<br />
TW402 4.91 3,179 3,492 4.91 3,158 3,774 24-hour 3,179 6-hour 3,774<br />
TW404 2.09 2,515 2,509 2.09 2,442 2,543 24-hour 2,515 6-hour 2,543<br />
TW406 0.16 375 378 0.16 521 525 6-hour 521 6-hour 525<br />
TW408 0.91 413 437 0.91 565 604 6-hour 565 6-hour 604<br />
TW410 0.31 178 204 0.31 254 290 6-hour 254 6-hour 290<br />
TW412 2.06 1,239 1,403 2.06 1,453 1,762 6-hour 1,453 6-hour 1,762<br />
TW414 1.17 2,018 2,027 1.17 2,191 2,227 6-hour 2,191 6-hour 2,227<br />
TW416 0.59 420 456 0.59 627 677 6-hour 627 6-hour 677<br />
TW418 1.37 1,476 1,473 1.37 1,784 1,835 6-hour 1,784 6-hour 1,835<br />
* <strong>Drainage</strong> areas may differ between the 24-hour and 6-hour storms: the HEC-1 hard coding was performed separately for the 24-hour and 6-hour storms.
Table D.6: Summary <strong>of</strong> Peak Discharges<br />
100-yr 24-hr Storm 100-yr 6-hr Storm<br />
Model ID <strong>Drainage</strong> Area Exst. Cond. Fut. Cond. <strong>Drainage</strong> Area Exst. Cond. Fut. Cond.<br />
Appendix D.6 Page 11 <strong>of</strong> 13<br />
Controlling Storm<br />
Exst. Cond. Fut Cond.<br />
[mi 2 ] Q [cfs] Q [cfs] [mi 2 ] Q [cfs] Q [cfs] Storm Q [cfs] Storm Q [cfs]<br />
TW420 0.81 575 662 0.81 778 923 6-hour 778 6-hour 923<br />
TW422 0.70 516 546 0.70 741 791 6-hour 741 6-hour 791<br />
TW424 1.50 2,046 2,112 1.50 2,266 2,372 6-hour 2,266 6-hour 2,372<br />
TW429 0.56 510 520 0.56 728 749 6-hour 728 6-hour 749<br />
TW430 2.49 2,816 2,732 2.49 2,825 2,852 6-hour 2,825 6-hour 2,852<br />
TW431 0.87 705 682 0.87 940 922 6-hour 940 6-hour 922<br />
TW432 0.86 588 574 0.86 787 778 6-hour 787 6-hour 778<br />
TW434 0.57 453 443 0.57 657 642 6-hour 657 6-hour 642<br />
TW436 0.67 729 733 0.67 1,001 1,007 6-hour 1,001 6-hour 1,007<br />
TW440 0.11 133 134 0.11 191 193 6-hour 191 6-hour 193<br />
TW442 0.38 373 386 0.38 546 567 6-hour 546 6-hour 567<br />
TW444 0.35 357 351 0.35 524 514 6-hour 524 6-hour 514<br />
TW446 0.35 361 345 0.35 522 503 6-hour 522 6-hour 503<br />
TW446A 0.34 221 210 0.34 322 309 6-hour 322 6-hour 309<br />
TW448 0.35 202 194 0.35 291 281 6-hour 291 6-hour 281<br />
TW450 1.25 661 625 1.25 857 825 6-hour 857 6-hour 825<br />
TW450A 0.88 709 692 0.88 937 927 6-hour 937 6-hour 927<br />
TW450B 0.40 452 430 0.40 651 626 6-hour 651 6-hour 626<br />
TW452 0.46 320 304 0.46 466 447 6-hour 466 6-hour 447<br />
TW452A 1.08 822 816 1.08 1,062 1,073 6-hour 1,062 6-hour 1,073<br />
TW452B 1.03 615 580 1.03 813 784 6-hour 813 6-hour 784<br />
TW454 0.36 128 123 0.36 195 188 6-hour 195 6-hour 188<br />
TW456 0.18 117 113 0.18 172 167 6-hour 172 6-hour 167<br />
TW458 0.67 726 725 0.67 985 991 6-hour 985 6-hour 991<br />
TW459 1.04 401 348 1.04 535 472 6-hour 535 6-hour 472<br />
TW460 2.32 1,213 1,171 2.32 1,412 1,362 6-hour 1,412 6-hour 1,362<br />
TW462 0.08 129 124 0.08 184 179 6-hour 184 6-hour 179<br />
TW478 0.26 351 353 0.26 465 470 6-hour 465 6-hour 470<br />
TW480 0.75 741 746 0.75 999 1,006 6-hour 999 6-hour 1,006<br />
TW482 0.76 678 758 0.76 909 1,039 6-hour 909 6-hour 1,039<br />
TW484 0.35 245 265 0.35 365 395 6-hour 365 6-hour 395<br />
TW485 2.37 1,589 1,536 2.37 1,746 1,789 6-hour 1,746 6-hour 1,789<br />
WI500 1.05 765 745 1.05 985 972 6-hour 985 6-hour 972<br />
WI502 1.21 669 687 1.21 851 900 6-hour 851 6-hour 900<br />
WI504 1.35 1,395 1,342 1.35 1,645 1,612 6-hour 1,645 6-hour 1,612<br />
WI506 1.58 961 1,036 1.58 1,175 1,284 6-hour 1,175 6-hour 1,284<br />
WI508 0.70 411 390 0.70 581 563 6-hour 581 6-hour 563<br />
* <strong>Drainage</strong> areas may differ between the 24-hour and 6-hour storms: the HEC-1 hard coding was performed separately for the 24-hour and 6-hour storms.
Wittmann ADMSU Addendum<br />
100-year 6-hour Future Conditions<br />
HYDROGRAPH AT<br />
+ SV272 1193. 4.42 271. 68. 23. 1.20<br />
3 COMBINED AT<br />
+ CSV272 2342. 5.25 908. 235. 78. 3.84<br />
ROUTED TO<br />
+ RSV272 2326. 5.33 908. 235. 78. 3.84<br />
HYDROGRAPH AT<br />
+ SV294 2178. 4.67 716. 184. 61. 2.65<br />
ROUTED TO<br />
+ RSV294 1952. 5.42 711. 184. 61. 2.65<br />
HYDROGRAPH AT<br />
+ SV276 874. 4.50 221. 56. 19. .92<br />
3 COMBINED AT<br />
+ CSV276 4303. 5.42 1729. 450. 150. 7.41<br />
ROUTED TO<br />
+ RSV276 4299. 5.42 1729. 450. 150. 7.41<br />
HYDROGRAPH AT<br />
+ SV280 890. 4.58 260. 66. 22. 1.06<br />
3 COMBINED AT<br />
+ CSV280 4905. 5.50 2148. 566. 189. 9.54<br />
ROUTED TO<br />
+ RSV280 4807. 5.75 2145. 566. 189. 9.54<br />
HYDROGRAPH AT<br />
+ SV268 1618. 4.42 372. 94. 31. 1.38<br />
ROUTED TO<br />
+ RSV268 1386. 4.75 371. 94. 31. 1.38<br />
HYDROGRAPH AT<br />
+ SV260 1354. 4.42 272. 68. 23. 1.26<br />
4 COMBINED AT<br />
+ CSV260 7564. 5.58 3611. 962. 321. 16.99<br />
ROUTED TO<br />
+ SCP010 4946. 6.67 3470. 959. 320. 16.99<br />
ROUTED TO<br />
+ RSV260 4937. 6.92 3460. 959. 320. 16.99<br />
HYDROGRAPH AT<br />
+ SV220 1101. 4.17 155. 39. 13. .60<br />
HYDROGRAPH AT<br />
+ SV252 162. 4.25 30. 8. 3. .15<br />
ROUTED TO<br />
+ RSV252 106. 5.17 30. 8. 3. .15<br />
HYDROGRAPH AT<br />
+ SV254 171. 4.17 24. 6. 2. .10<br />
ROUTED TO<br />
+ RSV254 96. 5.08 24. 6. 2. .10<br />
HYDROGRAPH AT<br />
+ SV219 1179. 4.33 230. 58. 19. .90<br />
3 COMBINED AT<br />
+ CSV219 1150. 4.33 273. 70. 23. 1.14<br />
ROUTED TO<br />
+ RSV219 975. 4.83 273. 70. 23. 1.14<br />
Page 29 <strong>of</strong> 56
Wittmann ADMSU Addendum<br />
100-year 6-hour Future Conditions<br />
HYDROGRAPH AT<br />
+ SV251 308. 4.25 49. 12. 4. .27<br />
ROUTED TO<br />
+ RSV251 205. 5.25 49. 12. 4. .27<br />
HYDROGRAPH AT<br />
+ SV250 157. 4.17 24. 6. 2. .12<br />
ROUTED TO<br />
+ RSV250 98. 5.25 24. 6. 2. .12<br />
HYDROGRAPH AT<br />
+ SV218 1225. 4.42 255. 64. 21. 1.29<br />
4 COMBINED AT<br />
+ CSV218 1834. 4.75 558. 143. 48. 2.82<br />
ROUTED TO<br />
+ RSV218 1726. 5.08 557. 143. 48. 2.82<br />
HYDROGRAPH AT<br />
+ SV248 1058. 4.67 277. 71. 24. 1.27<br />
DIVERSION TO<br />
+ DO248 497. 4.67 130. 33. 11. 1.27<br />
HYDROGRAPH AT<br />
+ D248 561. 4.67 147. 37. 12. 1.27<br />
ROUTED TO<br />
+ RSV248 489. 5.17 146. 37. 12. 1.27<br />
HYDROGRAPH AT<br />
+ SV244 640. 4.92 210. 54. 18. .95<br />
2 COMBINED AT<br />
+ CSV244 1053. 5.08 348. 89. 30. 1.62<br />
HYDROGRAPH AT<br />
+ SV246 285. 4.17 39. 10. 3. .16<br />
HYDROGRAPH AT<br />
+ D248 497. 4.67 130. 33. 11. 1.27<br />
ROUTED TO<br />
+ RD248 460. 5.00 130. 33. 11. 1.27<br />
2 COMBINED AT<br />
+ CSV246 555. 4.92 172. 44. 15. .76<br />
2 COMBINED AT<br />
+ C216* 1480. 5.00 500. 129. 43. 2.38<br />
ROUTED TO<br />
+ RSV244 1374. 5.75 498. 129. 43. 2.38<br />
HYDROGRAPH AT<br />
+ SV216 1781. 4.33 332. 83. 28. 1.63<br />
3 COMBINED AT<br />
+ CSV216 2753. 5.33 1240. 323. 108. 6.82<br />
ROUTED TO<br />
+ RSV216 2722. 5.75 1237. 323. 108. 6.82<br />
HYDROGRAPH AT<br />
+ SV236 760. 4.25 107. 27. 9. .59<br />
ROUTED TO<br />
+ RSV236 414. 5.50 107. 27. 9. .59<br />
HYDROGRAPH AT<br />
Page 30 <strong>of</strong> 56
Wittmann ADMSU Addendum<br />
100-year 6-hour Future Conditions<br />
+ SV240 3008. 4.75 686. 173. 58. 3.67<br />
HYDROGRAPH AT<br />
+ SV242 94. 4.25 17. 4. 1. .09<br />
2 COMBINED AT<br />
+ C242* 3039. 4.75 697. 176. 59. 3.76<br />
ROUTED TO<br />
+ R242* 2794. 5.33 696. 176. 59. 3.76<br />
HYDROGRAPH AT<br />
+ SV214 2185. 4.33 438. 110. 37. 1.87<br />
6 COMBINED AT<br />
+ CSV220 7777. 5.83 5053. 1425. 475. 30.63<br />
ROUTED TO<br />
+ RSV220 7745. 6.25 5031. 1425. 475. 30.63<br />
HYDROGRAPH AT<br />
+ SV230 1580. 4.17 193. 48. 16. .85<br />
HYDROGRAPH AT<br />
+ SV232 2915. 4.58 603. 152. 51. 3.06<br />
2 COMBINED AT<br />
+ C230* 3427. 4.50 764. 192. 64. 3.91<br />
ROUTED TO<br />
+ R230* 3271. 4.92 760. 192. 64. 3.91<br />
HYDROGRAPH AT<br />
+ SV212 3358. 4.50 821. 208. 69. 4.14<br />
3 COMBINED AT<br />
+ CSV212 8643. 5.83 5829. 1680. 560. 38.68<br />
ROUTED TO<br />
+ RSV212 8505. 6.42 5763. 1680. 560. 38.68<br />
HYDROGRAPH AT<br />
+ SV202 1314. 4.58 356. 90. 30. 1.44<br />
ROUTED TO<br />
+ RSV202 1253. 4.92 355. 90. 30. 1.44<br />
HYDROGRAPH AT<br />
+ SV210 1606. 4.08 189. 47. 16. .72<br />
ROUTED TO<br />
+ RSV210 1000. 5.00 188. 47. 16. .72<br />
3 COMBINED AT<br />
+ C210* 8907. 6.33 6034. 1770. 590. 40.83<br />
HYDROGRAPH AT<br />
+ SV208 889. 4.67 221. 56. 19. 1.07<br />
HYDROGRAPH AT<br />
+ SV205 1095. 4.17 109. 27. 9. .50<br />
2 COMBINED AT<br />
+ C205* 1162. 4.50 314. 80. 27. 1.57<br />
ROUTED TO<br />
+ R205* 798. 5.00 311. 80. 27. 1.57<br />
HYDROGRAPH AT<br />
+ SV203 170. 4.08 11. 3. 1. .08<br />
ROUTED TO<br />
+ RSV203 97. 4.67 11. 3. 1. .08<br />
Page 31 <strong>of</strong> 56
Wittmann ADMSU Addendum<br />
100-year 6-hour Future Conditions<br />
3 COMBINED AT<br />
+ CTW480 3279. 5.58 1863. 511. 170. 11.78<br />
DIVERSION TO<br />
+ DO480 3115. 5.58 1769. 486. 162. 11.78<br />
HYDROGRAPH AT<br />
+ D480 164. 5.58 93. 26. 9. 11.78<br />
ROUTED TO<br />
+ RTW480 151. 6.25 91. 26. 9. 11.78<br />
HYDROGRAPH AT<br />
+ TW478 470. 4.17 61. 15. 5. .26<br />
2 COMBINED AT<br />
+ CTW478 429. 4.17 160. 45. 15. .85<br />
ROUTED TO<br />
+ RTW478 190. 6.83 146. 45. 15. .85<br />
2 COMBINED AT<br />
+ CTW430 4049. 7.92 2974. 855. 285. 20.18<br />
ROUTED TO<br />
+ SCP040 3095. 8.75 2423. 829. 277. 20.18<br />
ROUTED TO<br />
+ RTW430 2838. 9.50 2395. 828. 277. 20.18<br />
HYDROGRAPH AT<br />
+ TW418 1835. 4.33 413. 104. 35. 1.37<br />
2 COMBINED AT<br />
+ CTW418 2831. 9.50 2413. 915. 307. 21.55<br />
ROUTED TO<br />
+ RTW418 2659. 9.83 2379. 906. 304. 21.55<br />
HYDROGRAPH AT<br />
+ TW424 2372. 4.25 390. 98. 33. 1.50<br />
ROUTED TO<br />
+ RTW424 2163. 4.50 388. 98. 33. 1.50<br />
HYDROGRAPH AT<br />
+ TW422 791. 4.42 202. 52. 17. .70<br />
3 COMBINED AT<br />
+ CTW422 2958. 4.58 2373. 1015. 341. 23.75<br />
ROUTED TO<br />
+ RTW422 2518. 11.83 2314. 1013. 341. 23.75<br />
HYDROGRAPH AT<br />
+ TW400 3162. 4.83 1171. 307. 102. 4.27<br />
3 COMBINED AT<br />
+ CTW400 14523. 7.67 13063. 5028. 1689. 163.08<br />
ROUTED TO<br />
+ RTW400 14463. 7.92 13029. 5026. 1689. 163.08<br />
HYDROGRAPH AT<br />
+ WI504 1612. 4.33 298. 75. 25. 1.35<br />
2 COMBINED AT<br />
+ CWI504 14452. 7.92 13031. 5059. 1701. 164.43<br />
ROUTED TO<br />
+ RWI504 14400. 8.00 12988. 5048. 1697. 164.43<br />
HYDROGRAPH AT<br />
+ D576 960. 6.08 434. 113. 38. 7.07<br />
Page 38 <strong>of</strong> 56
Wittmann ADMSU Addendum<br />
100-year 6-hour Future Conditions<br />
DIVERSION TO<br />
+ DO524 44. 4.42 4. 1. 0. 1.60<br />
HYDROGRAPH AT<br />
+ D524 868. 4.42 260. 80. 27. 1.60<br />
ROUTED TO<br />
+ RWI524 802. 4.75 257. 80. 27. 1.60<br />
HYDROGRAPH AT<br />
+ PI639 273. 4.50 80. 21. 7. .34<br />
HYDROGRAPH AT<br />
+ D524 44. 4.42 4. 1. 0. 1.60<br />
ROUTED TO<br />
+ RD524 25. 4.75 4. 1. 0. 1.60<br />
2 COMBINED AT<br />
+ CPI639 310. 4.50 87. 22. 7. .43<br />
ROUTED TO<br />
+ RPI639 292. 4.83 86. 22. 7. .43<br />
HYDROGRAPH AT<br />
+ WI506 1284. 4.58 345. 88. 29. 1.58<br />
4 COMBINED AT<br />
+ CWI506 2759. 5.00 1356. 700. 237. 13.10<br />
ROUTED TO<br />
+ RWI506 2602. 5.25 1349. 699. 237. 13.10<br />
HYDROGRAPH AT<br />
+ D508 1314. 8.17 918. 341. 114. 42.42<br />
ROUTED TO<br />
+ RD508 1296. 8.42 917. 341. 114. 42.42<br />
HYDROGRAPH AT<br />
+ WI500 972. 4.42 227. 57. 19. 1.05<br />
4 COMBINED AT<br />
+ CWI500 17232. 8.42 15376. 6318. 2126. 224.56<br />
ROUTED TO<br />
+ SSPILL 2123. 18.33 2106. 1910. 1368. 224.56<br />
ROUTED TO<br />
+ RWI500 2123. 18.83 2106. 1909. 1368. 224.56<br />
HYDROGRAPH AT<br />
+ PI635 807. 4.42 110. 27. 9. .61<br />
2 COMBINED AT<br />
+ CPI635 2123. 18.83 2106. 1909. 1368. 225.17<br />
ROUTED TO<br />
+ RPI635 2120. 19.58 2103. 1907. 1367. 225.17<br />
HYDROGRAPH AT<br />
+ DCAP11 444. 7.42 414. 244. 81. 53.75<br />
ROUTED TO<br />
+ RDCP11 438. 7.75 414. 243. 81. 53.75<br />
HYDROGRAPH AT<br />
+ DCAP12 432. 7.42 398. 232. 78. 53.75<br />
DIVERSION TO<br />
+ DO618 229. 7.42 211. 123. 41. 53.75<br />
HYDROGRAPH AT<br />
Page 48 <strong>of</strong> 56
STUDY<br />
BOUNDARY<br />
T5N<br />
T4N<br />
MATCH LINE<br />
BASIN<br />
BOUNDARY<br />
STUDY<br />
BOUNDARY<br />
BASIN<br />
BOUNDARY<br />
T5N<br />
T4N<br />
SUN VALLEY<br />
PARKWAY<br />
T4N<br />
T3N<br />
���� ������ �������<br />
����� ����<br />
HY-1A<br />
HY-1B<br />
PLATE HY-1B<br />
HEC-1 SCHEMATIC<br />
HY-1D<br />
HY-1C<br />
KEY MAP<br />
(2 <strong>of</strong> 4)
WITTMANN<br />
SUN VALLEY<br />
PARKWAY<br />
T5N<br />
T4N<br />
MATCH LINE<br />
���� ������ �������<br />
����� ����<br />
STUDY<br />
BOUNDARY<br />
T4N<br />
T3N<br />
NOTE: THE PADELFORD AREA NORTH OF<br />
THE CAP CANAL WAS MODELED BY A-N<br />
WEST, INC. UNDER (FCDMC) CONTRACT<br />
No. 99-12. THIS AREA WAS IMPORTED INTO<br />
THE ENTELLUS HEC-1 MODEL . A COPY OF<br />
THE PADELFORD SCHEMATIC IS<br />
INCLUDED AS PLATE HY-1E.<br />
HY-1A<br />
HY-1B<br />
HY-1D<br />
HY-1C<br />
KEY MAP<br />
T4N<br />
T3N<br />
T5N<br />
T4N<br />
STUDY<br />
BOUNDARY<br />
STUDY<br />
BOUNDARY<br />
PLATE HY-1C<br />
HEC-1 SCHEMATIC<br />
(3 <strong>of</strong> 4)
APPENDIX TM3-10-2<br />
EXISTING HYDROLOGY RESULTS<br />
EXCERPTS FROM MARICOPA COUNTY FIS<br />
091337137, 2011-018, TT005 <strong>Maricopa</strong> <strong>County</strong> <strong>Department</strong> <strong>of</strong> <strong>Transportation</strong><br />
Technical Memorandum 3 Deer Valley Parkway Feasibility Study<br />
<strong>Drainage</strong> <strong>Overview</strong> April 2012
MARICOPA COUNTY,<br />
ARIZONA<br />
AND INCORPORATED AREAS<br />
VOLUME 1 OF 17<br />
COMMUNITY NAME COMMUNITY NUMBER<br />
AVONDALE, CITY OF 040038<br />
BUCKEYE, TOWN OF 040039<br />
CAREFREE, TOWN OF 040126<br />
CAVE CREEK, TOWN OF 040129<br />
CHANDLER, CITY OF 040040<br />
EL MIRAGE, CITY OF 040041<br />
FOUNTAIN HILLS, TOWN OF 040135<br />
GILA BEND, TOWN OF 040043<br />
GILBERT, TOWN OF 040044<br />
GLENDALE, CITY OF 040045<br />
GOODYEAR, CITY OF 040046<br />
GUADALUPE, TOWN OF 040111<br />
LITCHFIELD PARK, CITY O 040128<br />
MARICOPA COUNTY<br />
(UNINCORPORATED AREAS) 040037<br />
MESA, CITY OF 040048<br />
PARADISE VALLEY, TOWN OF 040049<br />
PEORIA, CITY OF 040050<br />
PHOENIX, CITY OF 040051<br />
QUEEN CREEK, TOWN OF 040132<br />
SCOTTSDALE, CITY O 045012<br />
SURPRISE, CITY OF 040053<br />
TEMPE, CITY OF 040054<br />
TOLLESON, CITY OF 040055<br />
WICKENBURG, TOWN OF 040056<br />
YOUNGTOWN, TOWN OF 040057<br />
REVISED<br />
������������������<br />
���������������<br />
Federal Emergency Management Agency<br />
FLOOD INSURANCE STUDY NUMBER<br />
04013CV001A
Flooding Source and Location<br />
Circle City Area Wash 7<br />
Table 3. Summary <strong>of</strong> Discharges (Continued)<br />
<strong>Drainage</strong><br />
Area<br />
Peak Discharges (cfs)<br />
(Square Miles) 10-Year 50-Year 100-Year 500-Year<br />
At Black Mountain Road 0.57 109 192 215 -- 1<br />
Trilby Wash at Circle City<br />
At Black Mountain Road (discharges<br />
decrease due to storage behind<br />
AT&SFRR) 16.10 1,297 2,280 2,780 -- 1<br />
Upstream <strong>of</strong> AT&SFRR 16.10 1,380 2,428 2,970 -- 1<br />
Trilby Wash - CAP to Black<br />
Mountain Road<br />
Upstream <strong>of</strong> CAP -- 1<br />
Upstream <strong>of</strong> Jomax Road -- 1<br />
At Patton Road -- 1<br />
Upstream <strong>of</strong> White Wing Road -- 1<br />
At Carefree Highway -- 1<br />
Trilby Wash - McMicken Dam to<br />
CAP<br />
47<br />
-- 1<br />
-- 1<br />
-- 1<br />
-- 1<br />
-- 1<br />
-- 1<br />
-- 1<br />
-- 1<br />
-- 1<br />
-- 1<br />
3,851 -- 1<br />
3,805 -- 1<br />
3,756 -- 1<br />
3,322 -- 1<br />
2,995 -- 1<br />
At McMicken Dam 113.00 4,773 8,999 11,688 -- 1<br />
At 195th Avenue, Extended (area<br />
computed by specific discharge<br />
transfer equation) 112.40 4,730 8,920 11,625 -- 1<br />
650 feet upstream <strong>of</strong> 203rd Avenue,<br />
Extended (area computed by specific<br />
discharge transfer equation) 111.77 4,690 8,845 11,560 -- 1<br />
500 feet downstream <strong>of</strong> Deer Valley<br />
Road, Extended (area computed by<br />
specific discharge transfer equation) 103.94 4,646 8,769 11,499 -- 1<br />
150 feet downstream <strong>of</strong> Deer Valley<br />
Road (Extended) 67.16 3,065 5,750 7,430 -- 1<br />
-- 1 Not Computed
APPENDIX TM3-10-3<br />
EXISTING HYDROLOGY RESULTS<br />
FLOODPLAIN MAPPING<br />
091337137, 2011-018, TT005 <strong>Maricopa</strong> <strong>County</strong> <strong>Department</strong> <strong>of</strong> <strong>Transportation</strong><br />
Technical Memorandum 3 Deer Valley Parkway Feasibility Study<br />
<strong>Drainage</strong> <strong>Overview</strong> April 2012
Dixileta Dr<br />
Patton Rd<br />
Jomax Rd<br />
Happy Valley Rd<br />
Pinnacle Peak Rd<br />
Deer Valley Rd<br />
Beardsley Rd<br />
Union Hills Dr<br />
Bell Rd<br />
259th Ave<br />
Wash 1<br />
251st Ave<br />
Wash 2<br />
243rd Ave<br />
5 West<br />
Wash 3<br />
Wash 1<br />
235th Ave<br />
CAP Canal<br />
Wash 4<br />
Iona Wash (West Split)<br />
5 West<br />
Trilby Wash<br />
Iona Wash<br />
Wash 5<br />
Sun Valley Pkwy<br />
227th Ave<br />
219th Ave<br />
Wash 6<br />
211th Ave<br />
Wash 7<br />
203rd Ave<br />
Deer Valley Parkway<br />
Feasibility Study<br />
195th Ave<br />
2 West<br />
Trilby Wash<br />
187th Ave<br />
1 West<br />
0 0.25 0.5 1<br />
Beardsley C anal<br />
Citrus Rd<br />
4 East<br />
McMicken Dam<br />
Appendix TM3-10. FCDMC Floodplains<br />
Miles<br />
Study Area<br />
Dam<br />
Canals<br />
Wash<br />
River<br />
Cotton Ln<br />
FCDMC 100-yr Floodplain<br />
Zone A<br />
Zone AAFF<br />
Zone AE<br />
Zone AFHH<br />
Zone AFUFD<br />
Zone AFZA<br />
Zone AH<br />
Zone AO<br />
Floodway<br />
Sarival Ave<br />
Reems Rd<br />
<strong>Maricopa</strong> <strong>County</strong>, Arizona
Dixileta Dr<br />
Patton Rd<br />
Jomax Rd<br />
Happy Valley Rd<br />
Pinnacle Peak Rd<br />
Deer Valley Rd<br />
Beardsley Rd<br />
Union Hills Dr<br />
Bell Rd<br />
259th Ave<br />
Wash 1<br />
251st Ave<br />
Wash 2<br />
243rd Ave<br />
5 West<br />
Wash 3<br />
Wash 1<br />
235th Ave<br />
CAP Canal<br />
Wash 4<br />
Iona Wash (West Split)<br />
5 West<br />
Trilby Wash<br />
Wash 5<br />
Sun Valley Pkwy<br />
227th Ave<br />
Iona Wash<br />
219th Ave<br />
Wash 6<br />
211th Ave<br />
Wash 7<br />
203rd Ave<br />
Deer Valley Parkway<br />
Feasibility Study<br />
195th Ave<br />
2 West<br />
Trilby Wash<br />
187th Ave<br />
1 West<br />
Beardsley Canal<br />
Citrus Rd<br />
0 0.25 0.5 1<br />
4 East<br />
Appendix TM3-10. FEMA Floodplains<br />
Miles<br />
McMicken Dam<br />
Study Area<br />
Dam<br />
Canals<br />
Wash<br />
River<br />
Cotton Ln<br />
FEMA 100-yr Floodplain<br />
Sarival Ave<br />
Zone A<br />
Zone AE<br />
Zone AEFW<br />
Zone AFW<br />
Zone AH<br />
Zone AO<br />
Floodway<br />
<strong>Maricopa</strong> <strong>County</strong>, Arizona<br />
Reems Rd