Hans-Peter Gschwind, Ulrike Pfaar, Felix Waldmeier, Markus - Drug ...
Hans-Peter Gschwind, Ulrike Pfaar, Felix Waldmeier, Markus - Drug ...
Hans-Peter Gschwind, Ulrike Pfaar, Felix Waldmeier, Markus - Drug ...

Create successful ePaper yourself
Turn your PDF publications into a flip-book with our unique Google optimized e-Paper software.
0090-9556/05/3310-1503–1512$20.00<br />
DRUG METABOLISM AND DISPOSITION Vol. 33, No. 10<br />
Copyright © 2005 by The American Society for Pharmacology and Experimental Therapeutics 4283/3052639<br />
DMD 33:1503–1512, 2005 Printed in U.S.A.<br />
METABOLISM AND DISPOSITION OF IMATINIB MESYLATE IN HEALTHY VOLUNTEERS<br />
<strong>Hans</strong>-<strong>Peter</strong> <strong>Gschwind</strong>, <strong>Ulrike</strong> <strong>Pfaar</strong>, <strong>Felix</strong> <strong>Waldmeier</strong>, <strong>Markus</strong> Zollinger, Claudia Sayer,<br />
<strong>Peter</strong> Zbinden, Michael Hayes, Rolf Pokorny, Michael Seiberling, Monique Ben-Am, Bin Peng,<br />
and Gerhard Gross<br />
Novartis Pharma AG, Exploratory Development/<strong>Drug</strong> Metabolism & Pharmacokinetics, Basel, Switzerland (H.-P.G., U.P., F.W.,<br />
M.Z., C.S., P.Z., G.G.); Novartis Pharmaceuticals Corporation, Exploratory Development/Bioanalytics & Pharmacokinetics<br />
(M.H.), Clinical Pharmacology Oncology (M.B.-A., B.P.), East Hanover, New Jersey; and Swiss Pharma Contract, Clinical<br />
Pharmacology & Clinical Research, Allschwil, Switzerland (R.P., M.S.)<br />
ABSTRACT:<br />
Imatinib mesylate (GLEEVEC, GLIVEC, formerly STI571) has demonstrated<br />
unprecedented efficacy as first-line therapy for treatment<br />
for all phases of chronic myelogenous leukemia and metastatic<br />
and unresectable malignant gastrointestinal stromal tumors.<br />
Disposition and biotransformation of imatinib were studied in four<br />
male healthy volunteers after a single oral dose of 239 mg of<br />
14 C-labeled imatinib mesylate. Biological fluids were analyzed for<br />
total radioactivity, imatinib, and its main metabolite CGP74588.<br />
Metabolite patterns were determined by radio-high-performance<br />
liquid chromatography with off-line microplate solid scintillation<br />
counting and characterized by liquid chromatography-mass spectrometry.<br />
Imatinib treatment was well tolerated without serious<br />
adverse events. Absorption was rapid (t max 1–2 h) and complete<br />
with imatinib as the major radioactive compound in plasma. Maximum<br />
plasma concentrations were 0.921 � 0.095 �g/ml (mean �<br />
Imatinib (GLEEVEC, GLIVEC, imatinib mesylate, formerly<br />
STI571) has demonstrated efficacy in cancer treatment by virtue of its<br />
ability to potently and selectively inhibit the BCR-ABL tyrosine<br />
kinase as well as the platelet-derived growth factor receptors<br />
�-PDGFR and �-PDGFR and KIT receptor tyrosine kinases (Buchdunger<br />
et al., 2002; Fabbro et al., 2002).<br />
The pathogenesis of chronic myelogenous leukemia (CML) has<br />
been attributed to the expression of the BCR-ABL fusion oncogene<br />
formed by an aberrant chromosomal translocation that generates the<br />
Philadelphia chromosome (Deininger et al., 2003). Gain-of-function<br />
mutations of KIT receptor tyrosine kinases and PDGFRs have been<br />
associated with gastrointestinal stromal tumors (GIST) (Hirota et al.,<br />
Article, publication date, and citation information can be found at<br />
http://dmd.aspetjournals.org.<br />
doi:10.1124/dmd.105.004283.<br />
Received February 22, 2005; accepted July 6, 2005<br />
S.D., n � 4) for imatinib and 0.115 � 0.026 �g/ml for the pharmacologically<br />
active N-desmethyl metabolite (CGP74588). Mean<br />
plasma terminal elimination half-lives were 13.5 � 0.9 h for imatinib,<br />
20.6 � 1.7 h for CGP74588, and 57.3 � 12.5 h for 14 C radioactivity.<br />
Imatinib was predominantly cleared through oxidative metabolism.<br />
Approximately 65 and 9% of total systemic exposure<br />
[AUC 0–24 h (area under the concentration time curve) of radioactivity]<br />
corresponded to imatinib and CGP74588, respectively. The<br />
remaining proportion corresponded mainly to oxidized derivatives<br />
of imatinib and CGP74588. Imatinib and its metabolites were excreted<br />
predominantly via the biliary-fecal route. Excretion of radioactivity<br />
was slow with a mean radiocarbon recovery of 80% within<br />
7 days (67% in feces, 13% in urine). Approximately 28 and 13% of<br />
the dose in the excreta corresponded to imatinib and CGP74588,<br />
respectively.<br />
1998; Rubin et al., 2001; Dagher et al., 2002). Imatinib is also<br />
indicated for treatment of metastatic and unresectable malignant GIST<br />
(Demetri et al., 2002). Imatinib is now the first-line therapy for all<br />
phases of CML and GIST (O’Brien et al., 2003a).<br />
Expansion of the clinical applications of imatinib is anticipated.<br />
Dysregulated PDGFR kinase activity has been linked to a variety of<br />
cancers, including glioblastoma, dermatofibrosarcoma protuberans,<br />
idiopathic hypereosinophilic syndrome, as well as other myeloproliferative<br />
diseases (Tuveson and Fletcher, 2001; le Coutre et al., 2004).<br />
In addition, imatinib has also been shown, in animal models, to<br />
enhance the antitumor effects of chemotherapeutic agents due to<br />
inhibition of �-PDGFR (Pietras et al., 2002) and therefore may have<br />
potential efficacy as an adjuvant therapy.<br />
The purpose of this study was to investigate the disposition and<br />
biotransformation of imatinib mesylate in healthy volunteers as part of<br />
the clinical development of the compound. Whereas previous studies<br />
ABBREVIATIONS: BCR-ABL, p210 BCR-ABL fusion protein found in patients with chronic myelogenous leukemia; CML, chronic myelogenous<br />
leukemia; AUC, area under the concentration time curve; GIST, gastrointestinal stromal tumor(s); HPLC, high performance liquid chromatography;<br />
LC-MS, liquid chromatography coupled to mass spectrometry; LSC, liquid scintillation counting; PDGFR, platelet-derived growth factor receptor;<br />
radio-HPLC, HPLC coupled to radioactivity detection; CGP74588, N-[4-methyl-3-(4-pyridin-3-yl-pyrimidin-2-ylamino)-phenyl]-4-piperazin-1-ylmethylbenzamide;<br />
CGP72383, N-4-methyl-3-[4-(1-oxy-pyridin-3-yl)-pyrimidin-2-ylamino]-phenyl}-4-(4-methyl-piperazin-1-ylmethyl)-benzamide; CGP71422,<br />
4-(4-methyl-4-oxy-piperazin-1-ylmethyl)-N-[4-methyl-3-(4-pyridin-3-yl-pyrimidin-2-ylamino)-phenyl]-benzamide; AFN911, N-[4-hydroxymethyl-3-(4pyridin-3-yl-pyrimidin-2-ylamino)-phenyl]-4-(4-methyl-piperazin-1-ylmethyl)-benzamide;<br />
APG050, 4-(4-methyl-3-oxo-piperazin-1-ylmethyl)-N-[4-methyl-3-(4-pyridin-3-yl-pyrimidin-2-ylamino)-phenyl]-benzamide;<br />
APG049, N-[4-methyl-3-(4-pyridin-3-yl-pyrimidin-2-ylamino)-phenyl]-4-(3-oxo-piperazin-<br />
1-ylmethyl)-benzamide.<br />
1503<br />
Downloaded from<br />
dmd.aspetjournals.org by guest on February 25, 2013
1504 GSCHWIND ET AL.<br />
have reported on pharmacokinetic and pharmacodynamic properties<br />
as well as the overall tolerability and safety of imatinib in the plasma<br />
of CML patients (Peng et al., 2004b; Schmidli et al., 2005) and<br />
healthy volunteers (Nikolova et al., 2004), the data presented here<br />
include the complete characterization of the absorption, distribution,<br />
metabolism, and excretion (ADME) of a single oral dose of<br />
[ 14 C]imatinib administration to healthy volunteers.<br />
Materials and Methods<br />
Reference Compounds and Other Materials. The following nonradiolabeled<br />
reference compounds were synthesized by Oncology Research, Chemistry<br />
Department, Novartis Pharma AG (Basel, Switzerland): CGP74588, CGP72383,<br />
CGP71422, AFN911, APG050, and APG049. The purity of the reference compounds<br />
was separately examined by LC-MS. Solvents and reagents, all of analytical<br />
grade, were purchased from commercial manufacturers.<br />
Subjects. This study enrolled four healthy male Caucasian volunteers, age<br />
41 to 55 years, with medium body frame and weight (range from 61.8 to 85.7<br />
kg). The subjects were genotyped with respect to hepatic cytochrome P450<br />
isoenzyme CYP2D6.<br />
<strong>Drug</strong> Administration. After a 10-h fast, each subject received a single oral<br />
dose of a nominal 239 mg of [ 14 C]imatinib mesylate corresponding to 200 mg<br />
of imatinib free base. The actual dose (mean � S.D., n � 4) administered was<br />
237.0 � 3.6 mg of [ 14 C]imatinib mesylate (�198.4 � 3.0 mg of free base)<br />
given in a hard gelatin capsule. The radioactive dose given per subject was<br />
1.18 MBq (31.9 �Ci).<br />
14 14<br />
C-Radiolabeled Imatinib. The radiolabeled drug [ C]imatinib mesylate<br />
was synthesized by the Isotope Laboratory of Novartis Pharma AG. It was<br />
purified by chromatography, blended by recrystallization with nonradiolabeled<br />
drug substance using a nonradiolabeled Good Manufacturing Practice batch<br />
released for human use, and analyzed for release for human use according to<br />
predefined specifications. Radiochemical purity was 100% with a specific<br />
radioactivity of 4.99 kBq/mg [ 14 C]imatinib salt (135 nCi/mg).<br />
Radiation Protection. Radiation dosimetry calculations and the study protocol<br />
were approved by the Swiss National Radiation Protection Authority.<br />
Calculations were performed according to the rules of International Commission<br />
on Radiological Protection. Retrospective examination confirmed that the<br />
whole body dose (effective dose) was clearly below 1 mSv. The written<br />
informed consent was obtained from the subjects before enrolment.<br />
Sample Collection. All blood samples were taken by either direct venipuncture<br />
or an indwelling cannula inserted into a forearm vein. Plasma was<br />
separated by centrifugation. A blank urine sample (250 ml) was collected the<br />
day before dose administration, and urine and feces were collected completely<br />
after dose administration. The subjects were confined to the clinical premises<br />
during the sampling period. They had access only to toilets specially equipped<br />
for complete collection of excreta.<br />
Sample Storage and Shipment Conditions. After sample collection,<br />
blood, plasma, urine, and feces samples were kept refrigerated at 4 to 8°C. The<br />
samples were then stored frozen at ��18°C until and after analysis in the<br />
analytical laboratories. Stability of imatinib and its metabolites was ascertained<br />
under these conditions (Bakhtiar et al., 2002). Samples were shipped to other<br />
analytical laboratories under dry ice.<br />
Analysis of Unchanged Imatinib and Its Main Metabolite CGP74588.<br />
Concentrations of imatinib and its major metabolite (CGP74588) in all plasma<br />
samples of each individual subject were quantified by a validated specific<br />
assay based on LC-MS (Bakhtiar et al., 2002).<br />
Radioactivity Analysis of Blood, Plasma, Urine, and Feces Samples.<br />
Determination of 14 C radioactivity in blood, plasma, and urine samples (three<br />
replicates per time point) was performed using a Tri-Carb 2000 CA or TR 2500<br />
liquid scintillation counter (LSC) (PerkinElmer Life and Analytical Sciences,<br />
Boston, MA). Feces samples (four replicates) were combusted in a<br />
PerkinElmer A307 oxidizer (PerkinElmer Life and Analytical Sciences), and<br />
the 14 CO2 produced was trapped into the alkaline scintillation cocktail (Carbo-<br />
Sorb; PerkinElmer Life and Analytical Sciences); radioactivity was measured<br />
by means of LSC. Urine and plasma samples were measured directly after the<br />
addition of LSC cocktail using standard counting procedures, and quench<br />
correction was performed by an external standard method (Botta et al., 1985).<br />
Radioactivity determination in pooled feces homogenates as well as residual<br />
pellets from extractions for metabolism investigations was performed after<br />
solubilization with Soluene 350 (PerkinElmer Life and Analytical Sciences)<br />
and the addition of liquid scintillation cocktail OptiPhase HiSafe3<br />
(PerkinElmer Wallac, Turkku, Finland). With a standard sample counting time<br />
of 10 min, the limit of detection was 7 cpm, corresponding to 57 ng eq/ml in<br />
plasma. Late plasma samples were counted for 60 min, resulting in a limit of<br />
detection of 2.4 cpm or 9 ng eq/ml.<br />
Radioactivity Analysis of Collected HPLC Fractions. For each HPLC<br />
analysis, fractions were collected either directly on solid scintillator-coated<br />
microplates (Deepwell LumaPlate-96 or LumaPlate-96; PerkinElmer Life and<br />
Analytical Sciences) for off-line radioactivity detection using a microplate<br />
scintillation counter (TopCount NXT; PerkinElmer Life and Analytical Sciences)<br />
or on polypropylene Deepwell microplates (Porvair Sciences Ltd.,<br />
Shepperton, UK) followed by transfer of aliquots onto LumaPlates-96<br />
(Boernsen et al., 2000, 2001). The counting time of each fraction was 20 min<br />
(triplicates to identify false radioactivity due to electrostatic discharge).<br />
The background counting values of the 12 individual detector heads were<br />
measured using an empty Deepwell LumaPlate-96. The measurements of the<br />
HPLC fractions, collected on LumaPlate-96, were corrected by subtracting the<br />
background value of the corresponding detector head and adding again the<br />
average background value of the 12 detector heads (1.7 � 0.2 cpm, mean �<br />
S.D.) using Microsoft Excel.<br />
Sample Preparation of Plasma, Urine, and Feces for Metabolite Investigation.<br />
Semiquantitative determination of main and trace metabolites by<br />
radio-HPLC with off-line microplate solid scintillation counting and structural<br />
characterization by LC-MS was performed in plasma, urine, and feces pooled<br />
over four subjects. Sample pooling over subjects was time-saving and ade-<br />
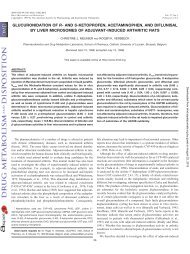
FIG. 1. Plasma concentrations of total 14 C radioactivity, imatinib, and CGP74588<br />
as indicated. A, a linear scale. B, semilogarithmic scale. Error bars represent � S.D.,<br />
n � 4.<br />
Downloaded from<br />
dmd.aspetjournals.org by guest on February 25, 2013
quate, because metabolite patterns preliminarily observed in plasma of individual<br />
subjects at 2, 8, and 24 h were very similar.<br />
Plasma samples were collected at 2, 4, 8, and 24 h postdose, and for each<br />
time point, a pool over four subjects was prepared. Plasma proteins were<br />
precipitated with acetonitrile and removed by centrifugation. Recoveries of<br />
radioactivity after plasma sample preparation were between 88.2 and 95.4%.<br />
Urine pools over four subjects were prepared for the two collection intervals<br />
from 0 to 24 h and 0 to 72 h. Recoveries of radioactivity after centrifugation<br />
of urine samples were 100%. Feces homogenates were pooled (from 0 to 48 h<br />
and 0 to 168 h) over four subjects and extracted with acetonitrile (94 to 95%<br />
recovery of radioactivity). The solvent of the feces extracts was removed under<br />
reduced pressure. The resulting oil was redissolved in mobile phase A and<br />
centrifuged. Supernatant 1 was removed and kept for HPLC analysis. The<br />
pellet was suspended in acetonitrile/HPLC mobile phase A (40/60; v/v) and<br />
centrifuged, and supernatant 2 was removed. The remaining pellet was finally<br />
suspended in acetonitrile/HPLC mobile phase A (60/40; v/v) and centrifuged<br />
again, and supernatant 3 was removed. The supernatants 3, 2, and 1 were<br />
injected in this order onto the HPLC column followed by the start of the<br />
gradient elution. Collection of the solvent effluent during the loading process<br />
of the dissolutions followed by measurement of radioactivity and reanalysis of<br />
the effluent showed a loss of radioactivity of approximately 23% of the<br />
injected radioactivity. The proportion of nonretained components (imatinib, its<br />
major metabolite CGP74588, and the minor structurally characterized metabolites)<br />
was the same as that retained on the HPLC column.<br />
HPLC Instrumentation for Metabolite Pattern Analysis (Radio-HPLC).<br />
HPLC method 1 (used for analysis of plasma and urine): equipment 1. The<br />
HPLC system consisted of two HPLC pumps, PU-980 (Jasco, Tokyo, Japan)<br />
and an autosampler (AS Jasco AS-950-10). Sample injection was performed<br />
through a 2000-�l stainless steel sample loop. The chromatogram was monitored<br />
by UV detection at a wavelength of 270 nm using a UV-970M detector<br />
(Jasco). The software used was Jasco-Borwin, version 1.50 (Omnilab AG,<br />
Mettmenstetten Switzerland). For profiling of metabolite patterns, samples<br />
ADME OF IMATINIB IN HEALTHY VOLUNTEERS<br />
were analyzed on a 4.6 � 150-mm Symmetry C 18 column (3.5-�m particle<br />
size; Waters, Milford, MA), protected by a Symmetry C 18 precolumn (5-�m<br />
particle size, 3.9 � 20 mm; Waters), and thermostated at 10°C. The components<br />
were eluted with a gradient of formic acid [2% (v/v) in water, pH 2.5;<br />
mobile phase A] versus acetonitrile (mobile phase B) at a flow rate of 0.8<br />
ml/min. HPLC fractions were collected for off-line radioactivity detection<br />
using a Gilson FC 204 fraction collector (Gilson, Villier Le Bel, France).<br />
HPLC method 2 (used for analysis of feces extracts): equipment 2. The<br />
HPLC system consisted of two HPLC pumps (model 420; Kontron Instruments,<br />
Watford, Herts, UK) and an HPLC autosampler (model 465; Kontron).<br />
Samples were injected through a 2000-�l stainless steel sample loop. Chromatography<br />
was monitored by UV detection by a UV HPLC detector model<br />
430 (Kontron) equipped with MT450 software (Kontron). The chromatography<br />
conditions were identical for HPLC methods 1 and 2.<br />
Evaluation of HPLC Data. Plasma, urine, or feces extract samples were<br />
injected onto the HPLC system, and fractions were collected on Deepwell<br />
LumaPlates-96 (fraction volume: 0.16 ml; 12 s/fraction). For each matrix, the<br />
recovery from the HPLC column was determined by collection of the total<br />
eluent into one flask. An aliquot of the eluent was taken for 14 C measurement<br />
by LSC. The amounts of metabolites or parent drug in plasma or excreta were<br />
derived from the radiochromatograms (metabolite patterns) by dividing the<br />
radioactivity eluting from the HPLC column (equal to radioactivity in original<br />
sample minus losses during sample preparation and chromatography) in proportion<br />
to the relative peak areas. Parent drug or metabolites were expressed as<br />
concentrations (in micromolar) in plasma or as percentage of dose in excreta.<br />
These values are to be considered as semiquantitative only, as opposed to those<br />
determined by the validated quantitative LC-MS assay (Bakhtiar et al., 2002).<br />
Structural Characterization of Metabolites by LC-MS. Metabolites of<br />
[ 14 C]imatinib were characterized by LC-MS following their isolation from<br />
plasma collected at 2 h, urine collected between 0 and 72 h, and feces collected<br />
between 0 and 48 h (pools of three or four subjects). The isolated metabolites<br />
were injected onto a 4 � 3-mm Polar-RP trapping column (Phenomenex,<br />
TABLE 1<br />
Pharmacokinetic parameters for 14 C radioactivity in blood and plasma and of imatinib and CGP74588 in plasma<br />
Pharmacokinetic parameters of 14 C radioactivity in blood and plasma and of imatinib and its N-desmethyl metabolite CGP74588 in plasma of healthy male subjects after a single oral dose<br />
of 239 mg of 14 C-labeled imatinib mesylate are shown. Mean � S.D., n � 4.<br />
Radioactivity Imatinib CGP74588<br />
Blood Plasma Plasma<br />
C max (�mol/l) 1.57 � 0.07 2.02 � 0.09 1.87 � 0.19 0.24 � 0.05<br />
C max (�g/ml) 0.775 � 0.03 a 0.999 � 0.043 a 0.921 � 0.095 0.115 � 0.026<br />
C max (% 14 C in plasma) 78 � 5 100 92 � 6 12� 2<br />
t max (h) Range: 1 to 2 Range: 1 to 2 Range: 1 to 2 Range: 1 to 1.5<br />
Median: 1.75 Median: 1.5 Median: 1.25 Median: 1.25<br />
AUC 0–24 h (�mol�h/l) 18.5 � 0.6 24.9 � 0.9 16.2 � 1.2 2.13 � 0.33<br />
AUC 0–24 h (�g�h/ml) 9.1 � 0.3 a 12.3 � 0.4 a 8.01 � 0.57 1.02 � 0.16<br />
AUC 0–24 h (% 14 C in plasma) 74 � 3 100 65 � 3 9 � 1<br />
AUC 0–48 h (�mol . h/l) 25.7 � 0.99 34.6 � 1.7 20.0 � 1.8 2.85 � 0.37<br />
AUC 0–48 h (�g�h/ml) 12.7 � 0.49 a,b 17.1 � 0.82 a 9.89 � 0.90 1.37 � 0.18<br />
AUC 0–48 h (% 14 C in plasma) 75 � 2 100 58 � 3 8.0 � 1.0<br />
AUC 0–168 h (�mol�h/l) n.a. 48.5 � 2.6 n.a. n.a.<br />
AUC 0–168 h (�g�h/ml) n.a. 23.9 � 1.3 a n.a. n.a.<br />
AUC 0-� (�mol�h/l) 31.9 � 1.5 53.1 � 2.0 21.6 � 2.3 3.47 � 0.39<br />
AUC 0-� (�g�h/ml) 15.8 � 0.76 a 26.2 � 1.0 a 10.7 � 1.1 1.66 � 0.19<br />
AUC extrapolated (%) 25.3 � 14 8.7 � 2.0 7.3 � 1.3 17.9 � 2.2<br />
AUC 0-� (% 14 C in plasma) 60 � 0.9 100 41 � 4 6.5 � 0.8<br />
t 1/2�z (h) terminal 21.2 � 1.13 57.3 � 12.5 13.5 � 0.9 20.6 � 1.7<br />
Time period 12 to 48 h c 72 to 168 h d 12 to 48 h 12 to 48 h<br />
Hematocrit (%) 43 � 1 – – –<br />
Binding to RBC (%) 23 � 5 e – – –<br />
CL/f �(ml/min)/kg� f – – 4.18 � 0.29 –<br />
CL/f (l/h) – – 18.9 � 2.0 –<br />
V z/f (l/kg) f – – 4.90 � 0.55 –<br />
V z/f (liter) – – 366 � 19 –<br />
–, Not calculated or not meaningful; n.a., not available; RBC, red blood cells.<br />
a<br />
Radioactivity concentrations are expressed as microgram equivalents of imatinib free base per ml (��g eq/ml).<br />
b<br />
Mean � S.D., n � 3 of subjects.<br />
c<br />
Two of four subjects. For the other two subjects, the periods of 48 to 72 and 8 to 24 h were considered.<br />
d<br />
Two of four subjects. For the other two subjects, the periods of 48 to 168 h or 1.5 to 168 h were considered.<br />
e 14<br />
Calculated from the blood and plasma C concentrations at time points in the period of 0 to 48 h.<br />
f<br />
Factor f means the systemic bioavailability of the drug.<br />
1505<br />
Downloaded from<br />
dmd.aspetjournals.org by guest on February 25, 2013
1506 GSCHWIND ET AL.<br />
TABLE 2<br />
Cumulative excretion of radioactivity in urine and feces<br />
Cumulative excretion of 14 C radioactivity in urine and feces after a single oral dose of 239 mg of 14 C-labeled imatinib mesylate administered to four healthy male subjects. Mean � S.D.<br />
Time period Urine n Feces n Total n<br />
h % dose % dose % dose<br />
0 to 48 10.6 � 1.5 4 16.1 � 12.4 4 26.7 � 12.5 4<br />
0to168a 13.2 � 1.6 4 66.9 � 4.5a 4 80.2 � 5.0a 4<br />
0to264b N.D. 67.8 � 5.4b 3 81.1 � 4.9b 3<br />
N.D., Not determined.<br />
a Excreta were collected completely from n � 4 subjects and were measured over the period of 0 to 168 h. The last feces sample within the planned study was collected at 154 h.<br />
b To follow the excretion beyond 168 h, additional feces samples were collected in three subjects in the period of 208 to 264 h. No feces were collected in the period of 154 to 208 h. Thus, the<br />
tabulated observation period of 0 to 264 h was not covered completely.<br />
Torrance, CA), which, after rinsing with water, was connected in a backflush<br />
mode to a 150 � 1.0-mm Symmetry C 18 analytical column packed with<br />
3.5-�m particles and thermostated at 40°C. The components were eluted with<br />
a gradient of aqueous 5 mM ammonium acetate/5 mM acetic acid (mobile<br />
phase A) versus acetonitrile (mobile phase B) at a total flow rate of 60 �l/min.<br />
For hydrogen-deuterium exchange experiments, the water of the mobile phase<br />
A was replaced by D 2O (99.9 atom % D; Cambridge Isotope Laboratories,<br />
Andover, MA). The HPLC effluent was split in a ratio of approximately 1:5.<br />
The smaller part of the effluent (approximately 10 �l/min) was directed into<br />
the electrospray LC-MS interface (Z-spray interface with LockSpray option) of<br />
a Micromass Q-Tof 2 hybrid quadrupole time-of-flight tandem mass spectrometer<br />
(Micromass UK Ltd, Wythenshawe, UK). The remaining effluent was<br />
used for radioactivity monitoring by off-line solid scintillation counting after<br />
fraction collection. The electrospray interface was operated with nitrogen as<br />
nebulizer gas, as desolvation gas (350 l/h), and as cone gas (40 l/h). The<br />
desolvation temperature was set to 150°C, the source block was heated to<br />
80°C, and the spray capillary was set to 3.0 kV. Positive ion single-stage mass<br />
spectra were recorded after mass separation by the time-of-flight analyzer. The<br />
mass resolution was set to approximately 8000 (full-width at half-maximum<br />
definition). The cone voltage was switched repetitively between 30, 40, and 80<br />
V. The M�H � ion of reserpine at m/z 609.2812 was used as lock mass for<br />
recalibrating the spectra to obtain exact mass data.<br />
Pharmacokinetic Evaluation. Descriptive statistics of pharmacokinetic parameters<br />
include mean � S.D. Pharmacokinetic parameters were determined<br />
through noncompartmental method(s) using Microsoft Excel. A weighted linear<br />
regression method was used to calculate the “Slope b” and “Intercept a” of the<br />
TABLE 3<br />
Mass spectral data on imatinib and its metabolites in plasma, urine and feces<br />
Data are from LC-MS runs of isolated imatinib and metabolites. Components are listed in the order of elution. Proposed chemical structures are shown in Table 4: electrospray ionization,<br />
positive ion mode, upfront collision offset (cone voltage) of 30, 40, and 80 V (combined data), and single-stage mass separation. Some of the expected fragment ions may be missing because<br />
of low intensities and/or high background of coeluting endogenous components.<br />
Component Matrix a<br />
M�H �c<br />
�M�2H� 2� M�H� -<br />
H 2O<br />
Observed Ions<br />
Frag. A d Frag. B d Frag. C d Frag. D d Frag. E d<br />
Additional Ions<br />
Shift of M�H �<br />
Ion Upon H/D<br />
Exchange b<br />
m/z m/z<br />
M20.0a U(P) 656 328.6 394 276 262 222 203 678e , 502 e , 480 f , 379 �7<br />
M21.0 P(U) 670 335.7 394 276 262 222 217 692e , 516 e , 494 f , 379 �6<br />
AFN911 F(P, U) 510 492 217 532e CGP74588 F(P, U) 480 240.6 462 394 276 262 222 203<br />
, 393, 392 (Frag. A-H2O), 364, 274<br />
(Frag. B-H2O) 502<br />
�4<br />
e , 379, 351, 290, 247 �4<br />
M23.7 U 684 394 706e , 530 e , 508 f Imatinib F(P, U) 494 247.6 476 394 276 262 222 217<br />
, 249 (Frag. E � H2O) 516<br />
�6<br />
e , 379, 351, 290, 247 �3<br />
M25.6 U 670 394 217 516e , 494 f �7<br />
M27.6 U 684 394 231 706e , 530 e , 508 f �6<br />
CGP72383 U(P) 510 255.6 492 410 217 532e , 392, 276 (Frag. B-O), 262 (Frag. C-O), 189 �3<br />
APG049 F(P, U) 494 476 394 222 217 516e M28.8 U 494 476 394 217<br />
, 379, 290, 264, 235 (Frag. E � H2O) 516<br />
�4<br />
e , 379 N.D.<br />
M29.6 F(P, U) 508 490 394 276 262 222 231 530e , 480, 437, 423, 379, 203 �3<br />
CGP71422 U(P, F) 510 255.6 394 276 262 532e , 450, 435, 423, 395, 393, 277 �2/�3 g<br />
APG050 F(P, U) 508 490 394 222 231 530e M42.2 F(U) 426 408 149<br />
, 480, 379, 249 (Frag. E � H2O), 203<br />
448<br />
�3<br />
e , 380, 261 �4<br />
N.D., not determined. H/D exchange, hydrogen-deuterium exchange. Nomenclature of fragment ions of imatinib and its metabolites is illustrated as follows (imatinib as example):<br />
a<br />
P, plasma, U, urine, F, feces; spectrum in the table obtained after isolation from the matrix in boldface; essentially same spectrum obtained after isolation from matrix/matrices in parentheses.<br />
b<br />
Equal to number of heteroatom-bound hydrogens in the neutral molecule plus one.<br />
c<br />
Measured exact mass in agreement with proposed structure.<br />
d<br />
In the case of glucuronides, Fragments A through E refer to the aglycone formed in the mass spectrometer by loss of anhydroglucuronic acid.<br />
e<br />
Sodium adduct.<br />
f �<br />
Aglycone of M�H .<br />
g<br />
Incomplete H/D exchange, same observation for authentic reference compound.<br />
Downloaded from<br />
dmd.aspetjournals.org by guest on February 25, 2013
TABLE 4<br />
List of metabolites and their proposed chemical structures<br />
Structures of imatinib metabolites partially or completely characterized by LC-MS (labeled as Mxx.x) and/or by comparison with authentic reference compounds (labeled with corresponding<br />
compound codes) are given below. The components are listed according to the site and type of metabolic reaction (from changes in the non-piperazine moiety to changes in the piperazine<br />
substructure). Systemic exposure to imatinib and its metabolites in plasma (P) is expressed as AUC0–24 h in �mol�h/l, and percentage of total � 14 C�AUC0–24 h is given within parentheses.<br />
Radiolabeled components detected in urine and feces are indicated as U and F. Amounts of imatinib and its metabolites in urine (0–72 h) and feces (0–168 h) are given in percentage of<br />
administered dose. Proportions of coeluting components could only be roughly estimated. For metabolites M19.8, M20.0b, M21.4, M21.6, M22.8, M23.6, M24.0, M25.2, M26.4, M26.8,<br />
M27.8a, M27.8b, M29.2, M31.0, M39.4, and M39.8 in plasma, urine, and/or feces (Figs. 3–5), only partial structures could be determined (U. <strong>Pfaar</strong>, M. Zollinger and H.-P. <strong>Gschwind</strong>,<br />
unpublished data).<br />
Site and Type of Metabolic Reaction Compound Name and Presence in Matrix<br />
Chemical Structure R�CH 3 R�H<br />
regression line. A weighting factor of w � 1/y was chosen. The apparent terminal<br />
half-life (t 1/2�z) was determined from the slope of the regression line of ln(C t)<br />
versus time t. The AUC 0-tn was calculated up to a concentration value of C n at the<br />
last time point, t n, by the linear-logarithmic trapezoidal method. The AUC was<br />
extrapolated to infinite time using the relationship AUC tn-� � (C n � t 1/2�z)/ln(2).<br />
The apparent systemic clearance CL/f and apparent terminal volume of distribution<br />
V z/f were calculated as Dose/AUC and (CL/f) � t 1/2�z/ln(2), respectively. Factor f<br />
means the systemic bioavailability of the drug. The systemic clearance in blood<br />
was calculated by CL Blood � CL Plasma � F plasma/(1 � HCT), where HCT indicates<br />
the hematocrit value, and F Plasma � (C Plasma/C Blood) � (1 � HCT) means the<br />
fraction of imatinib in the plasma compartment obtained from an in vitro blood<br />
distribution study in human volunteers (Kretz et al., 2004).<br />
Results<br />
Pharmacokinetics of Imatinib, CGP74588, and Total Radioactivity.<br />
After a single oral dose of a nominal 239 mg of [ 14 C]imatinib<br />
mesylate, the mean maximum plasma levels of radioactivity, imatinib,<br />
ADME OF IMATINIB IN HEALTHY VOLUNTEERS<br />
Imatinib (parent drug) CGP74588 (main metabolite)<br />
P, 17.7 (70) P, 2.4 (9.5)<br />
U, 5.0; F, 23 U, �1.8; F, �11<br />
M21.0 (glucuronide) M20.0a (glucuronide)<br />
P, 1.0 (4.0) P, �0.4 (�1.6)<br />
U, �0.4 U, �0.2<br />
CGP72383<br />
P, 0.29 (1.1)<br />
U, �0.3<br />
AFN911<br />
P, �0.22 (�0.9)<br />
U, �0.4; F, �2<br />
CGP71422<br />
P, �0.21 (�0.8)<br />
U, �0.3; F, �0.3<br />
APG050 APG049<br />
P, 0.32 (1.2) P, 0.11 (0.4)<br />
U, �1.5; F, �0.3 U, 0.1; F, 1.6<br />
M23.7 (glucuronide)<br />
U, �0.3<br />
M29.6 M28.8<br />
P, �0.21 (�0.8) U, �0.1<br />
U, �0.3; F, �1<br />
M27.6 (glucuronide) M25.6 (glucuronide)<br />
U, �0.3 U, �0.5<br />
M42.2<br />
U, 0.1; F, 1.3<br />
1507<br />
and its pharmacologically active N-desmethyl metabolite CGP74588<br />
were reached rapidly between 1 and 2 h postdose, suggesting rapid<br />
absorption (Fig. 1). The total radioactivity at C max mainly represented<br />
unchanged drug (mean, 92%; range, 86–99%) and CGP74588 (mean,<br />
12%; range, 9–14%). The key pharmacokinetic parameters are summarized<br />
in Table 1. Interindividual differences in plasma concentrations<br />
and in pharmacokinetic parameters were small. Imatinib accounted<br />
for 65% of AUC 0–24 h of total radioactivity in plasma and the<br />
metabolite CGP74588 accounted for 9%. The remaining proportion<br />
was due to a number of minor and trace metabolites of imatinib, as<br />
detected by off-line microplate solid-scintillation counting (Top-<br />
Count) after HPLC separation. Many of them could be characterized<br />
at least partially by LC-MS.<br />
Approximately 23% of the radioactivity in blood was calculated to<br />
have been distributed into red blood cells. Thus, imatinib and its<br />
Downloaded from<br />
dmd.aspetjournals.org by guest on February 25, 2013
1508 GSCHWIND ET AL.<br />
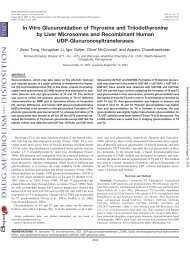
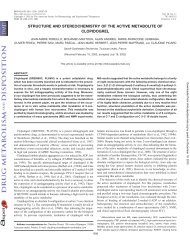
FIG. 2. Mass spectrum of imatinib: electrospray ionization, positive ion mode, upfront collision offset (cone voltage) of 80 V, single-stage mass separation, and<br />
background-subtracted. Proposed interpretation of the spectrum agrees with exact mass measurements: differences between measured and calculated masses �2.0 mDa for<br />
all interpreted signals.<br />
metabolites are present largely in the plasma (77%). For comparison,<br />
the fraction of unchanged imatinib in plasma of healthy volunteers in<br />
vitro was 74% (Kretz et al., 2004).<br />
Excretion and Mass Balance in Urine and Feces. Radioactivity<br />
was excreted slowly in all four subjects. After 2 days, only approximately<br />
25% of the dose was recovered. Radiolabeled material was<br />
excreted largely with the feces (range, 60.6–71.3%, over 7 days). A<br />
minor proportion was excreted in urine with a small interindividual<br />
variability (range, 12.2–15.6%, up to 7 days). As a result, the mean<br />
total recovery in excreta over 7 days was 80.2% (range 72.9–83.6%).<br />
By 11 days, mean total recovery in excreta was 81.1% (range 74.2–<br />
84.7%). The results are summarized in Table 2.<br />
Metabolite Characterization by LC-MS. Metabolite structures<br />
were characterized by LC-MS (data in Table 3) and, where possible,<br />
confirmed by comparison of mass spectra and retention times with<br />
authentic reference compounds (metabolites AFN911, CGP74588,<br />
CGP72383, APG049, CGP71422, and APG050). The proposed partial<br />
or complete structures are given in Table 4.<br />
The electrospray mass spectrum of imatinib taken at an upfront<br />
collision offset (cone voltage) of 80 V (Fig. 2) showed the protonated<br />
and sodiated intact molecule (M�H � and M�Na � , respectively) and<br />
a number of fragment ions of which Fragment A, resulting from a loss<br />
of N-methylpiperazine, was the most abundant one. The interpretation<br />
of the fragment ions given in Fig. 2 was agreed with exact mass data,<br />
as specified in the figure legend, and with the spectrum of [ 14 C]imatinib<br />
labeled to a degree of 90% in position 2 of the pyrimidine ring,<br />
showing a shift by two mass units for all ions containing the labeled<br />
carbon atom (data not shown). At cone voltages of 30 and 40 V, the<br />
electrospray mass spectrum of imatinib showed an additional [M �<br />
2H] 2� ion at m/z 247.6. This ion disappeared on increasing the cone<br />
voltage to 80 V because of fragmentation.<br />
The metabolites of imatinib predominantly underwent fragmentations<br />
analogous to those of the parent drug, which allowed us to<br />
localize metabolic changes in the substructures of the parent drug<br />
molecule reflected by its charged or neutral mass spectral fragments.<br />
The proposed metabolite structures were further supported by exact<br />
mass measurements of their M�H � ions and by hydrogen-deuterium<br />
exchange data (Table 3). The mass spectra of some of the metabolites<br />
showed special features that provided additional structural information<br />
as described below.<br />
Metabolites APG050 and APG049 were identified as the 3-oxopiperazine<br />
derivatives of imatinib and CGP74588, respectively, by<br />
comparison with the corresponding reference compounds. Their mass<br />
spectra showed a characteristic water adduct of Fragment E (Table 3),<br />
confirmed by exact mass measurement, with an intensity higher than<br />
that of Fragment E. M23.7 is proposed to be a glucuronide of<br />
APG050, because it showed the same characteristic intensity ratio of<br />
Fragment E � H 2O/ Fragment E �1. In contrast to APG050, the mass<br />
spectrum of the closely related isomeric metabolite M29.6 showed no<br />
Fragment E � H 2O. Instead, Fragment E was of particularly high<br />
intensity, similar to Fragment A, whereas in the mass spectra of most<br />
of the other metabolites, Fragment A was the major and Fragment E<br />
was a minor cleavage product. Formation of Fragment E seems to be<br />
favored in M29.6 at the expense of Fragment A. This may be ex-<br />
Downloaded from<br />
dmd.aspetjournals.org by guest on February 25, 2013
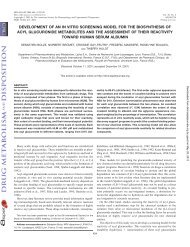
FIG. 3. Representative metabolite patterns in plasma at 2 (A) and 24 h (B) after<br />
dosing. Plasma samples of four subjects were pooled and extracted before HPLC<br />
analysis (Method 1). Chemical structures of metabolites are listed in Table 4.<br />
plained with the presence of a 4-methyl-2-oxopiperazine substructure<br />
in M29.6. The M�H � ion of this metabolite might be protonated<br />
preferentially in position 4 of the piperazine ring, as opposed to<br />
position 1, necessitating the rearrangement of a hydrogen to cleave<br />
ADME OF IMATINIB IN HEALTHY VOLUNTEERS<br />
neutral 4-methylpiperazin-2-one during the formation of Fragment A.<br />
In contrast, the M�H � ion of APG050, similar to that of imatinib and<br />
most of its metabolites, can be expected to be protonated to a significant<br />
extent in position 1 of the piperazine ring, allowing the loss of<br />
a neutral 4-methylpiperazin-2-one (or methylpiperazine or piperazine,<br />
respectively) without hydrogen rearrangement. The characteristic high<br />
intensity ratio of Fragment E/Fragment A, as well as the absence of<br />
Fragment E � H 2O, was also found in the mass spectrum of M28.8,<br />
which is proposed to represent N-demethylated M29.6, and in the<br />
mass spectra of M27.6 and M25.6, which are proposed to be glucuronides<br />
of M29.6 and M28.8, respectively.<br />
From a number of minor metabolites detected in the radiochromatograms<br />
of plasma (M20.0b, M21.4, and M26.8; see Fig. 3A), urine<br />
(M20.0b, M21.4, M22.8, M23.6, M25.2, and M26.4; see Fig. 4), or<br />
feces (M19.8, M21.6, M22.8, M23.6, M24.0, M25.2, M26.4, M26.8,<br />
M27.8a, M27.8b, M29.2, M31.0, M39.4, and M39.8; see Fig. 5), only<br />
partial structures could be determined. All of them were oxidation<br />
products, some glucuronidated. The amide bond of imatinib was intact<br />
(uncleaved) in all of these metabolites (U. <strong>Pfaar</strong>, M. Zollinger, and<br />
H.-P. <strong>Gschwind</strong>, unpublished data).<br />
Metabolism. The metabolite patterns in plasma (Fig. 3), urine (Fig.<br />
4), and feces (Fig. 5) from four healthy male volunteers who were<br />
given a single 239-mg oral dose of [ 14 C]imatinib mesylate indicate<br />
that unchanged imatinib and its N-desmethyl metabolite CGP74588<br />
were the most prominent components in all of the investigated matrices.<br />
Based on radio-HPLC of plasma samples, 70% of the plasma<br />
[ 14 C]AUC 0-24 h amounted to unchanged imatinib and 9.5% amounted<br />
to its N-desmethyl metabolite. These semiquantitative values are agree<br />
with those obtained by the validated LC-MS assays (Table 1). Another<br />
11% consisted of at least 11 different metabolites of imatinib, the<br />
structures of which could be partially characterized by LC-MS (eight<br />
of them in Table 4). They individually ranged between 0.2 and 4% of<br />
total [ 14 C]AUC 0-24 h.<br />
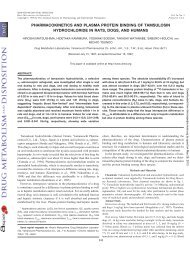
In urine collected between 0 and 72 h, about 5 and 1.8% of the dose<br />
was accounted for by imatinib and its N-desmethyl metabolite<br />
CGP74588, respectively. In feces collected between 0 and 168 h,<br />
FIG. 4. Metabolite pattern in urine collected between 0 and 72 h after dosing. Urine from four subjects was pooled and centrifuged before HPLC analysis (Method 1).<br />
Chemical structures of metabolites are listed in Table 4.<br />
1509<br />
Downloaded from<br />
dmd.aspetjournals.org by guest on February 25, 2013
1510 GSCHWIND ET AL.<br />
FIG. 5. Metabolite pattern in an extract of feces collected between 0 and 168 h after dosing. Feces from four subjects was pooled and extracted before HPLC analysis<br />
(Method 2). Chemical structures of metabolites are listed in Table 4.<br />
imatinib and CGP74588 accounted for 23 and 11% of dose, respectively.<br />
Metabolites in urine and feces were identified by radio-HPLC<br />
combined with microplate solid-scintillation counting and structurally<br />
characterized by LC-MS as well as by comparison with authentic<br />
reference compounds. A representative metabolite pattern in a0to<br />
72-h pool of urine is shown in Fig. 4, and a representative metabolite<br />
pattern in a0to168-h pool of feces is shown in Fig. 5.<br />
Discussion<br />
Tolerability. Single oral doses of nominal 239 mg of [ 14 C]imatinib<br />
mesylate administered to four healthy male subjects under fasting<br />
conditions were well tolerated without any serious adverse event or<br />
discontinuation due to an adverse event.<br />
Absorption. The gastrointestinal absorption of imatinib under fasting<br />
conditions was rapid, as concluded from the early Cmax values of<br />
radioactivity, of imatinib, and of the main metabolite CGP74588,<br />
typically at 1.5 h postdose. The extent of absorption could not be<br />
assessed in this study. However, in a previous study, the absolute oral<br />
bioavailability was determined as �97% (Peng et al., 2004a), indicating<br />
complete absorption.<br />
Pharmacokinetics. The mean plasma half-life of imatinib was<br />
13.5 h, confirming previously published data (13.9 � 5.0 h; Peng et<br />
al., 2004a). Total radioactivity (sum of imatinib and/or metabolites)<br />
decreased in plasma in a multiexponential manner with a terminal<br />
half-life longer than two days. Thus, the terminal half-life of plasma<br />
radioactivity suggests some accumulation of metabolites. However,<br />
this will occur at low concentration levels and will be due to several<br />
minor metabolites, not to any single major metabolite. The pharmacokinetics<br />
of unchanged imatinib in repeated dose studies did not<br />
change significantly, and steady-state was reached in approximately 1<br />
week (Peng et al., 2004b). The accumulation factor was 1.5 to 3.0, as<br />
predicted from single dose pharmacokinetics. Interindividual differences<br />
in pharmacokinetics and metabolism were low. Imatinib was the<br />
predominant radioactive component in plasma, particularly during the<br />
first 24 h, representing approximately 70% of AUC0-24 h radioactivity.<br />
The pharmacologically active N-desmethyl metabolite (CGP74588)<br />
accounted for another 9%. The systemic exposure to numerous minor<br />
and trace metabolites was small. With CL/f of 4.18 (ml/min)/kg<br />
(18.9 � 2.0 l/h) and f � 1, the plasma clearance of imatinib was<br />
approximately 4.2 (ml/min)/kg. From this value and a fraction in<br />
plasma of 74% at a hematocrit of 46% (Kretz et al., 2004), a moderate<br />
blood clearance of 5.8 (ml/min)/kg corresponding to 28% of the<br />
hepatic blood flow in humans [21 (ml/min)/kg; Davies and Morris,<br />
1993] can be calculated. The apparent volume of distribution V z/f of<br />
imatinib found in the present study (366 � 19 liters, mean � S.D.) is<br />
in good agreement with the V z/f data published for oral solution<br />
(385 � 167 liters) and capsule (382 � 194 liters), and is consistent<br />
with the volume of distribution V z (435 � 154 liters) obtained after<br />
i.v. infusion of 100 mg of imatinib (Peng et al., 2004a).<br />
Metabolism. In the excreta (urine, 0–72 h; feces, 0–168 h), dose<br />
fractions of 28 and �13% were recovered in the form of imatinib and<br />
the N-desmethyl metabolite, respectively. The remaining proportion<br />
represented further oxidized metabolites. Thus, oxidative metabolism<br />
is the main clearance mechanism. The metabolic processes are summarized<br />
in Fig. 6.<br />
Phase I metabolism pathways included N-demethylation (e.g., main<br />
metabolite CGP74588), piperazine ring oxidation with lactam formation<br />
(APG049, APG050, M29.6, and M28.8), piperazine-N-4 oxidation<br />
(CGP71422), pyridine N-oxidation (CGP72383), and benzylic<br />
hydroxylation (AFN911). Furthermore, the loss of the piperazine<br />
moiety by oxidative deamination and rapid further oxidation of the<br />
intermediate aldehyde (not observed) to a carboxylic acid metabolite<br />
M42.2 were observed. In vitro metabolism studies with human hepatic<br />
microsomes showed that the oxidative metabolism of imatinib was<br />
mainly catalyzed by the cytochrome P450 3A isoenzyme subfamily<br />
(CYP3A) (O’Brien et al., 2003b); thus, the metabolic clearance of<br />
imatinib in human is concluded to depend largely on hepatic CYP3A.<br />
Phase II metabolic pathways included direct conjugation of imatinib<br />
and the N-desmethyl metabolite (CGP74588) with glucuronic acid<br />
Downloaded from<br />
dmd.aspetjournals.org by guest on February 25, 2013
(M21.0 and M20.0a, respectively), most probably at nitrogen, and<br />
glucuronidation of oxidative metabolites.<br />
Excretion. In the observation period of 7 days, the total recovery of<br />
radioactivity in feces and urine was incomplete (mean 80.2%). Individual<br />
recoveries ranged from 72.9 to 83.6%. Otherwise, the interindividual<br />
pharmacokinetic differences were small. Beyond the planned<br />
sample collection period of 7 days, additional feces samples were<br />
collected from three subjects from day 9 to 11 to follow the continuing<br />
excretion process. An apparent terminal elimination half-life of radioactivity<br />
in feces was estimated to approximately 3 weeks. The radioactivity<br />
was excreted largely with the feces (67.8% of dose in 11<br />
days). A minor dose proportion was excreted in urine (13.2% in 7<br />
days). Imatinib was the main fecal component (23% of dose). The<br />
major proportion of fecal imatinib (approximately 16% of dose) was<br />
recovered in the late excretion phase. This amount of imatinib in feces<br />
could not represent nonabsorbed drug, because absorption and absolute<br />
oral bioavailability of imatinib were shown to be nearly complete<br />
(Peng et al., 2004a). The substantial fecal recovery of imatinib may be<br />
related 1) to biliary excretion of imatinib and/or 2) to unstable metabolites,<br />
which were reconverted back to imatinib in the gut (e.g.,<br />
N-oxides and/or glucuronides) and/or 3) to imatinib-related components<br />
secreted via the gastrointestinal walls bypassing the biliary<br />
route. There is evidence or strong indications for all of these processes.<br />
Ramalingam et al. (2004) reported that a patient receiving<br />
daily oral doses of 300 mg of imatinib excreted 17.7 and 2.1% of the<br />
dose as unchanged imatinib and CGP74588, respectively, in 0 to 24-h<br />
bile. In addition to biliary elimination, direct secretion of imatinib<br />
and/or its metabolites from blood through the gastrointestinal walls<br />
was observed in bile duct-cannulated rats after a single intravenous<br />
dose of 10 mg/kg (H. Wiegand and U. <strong>Pfaar</strong>, unpublished data). In<br />
these animals, a substantial proportion of drug-related components<br />
was excreted with feces, bypassing the biliary route (approximately<br />
18% of dose). In the feces, only traces of the piperazine 4-N-oxide<br />
(CGP71422) were detected. The pyridine N-oxide metabolite<br />
ADME OF IMATINIB IN HEALTHY VOLUNTEERS<br />
FIG. 6. Chemical structure of imatinib and identified metabolic processes in human. The main metabolic pathway was the N-demethylation to CGP74588. For details of<br />
chemical structures see Table 4.<br />
(CGP72383), which was found in plasma and urine, was absent in<br />
feces. These observations are in agreement with the reductive potential<br />
of human intestinal bacteria toward N-oxides as reported (el-<br />
Mekkawy et al., 1993). Furthermore, microbial deconjugation of O-or<br />
N-glucuronides of imatinib and of CGP74588 to parent drug and to<br />
the N-desmethyl metabolite, respectively, may have taken place in the<br />
intestine (Chourasia and Jain, 2003), because conjugates present in<br />
plasma and urine were not detected in feces. The available data from<br />
this study do not allow us to assess the extent of the biliary excretion<br />
of the glucuronic acid conjugates of imatinib and its metabolites. To<br />
investigate this, an analysis of human bile from subjects treated with<br />
imatinib would be required. Furthermore, it should be noted that<br />
elimination of imatinib and intestinal reconversion of metabolites<br />
back to imatinib may all contribute to enterohepatic recirculation and<br />
to the slow terminal elimination process.<br />
Acknowledgments. We thank Daniel Pierroz, Margrit Riera,<br />
Agnes Holler, Serge Delaborde (Novartis Pharma AG, Preclinical<br />
Safety Europe, Biotransformation) for excellent technical work, Dr.<br />
Andras Kalman and Rene Lehmann (Isotope Laboratory, Novartis<br />
Pharma AG, Basel, Switzerland) for the preparation of the radiolabeled<br />
drug, and Dr. Bertrand Sutter (Pharmaceutical Analytical Development,<br />
Novartis Pharma AG) for the analytical and pharmaceutical<br />
support. We also thank Dr. Jürg Zimmermann and Dr. Paul W.<br />
Manley (Novartis Pharma AG, Oncology Research) for synthesis of<br />
reference compounds.<br />
References<br />
1511<br />
Bakhtiar R, Lohne J, Ramos L, Khemani L, Hayes M, and Tse F (2002) High-throughput<br />
quantification of the anti-leukemia drug STI571 (Gleevec) and its main metabolite (CGP<br />
74588) in human plasma using liquid chromatography-tandem mass spectrometry. J Chromatogr<br />
B Analyt Technol Biomed Life Sci 768:325–340.<br />
Boernsen KO, Bruin GJM, <strong>Pfaar</strong> U, and Gross G (2001) A new radioactivity detector for<br />
metabolic studies: The microplate scintillation counter for 96-well plates. Abstract No. 43<br />
from the 6th International ISSX Meeting October 7–11, 2001, Munich, Germany. <strong>Drug</strong> Metab<br />
Rev 33 (Suppl 1):1–274.<br />
Boernsen KO, Floeckher JM, and Bruin GJ (2000) Use of a microplate scintillation counter as<br />
Downloaded from<br />
dmd.aspetjournals.org by guest on February 25, 2013
1512 GSCHWIND ET AL.<br />
a radioactivity detector for miniaturized separation techniques in drug metabolism. Anal Chem<br />
72:3956–3959.<br />
Botta L, Gerber H-U, and Schmid K (1985) Measurement of radioactivity in biological experiments,<br />
in <strong>Drug</strong> Fate and Metabolism, Methods and Techniques (Garrett ER and Hirtz JL eds)<br />
Vol. 5, pp 99–134, Dekker, New York.<br />
Buchdunger E, O’Reilly T, and Wood J (2002) Pharmacology of imatinib (STI571). Eur J<br />
Cancer 38 (Suppl 5):S28–S36.<br />
Chourasia MK and Jain SK (2003) Pharmaceutical approaches to colon-targeted drug delivery<br />
systems. J Pharm Pharm Sci 6:33–66.<br />
Dagher R, Cohen M, Williams G, Rothmann M, Gobburu J, Robbie G, Rahman A, Chen G,<br />
Staten A, Griebel D, et al. (2002) Approval summary: imatinib mesylate in the treatment of<br />
metastatic and/or unresectable malignant gastrointestinal stromal tumors. Clin Cancer Res<br />
8:3034–3038.<br />
Davies B and Morris T (1993) Physiological parameters in laboratory animals and humans.<br />
Pharm Res (NY) 10:1093–1095.<br />
Deininger MW, O’Brien SG, Ford JM, and Druker BJ (2003). Practical management of patients<br />
with chronic myeloid leukemia receiving imatinib. J Clin Oncol 21:1637–1647.<br />
Demetri GD, von Mehren M, Blanke CD, Van den Abbeele AD, Eisenberg B, Roberts PJ,<br />
Heinrich MC, Tuveson DA, Singer S, Janicek M, et al. (2002) Efficacy and safety of imatinib<br />
mesylate in advanced gastrointestinal stromal tumors. N Engl J Med 347:472–480.<br />
el-Mekkawy S, Meselhy MR, Kawata Y, Kadota S, Hattori M, and Namba T (1993) Metabolism<br />
of strychnine N-oxide and brucine N-oxide by human intestinal bacteria. Planta Med 59:347–<br />
350.<br />
Fabbro D, Ruetz S, Buchdunger E, Cowan-Jacob SW, Fendrich G, Liebetanz J, Mestan J,<br />
O’Reilly T, Traxler P, Chaudhuri B, et al. (2002) Protein kinases as targets for anticancer<br />
agents: from inhibitors to useful drugs. Pharmacol Ther 93:79–98.<br />
Hirota S, Isozaki K, Moriyama Y, Hashimoto K, Nishida T, Ishiguro S, Kawano K, Hanada M,<br />
Kurata A, Takeda M, et al. (1998) Gain-of-function mutations of c-kit in human gastrointestinal<br />
stromal tumors. Science (Wash DC) 279:577–580.<br />
Kretz O, Weiss HM, Schumacher MM, and Gross G (2004) In vitro blood distribution and<br />
plasma protein binding of the tyrosine kinase inhibitor imatinib and its active metabolite,<br />
CGP74588, in rat, mouse, dog, monkey, healthy humans and patients with acute lymphatic<br />
leukaemia. Br J Clin Pharmacol 58:212–216.<br />
le Coutre P, Kreuzer KA, Pursche S, Bonin M, Leopold T, Baskaynak G, Dorken B, Ehninger<br />
G, Ottmann O, Jenke A, et al. (2004) Pharmacokinetics and cellular uptake of imatinib and its<br />
main metabolite CGP74588. Cancer Chemother Pharmacol 53:313–323.<br />
Nikolova Z, Peng B, Hubert M, Seiberling M, Keller U, Ho YY, Schran H, and Capdeville R<br />
(2004) Bioequivalence, safety and tolerability of imatinib tablets compared with capsules.<br />
Cancer Chemother Pharmacol 53:433–438.<br />
O’Brien SG, Guilhot F, Larson RA, Gathmann I, Baccarani M, Cervantes F, Cornelissen JJ,<br />
Fischer T, Hochhaus A, Hughes T, et al. (2003a) Imatinib compared with interferon and<br />
low-dose cytarabine for newly diagnosed chronic-phase chronic myeloid leukemia. N Engl<br />
J Med 348:994–1004.<br />
O’Brien SG, Meinhardt P, Bond E, Beck J, Peng B, Dutreix C, Mehring G, Milosavljev S, Huber<br />
C, Capdeville R, et al. (2003b) Effects of imatinib mesylate (STI571, Glivec) on the pharmacokinetics<br />
of simvastatin, a cytochrome p450 3A4 substrate, in patients with chronic myeloid<br />
leukaemia. Br J Cancer 89:1855–1859.<br />
Peng B, Dutreix C, Mehring G, Hayes MJ, Ben-Am M, Seiberling M, Pokorny R, Capdeville R,<br />
and Lloyd P (2004a) Absolute bioavailability of imatinib (Glivec) orally versus intravenous<br />
infusion. J Clin Pharmacol 44:158–162.<br />
Peng B, Hayes M, Resta D, Racine-Poon A, Druker BJ, Talpaz M, Sawyers CL, Rosamilia M,<br />
Ford J, Lloyd P, et al. (2004b) Pharmacokinetics and pharmacodynamics of imatinib in a phase<br />
I trial with chronic myeloid leukemia patients. J Clin Oncol 22:935–942.<br />
Pietras K, Rubin K, Sjoblom T, Buchdunger E, Sjoquist M, Heldin CH, and Ostman A (2002)<br />
Inhibition of PDGF receptor signaling in tumor stroma enhances antitumor effect of chemotherapy.<br />
Cancer Res 62:5476–5484.<br />
Ramalingam S, Lagattuta TF, Egorin MJ, Hayes MJ, and Ramanathan RK (2004) Biliary<br />
excretion of imatinib mesylate and its metabolite CGP 74588 in humans. Pharmacotherapy<br />
24:1232–1235.<br />
Rubin BP, Singer S, Tsao C, Duensing A, Lux ML, Ruiz R, Hibbard MK, Chen CJ, Xiao S,<br />
Tuveson DA, et al. (2001) KIT activation is a ubiquitous feature of gastrointestinal stromal<br />
tumors. Cancer Res 61:8118–8121.<br />
Schmidli H, Peng B, Riviere G-J, Capdeville R, Hensely M, Gathmann I, Bolton AE, and<br />
Racine-Poon (2005) A population pharmacokinetics of imatinib mesylate in patients with<br />
chronic-phase myeloid leukemia: results of a phase III study. Br J Clin Pharmacol 60:35–44.<br />
Tuveson DA and Fletcher JA (2001) Signal transduction pathways in sarcoma as targets for<br />
therapeutic intervention. Curr Opin Oncol 13:249–255.<br />
Address correspondence to: Dr. <strong>Hans</strong>-<strong>Peter</strong> <strong>Gschwind</strong>, Exploratory Development/DMPK,<br />
Novartis Pharma AG, WKL-135.2.25, CH-4002 Basel, Switzerland.<br />
E-mail: hans-peter.gschwind@novartis.com<br />
Downloaded from<br />
dmd.aspetjournals.org by guest on February 25, 2013