P-Glycoprotein and an Unstirred Water Layer Barring Digoxin ...
P-Glycoprotein and an Unstirred Water Layer Barring Digoxin ...
P-Glycoprotein and an Unstirred Water Layer Barring Digoxin ...

Create successful ePaper yourself
Turn your PDF publications into a flip-book with our unique Google optimized e-Paper software.
0090-9556/06/3409-1468–1479$20.00<br />
DRUG METABOLISM AND DISPOSITION Vol. 34, No. 9<br />
Copyright © 2006 by The Americ<strong>an</strong> Society for Pharmacology <strong><strong>an</strong>d</strong> Experimental Therapeutics 8227/3131989<br />
DMD 34:1468–1479, 2006 Printed in U.S.A.<br />
P-<strong>Glycoprotein</strong> <strong><strong>an</strong>d</strong> <strong>an</strong> <strong>Unstirred</strong> <strong>Water</strong> <strong>Layer</strong> <strong>Barring</strong> <strong>Digoxin</strong><br />
Absorption in the Vascularly Perfused Rat Small Intestine<br />
Preparation: Induction Studies with Pregnenolone-16�carbonitrile<br />
Sh<strong>an</strong>jun Liu, Debbie Tam, Xi<strong>an</strong>ghai Chen, <strong><strong>an</strong>d</strong> K. S<strong><strong>an</strong>d</strong>y P<strong>an</strong>g<br />
Department of Pharmaceutical Sciences (S.L., D.T., K.S.P.) <strong><strong>an</strong>d</strong> Department of Pharmacology (X.C., K.S.P.), University of<br />
Toronto, Toronto, Ontario, C<strong>an</strong>ada<br />
ABSTRACT:<br />
<strong>Digoxin</strong>, a substrate of P-glycoprotein (Pgp) <strong><strong>an</strong>d</strong> cytochrome P450<br />
3a (Cyp3a), was used to illustrate the inductive effects of pregnenolone-16�-carbonitrile<br />
(PCN), a lig<strong><strong>an</strong>d</strong> of the pregn<strong>an</strong>e X receptor,<br />
on the absorption <strong><strong>an</strong>d</strong> disposition of [ 3 H]digoxin in the<br />
vascularly perfused rat small intestine preparation. Although increased<br />
Cyp3a protein was observed with Western blotting <strong>an</strong>alysis<br />
after PCN treatment, metabolism of digoxin to the digoxigenin<br />
bis-digitoxoside metabolite in the rat small intestine remained insignific<strong>an</strong>t<br />
(
Pgp AND UNSTIRRED WATER LAYER ON DIGOXIN ABSORPTION<br />
preparation was used to evaluate the intestinal absorptive, metabolic,<br />
<strong><strong>an</strong>d</strong> secretory functions (Doherty <strong><strong>an</strong>d</strong> P<strong>an</strong>g, 2000).<br />
Because a qu<strong>an</strong>titative view could be presented by modeling <strong><strong>an</strong>d</strong><br />
fitting, data were fit to the physiologically based pharmacokinetic<br />
models of the small intestine: the traditional (physiological) model<br />
(TM), in which the intestinal blood flow perfuses the intestinal tissue<br />
as a whole (Doherty <strong><strong>an</strong>d</strong> P<strong>an</strong>g, 2000), <strong><strong>an</strong>d</strong> the segregated flow model<br />
(SFM), in which partial flow to the enterocyte region exists (Cong et<br />
al., 2000). These models encompass all the physiological variables:<br />
tr<strong>an</strong>sporters for influx <strong><strong>an</strong>d</strong> efflux, metabolic enzymes, gastrointestinal<br />
tr<strong>an</strong>sit, as well as partial blood flow to the absorptive, enterocyte layer<br />
facing the lumen (Cong et al., 2000). The SFM provides a better<br />
expl<strong>an</strong>ation for the greater extent of intestinal metabolism of morphine<br />
with oral over systemic dosing (Cong et al., 2000). These<br />
developed TMs <strong><strong>an</strong>d</strong> SFMs are further exp<strong><strong>an</strong>d</strong>ed to include a bilayer<br />
membr<strong>an</strong>e compartment that houses the efflux tr<strong>an</strong>sporter, Pgp, adjacent<br />
to the apical membr<strong>an</strong>e, <strong><strong>an</strong>d</strong> <strong>an</strong> unstirred water layer (UWL)<br />
compartment external to the apical membr<strong>an</strong>e that bars the absorption<br />
of this lipophilic drug. The slow partitioning of digoxin between the<br />
plasma <strong><strong>an</strong>d</strong> red blood cells in the vascular compartments is also<br />
considered (Liu et al., 2005). The data suggest that intestinal efflux is<br />
a major mech<strong>an</strong>ism for digoxin elimination, <strong><strong>an</strong>d</strong> digoxin bioavailability<br />
<strong><strong>an</strong>d</strong> efflux were subject to ch<strong>an</strong>ges with a Pgp inducer such as<br />
PCN. In addition, modeling results suggest that the UWL is a major<br />
deterrent of digoxin absorption. The segmental traditional model<br />
(STM) <strong><strong>an</strong>d</strong> segmental segregated flow model (SSFM) (Tam et al.,<br />
2003) were then used to illustrate the effects of the segmental heterogeneities<br />
of Pgp on digoxin absorption <strong><strong>an</strong>d</strong> removal.<br />
Materials <strong><strong>an</strong>d</strong> Methods<br />
Chemicals <strong><strong>an</strong>d</strong> Reagents. [ 3 H]<strong>Digoxin</strong> (specific activity 9–37 Ci/mmol)<br />
was purchased from PerkinElmer Life Sciences Inc. (Boston, MA). The<br />
radiochemical purity of [ 3 H]digoxin was �98%, as found by high perform<strong>an</strong>ce<br />
liquid chromatography (HPLC). Unlabeled digoxin (Dg3), PCN, <strong><strong>an</strong>d</strong> bovine<br />
serum albumin in Tyrode’s solution were obtained from Sigma Aldrich (Mississauga,<br />
ON, C<strong>an</strong>ada). Digoxigenin bis-digitoxoside (Dg2), digoxigenin<br />
mono-digitoxoside (Dg1), <strong><strong>an</strong>d</strong> digoxigenin (Dg0) were gifts from Dr. Emil<br />
Lin, University of California, S<strong>an</strong> Fr<strong>an</strong>cisco. Dextrose 50% USP injection was<br />
obtained from Abbott Laboratories (Montreal, QC, C<strong>an</strong>ada). Acetonitrile of<br />
HPLC grade was purchased from Fisher Scientific (Fair Lawn, NJ). All other<br />
reagents were of <strong>an</strong>alytical grade or higher, <strong><strong>an</strong>d</strong> deionized distilled water was<br />
used in all experiments.<br />
Animals <strong><strong>an</strong>d</strong> Treatment. Male Sprague-Dawley rats (Charles River C<strong>an</strong>ada,<br />
St Const<strong>an</strong>t, QC, C<strong>an</strong>ada) were maintained in the housing facility (two<br />
rats/cage, 12-h light/dark cycle) with free access to <strong>an</strong>imal chow <strong><strong>an</strong>d</strong> water. All<br />
the procedures for <strong>an</strong>imal studies were in accord<strong>an</strong>ce with protocols approved<br />
by the University of Toronto Animal Committee. The rats were r<strong><strong>an</strong>d</strong>omly<br />
assigned to the PCN treatment or control groups. PCN was suspended in corn<br />
oil (37.5 mg/ml) <strong><strong>an</strong>d</strong> used for intraperitoneal injection (50 mg/kg/day) for 4<br />
days. Control rats received vehicle corn oil intraperitoneally (1.3 ml/kg/day) at<br />
the same schedule. On day 3 of treatment, rats were allowed free access to 2%<br />
glucose solution but were refrained from solid food for 2 days. On day 5, in<br />
situ small intestine perfusion was conducted.<br />
Preparation of Enterocytes <strong><strong>an</strong>d</strong> Western Blot Analysis. Intestinal cells<br />
were prepared according to the method of Traber et al. (1991), with modifications<br />
(Cong et al., 2001). On day 5, the small intestine was removed under<br />
<strong>an</strong>esthesia <strong><strong>an</strong>d</strong> was divided into eight segments. Segment 1 (S1) encompassed<br />
the duodenum from the pyloric ring to the ligament of Treitz; segment 2 (S2)<br />
was the proximal jejunal segment of equal length distal from the ligament of<br />
Treitz. The remaining small intestine was then divided into six segments of<br />
equal lengths (S3–S8). The strips were quickly removed <strong><strong>an</strong>d</strong> placed in a Petri<br />
dish over ice, <strong><strong>an</strong>d</strong> the lumen was flushed with ice-cold PBS containing<br />
dithiothreitol. The segmental enterocytes were collected <strong><strong>an</strong>d</strong> suspended in <strong>an</strong><br />
equal volume of PBS, <strong><strong>an</strong>d</strong> stored at �80°C.<br />
After thawing of the cells over ice, the enterocytes, mixed with <strong>an</strong> equal<br />
1469<br />
volume of lysis buffer (2 mM EDTA, 4 mM EGTA, <strong><strong>an</strong>d</strong> 1 mM PMSF, 0.25<br />
mM dithiothreitol, <strong><strong>an</strong>d</strong> 0.2 mM Na 2CO 3), pH 7.5, including protease inhibitor<br />
cocktail, were sonicated with a cell disruptor. The supernat<strong>an</strong>t, obtained upon<br />
centrifugation of the cell lysate at 3000g (10 min), was centrifuged at 21,000g<br />
at 4°C for 60 min to yield a crude membr<strong>an</strong>e preparation. This result<strong>an</strong>t pellet<br />
was suspended in PBS <strong><strong>an</strong>d</strong> used for <strong>an</strong>alysis of Pgp protein. The microsome<br />
was used for <strong>an</strong>alysis of Cyp3a. Total protein was assayed by the method of<br />
Lowry et al. (1951).<br />
Intestinal crude membr<strong>an</strong>e or microsomal proteins were resolved on 7.5%<br />
(20 �g for Pgp) or 10% (10 �g for Cyp3a) SDS-polyacrylamide gels overlaid<br />
with 4% acrylamide stacking gel; a liver sample, processed in similar fashion,<br />
was included in each gel as a positive control. The proteins were tr<strong>an</strong>sferred to<br />
a nitrocellulose membr<strong>an</strong>e (Pall Co., Pensacola, FL) after electrophoresis<br />
separation. The nitrocellulose membr<strong>an</strong>e was incubated with <strong>an</strong>ti-rat Pgp<br />
<strong>an</strong>tibody (C219 from Signet Laboratories, Dedham, MA; 1:1000 dilution) or<br />
<strong>an</strong>ti-rat Cyp3a2 <strong>an</strong>tibody (Daiichi Pure Chemicals Co., Ltd., Tokyo; 1:1500<br />
dilution) in 5% (w/v) nonfat milk-Tris-buffered saline containing 0.1% Tween<br />
20, overnight at 4°C. After three 15-min washes in Tris-buffered saline-0.1%<br />
Tween 20, the blots were incubated with the secondary <strong>an</strong>tibody, peroxidaselabeled<br />
<strong>an</strong>ti-mouse IgG (H�L) (Vector Laboratories, Inc., Burlingame, CA;<br />
1:2000) or goat <strong>an</strong>ti-rabbit IgG (H�L)-horseradish peroxidase conjugate (Bio-<br />
Rad Laboratories, Hercules, CA; 1:2000) for 1hatroom temperature. Immunoreactive<br />
b<strong><strong>an</strong>d</strong>s were visualized by enh<strong>an</strong>ced chemiluminescence (GE<br />
Healthcare Bio-Sciences, Piscataway, NJ) <strong><strong>an</strong>d</strong> qu<strong>an</strong>tified by the NIH Image<br />
Software. The relative Pgp/Cyp3a levels were expressed as the ratio of integrated<br />
optical density of Pgp/Cyp3a to that of �-actin <strong><strong>an</strong>d</strong> were further<br />
normalized to that of the liver sample.<br />
Vascular Perfusion of the Rat Small Intestine. Male Sprague-Dawley rats<br />
were used as intestine donors. The surgical procedure <strong><strong>an</strong>d</strong> perfusion apparatus<br />
were identical to those described previously (Cong et al., 2001). Briefly, rats<br />
were <strong>an</strong>esthetized with <strong>an</strong> intraperitoneal dose of sodium pentobarbital (65<br />
mg/kg). The small intestine was perfused in situ with recirculation of the blood<br />
perfusate, at 37°C. Perfusate entered via the superior mesenteric artery <strong><strong>an</strong>d</strong><br />
exited through the portal vein at the flow rate of 8 ml/min. The perfusate<br />
consisted of bovine erythrocytes (20%), freshly obtained <strong><strong>an</strong>d</strong> washed (a kind<br />
gift of Ryding-Regency Meat Packers Ltd., Toronto, ON, C<strong>an</strong>ada), 2% bovine<br />
serum albumin, <strong><strong>an</strong>d</strong> 0.3% glucose in Krebs-Henseleit bicarbonate (KHB)<br />
solution buffered to pH 7.4. The perfusate was oxygenated with 95% oxygen-5%<br />
carbon dioxide (BOC Gases, Division of BOC C<strong>an</strong>ada Ltd., Brampton,<br />
ON, C<strong>an</strong>ada). Two reservoirs were used in each study: reservoir 1 for<br />
equilibration of the intestine <strong><strong>an</strong>d</strong> reservoir 2 for the experiment. Reservoir 2<br />
contained a tracer amount of [ 3 H]digoxin (initial dose 34.8 � 7.8 � 10 6 dpm<br />
or 0.52 � 0.12 nmol digoxin) for systemic administration. For intraluminal<br />
administration, reservoir 2 contained bl<strong>an</strong>k perfusate only, <strong><strong>an</strong>d</strong> a known bolus<br />
dose of [ 3 H]digoxin (34 � 6 � 10 6 dpm or 0.84 � 0.02 nmol in about 0.2 ml<br />
of physiological saline solution) was injected into the proximal duodenum.<br />
Perfusate (1 ml) was retrieved from reservoir 2 at 0, 2.5, 7.5, 12.5, 17.5, 22.5,<br />
27.5, 35, 45, 55, 65, 75, 90, <strong><strong>an</strong>d</strong> 120 min after initiation of administered<br />
digoxin. The total sampling volume was less th<strong>an</strong> 7% of the original volume<br />
of 200 ml. At the end of the experiment, the intestine was emptied of its<br />
luminal contents <strong><strong>an</strong>d</strong> washed twice with 3 ml of ice-cold saline. The intestine<br />
was isolated from the carcass, gently blotted <strong><strong>an</strong>d</strong> weighed, <strong><strong>an</strong>d</strong> kept at �20°C<br />
until assay. Viability of the in situ vascularly perfused intestine preparation<br />
was measured by the perfusion pressure, hematocrit, <strong><strong>an</strong>d</strong> perfusate volume<br />
recovery (Cong et al., 2001).<br />
Analytical Procedures. <strong>Digoxin</strong> (Dg3) <strong><strong>an</strong>d</strong> its metabolites, digoxigenin<br />
bis-digitoxoside (Dg2), digoxigenin mono-digitoxoside (Dg1), <strong><strong>an</strong>d</strong> digoxigenin<br />
(Dg0), were qu<strong>an</strong>tified by the modified HPLC procedure (Liu et al., 2005).<br />
Briefly, a Shimadzu HPLC system consisting of a C18 reverse-phase column<br />
(Alltech Associates, Deerfield, IL; 4.6 � 250 mm, particle size, 10 �m) <strong><strong>an</strong>d</strong><br />
guard column (<strong>Water</strong>s Bondapak C18/Corasil 37–55 �m) was used for the<br />
separation of digoxin <strong><strong>an</strong>d</strong> its metabolites at 220 nm. A binary gradient<br />
consisting of acetonitrile (18–28%) <strong><strong>an</strong>d</strong> water was used at a flow rate of 1<br />
ml/min. Data acquisition <strong><strong>an</strong>d</strong> integration was performed with the Star-Chrom<br />
LITE HPLC Data System Software (D-Star Instruments, M<strong>an</strong>assas, VA). The<br />
outflow was collected continuously into minivials by a Gilson FC 204 fraction<br />
collector (Gilson, Inc., Middleton, WI) at 1-min intervals, <strong><strong>an</strong>d</strong> the radioactivities<br />
of Dg3 <strong><strong>an</strong>d</strong> its metabolites were determined by liquid scintillation spec-<br />
Downloaded from<br />
dmd.aspetjournals.org by guest on February 25, 2013
1470 LIU ET AL.<br />
trometry (Beckm<strong>an</strong> Coulter C<strong>an</strong>ada, Inc., Mississauga, ON, C<strong>an</strong>ada; model<br />
5801) upon addition of 5 ml of scintillation fluor (Ready Safe; Beckm<strong>an</strong><br />
Coulter C<strong>an</strong>ada). The emerging radiolabeled peak was compared with those of<br />
the authentic st<strong><strong>an</strong>d</strong>ards. Typical retention times were 30, 23, 17, <strong><strong>an</strong>d</strong> 15 min for<br />
unlabeled Dg3, Dg2, Dg1, <strong><strong>an</strong>d</strong> Dg0 st<strong><strong>an</strong>d</strong>ards, respectively.<br />
The total radioactivity in blood perfusate was <strong>an</strong>alyzed with use of a<br />
calibration curve. A series of 25-�l [ 3 H]digoxin st<strong><strong>an</strong>d</strong>ards, prepared by dilutinga[<br />
3 H]digoxin stock solution with meth<strong>an</strong>ol, were mixed with 400 �l of<br />
bl<strong>an</strong>k blood, whereas <strong>an</strong>other 25 �l was counted directly. Blood samples<br />
containing Dg3 <strong><strong>an</strong>d</strong> metabolites were treated in the same way as the st<strong><strong>an</strong>d</strong>ard,<br />
with addition of 25 �l of meth<strong>an</strong>ol instead of the [ 3 H]digoxin st<strong><strong>an</strong>d</strong>ards. After<br />
admixture of 1200 �l of acetonitrile, the contents were mixed well to precipitate<br />
protein <strong><strong>an</strong>d</strong> centrifuged at 9000 rpm for 10 min. Then, 1300 �l of<br />
supernat<strong>an</strong>t was tr<strong>an</strong>sferred into 20 ml of glass vials, <strong><strong>an</strong>d</strong> 1.5 ml of H 2O <strong><strong>an</strong>d</strong><br />
16 ml of cocktail (Ready Safe, Beckm<strong>an</strong> Coulter, C<strong>an</strong>ada) were added for<br />
scintillation counting. The calibration curve was based on the direct counts<br />
versus the counts recovered in the supernat<strong>an</strong>t. Tissue <strong><strong>an</strong>d</strong> luminal fluid<br />
samples were <strong>an</strong>alyzed in a similar fashion, <strong><strong>an</strong>d</strong> bl<strong>an</strong>k blood was replaced by<br />
bl<strong>an</strong>k intestinal homogenate or bl<strong>an</strong>k luminal fluid in the preparation of<br />
calibration curves. Samples of the intestine containing total Dg3 <strong><strong>an</strong>d</strong> its<br />
metabolites were obtained upon homogenization of the intestine with a 3-fold<br />
volume of ice-cold KHB solution; <strong>an</strong> aliquot of the homogenate was then taken<br />
for <strong>an</strong>alysis.<br />
<strong>Digoxin</strong> <strong><strong>an</strong>d</strong> its metabolites in 120-min blood perfusate, luminal fluid, <strong><strong>an</strong>d</strong><br />
intestinal tissue samples were separated by HPLC. An aliquot (200 �l to3ml)<br />
of blood perfusate, luminal fluid, or tissue homogenate sample <strong><strong>an</strong>d</strong> unlabeled<br />
digoxin (50 nmol in 100 �l as internal st<strong><strong>an</strong>d</strong>ard) were placed into a 1.5- or<br />
12-ml polypropylene tube <strong><strong>an</strong>d</strong> added to a 3-fold excess of acetonitrile. After<br />
thorough vortex <strong><strong>an</strong>d</strong> centrifugation, a volume of the supernat<strong>an</strong>t was tr<strong>an</strong>sferred<br />
into a new tube <strong><strong>an</strong>d</strong> evaporated under nitrogen. The residue was<br />
dissolved in 200 �l of mobile phase (18:82 v/v of acetonitrile/H 2O). The<br />
reconstituted sample was centrifuged, <strong><strong>an</strong>d</strong> 75 �l of supernat<strong>an</strong>t was injected<br />
into the HPLC. The elution fractions were collected <strong><strong>an</strong>d</strong> counted. The fractions<br />
of Dg3 <strong><strong>an</strong>d</strong> its metabolites were expressed as the respective ratios of the<br />
radioelution divided by the summed dpm of Dg3 <strong><strong>an</strong>d</strong> its metabolites. The<br />
contents of Dg3 <strong><strong>an</strong>d</strong> its metabolite(s) in the sample were estimated by the<br />
fractions of the species obtained from HPLC, times the total count of the same<br />
sample assayed from the calibration curve.<br />
Binding to Enterocyte Proteins. Tissue binding was studied by ultrafiltration<br />
(Geng et al., 1995) to determine the digoxin unbound fraction (f t)inthe<br />
S9 fraction of the enterocyte. Enterocytes were freshly prepared as described<br />
<strong><strong>an</strong>d</strong> pooled. The pelleted enterocytes were suspended in 3 volumes of ice-cold<br />
KHB, <strong><strong>an</strong>d</strong> a 3.5-ml aliquot was homogenized with a cell disruptor (Vibra Cell,<br />
Sonics <strong><strong>an</strong>d</strong> Materials Inc., D<strong>an</strong>bury, CT). The homogenate was centrifuged at<br />
9000g (M2-J Centrifuge; Beckm<strong>an</strong> Coulter, C<strong>an</strong>ada) for 20 min at 4°C. After<br />
centrifugation, 2 ml of supernat<strong>an</strong>t (S9) was removed <strong><strong>an</strong>d</strong> added to 20 �l of<br />
[ 3 H]digoxin in KHB, <strong><strong>an</strong>d</strong> 500 �l of the S9 mixture containing [ 3 H]digoxin was<br />
used for ultrafiltration (Centricon Amicon YM-3, 3000 molecular weight<br />
cutoff; Millipore Corporation, Bedford, MA) at 1000g for 20 min at 25°C. It<br />
was assumed that the binding const<strong>an</strong>ts obtained reflect those at 37°C. Leakage<br />
of enterocyte protein to the ultrafiltrate was less th<strong>an</strong> 1% of the initial<br />
concentration.<br />
To correct for the nonspecific binding of [ 3 H]digoxin to the Amicon<br />
centrifuge device, KHB was added with a known count of [ 3 H]digoxin (without<br />
protein), <strong><strong>an</strong>d</strong> the sample was centrifuged during the time of the binding<br />
study. The correction factor for nonspecific binding, i.e., ratio of drug concentrations<br />
in the KHB (C KHB) <strong><strong>an</strong>d</strong> corresponding ultrafiltrate (C KHB,filtrate),<br />
was incorporated into the estimate of tissue unbound fraction of the diluted<br />
tissue sample, (f t,diluted), as in eq. 1<br />
f t,diluted � C S9,filtrate/C S9 � �C KHB/C KHB,filtrate� (1)<br />
where C S9,filtrate is the drug concentration in the ultrafiltrate after centrifugation<br />
of the S9 sample containing [ 3 H]digoxin, <strong><strong>an</strong>d</strong> C S9 is the concentration of the<br />
drug in the S9 before centrifugation. The values for binding from the diluted<br />
homogenate were back-converted to values corresponding to the original<br />
protein concentration in the enterocytes based on the assumption of linear<br />
binding: 4.04 � (C bound/C unbound) diluted � (C bound/C unbound) undiluted since the<br />
dilution factor was 4.04 (Kurz <strong><strong>an</strong>d</strong> Fichtl, 1983). The unbound tissue fraction<br />
of the undiluted tissue, f t, was<br />
f t �<br />
1<br />
� Cbound � 1<br />
Cunbound�undiluted 1<br />
�<br />
4.04� C 1<br />
�<br />
bound<br />
� 1 4.04�<br />
Cunbound�diluted 1<br />
� 1� � 1<br />
ft,diluted 1<br />
�<br />
4.04<br />
� 3.04<br />
f t,diluted<br />
Pharmacokinetic Analysis. Noncompartmental Analysis. Noncompartmental<br />
methods were used to estimate the clear<strong>an</strong>ce (CL) <strong><strong>an</strong>d</strong> volume of<br />
distribution (V dss) after the systemic administration of digoxin. The elimination<br />
rate const<strong>an</strong>t (k) was estimated from the slope of the terminal phase of the<br />
semilogarithmic blood concentration versus time plot (last 5 points). The<br />
half-life (t 1/2) was given by 0.693/k. The area under the curve (AUC iv 0-�) of<br />
Dg3 in blood perfusate was calculated by the trapezoidal rule <strong><strong>an</strong>d</strong> extended to<br />
time infinity, <strong><strong>an</strong>d</strong> AUMC iv 0-� was the area under the moment curve of the drug<br />
concentration curve from zero to infinity<br />
(2)<br />
AUC iv 0-� � AUC 0-t � C last/k (3)<br />
AUMC iv t-� � AUMC 0-t � C last�t last/k � 1/k 2 � (4)<br />
where C last was the concentration (percentage dose/ml) at last sampling point<br />
t last. CL was calculated as the intravenous dose divided by the AUC iv 0-�, <strong><strong>an</strong>d</strong><br />
V dss was determined as follows:<br />
V dss � dose iv � AUMC iv 0-�/�AUC iv 0-�� 2 (5)<br />
Modeling: TM <strong><strong>an</strong>d</strong> SFM. Two previously developed, physiologically based<br />
pharmacokinetic models for the intestine, the traditional model (TM) (Doherty<br />
<strong><strong>an</strong>d</strong> P<strong>an</strong>g, 2000) <strong><strong>an</strong>d</strong> the segregated flow model (SFM) (Cong et al., 2000),<br />
were exp<strong><strong>an</strong>d</strong>ed to include the partitioning of Dg3 in red blood cells (rbc),<br />
plasma protein, <strong><strong>an</strong>d</strong> intestinal tissue binding, as we did for digoxin h<strong><strong>an</strong>d</strong>ling by<br />
the liver (Liu et al., 2005). A separate bilayer membr<strong>an</strong>e that housed the Pgp<br />
adjacent to the apical membr<strong>an</strong>e <strong><strong>an</strong>d</strong> <strong>an</strong> unstirred water layer (UWL) external<br />
to the apical membr<strong>an</strong>e that may retard the diffusion of digoxin were included<br />
as additional models to fit the data of digoxin (Fig. 1). Common features of<br />
these models included the tr<strong>an</strong>sporters for absorption <strong><strong>an</strong>d</strong> efflux, passive<br />
diffusion, metabolic enzyme(s), <strong><strong>an</strong>d</strong> gastrointestinal tr<strong>an</strong>sit (Cong et al., 2000;<br />
Doherty <strong><strong>an</strong>d</strong> P<strong>an</strong>g, 2000). Only the unbound species of digoxin in plasma<br />
underwent equilibration with those in rbc <strong><strong>an</strong>d</strong> in the intestine tissue. The<br />
unbound fractions of digoxin in rbc, plasma, <strong><strong>an</strong>d</strong> tissue were described as f rbc,<br />
f p, <strong><strong>an</strong>d</strong> f t, respectively. The on- <strong><strong>an</strong>d</strong> off-rate const<strong>an</strong>ts, k pr <strong><strong>an</strong>d</strong> k rp, for movement<br />
of unbound digoxin from plasma to rbc, <strong><strong>an</strong>d</strong> from rbc to plasma,<br />
respectively, were obtained from previous studies (Liu et al., 2005). Inasmuch<br />
as the binding of digoxin to rbc was uncertain, a modified rate const<strong>an</strong>t, k� rp,<br />
that equals the product of f rbc� k rp, was used (Liu et al., 2005).<br />
For the TMs, there was only one tissue compartment (int), <strong><strong>an</strong>d</strong> the influx<br />
<strong><strong>an</strong>d</strong> efflux clear<strong>an</strong>ces of Dg3 into the intestinal tissue compartment from blood<br />
<strong><strong>an</strong>d</strong> out of the intestinal tissue into blood were characterized by the tr<strong>an</strong>sport<br />
clear<strong>an</strong>ce parameters, CL 1 <strong><strong>an</strong>d</strong> CL 2, (Fig. 1A). For TM(I), once Dg3 enters the<br />
tissue, Dg3 was subject to metabolism to form Dg2 with the intestinal metabolic<br />
intrinsic clear<strong>an</strong>ce, CL 7, or was effluxed at the apical membr<strong>an</strong>e into the<br />
lumen (denoted by the secretory intrinsic clear<strong>an</strong>ce CL 5). The absorption<br />
intrinsic clear<strong>an</strong>ce of Dg3 from the intestinal lumen was described by CL 6. For<br />
TM(II), there was the additional presence of a bilayer membr<strong>an</strong>e that housed<br />
Pgp, <strong><strong>an</strong>d</strong> the exch<strong>an</strong>ge intrinsic clear<strong>an</strong>ces of Dg3 between the bilayer membr<strong>an</strong>e<br />
<strong><strong>an</strong>d</strong> tissue were CL 9 <strong><strong>an</strong>d</strong> CL 10, respectively. For TM(III), <strong>an</strong> unstirred<br />
water layer was described, <strong><strong>an</strong>d</strong> CL 4 <strong><strong>an</strong>d</strong> CL 3 denoted the diffusion clear<strong>an</strong>ces<br />
of digoxin between the luminal fluid <strong><strong>an</strong>d</strong> the unstirred water layer, respectively.<br />
In both TM(II) <strong><strong>an</strong>d</strong> TM(III), the absorption intrinsic clear<strong>an</strong>ce <strong><strong>an</strong>d</strong><br />
efflux clear<strong>an</strong>ces were the same as for TM(I) <strong><strong>an</strong>d</strong> were denoted as CL 6 <strong><strong>an</strong>d</strong><br />
CL 5, respectively. In all of the TMs, the intestinal motility or the tr<strong>an</strong>sit<br />
clear<strong>an</strong>ce was described by CL g.<br />
The three submodels of the SFM were identical to those of the TM, <strong><strong>an</strong>d</strong> the<br />
distinction of the SFM (Fig. 1B) from the TM was that only a fraction (f Q)of<br />
Downloaded from<br />
dmd.aspetjournals.org by guest on February 25, 2013
Pgp AND UNSTIRRED WATER LAYER ON DIGOXIN ABSORPTION<br />
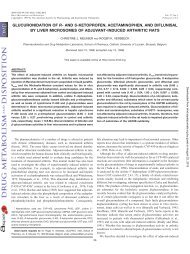
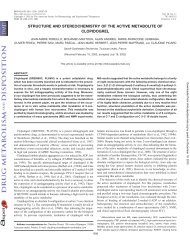
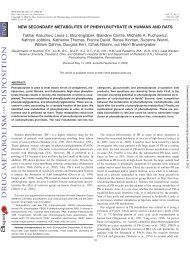
FIG. 1. Intestinal absorption, metabolism, <strong><strong>an</strong>d</strong> excretion of digoxin given systemically or intraluminally in the recirculating, vascularly perfused rat small intestine<br />
preparation. Schematic presentation of the traditional physiological models, TMs (A) <strong><strong>an</strong>d</strong> the segregated flow models, SFMs (B) with one of the possible, appended<br />
subcompartment schemes, (I), (II), or (III), is shown. These models consist of the reservoir (R), intestinal blood (intb, enb, <strong><strong>an</strong>d</strong> sb), intestinal tissue (int, en, <strong><strong>an</strong>d</strong> s), bilayer<br />
membr<strong>an</strong>e (mb), or unstirred water layer (w), lumen (l), plasma (p), <strong><strong>an</strong>d</strong> red blood cell (rbc) compartments, <strong><strong>an</strong>d</strong> <strong>an</strong> exudate compartment for collection of contents leaving<br />
the intestine at the ileocecal c<strong>an</strong>nula. Dg2 en was the total Dg2 formed in blood, intestinal tissue, <strong><strong>an</strong>d</strong> luminal fluid. The rbc partitioning parameters, k� rp <strong><strong>an</strong>d</strong> k pr, <strong><strong>an</strong>d</strong> protein<br />
<strong><strong>an</strong>d</strong> tissue unbound fractions, f p <strong><strong>an</strong>d</strong> f t, were integrated into the models for fitting <strong><strong>an</strong>d</strong> simulation. See text for details.<br />
the intestinal blood flow (Q) perfused the enterocyte layer of the mucosa tissue<br />
where both Cyp3a <strong><strong>an</strong>d</strong> Pgp resided. The remaining blood flow of the intestine,<br />
(1 � f Q)Q, perfused the serosa <strong><strong>an</strong>d</strong> other structures. When f Q was unity, the<br />
SFM simplified to the TM. In all the SFMs, substrate in the serosal blood (sb)<br />
<strong><strong>an</strong>d</strong> mucosal blood equilibrated with their respective perfused tissues. The<br />
tissue volumes were also divided according to f Q,asf Q� total tissue volume<br />
was assigned as the volume of the enterocyte region of the mucosal tissue, <strong><strong>an</strong>d</strong><br />
the remaining fraction, (1 � f Q) � total tissue volume, as the serosal tissue<br />
volume (see Table 2). Thus, the volumes of enterocyte layer (V en) <strong><strong>an</strong>d</strong> enterocyte<br />
blood (V enb), as well as those for the serosal tissue (V s) <strong><strong>an</strong>d</strong> serosal blood<br />
(V sb) were dependent on the value of f Q that was estimated from fitting. All<br />
clear<strong>an</strong>ce terms in the SFMs had the same me<strong>an</strong>ing as those for the TMs. The<br />
mass-bal<strong>an</strong>ce relationships developed previously (Cong et al., 2000; Doherty<br />
<strong><strong>an</strong>d</strong> P<strong>an</strong>g, 2000) were exp<strong><strong>an</strong>d</strong>ed to include the partitioning of Dg3 in rbc <strong><strong>an</strong>d</strong><br />
plasma protein (Liu et al., 2005), the tissue binding, <strong><strong>an</strong>d</strong> the influx/efflux<br />
intrinsic clear<strong>an</strong>ces of the bilayer membr<strong>an</strong>e or unstirred water layer (see<br />
Appendix).<br />
Fitting to the TM <strong><strong>an</strong>d</strong> SFM. The TM <strong><strong>an</strong>d</strong> SFM were used for the simult<strong>an</strong>eous<br />
fitting of the systemic <strong><strong>an</strong>d</strong> intraluminal data. Only first-order tr<strong>an</strong>sport<br />
<strong><strong>an</strong>d</strong> removal processes were considered. The assumption was valid since the<br />
concentration of digoxin used was very low. Since low levels of metabolites<br />
<strong><strong>an</strong>d</strong> lack of difference in metabolism were observed between the PCN <strong><strong>an</strong>d</strong><br />
control preparations, the total amount of Dg2 formed was used for fitting. Only<br />
the ch<strong>an</strong>ge of the Pgp level was considered between the data sets of PCN<br />
treatment <strong><strong>an</strong>d</strong> control. Hence, the parameter associated with Pgp efflux<br />
(CL 5,pcn) was allowed to ch<strong>an</strong>ge, whereas all other parameters were kept<br />
const<strong>an</strong>t for fitting in PCN treatment data. Fitting was performed with the<br />
program, Scientist version 2 (MicroMath Scientific Software, Salt Lake City,<br />
1471<br />
UT). Initial values were assigned r<strong><strong>an</strong>d</strong>omly; then, least-squares optimization<br />
was performed on data of the systemic <strong><strong>an</strong>d</strong> intraluminal administration of<br />
tracer of digoxin. The model selection criterion (MSC), a modified Akaike<br />
information criterion, <strong><strong>an</strong>d</strong> the sum of squared residuals were used as a discriminator<br />
for the optimal model. Various weighting schemes (no weighting,<br />
1/predicted, <strong><strong>an</strong>d</strong> 1/predicted 2 ) were tested to reach optimized fits; the weighting<br />
of unity furnished the best fit.<br />
Simulation. The parameters obtained from the best fitted models, TM(III)<br />
<strong><strong>an</strong>d</strong> SFM(III) (Table 3), were used for simulations to underst<strong><strong>an</strong>d</strong> the effects of<br />
the Pgp (CL 5) <strong><strong>an</strong>d</strong> the unstirred water layer (CL 4 <strong><strong>an</strong>d</strong> CL 3) on the bioavailability,<br />
F, estimated as<br />
F � �AUC po/Dose po�/�AUC iv/Dose iv� (6)<br />
where AUC po <strong><strong>an</strong>d</strong> AUC iv were the areas under the simulated concentrationtime<br />
curves (from time 0 to infinity) after oral (dose po) <strong><strong>an</strong>d</strong> intravenous doses<br />
(dose iv). The doses were assigned a value of 100%. The amounts versus time<br />
profiles of Dg3 in perfusate, lumen, <strong><strong>an</strong>d</strong> the total Dg2 formed were simulated.<br />
The inhibition <strong><strong>an</strong>d</strong> induction of efflux tr<strong>an</strong>sporter Pgp were considered, but the<br />
effect of Cyp3a was not considered here inasmuch as metabolism was a very<br />
small component of the total intestinal clear<strong>an</strong>ce of digoxin. Two parameters:<br />
CL 4 <strong><strong>an</strong>d</strong> CL 3, were ch<strong>an</strong>ged proportionally for simulation of the UWL effect.<br />
To address the effects of Pgp heterogeneity <strong><strong>an</strong>d</strong> induction on bioavailability,<br />
a second set of simulations was performed to examine whether the heterogeneous<br />
distribution of Pgp exerted <strong>an</strong> effect on digoxin absorption. The segmental<br />
traditional (STM) <strong><strong>an</strong>d</strong> the segmental segregated flow (SSFM) models<br />
were used (Tam et al., 2003). Since the simpler TM(III) <strong><strong>an</strong>d</strong> SFM(III) were<br />
found to best fit the digoxin data, the extended models [STM(III) <strong><strong>an</strong>d</strong> SS-<br />
Downloaded from<br />
dmd.aspetjournals.org by guest on February 25, 2013
1472 LIU ET AL.<br />
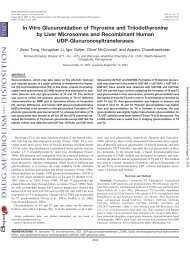
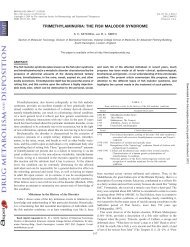
FIG. 2. Western blot <strong>an</strong>alysis of Pgp protein expression in enterocytes among<br />
segments 1 to 8 (S1–S8) in the small intestine of rat treated with PCN (F) or vehicle<br />
(E) for 4 days. Protein fractions from enterocytes, prepared according to the method<br />
of Traber et al. (1991), from duodenum (S1) to ileum (S8), were obtained from rats,<br />
with <strong><strong>an</strong>d</strong> without PCN treatment (me<strong>an</strong> � S.D., n � 4). The samples loaded were<br />
20 �g of protein. �, statistically different from control for that segment, P � 0.05.<br />
FM(III)] also contained the UWL. The whole small intestine was subdivided<br />
into three segments: duodenum (S1), jejunum (S2–S7), <strong><strong>an</strong>d</strong> ileum (S8), as in<br />
the experimental design on enterocyte collection. The segmental volume of the<br />
intestinal lumen <strong><strong>an</strong>d</strong> tissue, as well as segmental intestinal blood flow, were<br />
assumed to be the product of the fractional length of the intestinal segment: for<br />
the duodenum (based on S1, f 1 � 0.08), the jejunum (based on S2–S7, f 2 �<br />
0.78), <strong><strong>an</strong>d</strong> the ileum (based on S8, f 3 � 0.14), multiplied to the volume or flow<br />
of the entire intestine. The segmental clear<strong>an</strong>ces were subdivided into three<br />
portions according to the above fractions. The activity of the Pgp was assumed<br />
to correlate with the b<strong><strong>an</strong>d</strong> intensity of Western blotting, <strong><strong>an</strong>d</strong> the total intrinsic<br />
secretory clear<strong>an</strong>ce of Pgp, CL 5, was the summed b<strong><strong>an</strong>d</strong> intensity. Thus, the Pgp<br />
activity in duodenum (S1 only), jejunum (sum of S2 to S7), or ileum (S8) was<br />
estimated by the respective Pgp fractional intensity � CL 5. These fractions<br />
were 0.05, 0.80, <strong><strong>an</strong>d</strong> 0.15 for the duodenum, jejunum, <strong><strong>an</strong>d</strong> ileum of the control<br />
rats, <strong><strong>an</strong>d</strong> were 0.04, 0.78, <strong><strong>an</strong>d</strong> 0.18 for the PCN-treated rats.<br />
Statistical Analysis. Data are presented as me<strong>an</strong> � S.D.; Student’s t test<br />
was used, <strong><strong>an</strong>d</strong> it was considered to be statistically signific<strong>an</strong>t when P � 0.05.<br />
For model discrimination, the F test was used to compare the sums of squared<br />
differences (WSS) between fits (Boxenbaum et al., 1974).<br />
Results<br />
Western Blot Analysis. Western blot <strong>an</strong>alysis showed that the<br />
segmental distribution patterns of Pgp (Fig. 2) <strong><strong>an</strong>d</strong> Cyp3a (Fig. 3)<br />
were not uniform along the small intestine of rat. There was a distal<br />
enrichment of Pgp but a proximal abund<strong>an</strong>ce of Cyp3a among the<br />
intestinal segments, as observed in hum<strong>an</strong> intestine (Paine et al., 1997;<br />
Mouly <strong><strong>an</strong>d</strong> Paine, 2003). With PCN induction, Pgp protein expression<br />
in the small intestine increased approximately 1.5-fold of the control,<br />
<strong><strong>an</strong>d</strong> protein levels of S5 <strong><strong>an</strong>d</strong> S8 showed signific<strong>an</strong>t increases (Fig. 2).<br />
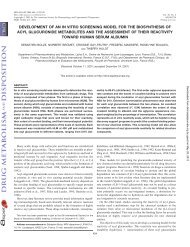
PCN treatment also increased the Cyp3a protein expression (average<br />
of 2-fold) along the small intestine (Fig. 3).<br />
Lack of Signific<strong>an</strong>t Intestinal Metabolism of [ 3 H]<strong>Digoxin</strong>. Perfusate<br />
levels at the end of the study (120 min) showed that Dg2 was<br />
present only at very low amounts for both systemic (�0.7% dose) <strong><strong>an</strong>d</strong><br />
intraluminal (�0.1% dose) administration of Dg3. The amounts of<br />
Dg1 <strong><strong>an</strong>d</strong> Dg0 were even lower or absent. PCN treatment did not<br />
ch<strong>an</strong>ge the metabolic profile of digoxin in the blood, luminal fluid, or<br />
FIG. 3. Western blot <strong>an</strong>alysis of Cyp3a protein expression in enterocytes among<br />
segments 1 to 8 (S1–S8) in the small intestine of rat treated with PCN (F) or vehicle<br />
(E) for 4 days. Protein fractions from enterocytes, prepared according to the method<br />
of Traber et al. (1991), from duodenum (S1) to ileum (S8), were obtained from rats,<br />
with <strong><strong>an</strong>d</strong> without PCN treatment (me<strong>an</strong> � S.D., n � 4). The samples loaded were<br />
10 �g of protein. �, statistically different from control for that segment, P � 0.05.<br />
intestinal tissue compared with that of controls, <strong><strong>an</strong>d</strong> [ 3 H]digoxin was<br />
the major component in all the samples for systemic <strong><strong>an</strong>d</strong> intraluminal<br />
administration. Thus, the contribution of metabolites in the blood was<br />
negligible in the present study, <strong><strong>an</strong>d</strong> total radioactivity rather th<strong>an</strong><br />
specific measurement of [ 3 H]digoxin was used for fitting <strong><strong>an</strong>d</strong> modeling.<br />
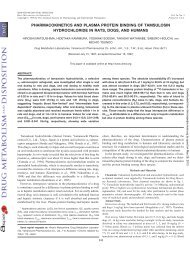
Systemic Administration of <strong>Digoxin</strong>. After systemic administration<br />
of a tracer dose of [ 3 H]digoxin into the reservoir of the recirculating<br />
small intestine preparation, a biexponential decay profile was<br />
observed for Dg3 concentrations in the blood perfusate. The amounts<br />
of [ 3 H]digoxin <strong><strong>an</strong>d</strong> the total Dg2 formed in blood perfusate <strong><strong>an</strong>d</strong><br />
luminal fluid are shown in Fig. 4. Approximately 11.2 � 5.1% of the<br />
dose of digoxin was secreted into the lumen, <strong><strong>an</strong>d</strong> little metabolite was<br />
found. A short distribution phase, followed by a prolonged terminal<br />
decay, was observed (Fig. 4). Within the first 15 min of perfusion,<br />
digoxin decayed relatively rapidly, <strong><strong>an</strong>d</strong> then with a clearly defined but<br />
very prolonged half-life (t 1/2) of 1440 � 1570 min, yielding a clear<strong>an</strong>ce<br />
of 0.22 � 0.17 ml/min in control rats (Table 1). With PCN<br />
treatment, the terminal decay of digoxin in blood perfusate was<br />
comparatively faster, yielding a much shorter t 1/2 (380 � 190 min)<br />
(Fig. 4) <strong><strong>an</strong>d</strong> a higher clear<strong>an</strong>ce of 0.47 � 0.24 ml/min (Table 1).<br />
However, due to the high variability, no statistical difference was<br />
found for these pharmacokinetic parameters (Table 1). Values of the<br />
steady-state volume of distribution, V dss, were similar: 215 � 12 ml<br />
for control <strong><strong>an</strong>d</strong> 215 � 6 ml for PCN treatment (P � 0.05). The loss<br />
of drug from blood perfusate was recovered from the lumen <strong><strong>an</strong>d</strong> the<br />
intestinal tissue. PCN-treated livers showed lesser amounts of Dg3 in<br />
perfusate (58.3 � 9.0 versus 66.1 � 7.6% dose) <strong><strong>an</strong>d</strong> higher amounts<br />
being secreted into the lumen (20.1 � 8.6 versus 11.2 � 5.1% dose)<br />
at 120 min compared with the controls. The intestinal tissue retained<br />
similar amounts of [ 3 H]digoxin (4.2–5.3% of the dose), regardless of<br />
PCN treatment or no treatment.<br />
Intraluminal Administration of <strong>Digoxin</strong>. The absorption of a<br />
tracer dose of [ 3 H]digoxin after <strong>an</strong> intraluminal bolus injection was<br />
Downloaded from<br />
dmd.aspetjournals.org by guest on February 25, 2013
FIG. 4. Fits to the systemic (i.v.) data of digoxin (Dg3) <strong><strong>an</strong>d</strong> its major metabolite of digoxigenin bis-digitoxoside (Dg2), to the TMs <strong><strong>an</strong>d</strong> SFMs in Fig. 1, from simult<strong>an</strong>eous<br />
fitting of the composite i.v. <strong><strong>an</strong>d</strong> p.o. data, with <strong><strong>an</strong>d</strong> without PCN treatment. Open symbols were for control data <strong><strong>an</strong>d</strong> solid symbols for PCN-treated data: circle, blood<br />
samples in reservoir; tri<strong>an</strong>gle, Dg3 in luminal fluid; <strong><strong>an</strong>d</strong> square, total Dg2 formed. Lines were for fitted results: short-dashed lines for control <strong><strong>an</strong>d</strong> solid lines for PCN<br />
treatment. �, statistically different from control in blood samples, P � 0.05.<br />
TABLE 1<br />
Pharmacokinetics of digoxin after systemic <strong><strong>an</strong>d</strong> intraluminal administration of tracer �3 H�digoxin from noncompartmental <strong>an</strong>alysis (me<strong>an</strong> � S.D.)<br />
Treatment<br />
AUC iv 0-� a<br />
Pgp AND UNSTIRRED WATER LAYER ON DIGOXIN ABSORPTION<br />
incomplete within the 120-min period for both control <strong><strong>an</strong>d</strong> PCNtreated<br />
intestinal preparations (Fig. 5). The extent of digoxin absorption<br />
was lower in the PCN-treated rats (6.7 � 3.2% of the dose)<br />
compared with control (9.2 � 2.0% of the dose) at 120 min. The<br />
accumulation of drug in the intestinal tissue was similar (4.9–8.7% of<br />
the dose), <strong><strong>an</strong>d</strong> a major proportion of the dose was recovered from the<br />
lumen (84 � 24 versus 95 � 27% of the dose, respectively).<br />
Tissue Binding of <strong>Digoxin</strong>. The intracellular binding of digoxin,<br />
based on repeated experiments with the S9 preparation from rat<br />
enterocytes (n � 3), yielded <strong>an</strong> average unbound fraction of 0.781 �<br />
0.069, after proper correction for nonspecific binding <strong><strong>an</strong>d</strong> the dilution<br />
factor (eq. 2). This value was assigned to both fitting <strong><strong>an</strong>d</strong> simulation<br />
procedures.<br />
Fitting of <strong>Digoxin</strong> Data. The input parameters for simult<strong>an</strong>eous<br />
fitting of the systemic <strong><strong>an</strong>d</strong> intraluminal data of Dg3 <strong><strong>an</strong>d</strong> the total<br />
amount of Dg2 formed in blood <strong><strong>an</strong>d</strong> lumen to the TM or SFM are<br />
summarized in Table 2; the optimized parameters obtained from<br />
fitting are summarized in Table 3. Both TM(I) <strong><strong>an</strong>d</strong> SFM(I) were able<br />
to reveal the PCN-inductive effects on the Pgp efflux intrinsic clear-<br />
CL b<br />
Systemic Dosing<br />
V dss c<br />
t 1/2 d<br />
AUC iv 0–2 h<br />
Intraluminal Dosing<br />
AUC po 0–2 h<br />
% dose � min ml/min ml (min) % dose � min % dose � min<br />
Control (n � 4) 186,300 � 195,800 0.22 � 0.17 215 � 12 1440 � 1570 10,547 � 262 5,135 � 2340<br />
PCN (n � 4) 51000 � 25700 0.47 � 0.24 215 � 6 381 � 190 9,840 � 577 1,479 � 569<br />
P value 0.220 0.129 0.951 0.230 0.067 0.027<br />
a AUCiv 0-� was calculated according to eq. 3.<br />
b The blood clear<strong>an</strong>ce of digoxin (CL) was calculated as the i.v. dose divided by the AUCiv 0-�.<br />
c The volume of drug distribution at steady state (Vdss) was calculated according to eq. 5.<br />
d The half-life (t) was estimated from the slope of the terminal phase of the semilogarithmic plot of blood concentration-time fitted by the method of least squares.<br />
1473<br />
<strong>an</strong>ce, CL 5 (2.5- <strong><strong>an</strong>d</strong> 1.3-fold increase), which was much larger th<strong>an</strong><br />
the metabolic intrinsic clear<strong>an</strong>ce, CL 7 (Table 3). However, the fit to<br />
TM(I) was suboptimal, since <strong>an</strong> unreasonably low absorptive intrinsic<br />
clear<strong>an</strong>ce (CL 6) was obtained for digoxin, a lipophilic compound, in<br />
comparison with those for blood to tissue partitioning (CL 1 <strong><strong>an</strong>d</strong> CL 2).<br />
The fit to SFM(I) for the intravenous data was poor, <strong><strong>an</strong>d</strong> the model<br />
suggests that intestinal blood flow to the enterocyte layer was 6% of<br />
the total intestinal flow (Table 3).<br />
Hence, we extended the above models to include the bilayer<br />
membr<strong>an</strong>e that houses Pgp (model II) or <strong>an</strong> UWL (model III) that<br />
bars digoxin from entering (Fig. 1). Upon fitting, we found that the<br />
submodels (II) <strong><strong>an</strong>d</strong> (III) of the TM <strong><strong>an</strong>d</strong> SFM were able to detect the<br />
increase in Pgp efflux capacity (1.3- to 2.8-fold over control). The<br />
estimates of the gastrointestinal tr<strong>an</strong>sit clear<strong>an</strong>ce (CL g) were 0.031<br />
to 0.049 ml/min for the TMs <strong><strong>an</strong>d</strong> 0.030 to 0.054 ml/min for the<br />
SFMs, <strong><strong>an</strong>d</strong> were similar to the value experimentally determined,<br />
0.031 ml/min, calculated from the volume of exudate over the time<br />
of collection (120 min). Inclusion of the bilayer membr<strong>an</strong>e (II<br />
models) failed to improve over TM(I) <strong><strong>an</strong>d</strong> SFM(I), <strong><strong>an</strong>d</strong> suboptimal<br />
Downloaded from<br />
dmd.aspetjournals.org by guest on February 25, 2013
1474 LIU ET AL.<br />
FIG. 5. Fits to the intraluminal (p.o.) data of digoxin (Dg3) <strong><strong>an</strong>d</strong> its major metabolite of digoxigenin bis-digitoxoside (Dg2), to the TM <strong><strong>an</strong>d</strong> SFM in Fig. 1, from simult<strong>an</strong>eous<br />
fitting of the composite i.v. <strong><strong>an</strong>d</strong> p.o. data, with <strong><strong>an</strong>d</strong> without PCN treatment. Open symbols were for control data <strong><strong>an</strong>d</strong> solid symbols for PCN-treated data: circle, blood<br />
samples in reservoir; tri<strong>an</strong>gle, Dg3 in luminal fluid; <strong><strong>an</strong>d</strong> square, total Dg2 formed. Lines were for fitted results: short-dashed lines for control <strong><strong>an</strong>d</strong> solid lines for PCN<br />
treatment. �, statistically different from control in blood samples, P � 0.05.<br />
TABLE 2<br />
Parameters used for simult<strong>an</strong>eous fit of systemic <strong><strong>an</strong>d</strong> intraluminal data of �3 H�digoxin<br />
Parameter<br />
fits were again obtained. However, inclusion of the unstirred water<br />
layer into the modeling dramatically improved the fits <strong><strong>an</strong>d</strong> the<br />
estimation of parameters. Both TM(III) <strong><strong>an</strong>d</strong> SFM(III) provided<br />
good fits to the intravenous <strong><strong>an</strong>d</strong> oral data of digoxin <strong><strong>an</strong>d</strong> detected<br />
the ch<strong>an</strong>ges of Pgp with PCN induction, attesting to a role for the<br />
Model<br />
TM SFM<br />
Oral dose (%) a 100 100<br />
i.v. dose (%) a 100 100<br />
Volume (ml)<br />
a<br />
Reservoir, VR 200 200<br />
b<br />
Total intestinal tissue, Vt 3 3<br />
c<br />
Enterocyte layer, Ven — g c Serosa <strong><strong>an</strong>d</strong> other tissues, Vs b<br />
Total intestine blood volume, Vb c Enterocyte blood, Venb c<br />
Serosal blood, Vsb b<br />
Intestine luminal volume, Vl d<br />
<strong>Unstirred</strong> water layer volume, Vw d<br />
Membr<strong>an</strong>e bilayer volume, Vmb Total intestinal blood flow rate, Q (ml/min)<br />
—<br />
1.6<br />
—<br />
—<br />
2<br />
1.1<br />
0.00011<br />
fQ � Vt (1 � fQ) � Vt 1.6<br />
fQ � Vb (1 � fQ) � Vb 2<br />
1.1<br />
0.00011<br />
a 8 8<br />
c<br />
Mucosa blood flow to enterocyte layer, Qen c<br />
Serosa <strong><strong>an</strong>d</strong> other tissue blood flow, Qs Exch<strong>an</strong>ge rate const<strong>an</strong>t from rbc to plasma, k� rp � frbc � krp (min<br />
—<br />
—<br />
fQ � Q<br />
(1 � fQ) � Q<br />
�1 ) e 1.81 1.81<br />
Exch<strong>an</strong>ge rate const<strong>an</strong>t from plasma to rbc, kpr (min �1 ) e 0.468 0.468<br />
e<br />
Unbound fraction of digoxin in plasma, fp f<br />
0.64 0.64<br />
Unbound fraction of digoxin in tissue, f t<br />
0.781 0.781<br />
a<br />
Experimental values for intestinal perfusion.<br />
b<br />
From Doherty <strong><strong>an</strong>d</strong> P<strong>an</strong>g (2000).<br />
c<br />
Only a fraction (fQ) of the total blood flow perfused the enterocyte layer of mucosa where the Cyp3a <strong><strong>an</strong>d</strong> Pgp reside, <strong><strong>an</strong>d</strong> the remaining intestinal blood flow (1 � fQ)Q perfused the serosa<br />
<strong><strong>an</strong>d</strong> other structures.<br />
d<br />
Calculated according to the radius of small intestine, 0.18 cm (Chiou, 1994), thickness of unstirred water layer, 100 �m (Anderson et al., 1988), <strong><strong>an</strong>d</strong> lipid bilayer membr<strong>an</strong>e, 10 nm, <strong><strong>an</strong>d</strong> small<br />
intestine of length 100 cm.<br />
e<br />
From Liu et al. (2005).<br />
f<br />
Measured by ultrafiltration.<br />
g<br />
—, not applicable.<br />
unstirred water layer in the intestinal absorption. The values of CL 1<br />
for digoxin partitioning into tissue were 2.8 <strong><strong>an</strong>d</strong> 14.9 ml/min for<br />
TM(III) <strong><strong>an</strong>d</strong> SFM(III), respectively, <strong><strong>an</strong>d</strong> were comparable to the<br />
value of blood flow (8 ml/min), <strong><strong>an</strong>d</strong> tr<strong>an</strong>slated to 0.58 <strong><strong>an</strong>d</strong> 3.06<br />
ml/min/g for TM(III) <strong><strong>an</strong>d</strong> SFM (III), respectively (for average<br />
Downloaded from<br />
dmd.aspetjournals.org by guest on February 25, 2013
TABLE 3<br />
Parameters obtained upon simult<strong>an</strong>eous fitting of systemic <strong><strong>an</strong>d</strong> intraluminal data of digoxin with TM <strong><strong>an</strong>d</strong> SFM<br />
The optimal weight scheme was unity.<br />
Parameter<br />
Pgp AND UNSTIRRED WATER LAYER ON DIGOXIN ABSORPTION<br />
tissue weight of 4.86 g). The absorptive intrinsic clear<strong>an</strong>ces, CL 6,<br />
were 4.6 <strong><strong>an</strong>d</strong> 1.7 ml/min, values comparable to those of CL 1 <strong><strong>an</strong>d</strong><br />
CL 2 (Table 3). The fractional flow to the enterocyte layer, 20% of<br />
the total intestinal flow for SFM(III), was a reasonable estimate,<br />
since this mucosal flow was reported to be in the r<strong>an</strong>ge of 5 to 30%<br />
of the intestinal flow rate (Cong et al., 2000, 2001). The bioavailability,<br />
F, was calculated from the fitted profile <strong><strong>an</strong>d</strong> was similar for<br />
both TM(III) <strong><strong>an</strong>d</strong> SFM(III): 0.131 to 0.132 for control <strong><strong>an</strong>d</strong> 0.105 to<br />
0.110 for PCN treatment, respectively.<br />
The F test was further used to compare the sums of squared<br />
differences (WSS) of fits between TM(I) <strong><strong>an</strong>d</strong> other models (Table 3).<br />
The calculated F values for TM(II) <strong><strong>an</strong>d</strong> SFM(I) <strong><strong>an</strong>d</strong> SFM(II) were not<br />
signific<strong>an</strong>tly different from those of TM(I), but the F values of<br />
TM(III) <strong><strong>an</strong>d</strong> SFM(III) were signific<strong>an</strong>tly different from those of<br />
TM(I) at the 5% level. The results of the F test, the model selection<br />
criterion (MSC), <strong><strong>an</strong>d</strong> sum of squared residuals from the fit were all<br />
consistent: TM(III) <strong><strong>an</strong>d</strong> SFM(III) consisting of the UWL were the best<br />
models to describe the disposition of digoxin in the small intestine,<br />
since the fits were associated with the smallest sum of squared<br />
residuals, the largest MSC (the greater the number, the better the fit),<br />
<strong><strong>an</strong>d</strong> reasonable absorptive intrinsic clear<strong>an</strong>ce CL 6.<br />
Simulation. The TM(III) <strong><strong>an</strong>d</strong> SFM(III) were used to further simulate<br />
the effects of efflux tr<strong>an</strong>sporter Pgp (secretory intrinsic clear<strong>an</strong>ce<br />
CL 5) <strong><strong>an</strong>d</strong> the UWL (diffusion clear<strong>an</strong>ces CL 4 <strong><strong>an</strong>d</strong> CL 3) on bioavailability<br />
using the parameters obtained from fitting (Table 3). A decrease<br />
in CL 5 (inhibition of P-glycoprotein) resulted in increased F<br />
(Fig. 6). When Pgp was completely inhibited by assigning the secretory<br />
intrinsic clear<strong>an</strong>ce, CL 5, equal to the absorptive intrinsic clear<strong>an</strong>ce<br />
CL 6, F increased by 17 <strong><strong>an</strong>d</strong> 19% for TM(III) <strong><strong>an</strong>d</strong> SFM(III),<br />
respectively, whereas induction of Pgp resulted in a decrease of F.<br />
With a 10-fold induction of Pgp, the bioavailability of F decreased by<br />
56 <strong><strong>an</strong>d</strong> 61% for TM(III) <strong><strong>an</strong>d</strong> SFM(III), respectively.<br />
Figure 7 shows the simulated results on the effect of the diffusion<br />
clear<strong>an</strong>ces (CL 3 <strong><strong>an</strong>d</strong> CL 4) of digoxin across the UWL on the bioavailability,<br />
F. Three cases were examined. In the first case, CL 3 <strong><strong>an</strong>d</strong> CL 4,<br />
the diffusion clear<strong>an</strong>ces to/from the bulk <strong><strong>an</strong>d</strong> from/to UWL, were<br />
much less th<strong>an</strong> the absorptive intrinsic clear<strong>an</strong>ce, CL 6. The simulta-<br />
TM SFM<br />
(I) (II) (III) (I) (II) (III)<br />
f Q — a — — 0.06 � 0.01 0.12 � 0.10 0.20 � 0.71<br />
Intrinsic Clear<strong>an</strong>ce (ml/min)<br />
CL 1 5.8 � 3.1 5.8 � 3.5 2.8 � 0.7 4.6 � 4.3 5.4 � 7.0 14.9 � 379<br />
CL 2 1.0 � 0.7 1.0 � 0.8 1.9 � 3.9 0.90 � 0.93 1.1 � 1.6 15.0 � 404<br />
CL 3 — — 0.028 � 0.012 — — 0.027 � 0.009<br />
CL 4 — — 0.0093 � 0.0026 — — 0.011 � 0.005<br />
CL 5 (Control) b 0.067 � 0.017 2.3 � 38.7 53.1 � 771 52.0 � 978 12.3 � 158 32.4 � 439<br />
CL 5 (PCN) c 0.17 � 0.03 6.5 � 0.0 126 � 1833 71.4 � 1341 16.9 � 217 79.7 � 1076<br />
CL 6 0.0058 � 0.0013 0.0070 � 0.0017 4.6 � 66.2 2.4 � 46.1 2.8 � 186 1.7 � 20.9<br />
CL 7 0.016 � 0.008 0.015 � 0.008 0.053 � 0.113 0.020 � 0.017 0.031 � 0.023 0.082 � 0.173<br />
CL 9 — 0.83 � 0.73 — — 0.26 � 0.20 —<br />
CL 10 — 25.9 � 425 — — 0.052 � 3.5 —<br />
CL g 0.031 � 0.011 0.034 � 107 0.049 � 0.016 0.030 � 0.013 0.030 � 0.013 0.054 � 0.022<br />
r 2 0.999 0.999 0.999 0.997 0.998 0.999<br />
MSC 6.28 6.22 6.40 5.60 5.58 6.40<br />
F test N.S. (0.23) S (5.95) N.S. (�29.33) N.S. (�9.13) S (4.75)<br />
SSR 196 194 164 372 360 158<br />
N.S., insignific<strong>an</strong>tly different from TM(I) model at P � 0.05 (calculated F value included in parentheses); S, signific<strong>an</strong>tly different from TM(I) model at P � 0.05 (calculated F value included<br />
in parentheses).<br />
a —, not applicable.<br />
b Obtained from simult<strong>an</strong>eous fitting of systemic <strong><strong>an</strong>d</strong> intraluminal data of control.<br />
c Obtained from simult<strong>an</strong>eous fitting of systemic <strong><strong>an</strong>d</strong> intraluminal data of PCN treatment. All other CL values were fitted from both control <strong><strong>an</strong>d</strong> PCN-treated data.<br />
1475<br />
FIG. 6. Simulated effect of efflux tr<strong>an</strong>sporter P-glycoprotein (secretory intrinsic<br />
clear<strong>an</strong>ce, CL 5, in Fig. 1) on the bioavailability, F. Simulations were based on<br />
parameter values shown in Table 3 for TM(III) (open circle) <strong><strong>an</strong>d</strong> SFM(III) (solid<br />
circle).<br />
neous increase of CL 4 <strong><strong>an</strong>d</strong> CL 3, achieved by reducing the thickness of<br />
the UWL, increased F linearly <strong><strong>an</strong>d</strong> showed that the rate of solute<br />
diffusion through the UWL was the rate-limiting barrier. In the second<br />
case, CL 4, the diffusion clear<strong>an</strong>ce from bulk to UWL was close to or<br />
exceeded CL 6, the absorptive intrinsic clear<strong>an</strong>ce. F was found to be<br />
independent on CL 4, <strong><strong>an</strong>d</strong> there was no influence from the UWL since<br />
the UWL was thin enough <strong><strong>an</strong>d</strong> the diffusion through it was not a<br />
rate-limiting step. In the third case, CL 4 was approaching CL 6. The<br />
diffusion clear<strong>an</strong>ces across both the UWL (CL 4 <strong><strong>an</strong>d</strong> CL 3) <strong><strong>an</strong>d</strong> the<br />
membr<strong>an</strong>e (CL 6) all played roles in determining F in this scenario. In<br />
our perfusion experiment, it appeared that the UWL effect was similar<br />
to the first scenario because CL 4 was much smaller th<strong>an</strong> CL 6 (Table<br />
3), <strong><strong>an</strong>d</strong> a slight ch<strong>an</strong>ge of the UWL thickness may signific<strong>an</strong>tly<br />
influence the bioavailability.<br />
Other simulations were also conducted to examine the effect of Pgp<br />
heterogeneity on digoxin disposition. TM(III) <strong><strong>an</strong>d</strong> SFM(III) were<br />
exp<strong><strong>an</strong>d</strong>ed to include three segmental regions: the duodenum, the<br />
Downloaded from<br />
dmd.aspetjournals.org by guest on February 25, 2013
1476 LIU ET AL.<br />
FIG. 7. Simulated effect of the unstirred water layer (diffusion clear<strong>an</strong>ces, CL 4 <strong><strong>an</strong>d</strong><br />
CL 3) on bioavailability, F. Simulations were based on parameter values in Table 3<br />
for TM(III) (open circle) <strong><strong>an</strong>d</strong> SFM(III) (solid circle). The diffusion efflux clear<strong>an</strong>ce<br />
of CL 3 from the UWL to the lumen was proportionally ch<strong>an</strong>ged with CL 4.<br />
FIG. 8. Simulations based on the STM(III) <strong><strong>an</strong>d</strong> SSFM(III) with <strong>an</strong> unstirred water<br />
layer. The intestine was subdivided into three segments: duodenum, jejunum, <strong><strong>an</strong>d</strong><br />
ileum (based on Tam et al., 2003), with parameters obtained from fitting digoxin<br />
data to TM(III) <strong><strong>an</strong>d</strong> SFM(III). The heterogeneity of Pgp distribution along the small<br />
intestine was considered. The predictions (lines) for the STM(III) <strong><strong>an</strong>d</strong> SSFM(III),<br />
shown as short-dashed lines for control <strong><strong>an</strong>d</strong> solid lines for PCN treatment, matched<br />
well with the experimental data (symbols).<br />
jejunum, <strong><strong>an</strong>d</strong> the ileum, as shown by Tam et al. (2003). In these<br />
simulations of STM(III) <strong><strong>an</strong>d</strong> SSFM(III), we used the parameters<br />
obtained from the fits of TM(III) <strong><strong>an</strong>d</strong> SFM(III) (Table 3) <strong><strong>an</strong>d</strong> the<br />
segmental fractional activities calculated from the observed Pgp distribution<br />
(Fig. 2). The predictions showed good matches to the experimental<br />
data, although there was a systematic trend for the residuals<br />
of the oral data with PCN treatment (Fig. 8). F was similar for<br />
both TM(III)/STM(III) <strong><strong>an</strong>d</strong> SFM(III)/SSFM(III) in control (0.132/<br />
0.135 <strong><strong>an</strong>d</strong> 0.131/0.134) <strong><strong>an</strong>d</strong> with PCN induction (0.110/0.113 <strong><strong>an</strong>d</strong><br />
0.105–0.107) when considering the heterogeneity of Pgp. The similar<br />
bioavailability between TM(III)/SFM(III) <strong><strong>an</strong>d</strong> STM(III)/SSFM(III)<br />
suggests that Pgp heterogeneity was not import<strong>an</strong>t. The sum of<br />
squared residuals (SSR) was 172 for STM(III) <strong><strong>an</strong>d</strong> 167 for SSFM(III),<br />
slightly larger th<strong>an</strong> those for TM(III) (164) <strong><strong>an</strong>d</strong> SFM(III) (158).<br />
Discussion<br />
In the present study, we investigated the binding, absorption, metabolism,<br />
distribution, <strong><strong>an</strong>d</strong> excretion of [ 3 H]digoxin in the vascularly<br />
perfused rat small intestine preparation. It is well accepted that both<br />
intestinal tr<strong>an</strong>sport <strong><strong>an</strong>d</strong> drug metabolism are import<strong>an</strong>t determin<strong>an</strong>ts<br />
of first-pass elimination of orally administered drugs (Drescher et al.,<br />
2003; P<strong>an</strong>g, 2003). Efflux via Pgp is the critical determin<strong>an</strong>t of the<br />
bioavailability of digoxin in hum<strong>an</strong>s. The same was found for cyclosporin<br />
<strong><strong>an</strong>d</strong> paclitaxel, other prototypic substrates of the intestinal<br />
efflux MDR1 or Pgp pump (Drescher et al., 2003). The rate-limiting<br />
step in drug absorption is not uptake for digoxin, since the drug is<br />
lipophilic, <strong><strong>an</strong>d</strong> apical efflux is the major pathway of elimination of<br />
digoxin for the rat intestine. <strong>Digoxin</strong> intestinal clear<strong>an</strong>ce doubled<br />
(0.47 � 0.24 ml/min) with PCN-treated rats compared with those of<br />
controls (0.22 � 0.17 ml/min), although no statistically signific<strong>an</strong>t<br />
ch<strong>an</strong>ge was noted (P � 0.129, n � 4). Our observation is similar to<br />
those found in mice <strong><strong>an</strong>d</strong> hum<strong>an</strong>s (Mayer et al., 1996; Drescher et al.,<br />
2003). In hum<strong>an</strong>s, the average elimination of digoxin into the gut<br />
lumen exceeded 11% within 3 h (Drescher et al., 2003). Moreover,<br />
digoxin absorption was signific<strong>an</strong>tly reduced after intraluminal administration<br />
of [ 3 H]digoxin in the rat intestinal preparation (Fig. 5), a<br />
consequence consistent with increased Pgp expression with PCN<br />
treatment (Fig. 2). Thus, the small intestine is <strong>an</strong> import<strong>an</strong>t excretion<br />
tissue for digoxin elimination in hum<strong>an</strong>s, mice, <strong><strong>an</strong>d</strong> rats, <strong><strong>an</strong>d</strong> the<br />
Pgp-mediated efflux reduced the entry of digoxin into the enterocytes.<br />
Intestinal metabolism is <strong>an</strong>other import<strong>an</strong>t determin<strong>an</strong>t of bioavailability.<br />
Most of the drug-metabolizing enzymes present in the liver are<br />
also found in the small intestine, despite the fact that the levels are<br />
generally much lower in the small intestine (Lin et al., 1999). <strong>Digoxin</strong><br />
is metabolized in the rat (Wirth <strong><strong>an</strong>d</strong> Frölich, 1974; Harrison <strong><strong>an</strong>d</strong><br />
Gibaldi, 1976; Salphati <strong><strong>an</strong>d</strong> Benet, 1999), with approximately 60% of<br />
the total body plasma clear<strong>an</strong>ce (5.77 ml/min) being attributed to<br />
biotr<strong>an</strong>sformation (Harrison <strong><strong>an</strong>d</strong> Gibaldi, 1976) by Cyp3a (Salphati<br />
<strong><strong>an</strong>d</strong> Benet, 1999). Hepatic metabolism (Salphati <strong><strong>an</strong>d</strong> Benet, 1999; Liu<br />
et al., 2005) must have accounted for most of the biotr<strong>an</strong>sformation<br />
since in vitro incubations of digoxin with rat intestinal tissue showed<br />
that digoxin was not metabolized by rat enterocytes to <strong>an</strong>y signific<strong>an</strong>t<br />
extent (Sababi et al., 2001). In the present study with the perfused rat<br />
small intestine, little metabolism in the small intestine was observed,<br />
<strong><strong>an</strong>d</strong> PCN treatment failed to ch<strong>an</strong>ge the metabolic profiles. These<br />
results suggest that intestinal Cyp3a protein, though present <strong><strong>an</strong>d</strong><br />
induced by PCN treatment (Fig. 3), failed to affect digoxin removal.<br />
Intestinal Cyp3a protein, though induced, was a poor reflector of<br />
digoxin metabolism in rat small intestine inasmuch as digoxin is a<br />
poor substrate. For all intents <strong><strong>an</strong>d</strong> purposes, the inductive effect of<br />
PCN on digoxin metabolism by Cyp3a was ignored.<br />
In this small intestine preparation, the volume of distribution of<br />
digoxin at steady state (215 ml) was only marginally larger th<strong>an</strong> the<br />
reservoir blood volume (200 ml), suggesting a lack of concentrative<br />
effect of digoxin into rat enterocytes. The observation was consistent<br />
with the low tissue binding (intestinal tissue unbound fraction, 0.781),<br />
such that the tissue volume (Vt fb/ft) was almost the same as the<br />
physiological volume of the intestinal tissue (Vt), since the unbound<br />
fractions in blood (0.64) (Liu et al., 2005) <strong><strong>an</strong>d</strong> tissue (0.78) are similar.<br />
This contrasted with other results on the distribution of digoxin in<br />
tissues that uncovered high concentrations of digoxin in the heart,<br />
kidney, <strong><strong>an</strong>d</strong> liver (Doherty et al., 1967), contributing to the large<br />
apparent volume of distribution of digoxin (Harrison <strong><strong>an</strong>d</strong> Gibaldi,<br />
1976).<br />
The decay of digoxin was associated with a very long t1/2. The<br />
sampling duration was much shorter th<strong>an</strong> the estimated terminal<br />
Downloaded from<br />
dmd.aspetjournals.org by guest on February 25, 2013
Pgp AND UNSTIRRED WATER LAYER ON DIGOXIN ABSORPTION<br />
half-lives in both groups (Table 1), <strong><strong>an</strong>d</strong> it may be argued that the<br />
parameter had not been estimated correctly, since sampling was not<br />
followed beyond two half-lives, the recommended regimen for proper<br />
determination of the t 1/2 or elimination rate const<strong>an</strong>t of digoxin.<br />
Hence, errors may be incurred in the estimation clear<strong>an</strong>ce <strong><strong>an</strong>d</strong> volume<br />
of distribution, parameters calculated with either the rate const<strong>an</strong>t or<br />
the half-life. The intestinal perfusion system might be less reliable for<br />
pharmacokinetic estimates for drugs with very long half-lives. But<br />
because distribution equilibrium was reached by 20 min of perfusion<br />
(Fig. 4), the terminal t 1/2 was clearly defined <strong><strong>an</strong>d</strong> the error was<br />
minimized.<br />
Recognizing that proper interpretation could be attained with modeling,<br />
we used the previously developed TM <strong><strong>an</strong>d</strong> SFM that considered<br />
all the physiological parameters for fitting (Cong et al., 2000; Doherty<br />
<strong><strong>an</strong>d</strong> P<strong>an</strong>g, 2000). Both TM(I) <strong><strong>an</strong>d</strong> SFM(I) were able to predict the<br />
PCN induction effect on the Pgp efflux intrinsic clear<strong>an</strong>ce CL 5 (2.5<strong><strong>an</strong>d</strong><br />
1.4-fold increase), <strong><strong>an</strong>d</strong> the increase matched the Western blotting<br />
results well (1.5-fold increase in Pgp expression). However TM(I)<br />
was considered suboptimal since the absorptive intrinsic clear<strong>an</strong>ce<br />
(CL 6) was unreasonably low in comparison with the blood to tissue<br />
partitioning clear<strong>an</strong>ce (CL 1). The SFM(I) rendered poor fits to the<br />
systemic data, although a more reasonable CL 6 was obtained. Upon<br />
modeling with a bilayer membr<strong>an</strong>e for Pgp (model II), the estimate of<br />
CL 6 remained low in TM(II) (Table 3) <strong><strong>an</strong>d</strong> the fitting to the systemic<br />
data was poor in SFM(II) (Fig. 4). With <strong>an</strong> UWL (model III) for slow<br />
entry of digoxin (Fig. 1), however, good fits to the intravenous <strong><strong>an</strong>d</strong><br />
oral data of digoxin were obtained by TM(III) <strong><strong>an</strong>d</strong> SFM(III). Reasonable<br />
estimates of CL 6 for absorption <strong><strong>an</strong>d</strong> appropriate CL 5 that described<br />
the ch<strong>an</strong>ges (2.4-fold for both) in Pgp with PCN induction<br />
were obtained with TM(III) <strong><strong>an</strong>d</strong> SFM(III). These results assert a role<br />
of the unstirred water layer in the intestinal absorption of digoxin. The<br />
estimated fractional flow to the enterocyte layer (20%) was reasonable<br />
(Cong et al., 2000, 2001). The present data, however, precluded<br />
discrimination between TM(III) <strong><strong>an</strong>d</strong> SFM(III) as to which was the<br />
better model, since model discrimination necessitated the presence of<br />
metabolite data. By contrast, assignment of SFM(I) as a better model<br />
over TM(I) for morphine absorption <strong><strong>an</strong>d</strong> metabolism by the perfused<br />
rat intestine preparation was possible because morphine 3�-glucuronide<br />
data were available. When the segmental heterogeneity of Pgp<br />
was considered in the model III versions of the STM <strong><strong>an</strong>d</strong> SSFM, the<br />
simulations matched well with the experimental data (Fig. 8). Because<br />
of the lack of signific<strong>an</strong>t ch<strong>an</strong>ge, regardless of whether or not heterogeneity<br />
of Pgp was considered, differences in Pgp levels among the<br />
duodenal, jejunal, <strong><strong>an</strong>d</strong> ileal segments were deemed to be unimport<strong>an</strong>t<br />
in digoxin bioavailability.<br />
The presence of the UWL, together with the Pgp, compounded the<br />
problem in lowering F. The UWL, with a thickness estimated at 100<br />
to 800 �m or less, has long been recognized as a potential barrier for<br />
intestinal absorption of compounds (Lewis <strong><strong>an</strong>d</strong> Fordtr<strong>an</strong>, 1975; Ho et<br />
al., 1983; Chiou, 1994). Permeation of drugs within the UWL was<br />
modeled as a simple diffusion process in a water layer. For hydrophilic<br />
molecules, the membr<strong>an</strong>e constitutes the rate-limiting barrier in<br />
the tr<strong>an</strong>sport process, whereas for lipophilic molecules such as<br />
digoxin, the UWL constitutes the rate-limiting barrier. Thus, thinning<br />
of the UWL will increase solute absorption if the rate of solute<br />
diffusion through the UWL is slower th<strong>an</strong> its rate of membr<strong>an</strong>e<br />
tr<strong>an</strong>sport (Lewis <strong><strong>an</strong>d</strong> Fordtr<strong>an</strong>, 1975; Ho et al., 1983; Kou et al., 1991;<br />
Tsutsumi et al., 2003). In situ luminal perfusion studies showed that<br />
several factors contributed to the ch<strong>an</strong>ge of the absorption rate:<br />
perfusion flow rate, absorbing area, effective unstirred layer thickness<br />
(Winne, 1979), <strong><strong>an</strong>d</strong> various physiochemical properties of compounds<br />
(Amidon et al., 1981). The physiologically relev<strong>an</strong>t physical models,<br />
which considered the physicochemical properties <strong><strong>an</strong>d</strong> tr<strong>an</strong>sport mech<strong>an</strong>isms,<br />
c<strong>an</strong> provide useful information to the relationships of intestinal<br />
length, flow rate, pH, <strong><strong>an</strong>d</strong> permeabilities of the aqueous boundary<br />
layer <strong><strong>an</strong>d</strong> membr<strong>an</strong>e (Amidon et al., 1981; Ho et al., 1983). Our<br />
simulation results with the UWL (Fig. 7) confirmed the relative<br />
effects of the UWL (CL 4/CL 3) <strong><strong>an</strong>d</strong> the intestinal membr<strong>an</strong>e (CL 6/<br />
CL 5) on the bioavailability of digoxin. Diffusion of digoxin through<br />
the UWL, the intestinal membr<strong>an</strong>e, or both could be the rate-limiting<br />
step(s), depending on the relative values between CL 4 (CL 3) <strong><strong>an</strong>d</strong> CL 6<br />
(CL 5). When the roles of Pgp efflux <strong><strong>an</strong>d</strong> the unstirred water layer<br />
(UWL) were compared in simulations, the role of the UWL was much<br />
more prominent in reducing F of digoxin (Figs. 6 <strong><strong>an</strong>d</strong> 7). The effect<br />
of Pgp is lessened for digoxin since reabsorption of this lipophilic<br />
drug readily occurs.<br />
In summary, the rat in situ intestinal perfusion preparation has<br />
proven to be a useful tool for investigating the mech<strong>an</strong>ism of drug<br />
tr<strong>an</strong>sport (absorption <strong><strong>an</strong>d</strong> excretion), enzymes (metabolism), <strong><strong>an</strong>d</strong> induction/inhibition.<br />
For digoxin, the contribution of the intestinal metabolism<br />
to the overall first-pass metabolism in rats is unimport<strong>an</strong>t,<br />
regardless of PCN induction <strong><strong>an</strong>d</strong> administered route. The TM(III) <strong><strong>an</strong>d</strong><br />
SFM(III) with the unstirred water layer explained <strong><strong>an</strong>d</strong> predicted the<br />
roles of P-glycoprotein <strong><strong>an</strong>d</strong> the unstirred water layer for digoxin<br />
absorption <strong><strong>an</strong>d</strong> disposition. We were able to identify the intestinal<br />
P-glycoprotein, which was enh<strong>an</strong>ced by PCN induction, as a major<br />
determin<strong>an</strong>t for digoxin intestinal clear<strong>an</strong>ce <strong><strong>an</strong>d</strong> absorption from the<br />
rat intestinal tract. The unstirred water layer posed as a subst<strong>an</strong>tial<br />
barrier for digoxin absorption.<br />
Appendix<br />
The traditional model TM(III) <strong><strong>an</strong>d</strong> the segregated flow model<br />
SFM(III), with the unstirred water layer, were shown in Fig. 1. The<br />
difference in the models lies in the segregation of blood flow for<br />
perfusion of the enterocyte region <strong><strong>an</strong>d</strong> the serosal region for the SFM.<br />
Mass-Bal<strong>an</strong>ce Equations for TM(III). For the rates of ch<strong>an</strong>ge of<br />
amounts of digoxin (Dg3) in perfusate blood (subscript R), red blood<br />
cell (subscript rbc,R), <strong><strong>an</strong>d</strong> plasma (subscript p,R) in reservoir,<br />
dDg3 R<br />
dt � Q�Dg3 rbc,int b � Dg3 p,int b�/V b � Q�Dg3 rbc,R � Dg3 p,R�/V R<br />
dDg3rbc,R � k<br />
dt<br />
prfpDg3p,R � k� rpDg3rbc,R � QDg3rbc,R/VR � QDg3rbc,int b/Vb dDg3 p,R<br />
dt � k� rpDg3 rbc,R � k prf pDg3 p,R � QDg3 p,R/V R � QDg3 p,int b/V b<br />
For the rates of ch<strong>an</strong>ge of amounts of digoxin (Dg3) in the rbc<br />
(subscript rbc,intb) <strong><strong>an</strong>d</strong> plasma (subscript p,intb) of intestinal blood,<br />
dDg3rbc,int b<br />
� k<br />
dt<br />
prfpDg3p,int b � k� rpDg3rbc,int b � QDg3rbc,int b/Vb dDg3p,int b<br />
� k�<br />
dt<br />
rpDg3rbc,int b � kprfpDg3p,int b � QDg3p,int b/Vb 1477<br />
� QDg3 rbc,R/V R<br />
� QDg3 p,R/V R � f pDg3 p,int bCL 1/�V b�1 � Hct�� � f tDg3 intCL 2/V t<br />
For the rates of ch<strong>an</strong>ge of amounts of digoxin (Dg3) <strong><strong>an</strong>d</strong> digoxigenin<br />
bis-digitoxoside (Dg2) in the intestinal tissue compartment<br />
(subscript int),<br />
Downloaded from<br />
dmd.aspetjournals.org by guest on February 25, 2013
1478 LIU ET AL.<br />
dDg3 int<br />
dt � f pDg3 p,int bCL 1/�V b�1 � Hct�� � Dg3 wCL 6/V w<br />
dDg2 int<br />
dt � f tDg3 intCL 7/V t<br />
� f tDg3 int�CL 2 � CL 5 � CL 7�/V t<br />
With PCN induction, the above equation containing CL 5 was ch<strong>an</strong>ged<br />
to pCL 5.<br />
For the rate of ch<strong>an</strong>ge of amount of digoxin (Dg3) in the unstirred<br />
water layer compartment (subscript w),<br />
dDg3 w<br />
dt � f tDg3 intCL 5/V t � Dg3 lCL 4/V l � Dg3 w�CL 3 � CL 6�/V w<br />
With PCN induction, the above equation containing CL 5 was ch<strong>an</strong>ged<br />
to pCL 5.<br />
For the rates of ch<strong>an</strong>ge of amounts of digoxin (Dg3) in the intestinal<br />
lumen (subscript l) <strong><strong>an</strong>d</strong> exudates (subscript e) compartments,<br />
dDg3 l<br />
dt � Dg3 wCL 3/V w � Dg3 l�CL 4 � CL g�/V l<br />
dDg3 e<br />
dt � Dg3 lCL g/V l<br />
Mass-Bal<strong>an</strong>ce Equations for SFM(III). For the rates of ch<strong>an</strong>ge of<br />
amounts of digoxin (Dg3) in the reservoir blood (subscript R), red<br />
blood cell (subscript rbc,R), <strong><strong>an</strong>d</strong> plasma (subscript p,R),<br />
dDg3 R<br />
dt � Q�Dg3 rbc,enb � Dg3 p,enb � Dg3 rbc,sb � Dg3 p,sb�/V b<br />
dDg3rbc,R � k<br />
dt<br />
prfpDg3p,R � k� rpDg3rbc,R � QDg3rbc,R/VR dDg3 p,R<br />
dt � k� rpDg3 rbc,R � k prf pDg3 p,R � QDg3 p,R/V R<br />
� Q�Dg3 rbc,R � Dg3 p,R�/V R<br />
� Q�Dg3 rbc,enb � Dg3 rbc,sb�/V b<br />
� Q�Dg3p,enb � Dg3p,sb�/Vb For the rates of ch<strong>an</strong>ge of amounts of digoxin (Dg3) in the red<br />
blood cell (subscript rbc,sb) <strong><strong>an</strong>d</strong> plasma (subscript p,sb) of the serosal<br />
blood compartment,<br />
dDg3rbc,sb � k<br />
dt<br />
prfpDg3p,sb � k� rpDg3rbc,sb � QDg3rbc,sb/Vb dDg3p,sb dt<br />
� k� rpDg3rbc,sb � kprfpDg3p,sb � QDg3p,sb/Vb � �1 � f Q�QDg3 rbc,R/V R<br />
� �1 � f Q�QDg3 p,R/V R � f pDg3 p,sbCL 1/��1 � f Q�V b�1 � Hct��<br />
� f tDg3 sCL 2/��1 � f Q�V t�<br />
For the rate ch<strong>an</strong>ge of digoxin amount (Dg3) in the serosal (subscript,<br />
s) compartment<br />
dDg3 s<br />
dt � f pDg3 p,sbCL 1/��1 � f Q�V b�1 � Hct�� � f tDg3 sCL 2/��1 � f Q�V t�<br />
For the rates ch<strong>an</strong>ge of amounts of digoxin (Dg3) in the rbc<br />
(subscript rbc,enb) <strong><strong>an</strong>d</strong> plasma (subscript p,enb) of the enterocyte<br />
blood compartment,<br />
dDg3rbc,enb � k<br />
dt<br />
prfpDg3p,enb � k� rpDg3rbc,enb � QDg3rbc,enb/Vb dDg3p,enb � k�<br />
dt<br />
rpDg3rbc,enb � kprfpDg3p,enb � QDg3p,enb/Vb � f QQDg3 p,R/V R � f pDg3 p,enbCL 1/� f QV b�1 � Hct��<br />
� f QQDg3 rbc,R/V R<br />
� f tDg3 enCL 2/� f QV t�<br />
For the rates of ch<strong>an</strong>ge of amounts of digoxin (Dg3) <strong><strong>an</strong>d</strong> metabolite<br />
of Dg2 in the intestinal enterocyte (subscript, en) compartment,<br />
dDg3 en<br />
dt � f pDg3 p,enbCL 1/� f QV b�1 � Hct�� � Dg3 wCL 6/V w<br />
� f tDg3 en�CL 2 � CL 5 � CL 7�/� f QV t�<br />
dDg2 en<br />
dt � f tDg3 enCL 7/� f QV t�<br />
With PCN induction, the above equation containing CL 5 was<br />
ch<strong>an</strong>ged to pCL 5.<br />
For the rate ch<strong>an</strong>ge of amount of digoxin (Dg3) in the unstirred<br />
water layer compartment (subscript, w)<br />
dDg3 w<br />
dt � f tDg3 enCL 5/� f QV t� � Dg3 lCL 4/V l � Dg3 w�CL 3 � CL 6�/V w<br />
With PCN induction, the above equation containing CL 5 was ch<strong>an</strong>ged<br />
to pCL 5.<br />
For the rate ch<strong>an</strong>ge of digoxin amount (Dg3) in the intestinal lumen<br />
(subscript l) <strong><strong>an</strong>d</strong> exudate (subscript e) compartments,<br />
dDg3 l<br />
dt � Dg3 wCL 3/V w � Dg3 l�CL 4 � CL g�/V t<br />
dDg3 e<br />
dt � Dg3 lCL g/V l<br />
References<br />
Amidon GE, Ho NFH, French AB, <strong><strong>an</strong>d</strong> Higuchi WI (1981) Predicted absorption with simult<strong>an</strong>eous<br />
bulk fluid flow in the intestinal tract. J Theor Biol 89:195–210.<br />
Anderson BW, Levine AS, Levitt DG, Kneip JM, <strong><strong>an</strong>d</strong> Levitt MD (1988) Physiological measurement<br />
of luminal stirring in perfused rat jejunum. Am J Physiol 254:G843–G848.<br />
Boxenbaum HG, Riegelm<strong>an</strong> S, <strong><strong>an</strong>d</strong> Elashoff RM (1974) Statistical estimations in pharmacokinetics.<br />
J Pharmacokinet Biopharm 2:123–148.<br />
Chiou WL (1994) Effect of ‘unstirred’ water layer in the intestine on the rate <strong><strong>an</strong>d</strong> extent of<br />
absorption after oral administration. Biopharm Drug Dispos 15:709–717.<br />
Cong D, Doherty M, <strong><strong>an</strong>d</strong> P<strong>an</strong>g KS (2000) A new physiologically based, segregated-flow model<br />
to explain route-dependent intestinal metabolism. Drug Metab Dispos 28:224–235.<br />
Cong D, Fong AKY, Lee R, <strong><strong>an</strong>d</strong> P<strong>an</strong>g KS (2001) Absorption of benzoic acid in segmental<br />
regions of the vascularly perfused rat small intestine preparation. Drug Metab Dispos 29:<br />
1539–1547.<br />
Cummins CL, Salphati L, Reid MJ, <strong><strong>an</strong>d</strong> Benet LZ (2003) In vivo modulation of intestinal CYP3A<br />
metabolism by P-glycoprotein: studies using the rat single-pass intestinal perfusion model.<br />
J Pharmacol Exp Ther 305:306–314.<br />
Doherty JE, Perkins WH, <strong><strong>an</strong>d</strong> Fl<strong>an</strong>ig<strong>an</strong> WJ (1967) The distribution <strong><strong>an</strong>d</strong> concentration of tritiated<br />
digoxin in hum<strong>an</strong> tissues. Ann Intern Med 66:116–124.<br />
Doherty MM <strong><strong>an</strong>d</strong> P<strong>an</strong>g KS (2000) Route-dependent metabolism of morphine in the vascularly<br />
perfused rat small intestine preparation. Pharm Res (NY) 17:291–298.<br />
Drescher S, Glaeser H, Mürdter T, Hitzl M, Eichelbaum M, <strong><strong>an</strong>d</strong> Fromm MF (2003) Pglycoprotein-mediated<br />
intestinal <strong><strong>an</strong>d</strong> biliary digoxin tr<strong>an</strong>sport in hum<strong>an</strong>s. Clin Pharmacol<br />
Ther 73:223–231.<br />
Funakoshi S, Murakami T, Yumoto R, Kiribayashi Y, <strong><strong>an</strong>d</strong> Tak<strong>an</strong>o M (2003) Role of Pglycoprotein<br />
in pharmacokinetics <strong><strong>an</strong>d</strong> drug interactions of digoxin <strong><strong>an</strong>d</strong> �-methyldigoxin in<br />
rats. J Pharm Sci 92:1455–1463.<br />
Downloaded from<br />
dmd.aspetjournals.org by guest on February 25, 2013
Pgp AND UNSTIRRED WATER LAYER ON DIGOXIN ABSORPTION<br />
Geick A, Eichelbaum M, <strong><strong>an</strong>d</strong> Burk O (2001) Nuclear receptor response elements mediate<br />
induction of intestinal MDR1 by rifampin. J Biol Chem 276:14581–14587.<br />
Geng WP, Schwab AJ, Goresky CA, <strong><strong>an</strong>d</strong> P<strong>an</strong>g KS (1995) Carrier-mediated uptake <strong><strong>an</strong>d</strong> expression<br />
of bromosulfophthalein-glutathione in perfused rat liver: a multiple indicator dilution<br />
study. Hepatology 22:1188–1207.<br />
Greiner B, Eichelbaum M, Fritz P, Kreichgauer H-P, von Richter O, Zundler J, <strong><strong>an</strong>d</strong> Kroemer HK<br />
(1999) The role of intestinal P-glycoprotein in the interaction of digoxin <strong><strong>an</strong>d</strong> rifampin. J Clin<br />
Investig 104:147–153.<br />
Harrison LI <strong><strong>an</strong>d</strong> Gibaldi M (1976) Pharmacokinetics of digoxin in the rat. Drug Metab Dispos<br />
4:88–93.<br />
Ho NFH, Park JY, Ni PF, <strong><strong>an</strong>d</strong> Higuchi WI (1983) Adv<strong>an</strong>cing qu<strong>an</strong>titative <strong><strong>an</strong>d</strong> mech<strong>an</strong>istic<br />
approaches in interfacing gastrointestinal drug absorption studies in <strong>an</strong>imals <strong><strong>an</strong>d</strong> hum<strong>an</strong>s, in<br />
Animal Models for Oral Drug Delivery in M<strong>an</strong>: In Situ <strong><strong>an</strong>d</strong> In Vivo Approaches (Crouthamel<br />
W <strong><strong>an</strong>d</strong> Sarapu AC, eds) pp 27–106, Americ<strong>an</strong> Pharmceutical Association, Washington DC.<br />
Kim RB, Fromm MF, W<strong><strong>an</strong>d</strong>el C, Leake B, Wood AJJ, Roden DM, <strong><strong>an</strong>d</strong> Wilkinson GR (1998)<br />
The drug tr<strong>an</strong>sporter P-glycoprotein limits oral absorption <strong><strong>an</strong>d</strong> brain entry of HIV-1 protease<br />
inhibitors. J Clin Investig 101:289–294.<br />
Kliewer SA, Moore JT, Wade L, Staudinger JL, Watson MA, Jones SA, McKee DD, Oliver BB,<br />
Willson TM, Zetterstrom RH, et al. (1998) An orph<strong>an</strong> nuclear receptor activated by pregn<strong>an</strong>es<br />
defines a novel steroid signaling pathway. Cell 92:73–82.<br />
Kou JH, Fleisher D, <strong><strong>an</strong>d</strong> Amidon GL (1991) Calculation of the aqueous diffusion layer resist<strong>an</strong>ce<br />
for absorption in a tube: application to intestinal membr<strong>an</strong>e permeability determination. Pharm<br />
Res (NY) 8:298–305.<br />
Kurz H <strong><strong>an</strong>d</strong> Fichtl B (1983) Binding of drugs to tissues. Drug Metab Rev 14:467–510.<br />
Lewis LD <strong><strong>an</strong>d</strong> Fordtr<strong>an</strong> JS (1975) Effect of perfusion rate on absorption, surface area, unstirred<br />
water layer thickness, permeability, <strong><strong>an</strong>d</strong> intraluminal pressure in the rat ileum in vivo.<br />
Gastroenterology 68:1509–1516.<br />
Lin JH, Chiba M, <strong><strong>an</strong>d</strong> Baillie TA (1999) Is the role of the small intestine in first-pass metabolism<br />
overemphasized? Pharmacol Rev 51:135–157.<br />
Liu L, Mak E, Tirona RG, T<strong>an</strong> E, Novikoff PM, W<strong>an</strong>g P, Wolkoff AW, <strong><strong>an</strong>d</strong> P<strong>an</strong>g KS (2005)<br />
Vascular binding, blood flow, tr<strong>an</strong>sporter, <strong><strong>an</strong>d</strong> enzyme interactions on the processing of<br />
digoxin in rat liver. J Pharmacol Exp Ther 315:433–448.<br />
Lowry OH, Rosebrough NJ, Farr AL, <strong><strong>an</strong>d</strong> R<strong><strong>an</strong>d</strong>all RJ (1951) Protein measurement with the Folin<br />
phenol reagent. J Biol Chem 193:265–275.<br />
Mayer U, Wagenaar E, Beijnen JH, Smit JW, Meijer DKF, v<strong>an</strong> Asperen J, Borst P, <strong><strong>an</strong>d</strong> Schinkel<br />
AH (1996) Subst<strong>an</strong>tial excretion of digoxin via the intestinal mucosa <strong><strong>an</strong>d</strong> prevention of<br />
long-term digoxin accumulation in the brain by the mdr1a P-glycoprotein. Br J Pharmacol<br />
119:1038–1044.<br />
1479<br />
Mouly S <strong><strong>an</strong>d</strong> Paine MF (2003) P-glycoprotein increases from proximal to distal regions of hum<strong>an</strong><br />
small intestine. Pharm Res (NY) 20:1595–1599.<br />
Paine MF, Khalighi M, Fisher JM, Shen DD, Kunze KL, Marsh CL, Perkins JD, <strong><strong>an</strong>d</strong> Thummel<br />
KE (1997) Characterization of interintestinal <strong><strong>an</strong>d</strong> intraintestinal variations in hum<strong>an</strong> CYP3Adependent<br />
metabolism. J Pharmacol Exp Ther 283:1552–1562.<br />
P<strong>an</strong>g KS (2003) Modeling of intestinal drug absorption: roles of tr<strong>an</strong>sporters <strong><strong>an</strong>d</strong> metabolic<br />
enzymes (for the Gillette review series). Drug Metab Dispos 31:1507–1519.<br />
Sababi M, Borgå O, <strong><strong>an</strong>d</strong> Hultkvist-Bengtsson U (2001) The role of P-glycoprotein in limiting<br />
intestinal regional absorption of digoxin in rats. Eur J Pharm Sci 14:21–27.<br />
Salphati L <strong><strong>an</strong>d</strong> Benet LZ (1999) Metabolism of digoxin <strong><strong>an</strong>d</strong> digoxigenin digitoxosides in rat liver<br />
microsomes: involvement of cytochrome P4503A. Xenobiotica 29:171–185.<br />
Su S-F <strong><strong>an</strong>d</strong> Hu<strong>an</strong>g J-D (1996) Inhibition of the intestinal digoxin absorption <strong><strong>an</strong>d</strong> exsorption by<br />
quinidine. Drug Metab Dispos 24:142–147.<br />
Suzuki H <strong><strong>an</strong>d</strong> Sugiyama Y (2000) Role of metabolic enzymes <strong><strong>an</strong>d</strong> efflux tr<strong>an</strong>sporters in the<br />
absorption of drugs from the small intestine. Eur J Pharm Sci 12:3–12.<br />
Tam D, Tirona RG, <strong><strong>an</strong>d</strong> KS P<strong>an</strong>g (2003) Segmental intestinal tr<strong>an</strong>sporters <strong><strong>an</strong>d</strong> metabolic<br />
enzymes on intestinal drug absorption. Drug Metab Dispos 31:373–383.<br />
Thiebaut F, Tsuruo T, Hamada H, Gottesm<strong>an</strong> MM, Past<strong>an</strong> I, <strong><strong>an</strong>d</strong> Willingham MC (1987) Cellular<br />
localization of multidrug-resist<strong>an</strong>ce gene product P-glycoprotein in normal hum<strong>an</strong> tissues.<br />
Proc Natl Acad Sci USA 84:7735–7738.<br />
Traber PG, Gumucio DL, <strong><strong>an</strong>d</strong> W<strong>an</strong>g W (1991) Isolation of intestinal epithelial cells for the study<br />
of differential gene expression along the crypt-villus axis. Am J Physiol 260:G895–G903.<br />
Tsutsumi K, Li SK, Gh<strong>an</strong>em A-H, Ho NFH, <strong><strong>an</strong>d</strong> Higuchi WI (2003) A systematic examination<br />
of the in vitro Ussing chamber <strong><strong>an</strong>d</strong> the in situ single-pass perfusion model systems in rat ileum<br />
permeation of model solutes. J Pharm Sci 92:344–359.<br />
Watkins PB (1997) The barrier function of CYP3A4 <strong><strong>an</strong>d</strong> P-glycoprotein in the small bowel. Adv<br />
Drug Deliv Rev 27:161–170.<br />
Winne D (1979) Rat jejunum perfused in situ: effect of perfusion rate <strong><strong>an</strong>d</strong> intraluminal radius on<br />
absorption rate <strong><strong>an</strong>d</strong> effective unstirred layer thickness. Naunyn-Schmiedeberg’s Arch Pharmacol<br />
307:265–274.<br />
Wirth KE <strong><strong>an</strong>d</strong> Frölich JC (1974) Effect of spironolactone on excretion of 3 H-digoxin <strong><strong>an</strong>d</strong> its<br />
metabolites in rats. Eur J Pharmacol 29:43–51.<br />
Address correspondence to: Dr. K. S<strong><strong>an</strong>d</strong>y P<strong>an</strong>g, Faculty of Pharmacy, University<br />
of Toronto, 144 College Street, Toronto, Ontario, C<strong>an</strong>ada M5S 3M2.<br />
E-mail: ks.p<strong>an</strong>g@utoronto.ca<br />
Downloaded from<br />
dmd.aspetjournals.org by guest on February 25, 2013