Lafarge publication
Lafarge publication
Lafarge publication

You also want an ePaper? Increase the reach of your titles
YUMPU automatically turns print PDFs into web optimized ePapers that Google loves.
As filed with the Securities and Exchange Commission on March 26, 2004<br />
SECURITIES AND EXCHANGE COMMISSION<br />
Washington, D.C. 20549<br />
FORM 20-F<br />
x REGISTRATION STATEMENT PURSUANT TO SECTION 12(B) OR (G) OF THE SECURITIES<br />
EXCHANGE ACT OF 1934<br />
or<br />
x6 ANNUAL REPORT PURSUANT TO SECTION 13 OR 15(D) OF THE SECURITIES EXCHANGE<br />
ACT OF 1934<br />
for the fiscal year ended December 31, 2003<br />
or<br />
x TRANSITION REPORT PURSUANT TO SECTION 13 OR 15(D) OF THE SECURITIES EXCHANGE<br />
ACT OF 1934<br />
LAFARGE<br />
(Exact name of Registrant as specified in its charter)<br />
N/A France<br />
(Translation of Registrant’s (Jurisdiction of incorporation<br />
name into English) or organization)<br />
61, rue des Belles Feuilles, 75116 Paris, France<br />
(Address of principal executive offices)<br />
Securities registered or to be registered pursuant to Section 12(b) of the Act:<br />
Name of each exchange<br />
Title of each class: on which registered:<br />
American Depositary Shares,<br />
The New York Stock Exchange<br />
each representing one-fourth of an ordinary share,<br />
par value 4 euros per share.<br />
Ordinary Shares, par value 4 euros per share *<br />
* listed, not for trading or quotation purposes, but only in connection with the registration of the American<br />
Depositary Shares pursuant to the requirements of the Securities and Exchange Commission<br />
Securities registered or to be registered pursuant to Section 12(g) of the Act: None<br />
Securities for which there is a reporting obligation pursuant to Section 15(d) of the Act: None<br />
Indicate the number of outstanding shares of each of the issuer’s classes of capital or common stock as of the<br />
close of the period covered by the annual report:<br />
At December 31, 2003<br />
Ordinary Shares;;;;;;;;;;;;;;;;;;;;;;;;;;;; 167,217,813<br />
Indicate by check mark whether the registrant (1) has filed all reports required to be filed by Section 13 or<br />
15(d) of the Securities Exchange Act of 1934 during the preceding 12 months (or for such shorter period that the<br />
registrant was required to file such reports), and (2) has been subject to such filing requirements for the past 90<br />
days.<br />
Yes x6 No x<br />
Indicate by check mark which financial statement item the registrant has elected to follow:<br />
Item 17 x<br />
Item 18 x6
TABLE OF CONTENTS<br />
PART I<br />
ITEM 1. IDENTITY OF DIRECTORS, SENIOR MANAGEMENT AND ADVISERS* ;;; 5<br />
ITEM 2. OFFER STATISTICS AND EXPECTED TIMETABLE* ;;;;;;;;;;; 5<br />
ITEM 3. KEY INFORMATION ;;;;;;;;;;;;;;;;;;;;;;;;; 5<br />
ITEM 4. INFORMATION ON THE COMPANY;;;;;;;;;;;;;;;;;;; 14<br />
ITEM 5. OPERATING AND FINANCIAL REVIEW AND PROSPECTS ;;;;;;;; 62<br />
ITEM 6. DIRECTORS, SENIOR MANAGEMENT AND EMPLOYEES ;;;;;;;;; 102<br />
ITEM 7. MAJOR SHAREHOLDERS AND RELATED PARTY TRANSACTIONS ;;;; 122<br />
ITEM 8. FINANCIAL INFORMATION ;;;;;;;;;;;;;;;;;;;;;; 124<br />
ITEM 9. THE LISTING ;;;;;;;;;;;;;;;;;;;;;;;;;;;;; 125<br />
ITEM 10. ADDITIONAL INFORMATION ;;;;;;;;;;;;;;;;;;;;; 128<br />
ITEM 11. QUANTITATIVE AND QUALITATIVE DISCLOSURES ABOUT MARKET RISK 151<br />
ITEM 12. DESCRIPTION OF SECURITIES OTHER THAN EQUITY SECURITIES* ;;; 154<br />
PART II<br />
ITEM 13. DEFAULTS, DIVIDEND ARREARAGES AND DELINQUENCIES;;;;;;; 155<br />
ITEM 14. MATERIAL MODIFICATIONS TO THE RIGHTS OF SECURITY HOLDERS<br />
AND USE OF PROCEEDS ;;;;;;;;;;;;;;;;;;;;;;; 155<br />
ITEM 15. CONTROLS AND PROCEDURES ;;;;;;;;;;;;;;;;;;;; 155<br />
ITEM 16. [RESERVED] ;;;;;;;;;;;;;;;;;;;;;;;;;;;;; 155<br />
ITEM 16A. AUDIT COMMITTEE FINANCIAL EXPERT ;;;;;;;;;;;;;;;; 155<br />
ITEM 16B. CODE OF ETHICS ;;;;;;;;;;;;;;;;;;;;;;;;;;; 156<br />
ITEM 16C. PRINCIPAL ACCOUNTANT FEES AND SERVICES ;;;;;;;;;;;; 156<br />
ITEM 17. FINANCIAL STATEMENTS* ;;;;;;;;;;;;;;;;;;;;;; 157<br />
ITEM 18. FINANCIAL STATEMENTS ;;;;;;;;;;;;;;;;;;;;;;; 158<br />
ITEM 19. EXHIBITS ;;;;;;;;;;;;;;;;;;;;;;;;;;;;;; 159<br />
* Omitted because not applicable.<br />
3
PRESENTATION OF INFORMATION<br />
In this document, references to ‘‘United States’’, the U.S., U.S. or U.S.A. are to the United States of<br />
America, references to the ‘‘E.U.’’ are to the European Union and references to ‘‘tonnes’’ are to metric tonnes<br />
(1,000 kilograms or 2,204 pounds).<br />
For the convenience of the reader, this registration statement presents certain translations into U.S.<br />
dollars (‘‘U.S.$’’, ‘‘$’’ or ‘‘U.S. dollar’’) of amounts in euros at the December 31, 2003 Noon Buying Rate of<br />
1 euro = U.S.$1.2597. As of March 15, 2004, the Noon Buying Rate was 1 euro = U.S.$1.2243<br />
Various amounts and percentages set out in this document have been rounded and accordingly may not<br />
total.<br />
For a summary of differences between accounting principles we have adopted and U.S. generally<br />
accepted accounting principles (‘‘U.S. GAAP’’), see Note 31 to our consolidated financial statements included<br />
elsewhere in this registration statement.<br />
This registration statement contains certain forward-looking statements regarding prices and demand for<br />
the group’s products, the group’s financial results, the group’s plans for divestitures and geographic<br />
expansion and certain other matters. More generally, when used in this report, the words ‘‘aim(s),’’<br />
‘‘expect(s),’’ ‘‘intend(s),’’ ‘‘will,’’ ‘‘may,’’ ‘‘believe(s),’’ ‘‘anticipate(s)’’ and similar expressions are intended to<br />
identify forward-looking statements. Such statements are subject to certain risks and uncertainties that could<br />
cause actual results to differ materially from those projected. Readers are cautioned not to place undue<br />
reliance on these forward-looking statements, which speak only as of the date hereof. Specifically, statements<br />
herein regarding our future strategy, plans, products and process developments, facility expansion and<br />
improvements, synergies, acquisitions, partnerships and general business prospects are subject to uncertainty<br />
arising from numerous factors outside of our control, including market conditions, raw material prices,<br />
currency fluctuations, customer demand, the actions of competitors and regulators, technological<br />
developments and other factors. The forward-looking statements contained in this document speak only as of<br />
the date of this annual report and we do not intend, except as required by law, to update any forwardlooking<br />
statements set forth in this registration statement to reflect new information or subsequent events or<br />
circumstances.<br />
ENFORCEABILITY OF CIVIL LIABILITIES<br />
We are organized as a société anonyme under the laws of France. Almost all of our directors and<br />
officers, as well as certain of the experts named in this registration statement, are non-U.S. residents, and a<br />
substantial portion of our assets and the assets of our directors and officers and these experts are and will be<br />
located outside the United States. As a result, you may not be able to effect service of process within the<br />
United States upon these persons or to enforce, in U.S. courts, against these persons judgments of U.S. courts<br />
predicated upon any civil liability provisions of the U.S. federal or state securities laws. In addition, you may<br />
not be able to enforce certain civil liabilities predicated upon U.S. federal or state securities laws in France<br />
against us, our directors and officers, and the persons named in this prospectus. If an original action is<br />
brought in France, predicated solely upon the U.S. federal securities laws, French courts may not have the<br />
requisite jurisdiction to grant the remedies sought and actions for enforcement in France of judgments of U.S.<br />
courts, rendered against French persons referred to in the second sentence of this paragraph, would require<br />
such persons to waive their right under Article 15 of the French Civil Code to be sued in France only. We<br />
believe that none of these persons has waived this right with respect to actions predicated solely upon U.S.<br />
federal securities laws. In addition, actions in the United States under the U.S. federal securities laws could<br />
be affected under certain circumstances by the French law of July 16, 1980, which may preclude or restrict<br />
the obtaining of evidence in France or from French persons in connection with such actions.<br />
4
ITEM 1. IDENTITY OF DIRECTORS, SENIOR MANAGEMENT AND ADVISERS<br />
Not applicable.<br />
ITEM 2. OFFER STATISTICS AND EXPECTED TIMETABLE<br />
Not applicable.<br />
ITEM 3. KEY INFORMATION<br />
Selected Financial Data<br />
You should read the following selected consolidated financial data together with the section entitled<br />
‘‘Item 5. Operating and Financial Review and Prospects’’ and our consolidated financial statements.<br />
The table below sets forth summary selected consolidated financial data at and for each of the five years<br />
ended December 31, 2003, 2002, 2001, 2000 and 1999. The financial information presented in this summary<br />
is derived from our consolidated financial statements, which have been audited by Deloitte Touche Tohmatsu.<br />
The audited consolidated financial statements at December 31, 2003, 2002 and 2001 appear in Item 18 of this<br />
report.<br />
The consolidated financial statements and the notes thereto have been prepared in accordance with<br />
French GAAP, which differs from U.S. GAAP in certain significant respects. For a discussion of significant<br />
differences between U.S. GAAP and French GAAP as they relate to our consolidated financial statements and<br />
a reconciliation to U.S. GAAP of net income and shareholders’ equity, please refer to Notes 31 through 34 to<br />
our consolidated financial statements.<br />
As of January 1, 2002, the share of net income of equity affiliates determined in accordance with equity<br />
method consolidation principles is shown in the group consolidated statement of income on a specific line<br />
‘‘share of net income of equity affiliates’’. Prior to the adoption of this presentation, the company’s share of<br />
net income of equity affiliates was presented in the following line-items: ‘‘Operating income on ordinary<br />
activities’’, ‘‘Gains on disposals, net’’, ‘‘Other income (expenses), net’’, ‘‘Financial expenses, net’’ and<br />
‘‘Income tax’’. The presentation of the consolidated statements of income for 1999, 2000 and 2001 has been<br />
revised for comparative purposes in the table below.<br />
Beginning January 1, 2002, the historical cost of cement plant assets have been reclassified into specific<br />
cost categories based upon their distinct characteristics. Each cost category represents cement plant<br />
components with specific useful lives. This new definition was based on a detailed technical study performed<br />
by the company. Prior to January 1, 2002, cement plant assets had been depreciated over their estimated<br />
useful lives, using a broader definition of cost classification. The new system of classifying costs has been<br />
applied prospectively as of January 1, 2002. On average, for a new cement plant, this change in estimate has<br />
resulted in increasing the depreciable useful life from 20 years to 28 years, which more closely reflects actual<br />
experience with modern cement plants.<br />
<strong>Lafarge</strong>’s consolidated financial statements for 1998 were originally prepared in FRF and have been<br />
restated into euros at the rate of 1 euro = FRF 6.55957. These restated consolidated financial statements<br />
depict the same trends as the consolidated financial statements prepared using the French franc. The<br />
consolidated financial statements for 1998 will not be comparable to the financial statements of other<br />
companies that report in euro and have restated prior periods from currencies other than the French franc.<br />
Amounts in U.S.$ presented in the table below have been translated solely for the convenience of the reader<br />
using the Noon Buying Rate on December 31, 2003 at the rate of 1 euro = U.S.$1.2597.<br />
5
Year ended December 31<br />
2003 2003 2002 2001 (a) 2000 (a) 1999 (a)<br />
(in millions, except per share and share data)<br />
U.S.$ euro euro euro euro euro<br />
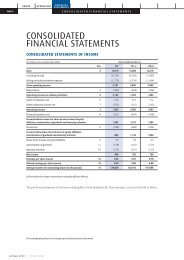
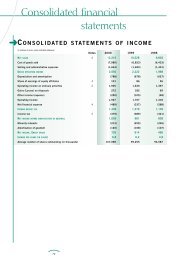
STATEMENTS OF INCOME<br />
French GAAP<br />
Sales ;;;;;;;;;;;;;; 17,205 13,658 14,610 13,698 12,216 10,528<br />
Operating income on ordinary activities 2,436 1,934 2,132 1,934 1,804 1,544<br />
Operating income ;;;;;;;;; 2,590 2,056 1,823 2,056 1,833 1,618<br />
Income before share of net income of<br />
equity affiliates, amortization of<br />
goodwill and minority interests ;; 1,339 1,063 854 1,144 1,009 930<br />
Share of net income of equity affiliates; 47 37 33 18 50 51<br />
Amortization of goodwill ;;;;;; (170) (135) (158) (142) (120) (108)<br />
Minority interests ;;;;;;;;; (299) (237) (273) (270) (213) (259)<br />
Net income ;;;;;;;;;;;; 917 728 456 750 726 614<br />
Earnings per share — basic ;;;;; 6.20 4.92 3.52 5.97 6.78 6.19<br />
Earnings per share — diluted;;;;;<br />
U.S. GAAP<br />
6.01 4.77 3.49 5.85 6.69 6.12<br />
Sales ;;;;;;;;;;;;;; 15,706 12,468 13,406 12,434 10,857 9,462<br />
Operating income ;;;;;;;;; 2,335 1,854 1,580 1,403 1,312 1,082<br />
Net income ;;;;;;;;;;;; 1,047 831 436 702 482 400<br />
Earnings per share — basic ;;;;; 7.13 5.66 3.36 5.57 4.43 3.90<br />
Earnings per share — diluted;;;;;<br />
BALANCE SHEETS<br />
French GAAP<br />
6.87 5.45 3.34 5.47 4.36 3.86<br />
Long-term assets ;;;;;;;;;; 23,995 19,048 21,168 23,562 15,454 13,270<br />
Current assets ;;;;;;;;;;; 7,290 5,787 5,471 6,340 5,443 4,966<br />
Total assets;;;;;;;;;;;; 31,285 24,835 26,639 29,902 20,897 18,236<br />
Shareholders’ equity ;;;;;;;; 10,311 8,185 6,981 7,882 6,043 5,851<br />
Long-term liabilities ;;;;;;;; 15,628 12,406 15,461 16,380 11,397 8,738<br />
Current liabilities ;;;;;;;;; 5,346 4,244 4,197 5,640 3,457 3,647<br />
Total shareholders’ equity and<br />
liabilities;;;;;;;;;;;;<br />
U.S. GAAP(b)<br />
31,285 24,835 26,639 29,902 20,897 18,236<br />
Current assets ;;;;;;;;;;; 6,616 5,252 5,096 5,817 4,735 4,527<br />
Long-term assets ;;;;;;;;;; 23,992 19,046 21,302 23,872 15,742 12,957<br />
Total assets;;;;;;;;;;;; 30,608 24,298 26,398 29,689 20,477 17,484<br />
Current liabilities ;;;;;;;;; 4,998 3,968 3,864 5,345 3,370 3,306<br />
Long-term liabilities ;;;;;;;; 13,563 10,767 14,204 14,332 9,474 7,608<br />
Minority Interests ;;;;;;;;; 2,599 2,063 1,936 2,201 1,324 1,228<br />
Shareholders’ equity ;;;;;;;;<br />
Total liabilities and shareholders’<br />
9,448 7,500 6,394 7,811 6,309 5,342<br />
equity ;;;;;;;;;;;;;<br />
STATEMENTS OF CASH FLOWS<br />
French GAAP<br />
30,608 24,298 26,398 29,689 20,477 17,484<br />
Net cash provided by operating activities 2,632 2,089 1,791 1,842 1,484 1,278<br />
Net cash used in investing activities ; (848) (673) (774) (4,679) (2,417) (1,602)<br />
Net cash (used in) provided by financing<br />
activities ;;;;;;;;;;;;<br />
Increase (decrease) in cash and cash<br />
(1,091) (866) (926) 2,310 1,602 331<br />
equivalents ;;;;;;;;;;;<br />
STATEMENTS OF CASH FLOWS<br />
U.S. GAAP<br />
693 550 91 (527) 669 7<br />
Net cash provided by operating activities 2,221 1,763 1,555 1,602 1,155 1,113<br />
Net cash used in investing activities ; (644) (511) (490) (3,927) (2,698) (974)<br />
Net cash (used in) provided by financing<br />
activities ;;;;;;;;;;;;<br />
Net effect of foreign currency translation<br />
(976) (775) (953) 2,372 1,517 (171)<br />
on cash and cash equivalents;;;;<br />
(Decrease) increase in cash and cash<br />
(100) (79) (170) (6) 10 79<br />
equivalents ;;;;;;;;;;; 501 398 (58) 41 (16) 47<br />
(a) Revised, where applicable, for the change in presentation of equity affiliates.<br />
(b) Certain reclassifications have been made to prior periods to conform the 2003 presentation.<br />
6
The following table indicates the dividend amount per share we paid for the years 2002, 2001, 2000 and<br />
1999. The table also discloses the dividend amount per share for 2003 proposed by our Board of Directors for<br />
approval at the annual general meeting of shareholders to be held on May 25, 2004. The table shows<br />
dividend amounts in euros, together with their U.S.$ equivalents translated for convenience at the<br />
December 31, 2003 Noon Buying Rate of 1 euro = U.S.$1.2597, for each of the years indicated. Shareholders<br />
who are U.S. residents should be aware that they will be subject to French withholding tax on dividends<br />
received. See ‘‘Item 10. Additional Information — Taxation’’. Dividends paid on fully paid-up shares that<br />
have been held by the same shareholders in registered form for at least two years are increased by 10% over<br />
dividends paid on other shares. The number of shares eligible to such increased dividend that can be held by<br />
one shareholder is limited to 0.5% of all outstanding shares, at the end of the fiscal year for which the<br />
dividend is paid. See ‘‘Item 10. Additional Information — Dividends’’.<br />
2003* 2002 2001 2000 1999<br />
euros U.S.$ euros U.S.$ euros U.S.$ euros U.S.$ euros U.S.$<br />
Total Dividend Payment (in millions) 383 482 303 382 297 374 273 344 215 271<br />
Base Dividend per Share 2.30 2.90 2.30 2.90 2.30 2.90 2.20 2.77 2.05 2.58<br />
Tax Credit on Base Dividend per<br />
Share 1.15 1.45 1.15 1.45 1.15 1.45 1.10 1.39 1.03 1.30<br />
Increased Dividend per Share 2.53 3.19 2.53 3.19 2.53 3.19 2.42 3.05 2.26 2.85<br />
Tax Credit on Increased Dividend Per<br />
Share 1.27 1.60 1.27 1.60 1.27 1.60 1.21 1.52 1.13 1.42<br />
* Proposed dividend.<br />
See also ‘‘Item 8. Financial Information — Dividend Policy’’.<br />
Exchange Rate Information<br />
We have published our financial statements in euros since 1999. The euro is the single European<br />
currency of the European Monetary Union (‘‘EMU’’). The EMU was established under the provisions of the<br />
Treaty on European Union signed at Maastricht in early 1992. On May 3, 1998, European governments and<br />
central banks announced that the following 11 Member States would participate in the last stage of EMU:<br />
Austria, Belgium, Finland, France, Germany, Ireland, Italy, Luxembourg, the Netherlands, Portugal and Spain.<br />
On January 1, 2001, Greece became a member of the EMU. The last stage of EMU, with fixed exchange<br />
rates between national currencies and the European Currency Unit and the introduction of the euro for certain<br />
purposes, began on January 1, 1999, at which time the exchange rate between the FRF and the euro was<br />
established at FRF 6.55957 to 1.00 euro (or 0.1524 euro to FRF 1.00). Since January 1, 2002, euro banknotes<br />
and coins have been in circulation within the countries of the EMU. Outstanding obligations denominated in<br />
national currencies are required to be converted at the legal rates established on January 1, 1999 (unless<br />
specific contracts provide for an alternative conversion rate).<br />
The following table sets forth, for the periods and dates indicated, certain information concerning the<br />
Noon Buying Rate in New York City for cable transfers for foreign currencies as certified for customs<br />
purposes by the Federal Reserve Bank of New York expressed in U.S.$ per 1.00 euro. Such rates are<br />
provided solely for the convenience of the reader and are not necessarily the rates we used in the preparation<br />
of our consolidated financial statements included elsewhere in this registration statement. No representation is<br />
made that the euro could have been, or could be, converted into U.S.$ at the rates indicated below or at any<br />
other rate. As of March 15, 2004, the Noon Buying Rate was 1.00 euro = U.S.$1.2243.<br />
7
Year/Month/<br />
Period<br />
Closing Rate<br />
U.S.$ per 1.00 euro<br />
Average<br />
Rate(1) High Low<br />
1999 ;;;;;;;;;;;;;;;;;;;;;; 1.01 1.06 1.18 1.00<br />
2000 ;;;;;;;;;;;;;;;;;;;;;; 0.94 0.92 1.03 0.83<br />
2001 ;;;;;;;;;;;;;;;;;;;;;; 0.89 0.89 0.95 0.84<br />
2002 ;;;;;;;;;;;;;;;;;;;;;; 1.05 0.95 1.05 0.86<br />
2003 ;;;;;;;;;;;;;;;;;;;;;;; 1.26 1,13 1.17 1.08<br />
2003 (September) ;;;;;;;;;;;;;;;;; 1.17 1,13 1.17 1.08<br />
2003 (October) ;;;;;;;;;;;;;;;;;; 1.16 1.17 1.18 1.16<br />
2003 (November) ;;;;;;;;;;;;;;;;; 1.20 1.17 1.20 1.14<br />
2003 (December) ;;;;;;;;;;;;;;;;; 1.26 1.23 1.26 1.20<br />
2004 (January) ;;;;;;;;;;;;;;;;;; 1.25 1.26 1.29 1.24<br />
2004 (February) ;;;;;;;;;;;;;;;;;; 1.24 1.26 1.28 1.24<br />
(1) In the case of a year or partial year, the average of the Noon Buying Rates on the last business day of<br />
each month during such year or partial year; in the case of a month or partial month, the average of the<br />
Noon Buying Rates on the business days occurring during such month or partial month.<br />
Risk Factors<br />
Our results are dependent on the level of activity in the construction sector. The construction sector<br />
tends to be cyclical.<br />
In each of our operating divisions our business activity is dependent on the level of activity in the<br />
construction sector in each of the geographic markets in which we operate. The construction industry in a<br />
given geographic market tends to be cyclical, especially in mature economies, and dependent on the level of<br />
residential and commercial construction and the level of infrastructure spending. The construction industry is<br />
sensitive to factors such as interest rates, and a downturn in economic activity in a particular economy may<br />
lead to a recession in the construction industry. In addition, the level of construction activity can fall even if<br />
the economy in general is growing. While we believe that our geographical diversification is the best way to<br />
ensure stability of returns, our results of operations and profitability could be adversely affected by a<br />
downturn in construction activity on a global scale or in a significant market in which we operate.<br />
Demand for our products is seasonal because climatic conditions affect the level of activity in the<br />
construction sector. Abnormal climatic conditions can adversely affect our results.<br />
Adverse climatic conditions, such as cold weather, snow and heavy or sustained rainfall generally affect<br />
the level of construction activity and result in a reduction in demand for our products. Thus, demand for our<br />
cement, aggregate and concrete and roofing products is seasonal (and in North America for gypsum) and<br />
tends to be lower in the winter months in temperate countries and in the rainy season in tropical countries.<br />
We usually experience a reduction in sales during the first quarter reflecting the effect of the winter season in<br />
our principal markets in Western Europe and North America and an increase in sales in the second and third<br />
quarters reflecting the effect of the summer season.<br />
If these adverse climatic conditions present unusual intensity, occur at abnormal periods or last longer<br />
than usual in major geographic markets, especially during peak construction periods, this could have a<br />
material adverse effect on our results of operations and profitability.<br />
We operate in competitive markets, which could adversely affect our results of operations and<br />
profitability.<br />
The competitive environment in which we operate can be significantly affected by regional factors, such<br />
as the number of competitors and production capacity in the regional market, the proximity of natural<br />
resources to the regional market and economic conditions and product demand in the regional market. In<br />
addition, the pricing policies of competitors and the entry of new competitors into the regional markets in<br />
8
which we operate can have an adverse effect on demand for our products and on our results of operations and<br />
profitability.<br />
Our growth strategy exposes us to risks in emerging markets.<br />
We classify all countries outside of our Western Europe and North America geographic sectors, with the<br />
exception of Japan, Australia and New Zealand, as emerging markets. In 2003, we generated approximately<br />
28.9% of our revenues in emerging markets. The emerging markets in which we operate, in order of revenues<br />
generated in 2003, include Malaysia, Nigeria, Poland, South Korea, Brazil, Chile, India, South Africa, Jordan,<br />
Romania, the Philippines, Morocco, Turkey, China, Cameroon, the Czech Republic, Kenya, Indonesia,<br />
Venezuela, Russia, Serbia, Honduras, Uganda, Slovenia, Egypt, Sri Lanka, Mexico, Algeria, Zambia,<br />
Hungary, Ukraine, Yemen, Mauritius, Thailand, Tanzania, Malawi, Slovakia, Benin and Croatia. We believe<br />
that growth in the construction sector in emerging markets will substantially exceed growth in developed<br />
countries. We have steadily increased our presence in emerging economies and expect to continue to generate<br />
an increasing portion of our revenues in emerging markets.<br />
Our expansion in emerging markets exposes us to risks which we do not face in North America or<br />
Western Europe. In many of these markets, the legal system is less certain than the systems in North America<br />
and Western Europe and in purchasing companies we can become exposed to risks with regard to the<br />
enforceability of our acquisition contracts and the presence of liabilities, such as liens and mortgages, which<br />
are not recorded in the public records. In addition, in some countries, particularly in the former U.S.S.R. and<br />
its former satellite countries, the establishment of accounts compatible with generally accepted accounting<br />
practices in developed countries may take time.<br />
Once we have established ourselves in emerging markets we face additional risks. Emerging markets are<br />
more likely to suffer from high volatility in GDP and interest rates, which may negatively affect the level of<br />
construction activity and our results of operations in a given market. Emerging markets may also suffer from<br />
factors such as high inflation, unstable exchange rates and interest rates, which may negatively affect the<br />
financial results of our operating subsidiaries in a given market as reported in euros. Instability in an<br />
emerging market can lead to restrictions on currency movements which may adversely affect our emerging<br />
market operating subsidiaries’ ability to pay dividends and restrictions on imports of raw materials and<br />
machinery, which may adversely affect our emerging market operating subsidiaries’ ongoing maintenance and<br />
capital expenditure programs.<br />
Recent examples of problems in the past few years include the political, economic and financial crisis in<br />
Venezuela, high volatility in GDP in many emerging Asian countries, such as Indonesia and the Philippines,<br />
extremely high inflation rates in Turkey and unstable exchange rates with respect to the Brazilian real,<br />
Venezuelan bolivar, Egyptian pound and Turkish lira. Other risks presented by emerging markets include civil<br />
disturbances, nationalization and expropriation of private assets, the imposition of taxes or other payments by<br />
foreign governments or agencies and other adverse actions or restrictions imposed by foreign governments.<br />
Any one of these developments in an emerging market in which we have a significant presence could<br />
result in lower profits and/or a loss in value of our assets. This could lead to a reduction in dividends and<br />
also adversely affect our stock price. There can be no assurance that our financial condition and results of<br />
operations will not also be materially adversely affected in other ways through our exposure to emerging<br />
markets.<br />
Our acquisition strategy may be unsuccessful due to an inability to identify suitable acquisition targets<br />
and to integrate acquired companies into our business, which could have a material adverse effect on<br />
our business, financial condition, results of operations and cash flows.<br />
We plan to continue making selective acquisitions to strengthen and develop our existing activities. The<br />
successful implementation of our acquisition strategy depends on a range of factors, including our ability to:<br />
s identify appropriate opportunities;<br />
s complete acquisitions at an appropriate cost; and<br />
9
s achieve an acceptable rate of return from our acquisitions, including past acquisitions.<br />
There may also be substantial challenges or delays in integrating and adding value to the businesses we<br />
acquire. In addition, the costs of integration, which are not presently capable of being estimated, could be<br />
material and the projected synergies resulting from such acquisitions may not be realized. Material costs or<br />
delays in connection with the integration of the operations that we acquire or the inability to realize synergies<br />
from those acquisitions could have a material adverse effect on our business, financial condition and results<br />
of operations.<br />
Our share price may react negatively to future acquisitions and investments.<br />
As part of our business strategy, we intend to continue to acquire or make strategic investments in<br />
additional companies to complement and expand our activities and accelerate our growth. Announcements<br />
concerning potential acquisitions and investments could be made at any time. We may pay for part of these<br />
acquisitions and investments with our shares. These acquisitions and investments, if they occur, may have a<br />
dilutive effect for existing shareholders and, whether they are paid for in cash or shares, may cause our share<br />
price to fall.<br />
We do not have a controlling interest in certain of the businesses in which we have invested and in the<br />
future we may invest in businesses in which we will not have a controlling interest. In addition, we are<br />
subject to restrictions due to minority interests in certain of our consolidated subsidiaries.<br />
In certain of our operations, we have a significant but not controlling interest. Under the governing<br />
documents for certain of these partnerships and corporations, certain key matters such as the approval of<br />
business plans and decisions as to the timing and amount of cash distributions may require the consent of our<br />
partners or may be approved without our consent. These limitations could make it difficult for us to pursue<br />
corporate objectives in the future.<br />
We conduct our business through subsidiaries. In some cases, minority shareholders hold significant<br />
interests in our subsidiaries. Various disadvantages may result from the participation of minority shareholders<br />
whose interests may not always coincide with ours. The presence of minority interests may, among other<br />
things, impede our ability to implement organizational efficiencies and transfer cash and assets from one<br />
subsidiary to another in order to allocate assets most effectively.<br />
Changes in exchange rates could have a material adverse effect on our financial condition and results of<br />
operations.<br />
In the year ended December 31, 2003, approximately 67% of our revenues were earned in currencies<br />
other than the euro and a significant portion of our revenues were denominated in U.S.$. In addition, 68% of<br />
our assets are located outside the European states participating to the European Monetary Union.<br />
Since our results are reported in euros, exchange rate movements may affect our reported profits, assets,<br />
equity and indebtedness. This effect may be positive or negative depending on the nature of the actual<br />
exchange rate movement and the nature of any currency hedging instruments that we have put in place.<br />
Fluctuations in exchange rates could have a material adverse effect on our financial condition and results of<br />
operations. As an example, the appreciation of the euros against the majority of other currencies in 2003 had<br />
a significant impact on our results of operations, see ‘‘Item 5. Operating and financial review and prospects’’.<br />
Increases in our leverage and level of indebtedness could have a material adverse effect on our<br />
operating and financial flexibility.<br />
We have entered into a number of debt agreements, which we have used to finance the ongoing planned<br />
capital expenditures of our activities and for our acquisition strategy, including in connection with the<br />
acquisition of Blue Circle Industries plc (‘‘Blue Circle’’) (see ‘‘Item 5. Operating and Financial Review and<br />
Prospects — Liquidity and Capital Resources’’). At December 31, 2003, we had, on a consolidated basis, debt<br />
of 8,695 million euros, shareholders equity of 8,185 million euros and net cash provided by operating<br />
activities of 2,089 million euros for the year ended December 31, 2003. Interest expense on our debt for the<br />
10
year ended December 31, 2003 amounted to about 518 million euros (excluding 7 million euros of capitalized<br />
interest for construction projects) and represented approximately 25% of our net cash provided by operating<br />
activities during the year.<br />
Our total indebtedness has significantly decreased as at December 31, 2003 compared to December 31,<br />
2002, as a result of actions taken to improve our financial flexibility. However to the extent our total<br />
indebtedness materially increases, the possible negative consequences would include:<br />
s Higher debt-service costs that adversely affect our results of operations;<br />
s Allocations of increasing amounts of cash flow for debt service;<br />
s Possible increased costs of future financing;<br />
s Reduction of any credit ratings issued by rating agencies in respect of our debt;<br />
s Higher exposure to interest and exchange rate fluctuations;<br />
s Restrictions on our capital resources and/or operations imposed by lenders; and<br />
s Reduced flexibility to take advantage of, or pursue, other business opportunities.<br />
In the past, some of our debt agreements have contained and in the future they may contain financial,<br />
operating and other obligations that limit our operating and financial flexibility. Our ability to comply with<br />
these obligations depends on the future performance of our businesses. There can be no assurances that the<br />
obligations under our debt agreements will not materially adversely affect our ability to finance our future<br />
operations, or that they will not prevent us from engaging in other business activities that may be in our best<br />
interest.<br />
At December 31, 2003, certain of our subsidiaries had financing contracts with provisions requiring on<br />
going compliance with financial covenants. These subsidiaries are located in the United States, Great Britain,<br />
India, Malaysia, the Philippines, Poland and South Africa and the debt associated with such covenants<br />
represented approximately 6% of the group’s total outstanding indebtedness. Based on the fact that these<br />
financing contracts are at the level of our different subsidiaries and on the quality of our liquidity protection<br />
through our access to committed credit facilities, we believe that such covenants are unlikely to be triggered<br />
and therefore do not expect them to have a material impact on the group’s financial situation.<br />
Our ability to pay dividends and repay debt depends on our ability to transfer income and dividends<br />
from our subsidiaries.<br />
<strong>Lafarge</strong> S.A. is a holding company with no significant assets other than the shares of our wholly owned<br />
and non-wholly-owned subsidiaries. In addition, we have a certain number of our subsidiaries located in<br />
countries that have had in the recent past, or may have in the future, regulations restricting the payment of<br />
dividends outside of the country as a result of exchange control regulations. These subsidiaries represented<br />
less than 5% of our revenues in 2002 and 2001. While, as of the date of this document, we have not<br />
identified any subsidiaries as operating in countries we believe present a legal risk for repatriation of<br />
dividends, there is no assurance that such risk may not exist again in the future. In addition, the dividend<br />
payments or other transfers made by our subsidiaries to us may also be limited by the subsidiaries’ debt<br />
agreements or be subject to various contractual and tax constraints in the countries in which they operate<br />
which could make such payments difficult or costly.<br />
If as a result of these restrictions we are unable to ensure the continued transfer of dividends and other<br />
income to us from these subsidiaries, this will impair our ability to pay dividends and make debt payments.<br />
Increases in energy and fuel costs could have a material adverse effect on our results of operations and<br />
profitability.<br />
Energy is a significant cost factor in most of our operations. We protect ourselves, to a certain extent,<br />
against the risk of energy price inflation through the ability of many of our cement plants to switch fuel<br />
sources, the use of alternative fuels, such as sump oil or tire recycling, in some of our cement plants and<br />
11
through the use of long-term supply contracts for certain of our energy needs. For example, from time to<br />
time, we contract for electricity and gas using forward contracts. Despite these measures, increases or<br />
significant fluctuations in energy and fuel costs could have a material adverse effect on our results of<br />
operations and profitability. See subsection of Item 4 entitled ‘‘Information on the Company — Cement —<br />
General Information Regarding Our Products, Industry and Markets — What Are the Costs of Manufacturing<br />
Cement?’’ and ‘‘Item 11. Quantitative and Qualitative Disclosures about Market Risk’’.<br />
We are dependent on third-party suppliers for some raw materials used in our manufacturing processes<br />
and changes in the quantity or conditions for obtaining these raw materials could increase our costs,<br />
which may adversely affect our financial performance.<br />
Although we maintain our own reserves of limestone, gypsum, aggregates and other materials used in<br />
our manufacturing operations, we have increasingly turned to synthetic alternatives generated as by-products<br />
of other industrial processes such as synthetic gypsum and slag and fly ash which we obtain from third-party<br />
suppliers. We generally secure our supply of these materials through long-term contracts most of which are<br />
renewable; however, in certain cases, legal constraints require us to contract over shorter periods. Should our<br />
existing suppliers cease operations or stop producing these by-products, we may be obliged to secure these<br />
materials at higher costs, which could adversely affect our profitability.<br />
We face substantial market competition in the United States for our gypsum products, which may<br />
adversely affect our results in this market.<br />
We estimate that North America, led by the United States, accounts for approximately half of the<br />
world’s demand for gypsum wallboard products. Excluding the Wilmington plant idled in November 2002,<br />
we currently have five operational gypsum wallboard plants in North America. The U.S. gypsum wallboard<br />
industry is highly competitive and has experienced overcapacity in recent years. Historically, the industry has<br />
experienced significant price volatility. We believe our strategy of building low-cost plants using synthetic<br />
gypsum will place us in a strong position once the industry recovers. However, in the short-term, we may<br />
again experience losses in our North American gypsum operations due to low price levels, lower market<br />
volumes and higher energy costs.<br />
Changes in government policy or legislation, notably regarding zoning and the environment, could have<br />
a material adverse effect on our business, financial condition and results of operations.<br />
Our performance is affected significantly by national and/or local government policy and legislation in<br />
the regions and territories in which we have operations.<br />
Many products manufactured by our operating units are subject to government regulation in various<br />
jurisdictions regarding their production and sale and our operating units are subject to extensive regulation by<br />
national and local agencies concerning such matters as zoning and environmental compliance. In addition,<br />
numerous governmental permits and approvals are required for our operations. We believe that our operating<br />
units are currently operating in substantial compliance with, or under approved variances from, various<br />
national and local regulations in all applicable jurisdictions. In the past, our subsidiaries have made significant<br />
capital and maintenance expenditures to comply with zoning, water, air and solid and hazardous waste<br />
regulations and may be required to do so in the future.<br />
In addition, national governments’ policies with regard to the development of public infrastructure and<br />
housing have a significant effect on demand for our products and, as a result, our profitability. Delays in the<br />
implementation of infrastructure and housing projects, due to budgetary constraints or problems with<br />
implementation of projects, could have a material adverse effect on our business, financial condition and<br />
results of operations.<br />
Changes in governmental regulations could increase our operating costs and could have a material<br />
adverse effect on our business, financial condition and results of operations. For example, the European Union<br />
recently passed a directive implementing the Kyoto Protocol on climate change that may affect our operations<br />
in Western Europe (see ‘‘Item 4. Information on the Company — Environment’’).<br />
12
Because we are a French company subject to French law, the rights of our shareholders may differ<br />
from the rights of shareholders in companies incorporated in the United States and you may not be<br />
able to enforce or may have difficulty enforcing rights predicated on U.S. Federal or state securities<br />
laws.<br />
The corporate affairs of <strong>Lafarge</strong> S.A. are governed by our by-laws (statuts) and by the laws governing<br />
corporations incorporated in France. Your rights as a shareholder and the responsibilities of members of our<br />
Board of Directors are governed by French law and are not the same as such rights and responsibilities in a<br />
corporation incorporated in the United States. Therefore, you may have more difficulty in protecting your<br />
interests in the face of actions by our management, members of our Board of Directors or our controlling<br />
shareholders than you would have if we were incorporated in the United States. In addition, since almost all<br />
of our directors and officers and a substantial portion of our assets are located outside the United States, it<br />
may be difficult for you to effect service upon us within the United States, or to enforce, in U.S. or in foreign<br />
courts, certain civil liabilities predicated upon U.S. Federal or state securities laws. For more information, see<br />
section entitled ‘‘Enforceability of Civil Liabilities’’ above.<br />
The price of our ADSs and the U.S. dollar value of any dividends will be affected by fluctuations in the<br />
U.S. dollar/euro exchange rate.<br />
The ADSs trade in U.S. dollars. As the principal trading market for the shares underlying the ADSs is<br />
the Premier Marché of Euronext Paris, where the shares trade in euro, the value of the ADSs will likely<br />
fluctuate as the U.S. dollar/euro exchange rate fluctuates. If the value of the euro decreases against the U.S.<br />
dollar, the price at which our ADSs trade will decrease. In addition, since any dividends that we may declare<br />
will be denominated in euro, exchange rate fluctuations will affect the U.S. dollar equivalent of dividends<br />
received by holders of ADSs. See ‘‘ — Exchange Rate Information’’, above. If the value of the euro<br />
decreases against the U.S. dollar, the value of the U.S. dollar equivalent of any dividend will decrease<br />
comparatively.<br />
You may not be able to exercise preemptive rights for shares underlying your ADSs.<br />
Under French law, shareholders have preemptive rights (‘‘droits préférentiels de souscription’’) to<br />
subscribe for cash for issuances of new shares or other securities giving rights, directly or indirectly, to<br />
acquire additional shares on a pro rata basis. Shareholders may waive their preemptive rights specifically in<br />
respect of any offering, either individually or collectively, at an extraordinary general meeting. Preemptive<br />
rights, if not previously waived, are transferable during the subscription period relating to a particular offering<br />
of shares and may be quoted on the Premier Marché. U.S. holders of ADSs may not be able to exercise<br />
preemptive rights for the shares underlying their ADSs unless a registration statement under the U.S.<br />
Securities Act of 1933, as amended, is effective with respect to such rights or an exemption from the<br />
registration requirements thereunder is available. We intend to evaluate at the time of any rights offering the<br />
costs and potential liabilities associated with any such registration statement, as well as the indirect benefits<br />
of enabling the exercise by the holders of ADSs of the preemptive rights associated with the shares<br />
underlying their ADSs, and any other factors we consider appropriate at the time, and then to make a<br />
decision as to whether to file such a registration statement. We cannot guarantee that any registration<br />
statement would be filed, or, if filed, that it would be declared effective. If preemptive rights cannot be<br />
exercised by an ADS holder, JPMorgan Chase Bank, as depositary, will, if possible, sell such holder’s<br />
preemptive rights and distribute the net proceeds of the sale to the holder. If the depositary determines, in its<br />
discretion, that such rights cannot be sold, the depositary may allow such rights to lapse. In either case, ADS<br />
holders’ interest in us will be diluted and, if the depositary allows rights to lapse, holders of ADSs will not<br />
realize any value from the granting of preemptive rights.<br />
13
Holders of ADSs may be subject to additional risks related to holding ADSs rather than shares.<br />
Because holders of ADSs do not hold their shares directly, they are subject to the following additional<br />
risks:<br />
s In the event of a dividend or other distribution, if exchange rates fluctuate during any period of time<br />
when the depositary cannot convert a foreign currency into dollars, the ADS holder may lose some or<br />
all of the value of the distribution. There can be no assurances that the depositary will be able to<br />
convert any currency at a specified exchange rate or sell any property, rights, shares or other securities<br />
at a specified price, nor that any of such transactions can be completed within a specified time period.<br />
s There can be no guarantee that ADS holders will receive voting materials in time to instruct the<br />
depositary to vote. It is possible that ADS holders, or persons who hold their ADSs through brokers,<br />
dealers or other third parties, will not have the opportunity to exercise a right to vote at all.<br />
s ADS holders may not receive copies of all reports from us or the depositary. You may have to go to<br />
the depositary’s offices to inspect any reports issued.<br />
s We and the depositary may amend or terminate the deposit agreement without ADS holders’ consent<br />
in a manner that could prejudice ADS holders.<br />
Government regulation and legal uncertainties could add additional costs to doing business on the<br />
Internet and adversely affect our e-commerce ventures.<br />
The application of existing laws to the Internet and Internet-related applications and services is being<br />
clarified and refined in France, the European Union, the United States and a number of other jurisdictions.<br />
New legislative and regulatory proposals applicable to the Internet are under consideration, including in the<br />
areas of data protection and privacy, content liability, e-commerce, encryption and electronic signatures.<br />
Depending on the scope and timing of these developments, it is possible that they could have a material<br />
adverse effect on our plans to establish e-commerce ventures.<br />
If third parties were able to penetrate the network security of any future e-commerce ventures or<br />
otherwise misappropriate our users’ personal information, we could be subject to liability. These could<br />
include claims for unauthorized purchases with credit card information, impersonation or other similar fraud<br />
claims. They could also include claims for violation of privacy rights and data protection rights. These claims<br />
could result in litigation.<br />
We must comply with applicable data protection legislation, including a European Union directive,<br />
which limits our ability to collect and use personal information relating to users of any future e-commerce<br />
and our other web sites. Increased awareness on the part of the public of privacy issues and changes to<br />
legislation with which we may have to comply could both limit our ability to use such personal information<br />
for the benefit of our business and more generally hinder public acceptance of the Internet as a marketplace.<br />
ITEM 4. INFORMATION ON THE COMPANY<br />
Overview<br />
We believe, based on our experience in this industry, we are the world leader in construction materials<br />
and one of France’s largest corporations in terms of sales. In the financial year 2003, under French GAAP,<br />
we achieved sales of 13.658 million euros and operating income on ordinary activities of 1,934 million euros<br />
and net income of 728 million euros, and at year end had total assets amounting to 24,835 million euros. We<br />
currently employ approximately 75,000 people in 75 countries. Our expertise in efficient industrial<br />
production, conservation of natural resources and respect for both society and the environment has been<br />
implemented around the world.<br />
Our operations are organized into four divisions, each of which holds a leading position in its respective<br />
market: Cement, Aggregates & Concrete, Roofing and Gypsum. We believe, based on our experience in these<br />
industries, that we are the largest cement producer worldwide, with annual sales of 6.4 billion euros and<br />
industrial operations in 43 countries. We believe that we are the world’s second largest producer of<br />
14
aggregates and ready mix concrete. In 2003, our Aggregates & Concrete division achieved annual sales of 4.5<br />
billion euros. We believe that our Roofing division is the world’s leading producer of concrete and clay<br />
roofing tiles with annual sales in 2003 of 1.5 billion euros, and that our Gypsum division is the third-largest<br />
manufacturer of gypsum wallboard worldwide with annual sales of 1.2 billion euros in 2003.<br />
We instituted our current operating structure in 1999, granting each of our divisions responsibility for<br />
strategy and performance management in its area of business, in the context of our strategic guidelines. The<br />
division-based organization allows greater decentralization and initiative, while maintaining overall coherence<br />
with respect to innovation, policy and product standards.<br />
Our shares have been traded on the Paris stock exchange since 1923 and are a component of the French<br />
CAC-40 market index since its creation. On March 1, 2004 our market capitalization (including our treasury<br />
shares) was 11.7 billion euros, representing approximately 1.8% of the market capitalization of the CAC-40<br />
index, according to Euronext Paris S.A. Our shares are also included in the SBF 250 index and the Dow<br />
Jones Eurostoxx 50 index.<br />
Corporate Information and History and Development of the Company<br />
We are a French limited liability company (société anonyme) governed by articles L.225-1 to L.225-270<br />
of the French commercial code. Our commercial name is ‘‘<strong>Lafarge</strong>’’. We were incorporated in 1884 under the<br />
name ‘‘J et A Pavin de <strong>Lafarge</strong>’’. Currently, our by-laws state that the duration of our company is until<br />
December 31, 2066, and may be amended to extend our corporate life. Our registered office is located at 61<br />
rue des Belles Feuilles, 75116 Paris, France. We are registered under the number ‘‘542 105 572 RCS Paris’’<br />
with the registrar of the Paris Commercial Court (Tribunal de Commerce de Paris).<br />
We originated in the first half of the nineteenth century in France as a lime exploitation enterprise<br />
founded by Auguste Pavin de <strong>Lafarge</strong>. We have been operating internationally since the 1860s, when we<br />
supplied lime for the building of the Suez Canal. By the eve of the First World War, we had grown to<br />
become France’s largest lime producer. From lime production, we expanded early into the production of<br />
cement and gradually grew in size through internal expansion and strategic acquisitions, primarily of small<br />
cement producers, to become France’s largest cement producer. Our international profile was raised in the<br />
1950s when we expanded into North America, first through a new plant in Richmond, British Columbia and<br />
then by the acquisition of a Canadian company, and when we commenced operations in Brazil. As a result of<br />
our acquisition in 1981 of General Portland Inc., we became one of the largest cement manufacturers in<br />
North America. Today, our North American operations are conducted through our 53.1% owned subsidiary,<br />
<strong>Lafarge</strong> North America, a New York Stock Exchange listed company. During the 1970s and 1980s, we<br />
concentrated on expanding in Europe to take advantage of the construction of a single market with more than<br />
300 million inhabitants. We first turned to Germany, raising our stake in Portland Zementwerk at Wössingen.<br />
Through the purchase of the Swiss company, Cementia, in 1989, we acquired interests in Asland (Spain),<br />
Perlmooser (Austria) and Bamburi (Kenya). We then turned to Eastern Europe, signing an agreement with<br />
Karsdorfer Zement, the largest cement producer in the new East German states, which we subsequently<br />
purchased. We then expanded our presence in the Czech Republic by investing in the cement company<br />
Cizkovicke Cementarna. We then expanded into Poland, Romania and the Commonwealth of Independent<br />
States. We have since made a number of acquisitions in emerging countries with high growth potential, such<br />
as China, the Philippines, India, South Korea, Egypt, Jordan, South Africa and Honduras, and, in 2003, 46.0%<br />
of our cement sales came from emerging markets. We classify all countries outside of our Western Europe<br />
and North America geographic sectors, with the exception of Japan, Australia and New Zealand, as emerging<br />
markets.<br />
While expanding our cement operations internationally, we have broadened our other longstanding<br />
product lines, aggregates (sand, gravel, calcareous and igneous materials), concrete and gypsum. The<br />
development of the Aggregates & Concrete business progressed significantly in 1997 with the acquisition of<br />
Redland plc (‘‘Redland’’) for 1.8 billion British Pounds (which amounted to 2.7 billion euros at the then<br />
current French franc exchange rate). Our Aggregates & Concrete business expanded in France and North<br />
America and resulted in our first major position in building materials in the United Kingdom. Furthermore,<br />
this acquisition brought us a new business that now forms the Roofing division, with its leadership position in<br />
15
oofing products, particularly in Europe. At the end of 1999, we took the additional step of acquiring the<br />
minority interests in <strong>Lafarge</strong> Roofing (then <strong>Lafarge</strong> Braas) for 5.7 million of our shares and a cash payment<br />
of 81 million euros. Recently this activity has expanded into emerging markets. We first entered the gypsum<br />
business in the 1930s through powdered plaster. The principal product of our Gypsum division is now<br />
wallboard and we have expanded our operations into the North American market and also into emerging<br />
countries namely in Eastern Europe and in Asia.<br />
In 2000, we agreed to sell to three investment funds a majority interest in all the businesses in our<br />
former Specialty Products division, with the exception of the Road Marking Business, the European<br />
operations of which were sold to the Burelle group in November 2000, and the Lime Business, of which the<br />
largest part is a 40% equity interest in Carmeuse North America. The transaction was completed on<br />
January 22, 2001. We initially retained 33.36% of the capital of the new company, called Materis, which was<br />
formed to include our former operations in admixtures, aluminates, mortars, paints and refractories. In<br />
September 2003, the three investment funds decided to sell their stake in Materis to an unrelated investment<br />
fund, LBO France. As part of this transaction, we also agreed to sell our stake in Materis to LBO France and<br />
at the same time to invest 20 million euros from the proceeds of the sale (that amounted to 210 million euros<br />
including license fees) in the newly created company, for a 7.27% equity interest. This further disposal has<br />
allowed us to realize significant capital gains. We continue to have certain cooperation agreements in research<br />
and development and commercial matters with the new company.<br />
In 2001 we acquired Blue Circle Industries plc, the sixth largest cement manufacturer in the world, and<br />
became the world’s largest cement manufacturer when we completed a recommended tender offer for the<br />
77.4% of the shares of Blue Circle that we did not already own at a price of 495 pence per share in cash. We<br />
indeed had previously acquired, in 2000, 22.6% of the shares of Blue Circle. The total cost of the acquisition<br />
of Blue Circle amounted to 5,322 million euros excluding debt. For a more detailed explanation of our<br />
investment in Blue Circle and our allocation of the purchase price, please see Note 11(c) to our consolidated<br />
financial statements.<br />
We consolidated Blue Circle from July 11, 2001. The financing of the acquisition of Blue Circle was<br />
realized through a combination of new equity and additional debt. For a discussion of our current debt<br />
financing please see ‘‘Item 5. Operating and Financial Review and Prospects — Liquidity and Capital<br />
Resources’’. The acquisition of Blue Circle expanded the presence of our Cement division into the United<br />
Kingdom, Greece, Chile, Nigeria and Malaysia and added to the division’s existing presence in North<br />
America, Africa and the Philippines. In addition the former Blue Circle operations brought to our Aggregates<br />
& Concrete division significant operations in Georgia and Alabama in North America, as well as operations<br />
in Greece, Malaysia, Singapore and Chile.<br />
Our acquisitions amounted to 435 million euros in 2003 and essentially involved our expansion in China<br />
with the acquisition of Chongqing Cement and in Russia, with the acquisition of a 75% interest in a cement<br />
plant in the Urals with the acquisition of the wallboard business of Gyproc in Germany and Poland. We also<br />
increased our interest in our subsidiary, <strong>Lafarge</strong> Polska, by acquiring the EBRD’s 23% shareholding. In<br />
addition, we spent 536 million euros on the ongoing upgrading and modernization of our existing industrial<br />
plants and 213 million euros on new production facilities in Bangladesh, Mexico and Nigeria. Divestments of<br />
non strategic assets yielded 603 million euros and principally involved the interest in Materis, the stake in<br />
Tong Yang Cement Company and <strong>Lafarge</strong> Florida Inc.<br />
Management of Blue Circle assets in North America<br />
We have entered into an agreement with <strong>Lafarge</strong> North America Inc., our majority owned North<br />
American subsidiary, with respect to Blue Circle’s assets in North America. The agreement’s initial term<br />
expired on December 31, 2002, and has since been renewed annually. The agreement provides that <strong>Lafarge</strong><br />
North America will manage the Blue Circle assets for a fixed annual management fee plus incentives for<br />
improving operating results. <strong>Lafarge</strong> North America is also entitled to be reimbursed for the costs incurred on<br />
behalf of the Blue Circle operations in North America. In 2003, <strong>Lafarge</strong> North America charged<br />
U.S.$12 million (approximately 10.6 million euros) in management fees and U.S.$194.4 million<br />
(approximately 171.9 million euros) in cost reimbursement pursuant to the management agreement. In<br />
16
accordance with the terms of the agreement, <strong>Lafarge</strong> North America paid U.S.$4.9 million (approximately<br />
4.3 million euros) to Blue Circle North America as compensation for actions taken to optimize the<br />
profitability of the combined assets. We have granted <strong>Lafarge</strong> North America an option to purchase the Blue<br />
Circle assets anytime between July 1, 2002 and December 31, 2004 at a fixed call price of $1.4 billion,<br />
subject to certain adjustments, for items such as capital expenditures and divestments, between the signing of<br />
the agreement and the time of the exercise.<br />
The assets of Blue Circle covered under the management agreement include:<br />
s 5 cement manufacturing plants with a combined capacity of 5.7 million tonnes of cement;<br />
s 11 cement terminals;<br />
s 1 slag grinding plant outside Baltimore, Maryland;<br />
s 13 aggregate-producing pits and quarries in Georgia and Alabama;<br />
s 61 ready-mixed concrete plants; and<br />
s 10 concrete block plants in Georgia.<br />
Recent Developments<br />
Cement — Bangladesh: We announced in May 2003 the signing of a 50/50 joint venture agreement with<br />
Cementos Molins to build a new turnkey cement plant in Chhatak (Northern Bangladesh). Under this<br />
agreement, <strong>Lafarge</strong> and Cementos Molins together hold around 60% interest in <strong>Lafarge</strong> Surma Cement<br />
Limited. The remaining shares of <strong>Lafarge</strong> Surma Cement Limited are held by international financial<br />
institutions and local investors.<br />
Cement — North America: Our majority owned subsidiary <strong>Lafarge</strong> North America Inc. announced in<br />
July 2003 that it had signed a definitive agreement for the sale of its wholly-owned subsidiary <strong>Lafarge</strong><br />
Florida Inc. to Florida Rock Industries, Inc. The sales price was approximately 142 million euros. The<br />
transaction closed in the third quarter, 2003. The operations of <strong>Lafarge</strong> Florida Inc. consist primarily of two<br />
cement grinding and import facilities, one located in Tampa and the other in Port Manatee, Florida. Net sales<br />
in 2002 associated with these operations were approximately $89 million.<br />
Cement — Mexico: We announced in July 2003 our decision to build a new cement plant in Mexico<br />
close to our existing site in Hidalgo State, near Mexico City. This new plant will have an annual production<br />
capacity of 600,000 tonnes. It will replace the existing plant which has a capacity of 350,000 tonnes per year.<br />
By the time the plant starts operations in 2006, the total investment cost including the acquisition of<br />
additional land reserves is expected to amount to approximately $120 million.<br />
Cement — China: In June 2003, we acquired 71% of Chongqing Cement Cy for approximately<br />
$30 million. Chongqing Cement operates a cement plant with a capacity of 800,000 tonnes per year located<br />
in Chongqing, an autonomous city in South-Western China with a population of 30 million. In December<br />
2003, we announced our decision to build a second production line at our Chongqing cement plant to meet<br />
the very strong growth in the local cement market. This $40 million investment is expected to increase the<br />
plant’s existing cement capacity of 800,000 tonnes per year to close to two million tonnes.<br />
Cement — Common wealth of Independent States: In October 2003, we acquired a 75% equity interest in<br />
Uralcement, a company with a cement plant located in Korkino in the Urals (Russia), for approximately<br />
14 million euros. The capacity of the cement plant is 1.7 million tonnes.<br />
Cement — Poland: In November, 2003, we acquired the EBRD’s 23% shareholding in <strong>Lafarge</strong> Polska,<br />
which holds our Cement and Aggregates & Concrete operations in Poland. Following this transaction<br />
amounting to 84 million euros, we own 100% of <strong>Lafarge</strong> Polska.<br />
Cement — South Korea: In December 2003, our 39.9% owned subsidiary, <strong>Lafarge</strong> Halla Cement, sold its<br />
25% equity interest in the joint venture company Tong Yang Cement Co. Ltd., to Tong Yang Major, the<br />
Korean based cement company with whom we had initially formed the joint venture. The transaction price<br />
amounted to 123 million euros. In January 2004, we then increased our equity interest in <strong>Lafarge</strong> Halla<br />
17
Cement from 39.9% to 50.1% through the acquisition of 10.2% of the company’s shares from the State of<br />
Wisconsin Investment Board for approximately $71 million (approximately 56 million euros). The State of<br />
Wisconsin Investment Board remains a shareholder of <strong>Lafarge</strong> Halla Cement with a 19.9% interest. <strong>Lafarge</strong><br />
Halla Cement is the fourth-largest cement producer in South Korea, owns three industrial facilities and has an<br />
annual cement capacity of 7.5 million tonnes.<br />
Cement — Spain and Portugal: In December 2003, we signed an agreement for the sale of our 40.9%<br />
participation in Cementos Molins. The sale will take the form of a limited tender offer that Cementos Molins<br />
will launch for its own shares to take place in the first half of 2004 subject to approval from the Spanish<br />
regulatory authorities. The transaction is expected to amount to approximately 270 million euros. As part of<br />
the transaction, we have acquired the 2.64% stake held by Cementos Molins in Cimentos de Portugal SGPA<br />
(Cimpor) for approximately 70 million euros.<br />
Aggregates & Concrete — United Kingdom: In September 2003, our subsidiary <strong>Lafarge</strong> Aggregates<br />
Limited sold part of the assets of its concrete product business for approximately 18 million euros. The assets<br />
sold include one manufacturing plant in Barrow. Following this disposal <strong>Lafarge</strong> Aggregates Limited<br />
continues to manufacture concrete products out of its plants in Rugby, Kent and Sonning.<br />
Aggregates Concrete — France and Switzerland: In March 2004, we signed an agreement with the<br />
Haniel Group for the acquisition of Hupfer Holding, a major aggregates and ready-mix concrete producer<br />
located in the East and the Center of France and in Switzerland, for a price of 92 million euros, including<br />
debt of 23.5 million euros. The assets of Hupfer Holding include 9 quarries with an total annual capacity of<br />
4.7 million tonnes of aggregates and 7 ready-mix plants (with a total capacity of approximately 0.3 million<br />
m3). The agreement remains subject to approval from the competition authorities.<br />
Gypsum — South Africa: In February 2003, we entered the South African market through the acquisition<br />
of 40% of Macsteel Interior System (‘‘MIS’’). MIS is a leading producer and distributor of interior systems,<br />
including plasterboard systems. At the end of 2003, we exercised our option to acquire the remaining 60% of<br />
MIS which should be completed by the end of March 2004.<br />
Gypsum — Eastern and Central Europe: In February 2003, we completed the acquisition of the<br />
wallboard businesses of Gyproc in Germany and Poland for 42 million euros (net of cash acquired). The two<br />
acquired plants, located in Peitz and in Hartershofen in Germany, represent a combined ultimate capacity of<br />
53 million m 2 . Based on our estimates, this acquisition doubled our market share in Germany and increased<br />
significantly our market share in Poland.<br />
Gypsum — Western Europe: In January 2004, we purchased a 30% stake in the Clips group, a specialist<br />
in movable partitions and interior design elements. Clips operates throughout France, China and Germany.<br />
The brand is a leader on the modular partition market.<br />
Our Organizational Structure<br />
For details of our principal subsidiaries, including their full legal name and country of incorporation, see<br />
Note 32 to our consolidated financial statements.<br />
Our group comprises over 1,240 majority owned subsidiaries and approximately 230 companies in which<br />
we have an equity participation. The large number of subsidiaries is essentially due to the local nature of our<br />
business, our multiple installations in 75 countries and the organization of our activities into four divisions.<br />
The relations between <strong>Lafarge</strong> S.A., our group’s holding company, and our subsidiaries are rather typical<br />
and include a financial component and a services component.<br />
The financial component covers the repatriation of dividends from our subsidiaries and the financing by<br />
<strong>Lafarge</strong> S.A. of the activities of our subsidiaries. As at December 31, approximately 73% of the group’<br />
financial debt was carried by <strong>Lafarge</strong> S.A. who has access to short-term and long-term financial markets and<br />
to large banking networks. For this purpose, we use <strong>Lafarge</strong> S.A.’s Euro Medium Term Note program for<br />
medium to long-term financings and our Commercial Paper program for short-term financings. There are,<br />
however, a few exceptions to this general rule. When our subsidiaries operate in local currencies that cannot<br />
be obtained by <strong>Lafarge</strong> S.A., local financing is sought so as to ensure that local operations are financed in the<br />
18
elevant local currency. Another situation is when there are minority shareholders in our consolidated<br />
subsidiaries, such as our subsidiary, <strong>Lafarge</strong> North America, who has access to financial markets in North<br />
America and carries its own financings.<br />
We also promote the cash pooling by <strong>Lafarge</strong> S.A. of the cash generated within the group whenever it is<br />
possible to implement such arrangements. <strong>Lafarge</strong> S.A. is therefore in charge of the daily consolidation of the<br />
cash located in most of our subsidiaries located in the euro zone and the financing of their activities.<br />
The services component covers the provision by <strong>Lafarge</strong> S.A. of management support and technical<br />
assistance to our operating subsidiaries. <strong>Lafarge</strong> S.A. also licences its trademarks, patents and know-how to<br />
its subsidiaries. Technical assistance is provided through the Central Research Laboratory and the group’s<br />
different technical centers that are directly linked to <strong>Lafarge</strong> S.A. See the sections of this item entitled<br />
‘‘Research and Development’’ and ‘‘Intellectual Property’’ for a more detailed discussion of these aspects.<br />
On top of our listed subsidiaries of which part of the share capital is held by the public, certain majority<br />
owned subsidiaries have minority shareholders who can be industrial or financial partners, governmental<br />
entities, employees or shareholders of the subsidiary before its acquisition by the group. The presence of<br />
minority shareholders is sometimes imposed by local constraints (namely in case of a partial privatization) or<br />
is meant to share the business risk. The presence of minority shareholders often leads to the implementation<br />
of shareholder agreements that contain board membership or other similar provisions, shareholders’<br />
information rights and control provisions. Our subsidiaries that are subject to these shareholder agreements<br />
represent approximately 19% of our consolidated revenues. We do not currently experience any difficulties in<br />
the management of these subsidiaries vis-à-vis our partners which could present a risk to our financial<br />
structure.<br />
Finally, certain of our shareholder agreements contain exit provisions to the benefit of our minority<br />
shareholders that can be exercised at any time or at certain fixed times (See Note 27 to our consolidated<br />
financial statements) or in specific situations, namely in case of a continuing disagreement or change of<br />
control of the relevant subsidiary or the group. In particular, the shareholder agreements entered into in<br />
relation to our Cement business in Morocco and Egypt, our Gypsum business in Asia and our Roofing<br />
business in North America (the last two being our joint ventures with the Boral group) contain provisions that<br />
enable our partners to buy back our shareholding in these businesses in case of a change of control of<br />
<strong>Lafarge</strong> S.A.<br />
Our Strengths<br />
We have focused our business on construction materials. We believe we have established a reputation<br />
for excellence in each of our divisions by providing our customers with quality construction materials, backed<br />
by superior technical support. We have made a long-term commitment in each of our divisions to<br />
environmentally friendly solutions which we believe gives us a competitive advantage in an increasingly<br />
regulated world.<br />
In each of our four divisions, we have strived to create a global presence. We believe that because<br />
demand in our markets is closely related to the business cycle, particularly of the construction sector,<br />
geographical diversification is the best way to ensure the growth of returns. We believe that growth in the<br />
construction sector in emerging markets will substantially exceed growth in North America and Western<br />
European Countries and we have steadily increased our presence in emerging economies. In our Cement<br />
division, we already achieve almost half of our sales in emerging markets and our Gypsum and Roofing<br />
divisions achieved 20.7% and 15.8% of their respective sales in emerging markets. However, we have been<br />
selective in our expansion in emerging markets and, for example, in our Aggregates & Concrete division, our<br />
expansion has been restricted to geographic areas where, as a global company with a commitment to the<br />
environment and fair labor standards, we can still be competitive.<br />
We believe that our final customer, the construction industry, will continue to be a highly fragmented<br />
business with significant variations between local markets. Through our divisional and geographic structure,<br />
we have centralized the monitoring of performance while delegating decision making to our local business<br />
units. We have incentivized the pay of our local managers for over twenty years and we aim to tie their<br />
19
emuneration to their efficient use of the funds provided by our shareholders. Our key managers have had part<br />
of their performance-related pay tied to economic value added since January 1, 2000. We have also<br />
introduced group-wide programs in areas such as purchasing where we believe significant synergies can be<br />
obtained between our local operations.<br />
We believe that innovation is a key to the success of our business, and through our Central Laboratory<br />
in l’Isle d’Abeau, and our other technical centers worldwide, we have focused on developing new products<br />
for our divisions which range from new concretes such as our AgiliaÒ and DuctalÒ lines, which offer<br />
superior technical performance, to innovations such as our Big Tile dirt repellant surfaces and total roof<br />
systems like Monier CoolroofÔ in Malaysia, which are easier and quicker to install providing our customers<br />
with significant cost savings.<br />
Our Strategy<br />
We aim to be a global leader in each of our four businesses, through continuously emphasizing<br />
performance and cost efficiency, and by combining organic growth and external development. We believe<br />
that this is the best way to maximize value for our shareholders.<br />
Emphasizing Performance and Cost Efficiency<br />
We aim at excellence in performance through:<br />
s continuous improvement in purchasing and reduction of production costs;<br />
s adaptation of our management practices and assets to local market conditions;<br />
s focus on practical research and development which is systematically transformed into new products<br />
and processes;<br />
s reinforcement of our relationships with our customers through a renewed focus on marketing and<br />
developing e-business solutions; and<br />
s involvement of our employees at all levels of the organization.<br />
Combining Organic Growth and External Development<br />
The markets for many of our products in the developed countries of Western Europe and North America<br />
are mature, while in emerging markets we are in a growth industry, even in such basic products as cement. In<br />
developed countries, certain building materials are still experiencing substantial growth rates through product<br />
substitution, such as wallboard in Europe. Hence, our strategy for organic growth is to emphasize both<br />
emerging countries and product diversification.<br />
In addition to organic growth, we have been able to implement a steady program of acquisitions which<br />
have brought us additional growth. We have focused our external development on countries where we already<br />
have a significant presence and on expanding into new geographic markets, particularly in Asia. However, the<br />
globalization and increasing consolidation of our industry have occasionally presented us with the opportunity<br />
to make major acquisitions. We have funded these acquisitions through issuing new equity and taking on<br />
temporarily higher levels of debt. This was the case in late December 1997 with the acquisition of Redland<br />
(aggregates, lime, tiles), and again in 2001 with our acquisition of Blue Circle (cement, aggregates).<br />
In the discussion that follows with respect to each division, the after tax return on capital employed is the<br />
sum of the operating income on ordinary activities after tax (which is calculated by applying the effective tax<br />
rate for the year in question — 28.6% in 2003 — to the division’s operating income on ordinary activities)<br />
and the share of net income of equity affiliates divided by the average capital invested per division (see Notes<br />
3(a) and 9(b) to our consolidated financial statements).<br />
20
Cement<br />
With sales of 6.4 billion euros, our Cement division contributed 46.7% of our sales in 2003 and 75.8%<br />
of our operating income on ordinary activities. The Cement division’s after tax return on capital employed in<br />
2003 was 8.4%. At December 31, 2003, we had 35,984 employees in the Cement division.<br />
On the basis of tonnes of cement capacity in 2003, we believe, based on our experience in this industry,<br />
that our cement business is the world’s largest producer of cement. At the end of 2003, the companies we<br />
consolidated (global and proportionate) operated 117 cement plants, 19 clinker grinding plants and 5 slag<br />
grinding stations in 43 countries.<br />
In 2003, the companies we consolidated (global and proportionate) had sales volumes of 108.0 million<br />
tonnes of cement.<br />
We operate throughout the world. We believe that because cement demand is closely related to the<br />
business cycle and the level of infrastructure spending, particularly of the construction sector, geographical<br />
diversification is the best way to ensure growth of returns.<br />
Our goals for the coming years in cement are to further enhance our operating performance in our<br />
various geographic markets by improving the upstream operations through benchmarking and transfer of best<br />
practices. We also wish to continue to participate in the consolidation of the industry worldwide.<br />
The table below indicates the breakdown of our sales by destination in 2003, 2002 and 2001:<br />
Cement Sales by Destination<br />
Year ended December 31<br />
Geographic Area 2003 2002 2001*<br />
(in million euros, except percentages)<br />
Western Europe ;;;;;;;;;; 2,099 32.9% 2,274 32.7% 1,725 28.8%<br />
North America ;;;;;;;;;; 1,345 21.1% 1,579 22.7% 1,469 24.5%<br />
Central and Eastern Europe ;;;;; 409 6.4% 401 5.8% 301 5.0%<br />
Mediterranean Basin ;;;;;;;; 441 6.9% 455 6.6% 550 9.2%<br />
Latin America ;;;;;;;;;; 416 6.5% 502 7.2% 547 9.1%<br />
Sub-Saharan Africa and Indian Ocean ; 766 12.0% 756 10.9% 650 10.8%<br />
Asia/Pacific ;;;;;;;;;;; 907 14.2% 981 14.1% 753 12.6%<br />
Total ;;;;;;;;;;;;;; 6,383 100.0% 6,948 100.0% 5,995 100.0%<br />
* including the former Blue Circle operations from July 11, 2001.<br />
We believe emerging markets represent the best prospects for long-term growth in the cement industry.<br />
We classify all countries outside of the Western Europe and North America geographic sectors, with the<br />
exception of Japan, Australia and New Zealand, as emerging markets. We had sales of 2,938 million euros in<br />
countries in emerging markets in 2003, compared to 3,092 million euros in 2002 and 2,799 million euros in<br />
2001. The overall percentage of our sales coming from these markets was 46.0% in 2003 compared to 44.5%<br />
in 2002 and 46.7% in 2001.<br />
General information regarding our products, industry and markets<br />
Our products<br />
Our major products are a wide range of cements and hydraulic binders for the construction industry.<br />
Cement is a fine powder that is the principal strength-giving and property-controlling component of concrete.<br />
We have developed a broad-based product offering for construction industry professionals:<br />
s a range of cements adapted for use in all conditions (including cements adapted to exposure to<br />
seawater, sulfates and hostile natural environments);<br />
s special cements: silica fume cements, white cement, oil-well cements, pozzolanic cements and slag<br />
cements;<br />
21
s road surfacing hydraulic binders;<br />
s natural lime hydraulic binders for construction; and<br />
s masonry cements.<br />
Offered alongside this range of products is a series of associated services: technical support, ordering and<br />
delivery logistics, documentation, demonstrations, training, etc.<br />
How do we manufacture cement and what are our raw materials?<br />
The production of cement can be separated into three main stages.<br />
s The first step is to mix calcium carbonate, silica, alumina and iron ore in the correct proportions and<br />
grind them to produce the ‘‘raw meal’’.<br />
s This ‘‘raw meal’’ is then heated and calcined in a kiln at a temperature of around 2730º F, and then<br />
cooled down quickly to obtain an intermediate product in the form of a hard pellet, called ‘‘clinker’’.<br />
s The clinker is then mixed with gypsum and finely ground to produce cement. Other cementitious<br />
materials can also be added at this stage such as slag, fly ash and pozzolana, a naturally occurring<br />
volcanic cement.<br />
There are two main processes used to produce clinker: the older, less fuel efficient, wet process and the<br />
modern dry process. In the wet process, the raw materials are mixed and ground with water to produce<br />
‘‘slurry,’’ which is then heated in the kiln to produce clinker. In the dry process, the raw materials are mixed<br />
and ground without water (hence ‘‘dry’’) to produce a very fine powder, which is then heated in the kiln. The<br />
dry process consumes less heat, since there is no need to eliminate the water added in the wet process. This<br />
substantially reduces fuel costs. Over 85% of our cement plants use the dry process.<br />
The raw materials required for this process (calcium carbonate, silica, alumina and iron ore) are usually<br />
present in limestone, chalk, marl, shale and clay and are generally readily available in most countries of the<br />
world. Based on historic trends we do not consider the prices of these raw materials to be volatile. Cement<br />
plants are normally built beside large deposits of these raw materials. We currently estimate we have<br />
approximately 5 billion tonnes of proven and authorized reserves of raw materials. We believe that the<br />
quantities of authorized reserves at each of our existing cement plants is adequate for sustainable operating<br />
levels for the planned life of each of our plants.<br />
In addition to naturally occurring raw materials, it is sometimes possible to substitute them partially with<br />
other cementitious materials produced as by-products from other industrial processes, such as blast-furnace<br />
slag and fly ash from coal-fired power plants. The use of slag and fly ash can improve some characteristics of<br />
cement and can also help us lower our use of capital. The amounts that can be substituted depend on the<br />
particular characteristics of the slag or fly ash and on the standards and regulations applicable to the<br />
particular type of cement. The use of these substitute products is part of our environmental objectives of<br />
pursuing environmentally friendly solutions. We use slag and fly ash principally in our plants in North<br />
America, France, Spain, Turkey, Austria, Poland, Romania, Brazil, South Korea, India, South Africa, Greece,<br />
United Kingdom, Chile, Kenya, the Philippines and Malaysia. Slag and fly ash represented approximately<br />
13% of our total production in 2003 and part of our development strategy is to increase the use of<br />
cementitious materials in our products.<br />
What are the costs of manufacturing cement?<br />
Cement production is capital intensive. The construction of a new dry process cement production line<br />
with a production capacity of 1 million tonnes per year (buildings, machinery and equipment) represents an<br />
investment of 100 to 160 million euros depending on the country in which it is located. From January 1,<br />
2002, cement plants have been depreciated by components. Before January 1, 2002, cement plants had been<br />
depreciated over a unique useful life period without any distinction of components. On average, this change<br />
in estimate has resulted in increasing the depreciable useful life from 20 years to 28 years, which more<br />
22
closely reflects actual experience with modern cement plants. The following table sets forth our estimate of a<br />
typical structure of gray cement production cost:<br />
Item Percentage of Total Cost<br />
Raw Materials ;;;;;;;;;;;;;;;;; 10%<br />
Energy ;;;;;;;;;;;;;;;;;;;; 28%<br />
Direct production labor ;;;;;;;;;;;;; 21%<br />
Maintenance ;;;;;;;;;;;;;;;;; 21%<br />
Other overhead ;;;;;;;;;;;;;;;; 6%<br />
Depreciation ;;;;;;;;;;;;;;;;; 14%<br />
Total Cost ;;;;;;;;;;;;;;;;;; 100%<br />
We have placed special emphasis on becoming, and have become, more efficient in our sourcing and use<br />
of fuel. Fuel-efficiencies have been gained through improved plant design to include techniques such as using<br />
air exiting the kiln to preheat the blended raw materials as well as through the use of alternate fuels for firing<br />
the kiln, such as sump oil or tire recycling, as a partial substitute for the oil, natural gas, coke or coal<br />
otherwise used. As an additional means of reducing energy costs, many of our cement plants are equipped to<br />
convert from one form of fuel to another with very little interruption in production, thus avoiding dependence<br />
on a single fuel and permitting us to take advantage of price variations between fuels. We have 65 plants that<br />
use some form of alternate fuels and approximately 67% of our cement plants are equipped to switch between<br />
fuel sources i.e. pet coke and coal. Pet coke is a residue of petroleum refining which is used as a fuel.<br />
Who buys our cement, our customer orders and backlog?<br />
In each of our markets we sell our cement, either bulk or bagged, to several thousand unaffiliated<br />
customers. Our products are used in three major segments of the construction industry: major civil<br />
engineering products, residential and commercial construction and renovation. Our primary customers are:<br />
s ready mix concrete producers,<br />
s building materials wholesalers,<br />
s construction and civil engineering contractors, and<br />
s road building and earthworks contractors.<br />
We also sell to our other divisions, including our Aggregates & Concrete division, but we eliminate<br />
inter-company sales in reporting sales for the division. In 2003, sales of our Cement division to our other<br />
divisions represented 562 million euros.<br />
Sales of cement are made generally pursuant to current orders from customers who purchase quantities<br />
sufficient for their immediate requirements. Our sales of cement do not typically involve long-term<br />
contractual commitments. The amount of backlog orders, as measured by written contracts, is normally not<br />
significant.<br />
Our markets and industry<br />
The world’s major cement markets are Asia, Western Europe and North America, and the highest growth<br />
is expected to be in emerging markets. Historically, cement consumption in a given country has been<br />
correlated to growth of per-capita income. As emerging countries become industrialized, consumption tends<br />
to grow rapidly as a percentage of per capita income with increased expenditures on public works and<br />
housing. After a certain point of development, consumption per capita tends to taper off and may actually fall<br />
as the focus of development turns away from residential and commercial construction and increases in<br />
infrastructure.<br />
Demand for cement is seasonal and tends to be lower in the winter months in temperate countries and in<br />
the rainy season in tropical countries. In each country it is also closely linked to the condition of the<br />
construction industries and public infrastructure spending and is sensitive to interest rates and business cycles.<br />
23
Demand for cement in specific markets also depends on local considerations such as climate, natural<br />
resources and consumer tastes (demand for cement is far more seasonal in areas with cold winters such as<br />
Canada and the mid-western United States and, for example, U.S. residential construction uses more wood<br />
and less cement and concrete than Spanish residential construction).<br />
Due to its nature, cement cannot be transported affordably on land farther than about 300 km, although<br />
by sea and inland waterway it becomes economical to transport over great distances. Price is an important<br />
factor in competition. Nonetheless, demand for cement in any particular market is inelastic downwards in that<br />
lower prices do not typically increase market demand. Differentiation from competitors can be achieved<br />
through consistent quality over time and regular deliveries as well as through the marketing of special<br />
purpose cements.<br />
The capital-intensive nature of the cement industry together with over-capacity after the oil shocks of the<br />
1970s led to the consolidation of the cement industry in Europe. In the 1980s, the major European cement<br />
manufacturers expanded into the United States and acquired approximately 70% of U.S. cement production.<br />
The beginning of the 1990s saw the acquisition of Valenciana and Sanson in Spain by Cemex S.A. of<br />
Mexico. After the Asian crises, the consolidation of production into the hands of multinationals was then<br />
mirrored in Asia’s cement industry, with the multinationals having a stake in an estimated 60% of Asian<br />
cement capacity outside of China.<br />
Cement is a competitive industry in all of our markets. We consider our major global competitors to be:<br />
Holcim (Switzerland), Cemex (Mexico), HeidelbergCement (Germany) and Italcementi (Italy).<br />
Our geographic markets<br />
In the discussion that follows, we describe market conditions and our competitive position in the<br />
principal geographic areas in which we operate. The sales volume figures we have provided for each country<br />
or geographic zone are the total volumes sold in each particular country or zone by our consolidated cement<br />
subsidiaries (including the former Blue Circle operations from July 11, 2001), including volumes sold to our<br />
other divisions and adjusted to reflect our percentage of interest in our proportionally consolidated<br />
subsidiaries. The information as to the rated annual cement production capacity of our operating cement<br />
manufacturing plants is based on management’s estimates at December 31, 2003. The production of a cement<br />
plant might be less than its rated capacity due to product demand, plant failures and seasonal factors. The<br />
information as to the total industry capacity is, unless mentioned otherwise, as estimated by The International<br />
Cement Review’s Global Cement Report (fifth edition, completed in January 2003) (‘‘Global Cement<br />
Report’’). The Global Cement Report’s estimate of our production capacity differs in some respects to our<br />
management’s estimates, however, we have retained the figures in the Global Cement Report for our<br />
production capacity when calculating total industry capacity.<br />
Western Europe<br />
Western Europe represented approximately 32.9% of our cement sales in 2003. We have significant<br />
operations in France, the United Kingdom, Greece, Spain, Germany and Austria. We sold 30.6 million tonnes<br />
of cement in Western Europe in 2003 compared to 32.8 million tonnes in 2002 and 26.0 million tonnes in<br />
2001.<br />
Most cement markets in Western Europe are mature and according to Cembureau, the European Cement<br />
Producers Association, the total consumption for the European Union as a whole in 2003 was close to<br />
192 million tonnes or approximately 503 kg per capita. However, consumption varies dramatically within the<br />
region, Greece, Spain and Italy having for instance a much higher per capita consumption of cement than<br />
France. The cement industry in Europe is competitive in all major markets, with production generally<br />
concentrated within the hands of the major international groups.<br />
24
The table below indicates the number of plants and our production capacity by country at December 31,<br />
2003:<br />
Number of Plants<br />
Total Cement<br />
Production Capacity<br />
Country Company Cement Clinker Grinding (in million tonnes)<br />
France ;;;;;;;;;;; <strong>Lafarge</strong> Ciments ;;; 10 2 9.6<br />
United Kingdom ;;;;;;; Blue Circle ;;;;; 8 0 7.5<br />
Greece ;;;;;;;;;;; Heracles General Cement 3 0 10.0<br />
Spain;;;;;;;;;;;; <strong>Lafarge</strong> Asland ;;;; 4 0 4.2<br />
Germany ;;;;;;;;;; <strong>Lafarge</strong> Zement ;;; 3 0 3.5<br />
Austria ;;;;;;;;;;; <strong>Lafarge</strong> Perlmooser ;; 2 0 1.5<br />
Italy ;;;;;;;;;;;; <strong>Lafarge</strong> Adriasebina ;; 2 0 1.5<br />
Total Western Europe ;;;;;;;;;;;;;; 32 2 37.8<br />
France. Through our wholly owned subsidiary, <strong>Lafarge</strong> Ciments, we are the leading cement producer in<br />
France. In 2003, France represented approximately 28.8% of our cement sales in Western Europe. The most<br />
recent edition available of the Global Cement Report estimated that our total installed capacity represented<br />
approximately 36% of the total rated capacity in France.<br />
Our ten cement plants and two seaboard clinker grinding plants in France are located to serve all of the<br />
major urban areas in the country and are dependent upon our four separate sales offices covering each of the<br />
major regions of the country. We also operate a slag grinding plant and a lime plant.<br />
Based on figures provided by the Cembureau, cement consumption in France fell rapidly in the mid-<br />
1990s to reach a low of 18.7 million tonnes in 1996 and 1997, but has partially recovered since the beginning<br />
of 1999 and has since stabilized with consumption in 2003 of 20.3 million tonnes compared to 20.4 million<br />
tonnes in 2002 and 20.7 million tonnes in 2001. We sold 7.2 million tonnes of cement in metropolitan France<br />
in 2003, compared to 7.4 million tonnes in 2002 and 2001.<br />
Our major competitors in France are Ciments Français (which is 72% owned by Italcementi), Vicat (in<br />
which HeidelbergCement has a 35% interest) and Origny (which is a wholly-owned subsidiary of Holcim).<br />
United Kingdom. We acquired our operations in the United Kingdom with our acquisition of Blue Circle.<br />
Through our wholly owned subsidiary, Blue Circle Industries, we are now the leading cement producer in the<br />
United Kingdom. In 2003, the United Kingdom contributed approximately 23.2% of our cement sales in<br />
Western Europe. The most recent edition of the Global Cement Report estimated that our total installed<br />
capacity, taking into account the closure of the Weardale plant at the end of 2002, represented approximately<br />
48% of the total rated capacity in the United Kingdom.<br />
Our eight cement plants in the United Kingdom are located to serve the whole of the country, including<br />
Northern Ireland. The domestic market remained stable in 2003. We sold 6.4 million tonnes in the United<br />
Kingdom in 2003 compared to 7.1 million tonnes in 2002.<br />
Our major competitors in the United Kingdom are Castle Cement (which is wholly owned by<br />
HeidelbergCement) and Rugby Cement (which is wholly owned by RMC).<br />
Greece. We acquired our operations in Greece with our acquisition of Blue Circle. Through our majority<br />
owned subsidiary, Heracles General Cement, we are the leading cement producer in Greece. In 2003, Greece<br />
contributed approximately to 20.7% of our cement sales in Western Europe. The most recent edition of the<br />
Global Cement Report estimated that our total installed capacity represented approximately 56% of the total<br />
rated capacity in Greece.<br />
Our three cement plants in Greece are located to serve the domestic Greek market through seven<br />
separate distribution terminals. In 2003, exports accounted for approximately 35% of our production.<br />
According to the latest figures available from Cembureau, Greece had the fourth highest per capita<br />
cement consumption rate in the European Union in 2003. This reflects the fact that the construction market is<br />
very much concrete based. We sold 6.0 million tonnes of cement in Greece in 2003 compared to 5.5 million<br />
25
tonnes in 2002 and 2.4 million tonnes in 2001 (in 2001, sales of former Blue Circle operations were only<br />
consolidated from July 11, 2001).<br />
Our major competitors in Greece are Titan Cement Co and Halyps Cement Co (which is controlled by<br />
Italcementi through the 94% equity interest held by Ciments Français).<br />
Spain. Our operations in Spain are conducted through our majority owned subsidiary <strong>Lafarge</strong> Asland,<br />
which we acquired in 1989. In 2003, Spain represented approximately 13.2% of our cement sales in Western<br />
Europe. We are currently the third-largest cement producer in Spain based on capacity as reported by the<br />
most recent edition of the Global Cement Report. We sold 4.9 million tonnes of cement in Spain in 2003<br />
compared to 6.8 million in 2002 and 6.7 million tonnes in 2001.<br />
Our four plants are located primarily in the growth regions of the Mediterranean coast and of the region<br />
of central Spain surrounding Madrid. We also operate a network of distribution centers and 3 seaboard<br />
terminals. In 2002, we sold certain cement assets to Cimentos de Portugal SGPS, S.A. (Cimpor) for<br />
225 million euros. Located in Southern Spain, these assets consisted of two cement plants at Cordoba and<br />
Niebla, representing a total annual capacity of 0.8 million tonnes of clinker and 1.4 million tonnes of cement,<br />
a grinding plant at Huelva (which we had acquired in September 2001), with an annual capacity of 0.6 million<br />
tonnes of cement, and a terminal in Seville, Spain. According to the Global Cement report, Spain is among<br />
the leading countries in Europe in terms of cement consumption per capita due to the high level of<br />
infrastructure and construction spending. According to Cembureau, the market continued to expand in 2003<br />
reaching 45.6 million tonnes. However, imports have continued to have a significant impact on prices in<br />
Spain especially in the coastal regions and, according to the Global Cement Report, imports of cement and<br />
clinker represented approximately 17% of the market’s consumption in 2002.<br />
Our major competitors in Spain are Valenciana (which is 99.5% owned by Cemex), Cementos Portland<br />
(which is 55% owned by Valderrivas), Hisalba (which is 99.9% hold by Holcim), Financiera y Minera (which<br />
is controlled by Italcementi through Ciments Français), Uniland and Cimpor.<br />
In December 2003, we signed an agreement for the sale of the 40.9% interest we held since 1997 in<br />
Cementos Molins, a Spanish cement producer with operations in Spain, Uruguay, Mexico and Argentina. The<br />
sale will take the form of a limited tender offer that Cementos Molins will launch for its own shares to take<br />
place in the first half of 2004 subject to approval from the Spanish regulatory authorities. The transaction is<br />
expected to amount to approximately 270 million euros. As part of the transaction, we acquired the 2.64%<br />
stake held by Cementos Molins in Cimentos de Portugal SGPA (Cimpor) for approximately 70 million euros.<br />
Germany. Our operations are conducted through our wholly-owned subsidiary <strong>Lafarge</strong> Zement GmbH. In<br />
2003, Germany represented approximately 5.1% of our cement sales in Western Europe. We are the sixth<br />
largest cement producer in Germany based on capacity as reported by the most recent edition of the Global<br />
Cement Report.<br />
We have three plants in Germany: the Wössingen plant near Karlsruhe, in which we initially acquired an<br />
interest in 1976, Karsdorf in Sachsen Anhalt, in Eastern Germany, which we acquired in 1991 and the<br />
Sötenich plant in Nord Rhein-Westphalia near the Belgian border, which we acquired in 1998. Our<br />
Wössingen plant serves Southern Germany including Stuttgart and Munich. Our Karsdorf plant serves Central<br />
and North Eastern Germany. Sötenich serves South West Germany including Cologne and Dusseldorf. We<br />
also serve Dresden and South Eastern Germany from our Cizkovice plant in the Czech Republic.<br />
The construction industry in Germany has suffered a downturn since 1999 and, according to Cembureau,<br />
the overall cement market in Germany amounted to 27.3 million tonnes in 2003 a decline of 5% compared to<br />
2002 and a decline of approximately 14.5% compared to 2001. We sold 3.1 million tonnes in 2003 compared<br />
to 2.7 million tonnes in 2002 and 2.5 million tonnes in 2001. Our major competitors in Germany are<br />
Dyckerhoff, HeidelbergCement, Schwenk, Readymix Zement (a subsidiary of RMC Group plc) and Holcim.<br />
Austria. Our cement business in Austria is conducted through our wholly owned subsidiary, <strong>Lafarge</strong><br />
Perlmooser AG, in which we acquired our initial interest through our acquisition of Cementia in 1989. In<br />
2003, Austria represented approximately 4.2% of our cement sales in Western Europe. <strong>Lafarge</strong> Perlmooser<br />
AG is the largest cement producer in Austria based on capacity as reported by the most recent edition of the<br />
26
Global Cement Report. We operate two cement plants in Austria, one near Vienna and one in the Styria<br />
region. We sold 1.4 million tonnes of cement in Austria in 2003, compared to 1.4 million tonnes in 2002 and<br />
1.5 million tonnes in 2001. Our major competitors in Austria are Wietersdorfer, Schretter, Leube, SPZ and<br />
Gmundner.<br />
We also hold a 50% interest in Kirchdorfer Zement, which operates a plant with a rated capacity of<br />
0.55 million tonnes, according to the most recent edition of the Global Cement Report.<br />
Italy. Our cement business in Italy is conducted through our wholly owned subsidiary, <strong>Lafarge</strong><br />
Adriasebina which we acquired in 1996. In 2003, Italy represented approximately 4.1% of our cement sales in<br />
Western Europe. We sold 1.4 million tonnes of cement in Italy in 2003, compared to 1.4 million tonnes in<br />
2002 and 1.3 million tonnes in 2001.<br />
Our 20% interest in the cement producer Sacci was sold at the end of 2002 for approximately 20 million<br />
euros.<br />
North America<br />
North America represented approximately 21.1% of our cement sales 2003. We are represented in North<br />
America through our majority owned subsidiary, <strong>Lafarge</strong> North America Inc., a New York Stock Exchange<br />
listed company and through our wholly owned subsidiary Blue Circle North America Inc. which we acquired<br />
as part of the Blue Circle acquisition. The assets of Blue Circle North America Inc. are currently managed by<br />
<strong>Lafarge</strong> North America, which has an option to purchase such assets anytime between July 1, 2002 and<br />
December 31, 2004 at a fixed call price of 1.4 billion U.S. dollars, subject to certain adjustments at the time<br />
of the exercise. North America is a mature cement market and sales are seasonal in Canada and much of the<br />
East Coast and Mid West as temperatures in winter fall below minimum setting temperatures for concrete.<br />
We sold 18.0 million tonnes of cement in North America in 2003 compared to 17.5 million tonnes of cement<br />
in 2002 and 16.0 million tonnes of cement in 2001.<br />
The table below indicates the number of plants and our production capacity by country at December 31,<br />
2003:<br />
Number of Plants<br />
Total Cement<br />
Production Capacity<br />
Country Company Cement Clinker Grinding (in million tonnes)<br />
United States ;;;;;; <strong>Lafarge</strong> North America ;;; 8 0 7.0<br />
Blue Circle North America Inc. 5 0 5.0<br />
Canada ;;;;;;;; <strong>Lafarge</strong> Canada Inc. ;;;; 7 0 5.3<br />
Total North America ;;;;;;;;;;;;;; 20 0 17.3<br />
United States. In 2003, the United States represented approximately 84.5% of our cement sales in North<br />
America. On the basis of the figures provided by the Portland Cement Association’s ‘‘Plant Information<br />
Summary’’ report which was prepared at December 31, 2001, we are the second largest cement producer<br />
based on rated annual active clinker production capacity, with an estimated 12.7% of the rated annual active<br />
clinker production capacity of all U.S. cement plants. The acquisition of Blue Circle brought us operations in<br />
the South Eastern United States that complemented our existing plants which are primarily concentrated in<br />
the central and Midwestern states, extending from the northern Great Lakes southward along the Mississippi<br />
River system. Two new production lines became operational in 2002 replacing our prior capacities at Sugar<br />
Creek, near Kansas City, and Roberta, Alabama. In 2003, we divested our operations in Florida, which<br />
consisted primarily of two cement grinding and import facilities, for approximately 142 million euros. We<br />
have expanded our use of cementitious products and already have two slag grinding facilities, one being in<br />
Baltimore, Maryland, and the other one close to Chicago, Illinois, where operations started in April 2002.<br />
Our major competitors in the United States are Holnam (which is a subsidiary of Holcim), Southdown<br />
(which is a subsidiary of Cemex), Ash Grove Cement and HeidelbergCement’s U.S. subsidiaries.<br />
27
We sold 14.8 million tonnes of cement in the United States in 2003 compared to 14.6 million tonnes in<br />
2002 and 12.9 million tonnes in 2001. Our most significant U.S. markets in 2003 were Illinois, Michigan and<br />
Wisconsin.<br />
Canada. In 2003, Canada represented approximately 15.5% of our cement sales in North America. We<br />
are the leading cement producer in Canada according to the last quarterly report of the Canadian Portland<br />
Cement Association ‘‘Canadian 2004 Outlook and Assessment’’ which was prepared at December 31, 2003,<br />
with approximately 33.8% of the total active industry clinker production capacity in Canada. We are the only<br />
cement producer serving all regions of Canada. Our major competitors in Canada are St. Lawrence Cement (a<br />
subsidiary of Holcim) and St Marys Cement (a subsidiary of Votorantim).<br />
We sold 3.2 million tonnes of cement in Canada in 2003 compared to 3.0 million tonnes in 2002 and<br />
3.1 million tonnes in 2001. We made our most significant sales in Canada in Ontario, which accounted for<br />
approximately 52% of our total Canadian cement shipments in 2003. Other provinces in which we had<br />
significant sales included Alberta and Quebec. Approximately 28% of our cement shipments in Canada were<br />
made to our Aggregates & Concrete division.<br />
In addition to the plants shown in the table above we also have two slag grinding plants in Ontario.<br />
According to the Portland Cement Association, our largest competitor accounted for approximately 17.6% of<br />
rated annual active clinker production capacity in Canada.<br />
Central and Eastern Europe<br />
In 2003, Central and Eastern Europe represented approximately 6.4% of our cement sales. We have<br />
actively sought to take advantage of the opportunities offered in the emerging markets of Central and Eastern<br />
Europe and are present in Poland, the Czech Republic, Romania, Serbia, Slovenia and the Commonwealth of<br />
Independent States. Many of the countries in Central and Eastern Europe currently suffer from chronic excess<br />
capacity as a result of central planning. However, we believe that the expansion of the European Union<br />
eastward makes the long-term growth prospects good and our operations in Poland and Romania are already<br />
making significant contributions to our earnings. The companies we consolidated sold 9.0 million tonnes of<br />
cement in Central and Eastern Europe in 2003 compared to 8.1 million tonnes in 2002 and 6.2 million tonnes<br />
in 2001.<br />
The table below indicates the number of plants and our production capacity by country at December 31,<br />
2003:<br />
Number of Plants<br />
Total Cement<br />
Production Capacity<br />
Country Company Cement Clinker Grinding (in million tonnes)<br />
Poland ;;;;;; <strong>Lafarge</strong> Cement Polska ;;;;;; 2 0 4.0<br />
Romania ;;;;; <strong>Lafarge</strong> Romcim ;;;;;;;; 2 1 4.4<br />
Czech Republic ;; <strong>Lafarge</strong> Cement a.s. ;;;;;;; 1 0 1.0<br />
CIS ;;;;;;; Voskresenskcement ;;;;;;; 1 0 1.9<br />
Mykolaivcement ;;;;;;;; 1 0 1.6<br />
Uralcement;;;;;;;;;;; 1 0 1.7<br />
Rezina;;;;;;;;;;;;; 1 0 1.2<br />
Serbia-Montenegro ; <strong>Lafarge</strong> Beocinska Fabrika Cementa 1 0 1.5<br />
Slovenia ;;;;; Cementarna Trbovlje ;;;;;;; 1 0 0.6<br />
Total Central and Eastern Europe ;;;;;;;;; 11 1 17.9<br />
Poland. In 2003, Poland represented approximately 28.6% of our cement sales in Central and Eastern<br />
Europe. We operate through our majority owned subsidiary <strong>Lafarge</strong> Cement Polska which, we believe, based<br />
on our experience in this industry, is the second largest producer in terms of capacity. We acquired our plants<br />
in Poland in a series of acquisitions in 1995 and 1996. In 2003, we purchased the minority interest of the<br />
European Bank for Reconstruction and Development in <strong>Lafarge</strong> Polska, the holding company of <strong>Lafarge</strong><br />
Cement Polska. We sold 2.2 million tonnes of cement in Poland in 2003, compared to 2.2 million tonnes in<br />
2002 and 2.3million tonnes in 2001. We have replaced one of our old wet process kilns in the Kujawy plant<br />
28
in northern Poland with a new dry process kiln, which became operational early in 2003. Our major<br />
competitors in Poland are CRH, HeidelbergCement, and Dyckerhoff.<br />
Romania. In 2003, Romania represented approximately 24.7% of our cement sales in Central and Eastern<br />
Europe. We operate two cement plants and one clinker grinding station in Romania, through our majority<br />
owned subsidiary, <strong>Lafarge</strong> Romcim, which we acquired in 1997. Following the acquisition of <strong>Lafarge</strong><br />
Romcim we sold an indirect minority interest to the European Bank for Reconstruction and Development. In<br />
2003, we increased our interest in <strong>Lafarge</strong> Romcim to 77.81%. We believe, based on our experience in this<br />
industry, we are the largest cement producer in Romania in terms of capacity. Our main competitors are<br />
Holcim, HeidelbergCement and Romcif Fieni.<br />
Cement consumption in Romania dropped after the fall of the communist regime in 1989 when statefinanced<br />
dwelling construction almost ceased. As a result, cement producers in Romania have large<br />
underutilized capacities. The Global Cement Report estimates the total market for cement in Romania at<br />
4.6 million tonnes in 2002, and a total industry production capacity of 10.7 million tonnes in 2002. We<br />
exported approximately 43.8% of production in 2003. We produced 2.9 million tonnes of cement in Romania<br />
in 2003 compared to 2.9 million tonnes in 2002 and 2.7 million tonnes in 2001.<br />
Czech Republic. In 2003, the Czech Republic represented approximately 6.6% of our cement sales in<br />
Central and Eastern Europe. Our operations in the Czech Republic are conducted through our majority owned<br />
subsidiary <strong>Lafarge</strong> Cement AS. We exported approximately 55.7% of production in 2003. We sold 0.3 million<br />
tonnes of cement in the Czech Republic in 2003, compared to 0.3 million tonnes in 2002 and 0.4 million<br />
tonnes in 2001. Our major competitors in the Czech Republic are HeidelbergCement, Holcim and Dyckerhoff.<br />
Commonwealth of Independent States. We have plants in the Commonwealth of Independent States in<br />
Russia, the Ukraine and Moldavia.<br />
We acquired our majority interest in JSC Voskresenskcement which operates a cement plant in<br />
Voskresensk, near Moscow, in 1996. In October 2003, we acquired a 75% interest in Uralcement, which<br />
operates a plant in the Urals with a capacity of 1.7 million tonnes. According to the most recent edition of<br />
the Global Cement Report, the total market for cement in Russia was 35 million tonnes in 2002, compared to<br />
a total industry production capacity of 77.3 million tonnes. We sold 1.6 million tonnes of cement in Russia in<br />
2003 compared to 1.5 million tonnes in 2002 and 1.3 million tonnes in 2001.<br />
We acquired a majority interest in Mykolaivcement which operates a cement plant in Mykolaiv, near the<br />
Black Sea, in 1999 after initially acquiring a minority stake in 1998. We sold 0.8 million tonnes of cement in<br />
the Ukraine in 2003 compared to 0.7 million tonnes in 2002.<br />
In Moldavia, our wholly-owned subsidiary, Cement Rezina, operates a cement plant located in Rezina<br />
with a capacity of 1.2 million tonnes.<br />
Serbia-Montenegro. Our subsidiary Beocinska Fabrika Cementa, which we acquired in 2002, is the<br />
market leader in Serbia-Montenegro, with a total annual production capacity of 1.5 million tonnes, Beocinska<br />
Fabrika Cementa is the market leader in Serbia-Montenegro. The plant is located on the Danube close to<br />
Novi Sad and Belgrade. Subsequent to the acquisition, we sold 49.98% of our interest in 2002. Our indirect<br />
ownership interest as at December 31, 2002 was 34.72%. We sold 1.0 million tonnes of cement in Serbia-<br />
Montenegro in 2003 compared to 0.8 million tonnes in 2002.<br />
Slovenia. Our subsidiary Cementarna Trbovlje, which we acquired in 2002, is the second largest cement<br />
producer on the Slovenian market, with an annual production capacity of 0.6 million tonnes. The plant is<br />
located close to the two major cities of the country (Ljubljana and Maribor) and close to Austria. We sold<br />
0.5 million tonnes of cement in Slovenia in 2003, compared to 0.4 million tonnes in 2002<br />
Mediterranean Basin<br />
In 2003, the Mediterranean Basin represented approximately 6.9% of our cement sales. We believe the<br />
emerging countries of the Mediterranean Basin have high growth potential in the medium to long-term as<br />
they industrialize and urbanize. Many of the cement markets in the region have only been recently opened up<br />
29
to competition after years of state ownership. The companies we consolidated sold 9.9 million tonnes of<br />
cement in the region in 2003 compared to 9.5 million tonnes in 2002 and 11.4 million tonnes in 2001.<br />
The table below indicates the number of plants and our production capacity by country at December 31,<br />
2003:<br />
Number of Plants<br />
Total Cement<br />
Production Capacity<br />
Country Company Cement Clinker Grinding (in million tonnes)<br />
Morocco ;;;;;;;; <strong>Lafarge</strong> Maroc ;;;;;; 4 0 4.2<br />
Jordan ;;;;;;;;; Jordan Cement Factories ;; 2 0 4.5<br />
Turkey ;;;;;;;;; <strong>Lafarge</strong> Aslan ;;;;;; 1 0 2.1<br />
Yibitas <strong>Lafarge</strong> ;;;;;; 3 3 2.1<br />
Eregli Cimento ;;;;;; 0 1 0.2<br />
Total Turkey ;;;;;;; 4 4 4.4<br />
Egypt ;;;;;;;;; Beni Suef Cement Company 1 0 1.5<br />
Alexandria Portland Cement 1 0 3.0<br />
Total Egypt ;;;;;;; 2 0 4.5<br />
Total Mediterranean Basin ;;;;;;;;;;;; 12 4 17.6<br />
Morocco. In 2003, Morocco represented approximately 28.3% of our cement sales in the Mediterranean<br />
Basin. We operate four cement plants in Morocco through our subsidiary <strong>Lafarge</strong> Maroc and its operating<br />
subsidiaries. Our partner in <strong>Lafarge</strong> Maroc is ONA, the largest Moroccan group. On the basis of the figures<br />
produced by the most recent edition of the Global Cement Report we are the largest cement producer and<br />
have approximately 45% of the production capacity in the country. <strong>Lafarge</strong> Maroc sold 3.8 million tonnes of<br />
cement in Morocco in 2003 compared to 3.6 million tonnes in 2002 and 3.4 million tonnes in 2001 (1.9, 1.8<br />
and 3.4 million tonnes in 2003, 2002 and 2001, respectively, on the basis of our percentage of interest, with<br />
the reduction in 2002 compared to 2001 reflecting the consolidation of <strong>Lafarge</strong> Maroc using the proportionate<br />
consolidation method since 2002 as compared to full consolidation in 2001). The market consists of<br />
international players and our competitors, Italcementi, Holcim and Cimpor, operate six cement plants and two<br />
grinding plants in Morocco.<br />
The Moroccan economy is vulnerable to sharp declines in agriculture resulting from lack of rainfall and<br />
recovering from an economic recession. Cement consumption is growing but the growth pattern is heavily<br />
influenced by the state of agriculture. In 2001, we commenced the construction of a new cement plant close<br />
to our then existing plant in Tetouan. The new plant was completed in September 2003 and began operations<br />
in October 2003. Our old plant was closed at the same time. The new plant has the same capacity as that of<br />
the old plant, that is 0.7 million tonnes per year. The construction of the new plant was financed through the<br />
internal cash flow of <strong>Lafarge</strong> Maroc.<br />
Jordan. In 2003, Jordan represented approximately 33.1% of our cement sales in the Mediterranean<br />
Basin. Our operations in Jordan are conducted through Jordan Cement Factories, a listed company. In 1998,<br />
Jordan Cement Factories was privatized and we purchased a 33.3% interest. We are currently the largest<br />
shareholder of the company with a 48% participation. The Jordanian social security is the second largest<br />
shareholder in Jordan Cement Factories with a 23% interest.<br />
Cement consumption has increased over the past few years in Jordan despite socio-economic difficulties<br />
and the ongoing uncertainty in the Middle East. We sold 2.8 million tonnes of cement in Jordan in 2003<br />
compared to 2.7 million tonnes in 2002 and 2.4 million tonnes in 2001. In addition, we exported 0.8 million<br />
tonnes of cement and clinker.<br />
Turkey. In 2003, Turkey represented approximately 12.5% of our cement sales in the Mediterranean<br />
Basin. Through our majority owned subsidiary, <strong>Lafarge</strong> Aslan Cimento AS, we operate a plant in Darica in<br />
Marmara and through our wholly owned subsidiary, Agretas Agrega Insaat San.ve Tic.AS, we own a 49.9%<br />
interest in Yibitas <strong>Lafarge</strong>, a joint venture with Yibitas Holding which we manage. Yibitas <strong>Lafarge</strong> operates<br />
plants in Central Anatolia and the Black Sea region.<br />
30
The Turkish cement market has been adversely affected by an economic downturn over the last years,<br />
which has resulted into a financial crisis. However, we believe that in the long term Turkey represents a<br />
growing market for cement with high consumption per capita. The market is highly competitive with<br />
ownership fragmented and the Turkish economy and cement markets were greatly affected by the earthquakes<br />
in 1999. Excess supply from the regional clinker capacity has been around 20% for the past few years,<br />
resulting in significant export volumes. We exported approximately 21.0% of production in 2003. We sold<br />
1.9 million tonnes of cement in Turkey in 2003 compared to 2.8 million tonnes in 2002 and 3.1 million<br />
tonnes in 2001. Our major competitors are Akçansa (a subsidiary of Heildelberger Cement and Sabançi),<br />
Italcementi, Nuh Cimento, BURSA, Vicat and OYAK.<br />
Egypt. Our operations in Egypt are conducted through <strong>Lafarge</strong> Titan Egyptian Investments Ltd., a 50/50<br />
joint venture with the Greek cement group Titan S.A. We initially joined with Titan to buy 76% of Beni Suef<br />
in 1999 and this joint interest was raised to 95% in 2000. We included Alexandria Portland Cement which we<br />
acquired as part of the Blue Circle acquisition within the structure of the joint venture in 2002. Beni Suef has<br />
a single dry kiln plant located 120 kilometers south of Cairo and is the seventh largest producer in Egypt.<br />
Alexandria Portland Cement serves Egypt’s second city, Alexandria, and is the tenth largest producer in<br />
Egypt. It has a single plant with several wet kilns and a dry line which has been in operation since mid-2002.<br />
The new dry kiln line increases the capacity of our operations to 4.5 million tonnes. We sold 1.2 million<br />
tonnes of cement in Egypt in 2003 compared to 1.3 million tonnes in 2002 and 1.6 million tonnes in 2001.<br />
Our major competitors are Egyptian Cement (a subsidiary of Holcim), Assiut (a subsidiary of Cemex) and<br />
Suez (a subsidiary of Italcementi).<br />
Latin America<br />
In 2003, Latin America represented approximately 6.5% of our cement sales. We first entered the Latin-<br />
American market in the 1950s when we started our operations in Brazil. Following a long period of<br />
stagnation in the 1970s and 1980s the economies in Latin America grew strongly in the 1990s and despite the<br />
temporary downturn at the end of the decade we expect the trend to continue. The companies we<br />
consolidated sold 6.2 million tonnes of cement in Latin America in 2003 compared to 6.5 million tonnes in<br />
2002 and 6.4 million tonnes in 2001.<br />
The table below indicates the number of plants and our production capacity by country at December 31,<br />
2003:<br />
Number of Plants<br />
Total Cement<br />
Production Capacity<br />
Country Company Cement Clinker Grinding (in million tonnes)<br />
Brazil ;;;;; CNCP and CMS ;;;;;;;;; 6 0 4.3<br />
Venezuela ;;; FNC ;;;;;;;;;;;;;; 2 0 1.6<br />
Chile;;;;;; Empresas Melon ;;;;;;;;; 1 0 2.0<br />
Honduras ;;;; Industriana Cementera Hondurena ;; 1 0 0.6<br />
French Antilles ; Ciments Antillais and Ciments Guyanais 0 3 0.9<br />
Mexico ;;;;; CPBM ;;;;;;;;;;;;; 1 0 0.3<br />
Total Latin America ;;;;;;;;;;;;;;; 11 3 9.7<br />
Brazil. In 2003, Brazil represented approximately 38.5% of our cement sales in Latin America. We<br />
conduct our operations in Brazil through our wholly owned subsidiary, Companhia Nacional de Cimento<br />
Portland (‘‘CNCP’’), and our subsidiary Companhia de Materiais Sulfurosos (‘‘CMS’’). Our cement plants in<br />
Brazil are located mainly in the southeast of the country in the states of Rio de Janeiro, Minas Gerais and<br />
Sao Paolo. In April 2002, we announced the sale of cement assets to Cimpor for 67 million euros. Located in<br />
the Bahia state, these assets consist of the Brumado grinding plant, representing a total annual capacity of<br />
0.6 million tonnes, and its distribution network of three cement terminals. On the basis of figures published<br />
by the most recent edition of the Global Cement Report, we estimate we are the 4th largest cement<br />
manufacturer in Brazil in terms of rated capacity. Our major competitors in Brazil are Votorantim, Joa<br />
Santos, Holcim and Cimpor.<br />
31
The cement industry in Brazil slowed in 2002 due to economic and political uncertainties caused by the<br />
anticipation of the 2003 presidential election. We sold 2.6 million tonnes of cement in Brazil in 2003<br />
compared to 2.9 million tonnes of cement in 2002 and 3.2 million tonnes in 2001. Retail sales, mainly for<br />
individual construction use, account for most of the demand.<br />
We also own a 20% interest in Cimento Tupi.<br />
Venezuela. In 2003, Venezuela represented approximately 12.5% of our cement sales in Latin America.<br />
We conduct our operations in Venezuela through our majority owned subsidiary, Fabrica Nacional de<br />
Cementos. Our major competitors in Venezuela are Cemex and Holcim. On the basis of figures published by<br />
the most recent edition of the Global Cement Report, we estimate we are the third largest cement<br />
manufacturer in Venezuela in terms of rated capacity.<br />
Our plants in Venezuela are located in the northern part of the country where 80% of the population is<br />
concentrated. We sold 0.6 million tonnes of cement in Venezuela in 2003 compared to 0.8 million tonnes in<br />
2002 and 0.9 million tonnes in 2001.<br />
We also own a 23% interest in Cementos Catatumbo.<br />
Chile. We operate in Chile through our majority owned subsidiary, Empresas Melon, which we acquired<br />
with our acquisition of Blue Circle. In 2003, Chile contributed 16.1% of our cement sales in South America.<br />
Empresas Melon operates a single plant located near the capital Santiago. Our total installed capacity<br />
represented approximately 24% of the total rated capacity in Chile, based on the estimates contained in the<br />
most recent edition of the Global Cement Report. We sold 1.3 million tonnes of cement in Chile in 2003, the<br />
same level as in 2002 and 0.6 million tonnes in 2001 (as with the rest of the former Blue Circle operations,<br />
this only represents sales in 2001 consolidated from July 11, 2001).<br />
Our major competitors in Chile are Polpaico (which is 54% owned by Holcim) and Cementos Bio-Bio<br />
(including Industria Nacional de Cemento).<br />
Honduras. In 2003, Honduras represented approximately 10.8% of our cement sales in Latin America.<br />
We acquired our majority owned subsidiary Industria Cementera Hondurena, which has a plant located near<br />
the capital Tegucigalpa in March 1998. We are currently in the process of increasing the capacity of the plant<br />
to 700,000 tonnes per year. Our only competitor is Cementos del Norte which is controlled by Holcim and<br />
which has a plant located near the Guatemalan border.<br />
Mexico. We operate a single plant in Mexico through our subsidiary <strong>Lafarge</strong> Cementos S.A. de CV<br />
which we acquired in November 1999. Our plant in Mexico is located in Hidalgo State near Mexico City.<br />
Our major competitors are Cemex and Holcim.<br />
We decided in 2003 to commence the construction of a new cement plant close to our existing plant<br />
near Mexico City. This new plant will have an annual production capacity of 600,000 tonnes and will replace<br />
the existing plant which has a capacity 350,000 tonnes per year. The plant is expected to start operations in<br />
2006. The total investment cost including additional reserves is expected to amount to approximately<br />
$120 million.<br />
Sub-Saharan Africa and Indian Ocean<br />
We substantially expanded our operations in Sub-Saharan Africa and the Indian Ocean with the Blue<br />
Circle acquisition, adding operations in Nigeria and Zimbabwe to our existing operations which were<br />
primarily concentrated in South Africa and Kenya. In 2003, the region represented approximately 12.0% of<br />
our cement sales. The companies we consolidated sold 11.2 million tonnes of cement in the region in 2003<br />
compared to 10.2 million tonnes in 2002 and 7.2 million tonnes in 2001.<br />
32
The table below indicates the number of plants and our production capacity by country at December 31,<br />
2003:<br />
Number of Plants<br />
Total Cement<br />
Production Capacity<br />
Country Company Cement Clinker Grinding (in million tonnes)<br />
Nigeria ;;;;;;;;; WAPCo ;;;;;;;; 2 0 1.6<br />
Nigeria ;;;;;;;;; Ashakacem ;;;;;;; 1 0 0.9<br />
Total Nigeria ;;;;;;;;;;;;;;;;;; 3 0 2.5<br />
South Africa ;;;;;;; <strong>Lafarge</strong> South Africa Ltd. ; 1 1 2.4<br />
Kenya ;;;;;;;;;; Bamburi Cement;;;;; 1 1 2.7<br />
Cameroon ;;;;;;;; Cimencam ;;;;;;; 1 1 1.1<br />
Benin ;;;;;;;;;; SCB-<strong>Lafarge</strong> ;;;;;; 1 0 0.6<br />
Zimbabwe ;;;;;;;; Circle Cement ;;;;;; 1 0 0.4<br />
Uganda ;;;;;;;;; Hima Cement Ltd. ;;;; 1 0 0.3<br />
Zambia ;;;;;;;;; Chilanga Cement ;;;; 2 0 0.7<br />
Malawi ;;;;;;;;; Portland Cement ;;;;; 0 1 0.2<br />
Tanzania ;;;;;;;;; Mbeya Cement ;;;;; 1 0 0.3<br />
Madagascar;;;;;;;; Sanca ;;;;;;;;; 1 0 0.1<br />
Total Sub-Saharan Africa ;;;;;;;;;;;; 13 4 11.3<br />
Nigeria. We acquired our operations in Nigeria through our acquisition of Blue Circle. Our operations<br />
are conducted through our subsidiaries West African Portland Cement Company which serves the Lagos<br />
market and Ashakacem plc which serves Northern Nigeria. In August 2003, we inaugurated a new cement<br />
plant in Ewekoro with a capacity of 1 million tonnes per year. Our total installed capacity in 2002<br />
represented approximately 46% of the total rated capacity in Nigeria, as estimated by the most recent edition<br />
of the Global Cement Report. In 2003, Nigeria contributed approximately 32.9% of our cement sales in Sub-<br />
Saharan Africa and Indian Ocean.<br />
The domestic market dropped sharply in 2002, prior to the 2003 presidential election, and recovered<br />
partially in 2003. We sold 3.5 million tonnes of cement in Nigeria in 2003 compared to 3.3 million tonnes in<br />
2002 and 1.3 million tonnes in 2001 (as with the rest of the former Blue Circle operations, this only<br />
represents sales in 2001 consolidated from July 11, 2001). Our competitors in Nigeria are Benue Cement,<br />
Nigerian Cement, Cement Co Northern Nigeria (which is 40% owned by HeidelbergCement), Bendel Cement,<br />
Calabar Cement and various importers.<br />
South Africa. In 2003, South Africa represented approximately 14.4% of our cement sales in Sub-<br />
Saharan Africa and Indian Ocean. We acquired our wholly owned subsidiary, <strong>Lafarge</strong> South Africa Ltd., in<br />
1998. Our operations consist of a cement plant which serves the Johannesburg market and a grinding plant<br />
near Durban. Over the past ten years most producers have been operating at less than 60% of their rated<br />
capacity.<br />
The domestic market improved in 2003 and we sold 1.7 million tonnes of cement in South Africa in<br />
2003 compared to 1.6 million tonnes in 2002 and 1.5 million tonnes in 2001. Our major competitors in South<br />
Africa are Pretoria Portland Cement and Alpha (a subsidiary of Holcim). In November 2002, we sold the<br />
33% interest held by our wholly owned subsidiary, <strong>Lafarge</strong> South Africa, in Natal Portland Cement (‘‘NPC’’)<br />
to Cimpor for approximately 32 million euros.<br />
Kenya and Uganda. In 2003, Kenya represented approximately 8.5% of our cement sales in Sub-Saharan<br />
Africa and the Indian Ocean. Our operations in Kenya are conducted through our subsidiary Bamburi Cement<br />
Ltd., which was operated as a joint venture with Blue Circle prior to our acquisition of Blue Circle in 2001.<br />
Bamburi Cement has an integrated cement plant in Mombasa and a grinding unit in Nairobi. The market<br />
picked up in 2002 after a few years of stagnation due to the condition of the economy and the lack of<br />
government and development funding. Our major competitors in this market are Athi River Mining and East<br />
African Portland Cement, a state-controlled company in which <strong>Lafarge</strong> and Bamburi have a combined<br />
33
minority interest of approximately 40%. Through Bamburi Cement Ltd., we acquired an interest in Hima<br />
Cement Ltd. in 1999, a company which operates a cement plant in Uganda.<br />
Cameroon, Benin and Madagascar. Our subsidiary, Cimenteries du Cameroun, known as Cimencam, is<br />
the sole cement producer in Cameroon. In Benin, we have a 50% interest in SCB-<strong>Lafarge</strong> which operates a<br />
cement plant in Onigbolo. We also have a majority interest in Nouvelle Cimenterie d’Amboanio (‘‘Sanca’’) in<br />
Madagascar.<br />
Zambia, Malawi, Tanzania and Zimbabwe. In 2001 we acquired Pan African Cement Ltd., which holds<br />
controlling stakes in Chilanga Cement plc (Zambia), Portland Cement Company (Malawi) and Mbeya Cement<br />
Company (Tanzania). Pan African Cement was consolidated from May 2001. The business was purchased<br />
from CDC Capital Partners, formerly the Commonwealth Development Corporation, which acquired the<br />
shareholdings as part of each respective government’s privatization program. At the beginning of 2003, we<br />
decided to close the kiln of our cement plant in Malawi so as to optimize the use of our assets on a regional<br />
basis. We acquired our majority owned subsidiary in Zimbabwe, Circle Cement, with the acquisition of Blue<br />
Circle. Circle Cement has a single plant that serves the capital Harare.<br />
Marine Cement. Marine Cement acts mainly as an importer and distributor of cement in Mauritius, Sri<br />
Lanka, the Maldives, Reunion and the Seychelles. Marine Cement sold 2.2 million tonnes of cement in 2003<br />
compared to 1.5 million tonnes in 2002 and 2001. Marine Cement purchases its cement from our own<br />
subsidiaries, including Bamburi Cement in Kenya and Semen Andalas in Indonesia, and from third-party<br />
suppliers.<br />
Asia Pacific<br />
In 2003, the Asia Pacific Region represented approximately 14.2% of our cement sales. We believe that<br />
long-term growth prospects for the region remain very favorable. The companies we consolidated sold<br />
23.1 million tonnes of cement in the region in 2003 compared to 21.1 million tonnes in 2002 and 14.4 million<br />
tonnes in 2001.<br />
The table below indicates the number of plants and our production capacity by country at December 31,<br />
2003:<br />
Number of Plants<br />
Total Cement<br />
Production Capacity<br />
Country Company Cement Clinker Grinding (in million tonnes)<br />
Malaysia ;;;;;;;;; Malayan Cement Berhad ; 3 1 12.0<br />
India ;;;;;;;;;;; <strong>Lafarge</strong> India Ltd.;;;; 2 1 5.0<br />
South Korea ;;;;;;;; <strong>Lafarge</strong> Halla Cement ;; 2 1 7.5<br />
Philippines ;;;;;;;; <strong>Lafarge</strong> Philippines ;;; 6 2 10.0<br />
Indonesia ;;;;;;;;; P.T. Semen Andalas ;;; 1 0 1.3<br />
China ;;;;;;;;;; Beijing Chinefarge Cement 1 0 0.7<br />
Shunfa <strong>Lafarge</strong> Cement ; 1 0 0.4<br />
<strong>Lafarge</strong> Dujiangyan Cement 1 0 1.4<br />
<strong>Lafarge</strong> Chongqing Cement 1 0 0.8<br />
Total China ;;;;;;;;;;;;;;;;;;; 4 0 3.3<br />
Total Asia ;;;;;;;;;;;;;;;;;;; 18 5 39.1<br />
Malaysia. We operate in Malaysia through our majority owned subsidiary, Malayan Cement Berhad,<br />
which we acquired with our acquisition of Blue Circle. Malayan Cement Berhad is the leading cement<br />
producer in Malaysia. In2003, Malaysia contributed approximately 30.2% of our cement sales in Asia Pacific.<br />
Our total installed capacity represented approximately 45% of the total rated clinker capacity in Malaysia, as<br />
estimated by the most recent edition of the Global Cement Report. Our three cement plants and our grinding<br />
plant in Malaysia are located to serve the whole of Malaysia and the export market. We exported<br />
approximately 26% of our production in 2003. We sold 6.4 million tonnes of cement in Malaysia in 2003<br />
compared to 5.5 million tonnes of cement in 2002 and 2.9 million tonnes in 2001 (as with the rest of the<br />
34
former Blue Circle operations, this only represents sales in 2001 consolidated from July 11, 2001). In 2002,<br />
the market remained positively oriented in the first half of the year, but it slowed slightly in the second half<br />
of the year due to the impact on the construction industry of the deportation of illegal foreign construction<br />
workers. The market picked up again in 2003 thanks to the resolution of the status of foreign construction<br />
workers and continued development.<br />
Our major competitors in Malaysia are Tasek Corporation, Renong, CMS Cement, Perak Hanjoong and<br />
Tenggara (which is 100% owned by Holcim).<br />
India. In 2003, India represented approximately 18.4% of our cement sales in Asia Pacific. We initially<br />
entered the Indian market when we acquired the cement plants of the Tata Iron and Steel Co. cement division<br />
in November 1999. In January 2001 we further expanded our operations when we paid approximately<br />
112 million euros for the cement division of Raymond Ltd. which has a 2.2 million tonnes capacity cement<br />
plant located in Chattisgarh state. Following the Raymond acquisition we believe, based on our experience in<br />
this industry, we are the market leader in the Eastern region of India. We sold 3.6 million tonnes of cement<br />
in the region in 2003 compared to 3.9 million tonnes in 2002 and 3.3 million tonnes in 2001. Our major<br />
competitors in the region are Associated Cement Company, Gujarat Ambura Cement Ltd., Larsen & Toubro,<br />
Grasim and Century.<br />
South Korea. In 2003, South Korea represented approximately 16.5% of our cement sales in Asia Pacific.<br />
We acquired our 39.9% interest in <strong>Lafarge</strong> Halla Cement in January 2000. Our partners in <strong>Lafarge</strong> Halla<br />
Cement include the Halla Group and The State of Wisconsin Investment Board. We operate a cement plant<br />
located in the North East of the country on the Sea of Japan, and since May 2002, a clinker plant at<br />
Samchok, also in the North East of the country, which was acquired from KDB (Korea Development Bank).<br />
After a severe downturn in 1998 and 1999 that saw consumption drop by almost a third, the cement market<br />
recovered in 2000 and stabilized in 2001. In 2002, the overall improvement of economic conditions translated<br />
into an increase of 8% of the cement consumption. In March 2002 we formed a joint-venture between our<br />
39.9% owned subsidiary <strong>Lafarge</strong> Halla Cement and Tong Yang Major Corporation, a Korean-based cement<br />
company. Our minority interest in that joint-venture was subsequently sold to Tong Yang Major Corporation<br />
in December 2003 for 123 million euros.<br />
<strong>Lafarge</strong> Halla Cement sold 8.0 million tonnes of cement in South Korea in 2003 compared to 7.2 million<br />
tonnes in 2002 and 6.5 million tonnes in 2001 (3.2, 2.9 and 2.6 million tonnes in 2003, 2002 and 2001<br />
respectively on the basis of our percentage on interest). Our major competitors in the country are Ssanyong,<br />
Sungshin, Hyundai and Hanil.<br />
Philippines. In 2003, the Philippines represented approximately 15.4% of our cement sales in Asia<br />
Pacific. We operate in the Philippines through our wholly owned subsidiary, <strong>Lafarge</strong> Philippines, and its<br />
holdings including those acquired with the acquisition of Blue Circle. We believe, based on our experience in<br />
this industry, that our holdings constitute together the largest producer of cement in the Philippines. We first<br />
entered the Philippines in 1998 when we acquired interests in both Continental Operating Corporation and<br />
South East Asia Cement Holdings Inc. (Seacem) whose principal plants are located on the island of Luzon<br />
near Manila. The four cement plants in which we acquired interests through the Blue Circle acquisition are<br />
located to serve metropolitan Manila, northern and southern Luzon, Visayas and Mindanao.<br />
Cement consumption in the Philippines is low by Asian standards, however, we estimate cement<br />
consumption has been growing at an average rate of over 7% per annum over the last decade and according<br />
to Global Cement Report estimates, the total cement market amounted to approximately 10.9 million tonnes<br />
in 2002. In 2003, demand was slightly lower than in 2002 although our volumes improved overall during the<br />
year.<br />
We sold 4.2 million tonnes of cement in the Philippines in 2003 compared to 3.7 million tonnes in 2002<br />
and 2.0 million tonnes in 2001 (Blue Circle operations being consolidated from July 11, 2001). Our major<br />
competitors in the country are Holcim and Cemex.<br />
Bangladesh. In Bangladesh, our subsidiary, <strong>Lafarge</strong> Surma Cement, commenced the construction of a<br />
1.2 million tonnes greenfield plant on the Surma river for a total estimated project cost of 255 million dollars.<br />
The new plant is financed in part through project financing arrangements with a syndicate organized by the<br />
35
World Bank and the Asian Development Bank. Our majority interest in <strong>Lafarge</strong> Surma Cement is held<br />
though a 50/50 joint venture established with Cementos Molins.<br />
Indonesia. We operate in Indonesia through P.T. Semen Andalas of which we acquired control in 1994.<br />
Our plant is located in Aceh at the Northern tip of Sumatra. Our major competitors are Gresik (in which<br />
Cemex has a 25.5% interest), Indocement and Cibinong (in which Holcim has an equity interest of about<br />
77%). We sold 1.1 million tonnes of cement in Indonesia in 2003 compared to 1.2 million tonnes in 2002 and<br />
1.1 million tonnes in 2001.<br />
China. We currently have two cement plants serving the Beijing market which we operate through our<br />
majority owned subsidiaries Beijing Chinefarge Cement Ltd. and Beijing Shunfa <strong>Lafarge</strong> Cement. We<br />
acquired our Shunfa plant in early 2002. The Chinese state development investment company and a Chinese<br />
cement company respectively hold 15% and 20% of Beijing Chinefarge Cement, and a local Chinese partner<br />
holds 30% of Beijing Shunfa <strong>Lafarge</strong> Cement. We completed the construction of a 1.4 million tonnes<br />
integrated cement plant in Chengdu in the Sichuan province and commenced commercial operations in mid<br />
2002. The plant was financed, in part, through project financing arrangements with the World Bank.<br />
We purchased in June 2003 a 70% stake in the share capital of a cement plant in Chongqing, a town<br />
also situated in the Sichuan Province for approximately $30 million. In December 2003, we announced our<br />
decision to build a second production line at the plant to meet the very strong growth in the local cement<br />
market. This $40 million investment is expected to increase the plant’s existing cement capacity of 800,000<br />
tonnes per year by one million tonnes.<br />
Japan. In September 2001, our majority owned subsidiary, <strong>Lafarge</strong> Japan Holding, paid 70 million euros<br />
for a 39.4% of the equity of a new company, Aso Cement, Co. Ltd., which took over Aso Corporation’s<br />
cement related business assets, including two plants in Kyushu with a combined cement capacity of 3 million<br />
tonnes. We account for our 22.45% ownership interest in Aso Cement, Co. Ltd. using the equity method.<br />
Trading activities<br />
In order to increase our international sales and explore new markets without the necessity of immediately<br />
making investments in new production facilities, we created our Cementia Trading subsidiary, a separate<br />
entity within <strong>Lafarge</strong> that focuses on cement trading. Through Cementia Trading we purchased and sold<br />
approximately 6.5 million tonnes of cement and clinker in 2003 (these volumes are included in the volumes<br />
reported sold by geographic zone above). Approximately 60% of this amount consisted of exports from our<br />
operations, including those in Greece, Malaysia and Romania, and the rest was purchased from third parties<br />
in Indonesia, Japan, Venezuela and Colombia. Our trading network also enables us to distribute cement from<br />
countries where we have excess capacity to regions around the world where it is in demand. This helps us to<br />
maximize the capacity utilization of our facilities worldwide while reducing our exposure to the inherent<br />
cyclical nature of the cement industry. Our trading activities constitute a fundamental part of our strategic<br />
goals by allowing international development through careful, calculated steps, while at the same time<br />
satisfying worldwide demand where required.<br />
Capital expenditures<br />
Cement is a capital intensive business. In the periods ended December 31, 2003, 2002 and 2001 our<br />
capital expenditures in the Cement division related to the on-going upgrading and modernization of existing<br />
industrial operations around the world and on organic growth through the building of new production<br />
facilities totaled 397, 656 and 883 million euros, respectively. Our capital expenditures in the Cement<br />
division accounted for approximately 60% of our overall capital expenditures in the three-year period.<br />
The principal capital expenditures (in excess of 20 million euros) in the three-year period from 2001 to<br />
2003 for the modernization or replacing of existing plants and equipment included:<br />
s North America: increased capacity at the former Blue Circle Roberta plant (Alabama) (2001 & 2002),<br />
increased capacity at the Sugar Creek plant (Missouri) (2001 & 2002) and construction of slag<br />
production and grinding facilities in Chicago (2001 & 2002)<br />
36
s Central Europe: construction of a new production line (dry process) in Kujawy, Poland (2001, 2002 &<br />
2003)<br />
s Mediterranean Basin: modernization of the Meknes plant in Morocco and the new line in Tetouan<br />
(2001, 2002 & 2003) and a new line at our plant in Alexandria, Egypt (2001 & 2002)<br />
s Latin America: construction of a new cement plant near Mexico City, Mexico (2003)<br />
s Sub-Saharan Africa and Indian Ocean: increased capacity at the former Blue Circle plant at Ewekoro<br />
in Nigeria (2001, 2002 & 2003)<br />
s Asia Pacific: construction of a greenfield plant in Dujiangyan, China (2001 & 2002)<br />
We also invested approximately 1,202 million euros in the three-year period on various acquisitions that<br />
expanded our market and geographical presence. These exclude our acquisition of Blue Circle, for a total<br />
amount of 5,322 million euros in 2001.<br />
In 2004, the level of our capital expenditures will depend on general market conditions. We expect<br />
capital expenditures in the division to total approximately 600 to 700 million euros, excluding new<br />
acquisitions. We intend to invest in projects that maintain or improve the performance of our plants.<br />
Our 2004 capital expenditures include portions of the cement plants and facilities in Poland, Morocco<br />
and China and the construction of new plants in Mexico and Bangladesh. We also intend to take advantage in<br />
2004 of selected acquisition opportunities.<br />
We financed our capital expenditures in all of our divisions with operating cash flows which totaled 2.1<br />
billion euros, 1.8 billion euros, and 1.8 billion euros in 2003, 2002 and 2001, respectively, while investments<br />
(capital expenditures and acquisitions net of proceeds of disposals) reached 0.7 billion euros, 0.8 billion euros<br />
and 4.7 billion euros, respectively. The difference in 2001 was funded through additional debt financing.<br />
Aggregates & Concrete<br />
With sales of approximately 4.5 billion euros Aggregates & Concrete (including sales of our asphalt,<br />
road contracting and pre-cast concrete products) contributed 32.7% of our sales in 2003 and 14.6% of our<br />
operating income on ordinary activities. The Aggregates & Concrete division’s after-tax return on capital<br />
employed in 2003 was 6.8%. At December 31, 2003, we had 20,547 employees in the Aggregates &<br />
Concrete division.<br />
<strong>Lafarge</strong> is a leading international supplier of aggregates, asphalt and ready mix concrete. On the basis of<br />
the volumes of concrete and aggregates sold in 2003, we estimate we are the world’s second largest producer<br />
of aggregates and ready mix concrete with significant market positions in Western Europe and North<br />
America. At December 31, 2003 the companies we consolidated (global and proportionate) operated 655<br />
quarries and 1,073 ready mix concrete plants in 22 countries. In addition, we also produce asphalt and precast<br />
concrete products and we are active in road contracting and surfacing in North America and the United<br />
Kingdom.<br />
In 2003, the companies we consolidated (global and proportionate) had sales volumes of 214.0 million<br />
tonnes of aggregates and 34.4 million m3 of ready mix concrete.<br />
We manage our aggregates, concrete and asphalt businesses in the same division because:<br />
s the customer bases for these three product lines are similar,<br />
s logistical constraints inherent to these businesses require the service of local markets through large<br />
numbers of operational units, and<br />
s it is generally most efficient to produce ready mix concrete and asphalt at our aggregate quarries as<br />
this co-location allows us to share management, equipment, services and marketing and reduces our<br />
logistic costs, thus reducing our overall production costs.<br />
We initially entered the ready mix concrete business as part of our strategy to vertically integrate our<br />
cement operations and subsequently expanded upstream into aggregates. Ready mix concrete producers are<br />
37
the largest consumers of cement in some of the major markets in which we are present. Vertical integration<br />
was pursued to better manage distribution channels, and to give us direct contact with the end-users of<br />
cement. We expanded into aggregates to secure the supply of raw materials and to profitably exploit our core<br />
competences in the geological, operational, environmental and regulatory aspects of quarrying operations<br />
which we had acquired through our cement operations. We have now expanded into asphalt in North America<br />
and the United Kingdom and this provides further outlets for our aggregates resources in a less cyclical<br />
business. Our goals for the coming years are to pursue a growth strategy in aggregates in developed countries<br />
and to improve our operational performance.<br />
The table below indicates the breakdown of our sales by destination in 2003, 2002 and 2001:<br />
Aggregates & Concrete Sales(1) by Destination<br />
Year ended December 31,<br />
Geographic Area 2003 2002 2001(2)<br />
(in million euros, except percentages)<br />
Western Europe;;;;;;;;;; 1,845 41.3% 1,856 38.9% 1,770 36.8%<br />
North America ;;;;;;;;;; 2,130 47.7% 2,405 50.5% 2,594 54.0%<br />
Other Zones ;;;;;;;;;;; 490 11.0% 507 10.6% 442 9.2%<br />
Total ;;;;;;;;;;;; 4,465 100.0% 4,768 100.0% 4,806 100.0%<br />
(1) Including sales of our asphalt, road contracting and pre-cast concrete products.<br />
(2) Including the former Blue Circle operations from July 11, 2001.<br />
General information regarding our products, industry and markets<br />
Our products<br />
Aggregate (sand, gravel and crushed rock) is used as a base material in roads, landfill and buildings and<br />
as raw material for concrete, masonry, asphalt and many industrial processes. In North America and the<br />
United Kingdom we also produce asphalt, which consists of dried aggregate mixed with a binding medium of<br />
5-10% of heated liquid bitumen, a by-product of the petroleum refining process. Asphalt is used for road<br />
surfacing and paving and we act as road surfacing contractors.<br />
Ready mix concrete (a blend of aggregate, water, cement and chemical admixtures) is used for a variety<br />
of applications from curbs and sidewalks to foundations, highways and buildings. Currently, we market a<br />
wide range of concrete mixes from industry standard mixes, with good tensile strength and durability, to<br />
specialty concretes which, for example, offer customers ease of placement under various weather or<br />
construction conditions, cost efficient/fit for purpose products and products with specific technical qualities.<br />
We have research and development resources dedicated to providing differentiated concrete mixes for specific<br />
purposes, and have recently developed two new products; AgiliaÒ, which offers clients such qualities as<br />
superior coverage and filling abilities, self-leveling surfaces and enhanced durability and appearance, and<br />
DuctalÒ which is a ductile concrete, meaning it can ‘‘bend’’ without breaking, and which has ten times the<br />
compressive strength of traditional concrete. In North America and the United Kingdom we also produce precast<br />
concrete products. Our pre-cast concrete products include paviers and paving slabs used in sidewalks and<br />
drives and concrete building blocks for residential and commercial construction.<br />
Who buys the products of our Aggregates & Concrete division, our customer orders and backlog?<br />
Our products are generally supplied at a local level directly to the end user and we sell to thousands of<br />
unaffiliated customers. Our customers for aggregates include ready mix concrete producers, manufacturers of<br />
pre-cast concrete products (pipes, curbs, building blocks, block pavers), asphalt producers, road contractors,<br />
masons and construction companies of all sizes. Aggregates also have numerous industrial applications and<br />
specialty aggregates are used, for example, by the steel industry and by numerous industrial, agricultural and<br />
manufacturing sectors. The primary customers for ready mix concrete and pre-cast concrete products are<br />
construction and road contractors of all sizes from major international construction companies to small<br />
38
esidential builders, farmers or do-it-yourself enthusiasts. Asphalt is sold to road contractors for the<br />
construction of highways, driveways and parking lots and directly to state and local authorities.<br />
We have no exclusive distribution or long-term supply contracts for ready mix concrete, pre-cast<br />
concrete products or asphalt, other than supply contracts to specific jobs which have been the subject of<br />
competitive tender. These are generally made on the basis of competitive prices in each market area, pursuant<br />
to current orders from customers on short notice who purchase quantities sufficient for their requirements.<br />
With regard to aggregates, we do have some requirements contracts for specific production plants<br />
manufacturing ready mix concrete, asphalt and pre-cast concrete products. These contracts tend to be<br />
negotiated annually. The amount of backlog orders, as measured by written contracts, is normally not<br />
significant.<br />
Where do we get our aggregates and what are our reserves?<br />
There are essentially three primary sources of aggregates: land-won sand and gravel, hard rock and<br />
marine sand and gravel. The production of recycled (recycled concrete or asphalt) and secondary (such as<br />
steel or mine waste) aggregates is also increasing. In 2003 approximately 58% of our production was hard<br />
rock and 42% was sand and gravel.<br />
The different types of aggregate are generally substitutable, depending on their uses and the<br />
corresponding physical specification requirements (granularity, hardness, etc). The choice of aggregate for a<br />
particular purpose also depends largely on the local geology or availability. In certain areas only one or two<br />
types of aggregate will be readily available. As aggregates are expensive to transport relative to their price,<br />
the cost of transport will generally limit the availability of aggregates to what is readily accessible in the<br />
local area.<br />
The aggregate manufacturing process varies slightly depending on whether crushed rock or sand and<br />
gravel are used. The rock (usually either limestone or granite) is blasted from quarries and then crushed,<br />
ground and screened to meet end user specifications. Sand and gravel requires less crushing but as with rock<br />
also requires grading and screening to different sizes (generally 8mm to 80mm). Rock particularly can have<br />
different hardness and crushing characteristics which makes it suitable for higher specification uses (e.g. road<br />
building).<br />
We currently estimate that we have control of approximately 9.3 billion tonnes of proven and authorized<br />
aggregates reserves in 2003. We have sustained the level of our reserves through various acquisitions and<br />
successful permit applications. We believe that the quantities of proven and authorized reserves at our<br />
aggregates facilities are sufficient to result in an average life in excess of 35 years at present operating levels.<br />
We also have access to considerable aggregate reserves for which we have either not yet requested or not yet<br />
received an extraction permit. We expect to gain the necessary permits for a significant portion of these in<br />
due course.<br />
How are our ready mix concrete and pre-cast concrete products made and what are the costs of production?<br />
Ready mix concrete generally consists of approximately 85 to 90% of dried aggregate which is<br />
combined with water and with 10-15% of cement and other cementitious substitutes that acts as a binding<br />
medium. Ready mix concrete is produced at light industrial plants. The plants comprise storage facilities for<br />
the main raw materials and equipment for combining the dry materials to the required specification. The<br />
concrete is either mixed at the plant or in special mixer trucks. One cubic meter in volume of ready mix<br />
concrete can be mixed utilizing standard machinery in about three minutes.<br />
Special additives may be included to give concrete a particular quality. Computerized systems add<br />
requisite quantities of additives such as retarding or accelerating agents plus water during the mixing process.<br />
For example, one of the key ingredients of our patented DuctalÒ concrete is strands of metallic or organic<br />
fibers, which are a key component in its extraordinary compression and traction strength.<br />
Ready mix concrete also has a service aspect involving the on-time delivery of the quantity and quality<br />
of product ordered at the location specified by the customer. This aspect of the business requires significant<br />
logistical know-how. In a typical ready mix concrete plant raw materials will comprise about 85% of total<br />
39
production costs. Raw material prices can vary considerably between the various markets in which we<br />
operate. Over half of the raw material costs relate to cement and in our ready mix concrete operations we<br />
have expended great efforts in adjusting our formulations to optimize our raw material usage for a given<br />
standard of concrete. Cement prices have not been volatile in our major markets in Western Europe and<br />
North America. In order to achieve greater flexibility and better control over our transportation costs, we have<br />
increasingly moved toward subcontracting our transport operations and we now subcontract approximately<br />
90% of our ready mix concrete transportation outside of North America.<br />
In the manufacture of pre-cast block paving and concrete blocks, the concrete is normally manufactured<br />
on site near a source of aggregates and both the paving units and the blocks are formed using mould boxes.<br />
The material is compacted either by pressure or vibration or a combination of the two. The paving and blocks<br />
are sold in standard sizes, which can vary between markets and the types of block are further differentiated<br />
according to their end use primarily by the materials from which they are manufactured: naturally occurring<br />
aggregates in the case of dense aggregate blocks, blast furnace slag/clinker or artificial aggregates in the case<br />
of light aggregate blocks and pulverized fly ash or sand in the case of autoclaved aerated blocks.<br />
How is our asphalt made?<br />
Asphalt, like ready mix concrete, is produced at light industrial plants. The plants comprise storage<br />
facilities for the main raw materials (bitumen and different grades of aggregates), equipment for combining<br />
and hot mixing the materials to the required specification and computerized systems for the addition of the<br />
requisite quantities of bitumen whilst the ingredients are mixed. Our asphalt plants range in output from 5,000<br />
to 500,000 tonnes per year. Generally, asphalt consists of approximately 90 to 95% of dried aggregate with<br />
5-10% of heated liquid bitumen that acts as a binding medium. Bitumen is a by-product of the petroleum<br />
refining process, the price of which is tied to oil prices, which can be volatile.<br />
Our markets and industry<br />
General. We have built up our aggregates and ready mix concrete businesses over a number of years but<br />
the most significant growth came with our acquisition of Redland in 1997 which almost doubled the size of<br />
our business. In addition, we often acquire new concrete and aggregate operations in connection with a<br />
cement acquisition. We endeavor to restrict our concrete and aggregate operations to countries where the<br />
nature and enforcement of regulations ensure that we are operating on a ‘‘level playing field’’. We seek to<br />
avoid operating in countries where regulations are not enforced or non-existent and where local operators are<br />
not obliged to follow the same environmental and labor standards thus giving them an unfair competitive<br />
advantage.<br />
In the Western European and North American markets, where we have the bulk of our operations, the<br />
levels of aggregates, asphalt and ready mix concrete demand at a national level generally move in line with<br />
the consumption of cement. Demand is seasonal and tends to be less in the winter months in temperate<br />
countries and in the rainy season in tropical countries.<br />
As with cement, the aggregates, asphalt and concrete industries are cyclical and dependent on the level<br />
of activity in the construction industry and level of public infrastructure spending. However, it is not<br />
economical to ship aggregates over large distances and ready mix concrete and asphalt cannot be transported<br />
over distances that involve more than about one hour of traveling time. Furthermore, apart from a few<br />
‘‘specialized products’’, aggregates, asphalt and ready mix concrete are essentially viewed as a commodity.<br />
Brand recognition and loyalty thus play little role in sales of any of these products. The determining factors<br />
in the selection of an aggregate, ready mix or asphalt producer are thus locality, quality, reliability of service<br />
and price rather than brand. Demand for all of these products is very fragmented as choice of provider and<br />
supply takes place within a local market. Demand for aggregates, concrete and asphalt thus depends on<br />
micro-market conditions and can vary dramatically within a national market.<br />
Aggregates. The competitive situation in aggregates is favorable to incumbent producers, as the opening<br />
of new aggregate sources is constrained by environmental and planning laws in many countries. Aggregate<br />
producers do frequently have a competitive advantage in those local markets where there are limited<br />
aggregate reserves. Nevertheless, substantial aggregates capacity is already in operation in most markets.<br />
40
Additionally, to the extent that new permits can be obtained and deposits are available, moderate capital<br />
investment is required to bring additional aggregate sources into production.<br />
We estimate that the cost of a new plant and equipment to extract and process industrial minerals for a<br />
typical small quarry with an output of 250,000 to 500,000 tonnes per annum would be of the order of<br />
2 million euros. With a large quarry with an output in excess of 1 million tonnes per annum costs would rise<br />
to 7 to 25 million euros while a super quarry may cost in excess of 45 million euros. These figures exclude<br />
site and mineral costs.<br />
We believe we have a strong competitive position in aggregates. Our market positions and operational<br />
expertise enable us to optimize returns from our investments. We are continuously seeking to improve our<br />
operational performance through performance improvement programs. We believe our knowledge of the<br />
construction markets enables us to ensure that we acquire only well located reserves and businesses and we<br />
believe that our environmental reputation for responsible land restoration enables us to obtain new permits<br />
more easily and encourages landowners to deal with us as operator of choice.<br />
Ready mix concrete. Ready mix production has relatively few barriers because of the low capital outlay<br />
required and the fact that the raw materials are generally plentiful and competitively priced. The concrete<br />
business in each micro market thus tends to be price constrained by the ability of competitors to quickly<br />
bring new capacity to market.<br />
In each country in which we operate we aim to place our ready mix concrete plants in clusters in each<br />
micro market in which we operate in order to optimize our delivery flexibility, capacity and backup<br />
capability. The capacity of our plants varies depending upon market circumstance from 5 to 300 thousand<br />
m3. We evaluate each micro market in which we operate periodically and dismantle and move plants to<br />
locations where they can be used more profitably if we find a micro market is suffering from overcapacity or<br />
is a falling market. Recently we have increased the number of mobile plants we operate since these plants<br />
can be moved more easily and have the flexibility to be placed on temporary sites (including our clients’<br />
sites) to meet local peaks in demand.<br />
We believe that developing new ready mix concrete products, such as DuctalÒ and AgiliaÒ, will enable<br />
us to increasingly compete on the basis of quality and product differentiation. We also believe that by<br />
providing better technical support and service than our competitors we can differentiate ourselves on the basis<br />
of level of service and charge a corresponding premium. Our performance improvement program in our ready<br />
mix concrete operations has continued to provide benefits of improved performance as through its ongoing<br />
implementation.<br />
Asphalt. As with ready mix concrete, it is essential to deliver asphalt in usable form to the customer<br />
within a short period of mixing and customer sites are thus generally located within relatively short distances<br />
of the asphalt plant. The asphalt will usually be mixed from early morning and throughout the day for<br />
delivery to the road construction site at intervals to enable the contractor to maintain a steady flow of work.<br />
Sales are, on the whole, made directly between the asphalt producer and the customer, with only very limited<br />
use of intermediate distributors or agents since prompt and reliable delivery in insulated vehicles is a key<br />
element of the service provided by asphalt companies to their customers. We subcontract delivery of the<br />
asphalt to ‘‘owner/operators’’ who provide a full haulage service. However, asphalt has a higher entry cost<br />
requirement than ready mix concrete as the capital cost of a typical asphalt plant is around 1.2 million euros<br />
in comparison to 400,000 euros for a ready mix concrete plant.<br />
Our geographic markets<br />
Our major markets in Western Europe are France and the United Kingdom, which represented<br />
approximately 49.9% and 31.9% respectively, of our Aggregates & Concrete sales in this area in 2003. We<br />
are also present to a lesser extent in Greece, Austria and Italy and through a joint venture with RMC in Spain<br />
and Portugal. In North America our primary markets are in Eastern and Western Canada, Colorado, New<br />
Mexico, Kansas, Louisiana, Missouri, Ohio, Maryland, Pennsylvania, West Virginia, Wisconsin, Georgia and<br />
Alabama. Outside of Western Europe and North America, we have operations in Turkey, South Africa,<br />
41
Poland, Romania, the Middle East, Morocco, China, Malaysia and Singapore. In Central and Southern<br />
America we have operations in Brazil, Venezuela and Chile.<br />
In aggregates and ready mix concrete we regularly acquire small independent operators. From time to<br />
time we acquire larger operations when the opportunity arises and, additionally, assume control of aggregates<br />
and concrete assets which have been acquired via larger cement acquisitions. For example, the Blue Circle<br />
acquisition in 2001 brought not only significant aggregates and ready mix positions in Georgia and Alabama<br />
in North America, but also positions in Greece, Malaysia, Singapore and Chile.<br />
In 2003 we downsized our ready mix concrete presence in Brazil and Greece and disposed of our<br />
highway paving activities in North America and of part of the assets of our concrete product business in the<br />
United Kingdom.<br />
The following table shows our volumes and number of sites, broken down by geographic area, for 2003.<br />
The sales volume figures we have provided for each country or geographic zone are the total volumes sold in<br />
each particular country or zone by all of our consolidated subsidiaries, including volumes sold to our other<br />
divisions and adjusted to reflect our percentage of interest in our proportionally consolidated subsidiaries.<br />
Number of Sites Volumes Sold in 2003<br />
Geographic Area<br />
Aggregates Ready mix concrete<br />
At December 31, 2003<br />
Aggregates<br />
(in million tonnes)<br />
Ready mix concrete<br />
(in million m 3 )<br />
Western Europe ;;;; 202 562 74.4 14.3<br />
France ;;;;;;;;; 121 256 42.6 6.3<br />
United Kingdom ;;;;; 56 107 20.0 2.3<br />
Spain/Portugal* ;;;;; 18 160 9.9 3.6<br />
Greece ;;;;;;;;; 3 23 1.4 1.5<br />
Other ;;;;;;;;; 4 16 0.5 0.6<br />
North America ;;;;; 391 289 120.6 10.7<br />
Canada ;;;;;;;; 285 146 55.6 4.7<br />
United States ;;;;;; 106 143 65.0 6.0<br />
Other Zones ;;;;;; 62 222 19.0 9.4<br />
South Africa ;;;;;; 20 40 5.0 1.4<br />
Brazil ;;;;;;;;; 4 44 2.0 0.6<br />
Chile ;;;;;;;;; 3 32 2.7 1.9<br />
Malaysia/Sing.;;;;;; 1 47 0.4 3.0<br />
Turkey ;;;;;;;;; 5 18 2.0 1.3<br />
Other ;;;;;;;;; 29 41 6.9 1.2<br />
Total ;;;;;;; 655 1,073 214.0 34.4<br />
* Our Spanish and Portuguese operations are conducted through a joint venture with RMC plc.<br />
In North America, Western Europe and in emerging markets, we face competition from numerous<br />
independent operators. However, the aggregates industry in particular is in the early stages of consolidation<br />
and we face competition from regional and international producers such as Vulcan Materials and Martin<br />
Marietta Materials in the United States and Hanson and CRH internationally. In the United Kingdom this<br />
process of consolidation has reached the stage where the five major producers control approximately 75% of<br />
the market.<br />
In ready mix concrete the tendency towards consolidation is less pronounced but we still face<br />
competition from firms such as RMC, HeidelbergCement, Holcim, Hanson, CRH and CSR both in North<br />
America and internationally. Our strategy of vertical integration of concrete and cement operations has also<br />
been followed by our major competitors in the cement markets such as Holcim, Cemex and CRH and in the<br />
other direction by RMC.<br />
42
Capital expenditures<br />
Capital expenditures in the periods ended December 31, 2003, 2002 and 2001 in the Aggregates &<br />
Concrete division related to the on-going upgrading and modernization of existing industrial operations<br />
around the world and on organic growth through the building of new production facilities totaled 168, 204<br />
and 256 million euros, respectively. We also invested approximately 153 million euros in the three-year<br />
period on various acquisitions that expanded our market and geographical presence. Our capital expenditures<br />
in the Aggregates & Concrete division accounted for approximately 19.5% of our overall capital expenditures<br />
in the three-year period.<br />
There were no individual investment projects in Aggregates & Concrete which exceeded 20 million<br />
euros in the three-year period from 2001 to 2003.<br />
In 2004, the level of our capital expenditures will depend on general market conditions. We expect<br />
capital expenditures to total approximately 180 to 250 million euros, excluding new acquisitions. We intend<br />
to invest in projects that maintain or improve the performance of our plants. We also intend to take advantage<br />
in 2004 of selected acquisition opportunities in Europe and North America.<br />
For information about our financing of capital expenditures, see ‘‘Capital Expenditures — Cement’’<br />
above.<br />
Roofing<br />
In 2003, sales of the Roofing division amounted to approximately 1.5 billion euros. Roofing represented<br />
11.1% of our sales in 2003 and 7.3% of our operating income on ordinary activities. The Roofing division’s<br />
after tax return on capital employed in 2003 was 4.8%. At December 31, 2003 we had 11,901 employees in<br />
the Roofing division.<br />
We acquired our roofing business in December 1997 as part of our acquisition of Redland and we<br />
believe, based on our experience in this industry, we are the world’s largest producer of concrete and clay<br />
roof tiles. At the end of 2003, the companies we consolidated (global and proportionate) operated 156<br />
production sites in 33 countries. We are principally based in Western Europe (which represented 75.4% of<br />
our sales in 2003) but we are also present in North America, through a joint venture with Boral, which<br />
represents 7.2% of our total roofing sales, and are expanding into other regions including Asia Pacific, which<br />
currently represent 17.4% of our sales.<br />
We estimate we provide enough roofs tiles to cover around 1.5 million buildings per year and the<br />
companies we consolidated (global and proportionate) sold 128.5 million m 2 of concrete roof tiles,<br />
25.9 million m 2 of clay roof tiles and 2.8 million meters of chimneys in 2003.<br />
Our goals for the coming years are to consolidate our positions in Europe in concrete roof tiles, clay roof<br />
tiles and roofing components and to develop progressively in emerging countries.<br />
The table below indicates the breakdown of our sales by destination in 2003, 2002 and 2001:<br />
Roofing Sales by Geographic Area<br />
Year ended December 31<br />
Geographic Area 2003 2002 2001<br />
(in million euros, except percentages)<br />
Western Europe;;;;;;;;;; 1,138 75.4% 1,162 75.6% 1,261 79.4%<br />
North America ;;;;;;;;;; 109 7.2% 121 7.9% 131 8.3%<br />
Other Zones ;;;;;;;;;;; 263 17.4% 255 16.5% 193 12.2%<br />
Total ;;;;;;;;;;;; 1,510 100.0% 1,538 100.0% 1,585 100.0%<br />
We have a significant presence in emerging markets (we define emerging markets as our Other Zones<br />
excluding Japan, Australia and New Zealand).<br />
43
Our roofing products and their applications<br />
Our roofing products are designed for pitched roofs. Pitched roofs are the traditional form of European<br />
roofing and predominate in the residential market in Western Europe and North America. Pitched roofs are<br />
generally covered with tiles, shingles, metal sheets, metal tiles or fiber cement. Flat roofs are most commonly<br />
used in commercial buildings, but are also used in some residential structures, such as the row houses of the<br />
U.S. Eastern seaboard cities. Flat roofs are normally covered with roofing felt and tar and products designed<br />
for pitched roof, are not common on flat roofs.<br />
A pitched roof is generally far more expensive to install than a flat roof both in terms of materials and<br />
labor costs but has a longer life expectancy, with clay or concrete tile roofs lasting up to 50 years as<br />
compared to the 10-15 year average for a flat roof.<br />
Roofing material markets are characterized by regional needs and traditions. Climatic conditions and<br />
historic availability of building materials have led to a diversity of building traditions between regions.<br />
Depending on the region, not only do the pitch and construction of the roofs vary, but also the profile,<br />
material and color of the roofing materials. In Europe, concrete and clay tiles dominate the pitched roof<br />
market, but the style of tile varies considerably between each country. In North America the market has<br />
traditionally favored low-cost, easily installed cladding materials such as asphalt shingles for pitched roofs,<br />
which have a shorter life span.<br />
Roofing Products. Our roofing products represented approximately 88.5% of our total sales in the<br />
Roofing division worldwide. We offer a line of products that comprise entire roofing systems providing<br />
complete solutions for pitched roofs including:<br />
s Roof tiles. Sales of roof tiles represent approximately 68.3% of our overall sales in roofing. Through<br />
innovation in production and coating technology, we offer a wide spectrum of shapes, profiles,<br />
surfaces and colors, to meet varying aesthetic, quality and durability demands. Recent innovations<br />
include improved dirt-repellant surfaces, longer color durability, expanded color offerings, as well<br />
as larger sizes of tiles to achieve greater construction efficiencies on-site. There are generally two<br />
varieties of materials for roof tiles: concrete and clay.<br />
’ Concrete tiles. Concrete tiles represent approximately 50.6% of our overall sales in the<br />
division. Our concrete tiles range from classic red monocolored polymer coated tiles to<br />
premium tiles, which have the same appearance as traditional clay designs, wood shingles and<br />
slates. The principal advantages of concrete are its durability, its general cost-effectiveness and<br />
the widespread availability of raw materials for its manufacture. Concrete roof tiles are used<br />
worldwide, particularly by residential building contractors. Usually, ten concrete tiles are laid<br />
per m 2 , but there can be as few as seven tiles per m 2 for larger sizes or as many as 60 in the<br />
case of small format plain tiles.<br />
’ Clay tiles. Clay tiles represent approximately 17.7% of our overall sales in the division. We<br />
offer a variety of sizes and surfaces of clay tiles, ranging from large format tiles (10-13 tiles<br />
per m 2 ) and medium-size and light profile tiles (13-17 pieces per m 2 ) to small format tiles (20-<br />
60 pieces per m 2 ). In addition, we offer a variety of surface finishes, ranging from monocolored<br />
to multi-colored tiles that simulate the effect of old tiles, as well as premium-glazed<br />
tiles.<br />
s Roofing Components, Metal and Other Products. Sales of roofing components, metal and other<br />
products represent approximately 20.2% of our overall sales in the division. In order to provide<br />
complete roofing solutions, we also offer a range of complementary products and services to our<br />
customers. These include a large number of components and accessories that cover all functional<br />
aspects of roof construction, such as safety gratings, snow guard tiles, ventilation underlays,<br />
skylights, and prefabricated roof elements. In addition, we also offer photovoltaic and solar thermal<br />
installations that generate electricity and warm water, respectively. In 2001, we acquired the metal<br />
roof tile producer Kami, with operations in Scandinavia and Eastern Europe and, since 2002, in the<br />
United Kingdom.<br />
44
Chimneys. Sales of chimneys represent approximately 11.5% of our overall sales in the division. Based<br />
on our experience in this industry, we believe that we are currently the leading manufacturer of chimney<br />
systems in Europe, offering both ceramic and steel models.<br />
Our chimney products can be divided into two principal categories: mineral-based, or ceramic, systems<br />
and metal-based, or steel, systems. Our product range in ceramic chimneys comprises ready-to-install<br />
insulated chimneys (comprising flue liner, insulation and blockstones) and ventilation systems as well as a<br />
fully developed range of complementary accessories. We also offer restoration products for chimneys and<br />
steel chimney systems in Italy, Austria and other European countries. We manufacture approximately 90% of<br />
our chimney products in our own factories.<br />
Recent innovations include multi-wall insulated chimneys with cavity ventilation that prevent moisture<br />
damage, and isostatic ceramic liners that are more resistant to temperature variations.<br />
Where and how our roofing products are manufactured and our raw materials<br />
Concrete tiles. Concrete tiles are manufactured out of sand-based concrete mix by extrusion onto<br />
individual molds or pallets. Several layers may be added, by extrusion or other means, to obtain a variety of<br />
surface textures and colors on the weather side of the tiles. Once dried, the tiles are removed from the molds<br />
and after two to four weeks of curing are ready for installation. Our simple tiles are made out of a single<br />
layer of concrete whereas several layers of concrete may be used in our most expensive tiles. Raw materials<br />
amount to approximately 47% of our total production costs including depreciation, and we have spent a great<br />
deal of effort on improving our formulations to optimize our use of raw materials as well as introducing<br />
practices to improve the quality of our finished products. Based on historic trends we do not consider the<br />
prices of these raw materials to be volatile. Depreciation, direct labor and fixed costs represent about 50% of<br />
our total production costs. Energy represents approximately 3% of our total production costs.<br />
At December 31, 2003, the companies we consolidated (global and proportionate) operated 100<br />
production sites devoted to the manufacture of concrete tiles, with a total maximum capacity based on full<br />
shifts of 567 million m 2 . The average capacity of our plants is 5.7 million m 2 . We depreciate our new plants<br />
on a straight line basis over 20 years. The average capital investment for a new plant today would be<br />
between 4 and 20 million euros depending on the location, capacity, degree of automation and product range.<br />
Because of freight costs and design differences, most of our concrete tile plants are designed to supply a<br />
regional market.<br />
Clay tiles. Clay tiles are manufactured out of a mix of natural clays, molded under pressure and fired in<br />
a tunnel kiln at high temperatures. Various types of finishes can be achieved for different applications through<br />
surface coatings. The newer production processes (so called ‘‘H Cassette’’) require significant capital<br />
investments, but result in higher quality tiles that can be produced in larger sizes. The quality and delivered<br />
cost (from the quarry to the plant) of clay is critical to the quality of end-product and cost performance of the<br />
plant. Ownership or control of high-quality clay deposits near the plant is determinative of the plant’s overall<br />
performance. However, raw materials costs are a smaller proportion of our costs than in concrete tiles,<br />
representing approximately 16% of our total production costs. Based on historic trends we do not consider the<br />
prices of these raw materials to be volatile. We either extract clay from our own reserves or have secured<br />
long-term supply contracts that endure over the expected life of the relevant plants. Depreciation, direct labor<br />
and fixed costs represent approximately 68% of our total production costs. Due to the use of kilns in<br />
manufacturing, energy costs are significant, amounting to about 16% of our total costs.<br />
At December 31, 2003, the companies we consolidated (global and proportionate) operated 23 plants<br />
devoted to the manufacture of clay tiles, with a total maximum capacity based on full shifts of 38 million m 2 .<br />
The average capacity of our plants is 1.7 million m 2 . Depending on the technology used, the average capital<br />
investment for a new clay tile plant today would vary from 40 to 50 million euros for a capacity of 2 million<br />
m 2 . We depreciate our new plants on a straight line basis over 20 years. The geographic reach of sales from a<br />
given plant is usually restricted by the design of tile which it produces and the geographic market for that<br />
design. Freight costs have less of an influence because of the higher prices charged for clay tiles.<br />
45
Roofing Components. We manufacture or purchase from manufacturers a variety of roofing components.<br />
Each production process is specific to the type of accessory.<br />
Chimneys. We have 20 production sites devoted to manufacturing chimneys, 6 of which are in Germany<br />
and the remainder of which are located in Europe. The total maximum capacity based on full shifts of our<br />
chimney plants is 6.9 million meters. Most of our mineral-based chimney products consist of a simple<br />
blockstone reinforced with a three-layered product comprising a ceramic flue liner, a mineral wool insulation<br />
and a light weight concrete blockstone. Our mineral-based chimney products are delivered either as single<br />
parts to be assembled by the mason on site or as prefabricated story-high chimneys which can be mounted on<br />
the site without specialists. Our metal-based chimneys are constructed mainly from stainless steel and small<br />
amounts of aluminum. The basic construction principles are the same as those used in the manufacture of<br />
mineral-based chimney systems.<br />
In addition, we offer all the accessories necessary to assemble a chimney on the building site, including<br />
a flue gas connection to the boiler, cleaning doors, condensate handling, chimney coverage, glue, mortar and<br />
top cover plate. These accessories are provided to the customer as prepackaged kits.<br />
Who buys our roofing products, our customer orders and backlog?<br />
We believe in establishing long-term relationships with our ultimate customers, the building owners, as<br />
well as the professionals who cater to them:<br />
s home owners,<br />
s roofing contractors,<br />
s architects,<br />
s house builders and developers,<br />
s housing associations,<br />
s local government and planners,<br />
s retailers and merchants,<br />
s chimney constructors.<br />
In general, we distribute our products through building products merchants or specialized merchants<br />
based on current orders. Thus, we do not have a significant backlog. In the ordinary course of our business,<br />
we usually keep an inventory of finished products in constant turnover that represents on average slightly<br />
more than one month of sales, which is mostly due to the curing time of two to four weeks to achieve the<br />
required strength of the tiles depending on the region and climatic conditions.<br />
Our markets and industry<br />
Producers of roofing products compete primarily on a regional basis and based on factors such as price,<br />
product quality and customer service. Concrete and clay tiles compete against a variety of products in<br />
different markets: asphalt shingles in the U.S. residential market, fiber cement and corrugated steel in the<br />
low-end residential segment of developing countries, fiber cement and metal in the non-residential sector<br />
worldwide, slate in the high-end residential segment in Western Europe and in the Northeastern United States.<br />
We envision market growth potential in developing countries in Asia, South America and Eastern Europe<br />
where construction activity is expected to increase and to a lesser extent also in North America.<br />
The demand for roofing products is linked to overall construction activity within a given region,<br />
population (measured by the number of households) and demographic growth, economic development and<br />
growth in average household income, climatic conditions, governmental regulations, insurance regulations<br />
(e.g. fire protection), and availability and affordability of land for new construction. In general, demand in<br />
developing countries tends to be driven in large part by utility and durability, whereas aesthetics tends to be<br />
a more significant factor in more developed countries.<br />
46
Western European markets are seeing a relatively stable market for renovation while the new-built<br />
markets are declining in many countries. Also we are detecting a growing trend towards the utilization of<br />
clay tiles. While clay is generally more expensive than concrete, it is perceived as having greater decorative<br />
value. Clay roof tiles are increasingly being used in Northern Europe, mostly for upscale renovations of<br />
individual houses. Clay roof tiles are also the traditional roofing materials in Southern Europe, especially in<br />
the Mediterranean region, and Asia. It is therefore selected mainly for aesthetic reasons and to preserve<br />
architectural traditions.<br />
In the emerging markets where we operate, we have benefited from the substitution of tiles for less<br />
expensive corrugated metal and cement fiber products. Developing long-term solutions to improve appearance<br />
is critical if we want to maintain the competitiveness of our concrete tiles in these emerging markets.<br />
The seasonality of demand for roofing products parallels that of the construction industry at large.<br />
Demand is far more seasonal in areas with cold winters than in areas with more temperate climates. In our<br />
primary markets in Western Europe our sales are lower in winter than during the rest of the year.<br />
Who are our competitors?<br />
According to our own internal estimates, we believe, based on our experience in this industry, we are the<br />
clear market leader in Europe in pitched roofing products. Our principal competitors in Europe for pitched<br />
roofing products are Etex, Imerys, Terreal (sold by Saint Gobain to Carlyle and Eurazeo in 2003), Uralita,<br />
Koramic (the tile business of which was acquired by Wienerberger in 2003) and Creaton. In the European<br />
market for chimneys, we believe, based on our experience in this industry, we are also the market leader,<br />
followed by Poujoulat, Raab and Plewa.<br />
We believe, based on our experience in this industry, that our MonierLifetile joint venture has around<br />
48% of the North American market for concrete tiles. However, we estimate that concrete and clay tiles<br />
represent only around 6% of the pitched roofing market in North America. Asphalt shingles represent over<br />
85% of the total pitched roofing market in North America and the primary manufacturers are Owens Corning,<br />
GAF and Certain Teed (Saint Gobain). We are currently not present in the North American market for<br />
chimneys.<br />
Our geographic markets<br />
In the discussion that follows, we describe market conditions and our competitive position in the<br />
principal geographic areas in which we operate. The sales volume figures we have provided for each country<br />
or geographic zone are the total volumes sold in each particular country or zone by our consolidated<br />
subsidiaries, including volumes sold to our other divisions and adjusted to reflect our percentage of interest<br />
in our proportionally consolidated subsidiaries.<br />
47
The following table illustrates the business operations of our consolidated subsidiaries by geographic<br />
zone at December 31, 2003:<br />
Number of Plants<br />
Concrete Tiles Clay Tiles Chimneys Others<br />
Geographic Area At December 31, 2003<br />
Western Europe ;;;;;;;;;;;;;; 44 18 11 9<br />
Germany ;;;;;;;;;;;;;;;;; 11 5 6 4<br />
United Kingdom ;;;;;;;;;;;;;; 9 1 1 1<br />
France ;;;;;;;;;;;;;;;;;; 5 4 0 0<br />
Italy ;;;;;;;;;;;;;;;;;;; 9 3 1 0<br />
Other Europe;;;;;;;;;;;;;;;; 10 5 3 4<br />
North America;;;;;;;;;;;;;;; 13 0 0 0<br />
Other Zones ;;;;;;;;;;;;;;;; 43 5 9 4<br />
Eastern Europe ;;;;;;;;;;;;;;; 13 1 9 1<br />
Asia/Pacific ;;;;;;;;;;;;;;;; 20 3 0 3<br />
Latin America ;;;;;;;;;;;;;;; 3 1 0 0<br />
Africa/Indian Ocean ;;;;;;;;;;;;; 6 0 0 0<br />
Mediterranean Basin;;;;;;;;;;;;; 1 0 0 0<br />
Total ;;;;;;;;;;;;;;;;; 100 23 20 13<br />
Concrete and clay tiles and roofing components<br />
Western Europe<br />
We believe, based on our experience in this industry, we are the market leader in Western Europe,<br />
which represented approximately 75.1% of our total roofing products sales worldwide, and which is the first<br />
market where we established our presence. We sold 64.0 million m 2 of concrete tiles and 24 million m 2 of<br />
clay tiles in the region in 2003. Our four principal markets in this region are Germany, the United Kingdom,<br />
France and Italy.<br />
In Germany, which represented in 2003 approximately 37.9% of our roofing products sales in Western<br />
Europe, we have been facing declining volumes in concrete tiles and we have closed down two of our older<br />
plants in the past three years. These plant closures have allowed us to focus our operations on our most<br />
efficient plants and reduce our surplus capacity. We have also introduced new products such as our Star<br />
surface, a concrete tile with a smoother surface. In 2001, we restructured our German roofing business by<br />
merging our concrete and clay tile activities in a single organizational structure while retaining Braas and<br />
RuppKeramik as product brands. We have also expanded our roofing components activities with the<br />
acquisition of Kloeber, a large roofing accessories producer.<br />
We have restructured our operations in France, Italy and the Netherlands by closing down older smallscale<br />
plants while expanding capacity at our more modern operations and constructing a new clay tile plant in<br />
Southern Italy, that became operational in June 2001. In 2001, we acquired the metal roof tile producer Kami<br />
with operations in Scandinavia and Eastern Europe and, since 2002, in the United Kingdom. We are also<br />
present in Austria, Belgium, Denmark, Finland, Norway, Sweden and Switzerland.<br />
North America<br />
North America is our second most important regional market, after Europe, for pitched roofing products.<br />
In 2003, our sales of concrete roofing tiles and roofing accessories in North America accounted for 8.2% of<br />
our total sales in roofing products worldwide. We operate in North America through our jointly controlled<br />
American subsidiary, MonierLifetile LLC which was formed in 1997 as a 50/50 joint venture between<br />
Redland’s subsidiary Monier Inc., which it had acquired in 1987, and Boral Lifetile Inc., a subsidiary of<br />
Boral Limited of Australia. The company is the largest manufacturer of premium-quality concrete roof tiles in<br />
the United States. Currently, MonierLifetile has 13 active concrete tile manufacturing plants in the continental<br />
United States, located principally in the Sunbelt states.<br />
48
Other zones<br />
Our most substantial presence is in Asia where we are present in Malaysia, Japan, China, Indonesia,<br />
Philippines, India, South Korea and Thailand. We have been expanding our presence in Asia and we now<br />
have six concrete tile plants in China and we have eight concrete tile plants and one clay tile plant in<br />
Malaysia. In 2002, we and Cementhai Building Products (member of the Siam Cement Group) set up a joint<br />
venture, <strong>Lafarge</strong> Siam Roofing, for the manufacturing of clay roof tiles in Thailand. We opened our first clay<br />
tile plant in Rayong, Thailand in 2003. We have also been expanding into Eastern and Central Europe. Our<br />
main markets in this region are Poland, the Czech Republic, Hungary, Slovakia and Russia. We also have<br />
operations in Bulgaria, Croatia, Estonia and Slovenia. We have a presence through sales/ administrative<br />
offices in Bosnia-Herzegovina, Latvia, Lithuania, Romania and Ukraine. We are present in South America<br />
where we have started operating two new plants in Brazil in the last three years resulting from our<br />
acquisitions, in 2001, of the clay roofing tile business of Ceramica Laranjal Paulista and of a concrete plant.<br />
In total, we operate three concrete roof tile plants and one clay roof tile plant in Brazil. We have substantial<br />
operations in South Africa where we sold 5.2 million m 2 of tiles in 2003. We are present in Turkey with a<br />
concrete tile plant.<br />
We also operate together with Boral in Mexico through a joint venture.<br />
Chimneys<br />
Our Schiedel chimney business accounted for 11.5% of our total sales in the Roofing division<br />
worldwide. We believe, based on our experience in this industry, we are Europe’s leading chimney producer<br />
and we are four times the size of our closest competitor. We have production plants in 12 European countries<br />
and sales offices in 19 countries. In 2003, we opened a new plant in Poland and a sales office in Turkey. We<br />
are the technical leader in ceramic chimneys in Europe.<br />
Capital expenditures<br />
Capital expenditures in the periods ended December 31, 2003, 2002 and 2001 in the Roofing division<br />
related to the on-going upgrading and modernization of existing industrial operations around the world and on<br />
organic growth through the building of new production facilities accounted for 86 million euros, 88 million<br />
euros and 118 million euros, respectively. Our capital expenditures in the Roofing division accounted for<br />
approximately 9% of our overall capital expenditures in the period.<br />
There were no individual investment projects in Roofing which exceeded 20 million euros in the threeyear<br />
period from 2001 to 2003.<br />
In 2004, the level of our capital expenditures will depend on general market conditions. We expect<br />
capital expenditures to total approximately 100 to 130 million euros, excluding new acquisitions. We intend<br />
to invest in projects that maintain or improve the performance of our plants. We also intend to take advantage<br />
in 2004 of selected acquisition opportunities.<br />
We also invested 81 million euros on various acquisitions over the three-year period to expand our<br />
geographical presence and strengthen our product range.<br />
For information about our financing of capital expenditures, see ‘‘Capital Expenditures — Cement’’<br />
above.<br />
Gypsum<br />
In 2003, our sales amounted to 1.2 billion euros. Gypsum represented approximately 8.7% of our sales in<br />
2002 and 4.3% of our operating income on ordinary activities. The Gypsum division’s after tax return on<br />
capital employed in 2003 was 6.3%. At December 31, 2003 we had 5,530 employees in the Gypsum division.<br />
On the basis of square meters of wallboard produced in 2003, we believe, based on our experience in<br />
this industry, we are the third largest manufacturer worldwide. We first entered into the market for gypsum<br />
products in 1931, with production of powdered plaster. We have since extended our product lines, and<br />
49
currently manufacture gypsum wallboard, gypsum plasters, plaster block, industrial plasters and anhydrite<br />
binders for self-leveling floor screeds.<br />
At December 31, 2003, the companies we consolidated (global and proportionate) operated 74 industrial<br />
sites in 23 countries. Of these, 35 were wallboard plants with a total production capacity of approximately<br />
1,013 million m 2 , 36 were plants where we produced other plaster products, such as plaster, plaster block and<br />
jointing compound, and three were plants which produced paper.<br />
Our goals for the coming years are to develop our presence in strong growth markets, consolidate our<br />
position in the U.S. market, reduce costs and improve our marketing.<br />
The table below indicates the breakdown of our sales by destination in 2003, 2002 and 2001:<br />
Gypsum Sales by Geographic Area<br />
Year ended December 31,<br />
Geographic Area 2003 2002 2001<br />
(in million euros, except percentages)<br />
Western Europe;;;;;;;; 657 55.0% 604 52.7% 602 56.2%<br />
North America ;;;;;;;; 226 18.9% 245 21.4% 169 15.8%<br />
Other Zones ;;;;;;;;; 311 26.1% 297 25.9% 301 28.1%<br />
Total ;;;;;;;;;; 1,194 100.0% 1,146 100.0% 1,072 100.0%<br />
We have been actively expanding our gypsum operations in emerging markets. We define emerging<br />
markets as those countries in our other geographical zones, excluding Japan, Australia and New Zealand. In<br />
2003, we generated revenues of 247 million euros in emerging markets compared to 235 million euros in<br />
2002 and 248 million euros in 2001. Emerging markets amounted to 20.7% of our total revenues in gypsum<br />
worldwide in 2003 compared to 20.5% in 2002 and 23.1% in 2001.<br />
Our gypsum products and their applications<br />
The predominant gypsum product sold in the global market is gypsum wallboard or plasterboard.<br />
Gypsum wallboard, which represents approximately 70% of our sales of gypsum products, is used for both<br />
new residential and commercial construction and for repair and remodeling for:<br />
s partitions,<br />
s paneling,<br />
s linings, and<br />
s ceilings, etc.<br />
We believe, based on our experience in this industry, that renovation activities account for approximately<br />
50% of our gypsum wallboard sales in 2003, with some differences from one country to another.<br />
Gypsum wallboard was invented in the United States in the early 1900s, but its widespread adoption in<br />
construction in North America and Europe has largely been a phenomenon of the last fifty years. It is<br />
available in standard sized sheets in a variety of thicknesses and qualities including special sheets for high<br />
humidity areas such as bathrooms. Due to its naturally low thermal conductivity, wallboard is an ideal<br />
insulating material, which is why it is used in interior walls. It also acts as a flame retardant and absorbs<br />
ambient sound. New technologies are being exploited to make boards stronger and more flexible. These<br />
changes mean that for the first time, gypsum wallboard is competing with such materials as concrete for<br />
commercial jobs.<br />
We manufacture over a thousand different types of gypsum wallboard system worldwide. We have<br />
introduced several innovations recently to our product range to improve their ease of use and range of<br />
applications. In 1995 in France we introduced Prégydéco, a wallboard that is delivered with a primer coat<br />
applied in the factory. This reduces the customers’ labor cost and eliminates the need to wait for the primer<br />
to dry. This product was then successfully introduced in the United Kingdom in 1999 as Predeco, and then in<br />
Poland in 2001, where it won a national award for innovation. In 2002, several new products and systems<br />
50
have been launched into various countries, such as new compounds to facilitate the application of our Deco<br />
line systems, new fire-proofing plasters, new ceiling tiles, etc. In 2003, a new line of ceiling titles was<br />
launched in Korea and numerous countries launched new compounds. 2003 was also the first year of full<br />
implementation of PLA-tecÒ in France (consisting of tailor made gypsum board architectural components)<br />
which proved to be successful with large installers who as result of PLA-tecÒ, save time on the site and were<br />
able to increase the quality of complex architectural parts.<br />
Our other gypsum-based products, such as industrial plaster and gypsum blocks, which together comprise<br />
the remaining 30% of our activity in this sector, are adaptable to a wide variety of uses and are targeted at<br />
the construction and decorating industry.<br />
We tailor our marketing efforts in gypsum products to the specialized needs of each market. This<br />
marketing effort involves exchanging products or adapting our products to various technical specifications<br />
unique to each market and to differences in American and European fitting habits and production standards.<br />
Who buys our gypsum products; our customer orders and backlog<br />
Our gypsum wallboard products are mostly sold through wholesalers, including:<br />
s general building material distributors,<br />
s specialist dealers,<br />
s lumber yards in the United States,<br />
s decorating companies in emerging markets, and<br />
s do-it-yourself home centers.<br />
Sales of gypsum wallboard products are made on the basis of competitive prices in each market area,<br />
generally pursuant to telephone orders from customers. We currently do not have any long-term supply<br />
contracts and at December 31, 2003, we had no significant backlog.<br />
Specifiers, like architects, also have a significant impact on the choice of the best partition or ceiling<br />
systems. Depending on the specificity of each country, each business unit develops dedicated promotion<br />
efforts.<br />
Where and how our gypsum products are manufactured<br />
Gypsum is the common term for calcium sulfate dihydrate, a naturally occurring industrial mineral that<br />
is one of the more common minerals in sedimentary environments. Deposits of calcium sulfate dihydrate<br />
occur in many countries, namely the United States, Canada, France, Italy and Great Britain, which are among<br />
the leading producers. Gypsum can also be obtained as a by-product from chemical manufacture and from<br />
scrubbers of power plants. This so-called ‘‘synthetic’’ gypsum is increasingly being used in wallboard<br />
manufacture.<br />
Water molecules are physically locked inside the crystal structure of the gypsum molecule and, when<br />
calcined it, becomes a fine powder that, when mixed with water, can be applied in a plastic state which then<br />
sets and hardens by chemical recombination of the gypsum with water. Gypsum is unique because it is the<br />
only industrial mineral that can be calcined, and yet go back to its original state when rehydrated. It is this<br />
property which is exploited in the manufacturing process.<br />
In the manufacture of wallboard:<br />
s gypsum rock or synthetic gypsum is fed into a dryer, where surface moisture is removed;<br />
s the material is ground to a flour-like consistency known as land plaster;<br />
s the land plaster is then calcined, or heated, into calcium sulfate hemihydrate, also known as stucco;<br />
s the stucco is blended with water and other ingredients in a mixer to form a slurry;<br />
s this slurry is extruded between two continuous sheets of paper at the forming station;<br />
51
s the product travels down a long line in order to give the stucco molecules time to rehydrate and<br />
recrystallize into gypsum;<br />
s as it travels, the gypsum crystals grow into each other and into the liner paper, giving the product<br />
3-dimensional strength;<br />
s when the product has achieved initial ‘‘set’’ or firmness (approximately three minutes), the product is<br />
cut into lengths;<br />
s the individual boards are then dried in a kiln to remove excess water; and<br />
s the boards are packaged face to face and stored until ready for shipment.<br />
Our raw materials and production costs<br />
Gypsum is a key raw material to wallboard production. To produce one square meter of wallboard, we<br />
need on average just over ten kilograms of gypsum. In 2003, we sold 632 million m 2 of wallboard and used<br />
approximately 6.1 million tonnes of gypsum. We use both naturally occurring gypsum from our own quarries<br />
and synthetic gypsum, which is produced as a by-product in certain industrial processes, the main suppliers<br />
being coal-fired power plants.<br />
Our plants are designed primarily to use either natural or synthetic gypsum, but a synthetic gypsum plant<br />
can substitute natural gypsum for up to 30% of its raw materials and vice versa. Based on historic trends we<br />
do not consider the prices of these raw materials to be volatile. We use synthetic gypsum principally in some<br />
of our plants in the United States, South Korea, France, Germany and The Netherlands. We generally aim to<br />
situate our production sites as close as possible to supply sources to minimize transport costs, but in certain<br />
circumstances it is economical to transport natural gypsum long distances. For example, we supply our plants<br />
in the United Kingdom with natural gypsum from our quarry located in Spain.<br />
Our policy is to secure both our own natural reserves and long-term supply contracts for synthetic and<br />
natural gypsum in order to diversify our supply risk. At December 31, 2003, our consolidated companies<br />
operated 20 gypsum quarries worldwide including 12 in Western Europe. We currently estimate we have<br />
approximately 110 million tonnes of proven and authorized reserves of gypsum worldwide. We estimate that<br />
we have an additional 170 million tonnes of identified reserves for which we expect to obtain authorization.<br />
In general, we obtain synthetic gypsum through long-term contracts that last approximately 20 years, most of<br />
which contain an option to renew. In certain cases, as a function of our supply needs and local market<br />
practices, we contract over shorter periods. We have contracts outstanding for the supply of over 55 million<br />
tonnes of synthetic gypsum over the life of the contracts. We believe our current supply of gypsum, both<br />
natural and synthetic, is adequate for present operating levels.<br />
Gypsum represents approximately 11% of our production costs and is a less significant input than paper<br />
in the manufacture of wallboard, which represents approximately 27% of our production costs. We mostly use<br />
recycled paper in our fabrication process, and produce 46% of the paper we use in wallboard production<br />
through our own paper mills in Sweden, France and the United States. Prices of recycled paper are volatile.<br />
Energy costs make up approximately 20% of the cost of production. We depreciate our wallboard plants on a<br />
straight line basis over 20 years.<br />
The gypsum products’ industry<br />
We believe, based on our experience in this industry, the total world gypsum wallboard market to be in<br />
excess of 5 billion m 2 per year, with North America accounting for about half of the world’s demand and<br />
industrialized countries about 85%.<br />
The gypsum industry is an integrated industry worldwide in which a few large companies, including our<br />
own, predominate. Today seven producers hold approximately 80% of the total market in a consolidating<br />
industry. These companies operate gypsum wallboard plants and usually own the gypsum reserves used in<br />
manufacturing the wallboard. They also sell gypsum for use in portland cement production, agriculture and<br />
other manufactured gypsum products.<br />
52
Our largest competitors in Europe are BPB of the United Kingdom and Knauf of Germany, and in the<br />
United States, U.S. Gypsum Corporation, National Gypsum, BPB and Georgia Pacific.<br />
The gypsum wallboard industry is highly competitive. Producers compete on a regional basis and<br />
primarily on factors such as price, product quality and customer service. Producers whose customers are<br />
located close to their wallboard plants benefit from lower transportation costs, which is an important<br />
advantage.<br />
The demand for gypsum wallboard is closely linked to the gross national product of each of our markets<br />
and to construction methods employed. Wallboard penetration is higher in markets that employ advanced<br />
construction methods. In markets that use so-called ‘‘dry’’ construction processes (steel or wood materials),<br />
such as the United States, Japan and Australia, wallboard is used for fire protection, to keep installation costs<br />
down and for ease of assembly. The average consumption per person of gypsum wallboard in these countries<br />
is between 6 and 10 m 2 . In Western Europe, where ‘‘wet’’ construction is more commonly used, i.e.<br />
construction using masonry (stone and brick materials), the average consumption per person of wallboard is<br />
between three and four m 2 .<br />
We envisage great market growth potential in developing countries where construction methods are<br />
expected to improve. Factors that stimulate market demand for gypsum products are high labor costs,<br />
necessitating simpler and less labor-intensive assembly methods. In Asia, Eastern Europe and South America<br />
wallboard consumption is currently at modest levels (less than one m 2 per person), but growing rapidly at<br />
rates ranging from 8% to 15%. Gypsum wallboard demand is seasonal in North America, as it is tied to the<br />
level of construction activity which tends to be seasonal.<br />
Our geographic markets<br />
In the discussion that follows, we describe market conditions and our competitive position in the<br />
principal geographic areas in which we operate. The sales volume figures we have provided for each country<br />
or geographic zone are the total volumes sold in each particular country or zone by our consolidated<br />
subsidiaries, including volumes sold to our other divisions and adjusted to reflect our percentage interest in<br />
our proportionally consolidated subsidiaries.<br />
Western Europe<br />
In 2003, our sales in Western Europe accounted for 55.0% of our total sales in gypsum world-wide.<br />
Western Europe is the second largest regional market worldwide for wallboard, after North America. Our<br />
three principal markets in this region are France, the United Kingdom and Germany. Our total production<br />
capacity for wallboard in Western Europe was approximately 329 million m 2 as of December 31, 2003 and<br />
we sold 246 million m 2 in Western Europe in 2003.<br />
France. We operate in France through our wholly owned subsidiary, <strong>Lafarge</strong> Plâtres. We have four<br />
wallboard plants in France, one of which is designed to use primarily synthetic gypsum and the rest natural<br />
gypsum. We have a paper mill and 16 other production sites for the rest of our gypsum product lines, which<br />
include plaster blocks, industrial plaster, insulation and other materials.<br />
United Kingdom. We operate in the United Kingdom through our wholly owned subsidiary, <strong>Lafarge</strong><br />
Plasterboard Ltd. We have a single plant in the United Kingdom located in Bristol, with two wallboard<br />
production lines designed to primarily use natural gypsum. Our plant is supplied with gypsum from our<br />
quarry in Spain. We also have a jointing compound plant in Frampton.<br />
Germany and Netherlands. We operate in Germany through our wholly owned subsidiary, <strong>Lafarge</strong> Gips<br />
GmbH. In February 2003, we completed the acquisition of the wallboard businesses of Gyproc in Germany<br />
and Poland for 42 million euros (net of cash acquired). The two acquired plants, located in Peitz and in<br />
Hartershofen with a combined ultimate capacity of 53 million m 2 , were fully integrated with our other<br />
operations. We now operate four wallboard plants in Germany, and a wallboard plant in the Netherlands<br />
which are primarily designed to use synthetic gypsum except for the newly acquired plant in Hartershofen<br />
which is primarily designed to use a mix of natural gypsum and synthetic gypsum. We also import wallboard<br />
products from a plant in France.<br />
53
Other. We also have a wallboard production plant and a plaster plant in Italy through our wholly owned<br />
subsidiary, <strong>Lafarge</strong> Gessi S.A. as well as a metal studs business though our subsidiary, <strong>Lafarge</strong> Profili. We<br />
also operate a paper mill in Sweden. In addition, we have a minority interest in Yesos Ibericos which<br />
operates a wallboard plant and three plaster plants in Spain.<br />
North America<br />
In 2003, our sales in North America accounted for 18.9% of our total sales in gypsum worldwide. Our<br />
total production capacity for wallboard in North America was approximately 224 million m 2 at December 31,<br />
2003 and we sold 194 million m 2 in 2003.<br />
We first entered the North American gypsum market in 1996 and we estimate, based on our experience<br />
in the industry, we are now one of the six largest producers in this region. We operate in North America<br />
through our majority owned subsidiary <strong>Lafarge</strong> North America, Inc. At December 31, 2003 we operated four<br />
wallboard manufacturing plants in the United States, two of which use natural gypsum, located in Newark,<br />
New Jersey and Buchanan, New York. In 2000, we opened a new state-of-the-art plant using 100 percent<br />
recycled materials, including synthetic gypsum generated from the scrubbers of a nearby power plant in<br />
Silver Grove, Kentucky. In early 2001, our second new state-of-the-art plant in Palatka, Florida, based on the<br />
same design as our Silver Grove, Kentucky plant, became operational with a capacity of 74 million m 2 .We<br />
also commenced operations at a new joint venture paper mill in Lynchburg, Virginia in late 2001. In Canada,<br />
we operate one gypsum wallboard manufacturing plant in Corner Brook, Newfoundland, with a capacity of<br />
approximately 11 million m 2 , and a joint compound plant in Quebec. In order to rationalize our capacity, our<br />
subsidiary <strong>Lafarge</strong> North America has idled its Wilmington plant at the end of 2002<br />
Other zones<br />
Central and Eastern Europe and the Mediterranean Basin. We currently have operations in Poland, the<br />
Ukraine Romania and Morocco. We acquired our operations in Poland in 2000 with the acquisition of Dolina<br />
Nidy and Nida Gips. Nida Gips had an old wallboard plant in Gacki. This plant was closed at the end of<br />
2002. We have completed the construction of a new wallboard plant at the same site, which began operations<br />
at the end of the year 2002. In 2003, we increased our stake in <strong>Lafarge</strong> Arcom Gips in Romania and<br />
consolidated <strong>Lafarge</strong> Aghirès, our gypsum business in Romania, for the first time in 2003.<br />
We also have operations in the Ukraine: a plaster business, Stromgips, and a commercial office in Kiev<br />
to sell imported wallboard. In Turkey, we operate two companies through joint ventures. One comprises a<br />
wallboard production plant and a construction plaster facility near Ankara. The other has a quarry and<br />
production facilities near Istanbul.<br />
Asia Pacific. In June 2001, we formed a joint venture in the Asia Pacific Region with the Australian<br />
company Boral Limited. Boral initially held a 27% interest in the joint venture and increased its holding to<br />
48% by the end of 2001 and to 50% in 2003 in accordance with the terms of the joint venture agreement. At<br />
the end of 2003, our wallboard capacity in the region was 273.5 million m 2 . The joint venture is managed<br />
jointly with Boral in accordance with our management policies.<br />
The joint venture has three plants in South Korea which mainly manufacture wallboard from synthetic<br />
gypsum. In China we have one main plant near Shanghai. In addition, the joint venture also has two<br />
wallboard plants in Indonesia, which use natural gypsum, as well as a metal stud plant in Indonesia and a<br />
wallboard plant in Malaysia.<br />
The joint venture conducts its operations in Thailand through Siam Gypsum Industry (SGI) with two<br />
plants and a combined capacity of 87.5 million m 2 of wallboards at December 31, 2003. Siam Gypsum<br />
Industry announced the idling of a third facility in Navanakorn during the first quarter of 2003.<br />
54
Outside of the joint venture we have two plants in Australia located in Melbourne and Sydney which<br />
exclusively manufacture wallboard from natural gypsum. We entered into the Australian market in 1988<br />
through a joint venture with the Pioneer Group, which we fully acquired in 1999.<br />
Latin America. Our principal markets in this region are Chile, Brazil and Argentina. In these countries,<br />
we operate through companies we control jointly with the Etex Group. We have one wallboard plant in each<br />
of Argentina, Brazil and Chile and two plaster plants, one in each of Brazil and Chile.<br />
Capital expenditures<br />
Capital expenditure in the periods ended December 31, 2003, 2002 and 2001 in the Gypsum division<br />
related to the on-going upgrading and modernization of existing operations around the world and on organic<br />
growth through the building of new production facilities totaled 54, 79 and 111 million euros, respectively.<br />
Our Gypsum division capital expenditures accounted for 7.6% of our overall capital expenditures in the threeyear<br />
period. We also invested 113 million euros in the three-year period on various acquisitions to expand<br />
our capacity and our geographic presence.<br />
The principal investments (in excess of 20 million euros) in the three-year period from 2001 to 2003 for<br />
the modernization or replacing of existing plants and equipment included:<br />
s Eastern Europe: construction of a new wallboard plant in Gacki, Poland (2001 & 2002)<br />
s Western Europe: construction of a new wallboard plant in Lippendorf, Germany (2001)<br />
s Asia: construction of a new wallboard plant in Dangjin, Korea (2001 & 2002)<br />
s United States: construction of new wallboard manufacturing plants at Silver Grove, Kentucky and in<br />
Palatka, Florida (2001)<br />
The plant in Korea was completed in September 2002 and the one in Poland at the end of 2002.<br />
In 2004, the level of our capital expenditures will depend on general market conditions. We expect<br />
capital expenditures to total approximately 90 to 100 million euros, excluding new acquisitions. We intend to<br />
invest in projects that maintain or improve the performance of our plants. We also plan to pursue external<br />
growth opportunities that will enhance our ability to compete.<br />
For information about our financing of capital expenditures, see ‘‘Capital Expenditures — Cement’’<br />
above.<br />
Other Operations<br />
Disposal of our former Specialty Products division<br />
In 2000, we agreed to sell to three investment funds a majority interest in all the businesses in our<br />
former Specialty Products division, with the exception of the Road Marking Business, the European<br />
operations of which were sold to the Burelle group in November 2000, and the Lime Business, of which the<br />
largest part is a 40% equity interest in Carmeuse North America. The transaction was completed on<br />
January 22, 2001 and we initially retained 33.36% of the capital of the new company, called Materis<br />
Participations, which was formed to include our former operations in admixtures, aluminates, mortars, paints<br />
and refractories.<br />
In September 2003, the three investment funds decided to sell their stake in Materis Participations to a<br />
new investment fund, LBO France. Under this new transaction, we also agreed to sell our stake in Materis<br />
Participations to LBO France and at the same time to invest 20 million euros from the proceeds of the sale<br />
(that amounted to 210 million euros including license fees) in the newly created company, for a 7,27% equity<br />
interest. This further disposal has allowed us to realize the value generated by Materis Participations since the<br />
initial disposal. The subsequent investment has enabled us to retain an interest in the new company named<br />
Matéris Holding Luxembourg with which we have certain cooperation agreements as described below.<br />
At the time of the initial disposal, we had made a series of agreements with Materis Participations<br />
regarding namely their use of the <strong>Lafarge</strong> trademark, our provision of research and development and certain<br />
55
other services during a changeover period. These agreements were renewed and extended when we sold our<br />
stake in Materis Participations to LBO France. Matéris Holding Luxembourg will therefore be entitled to<br />
continue to use the <strong>Lafarge</strong> trademark in association with its existing products and will benefit from a<br />
research and development cooperation agreement with us until 2006.<br />
Our other operations, including the businesses we retained from our former Specialty Products division,<br />
generated sales of 0.1 billion euros in 2003 and 0.2 billion euros in 2002 and 2001, representing<br />
approximately 0.8% of our sales in 2003.<br />
Capital expenditures<br />
In the years ended December 31, 2003, 2002 and 2001, we made no material capital expenditure in our<br />
other operations.<br />
Environment<br />
We are subject to a broad range of environmental laws and regulations in each of the jurisdictions in<br />
which we operate. These laws and regulations impose increasingly stringent environmental protection<br />
standards regarding, among other things, air emissions, wastewater discharges, the use and handling of<br />
hazardous waste or materials, waste disposal practices and the remediation of environmental damage or<br />
contamination. These standards expose us to the risk of substantial environmental costs and liabilities,<br />
including liabilities associated with divested assets and past activities, even where conducted by prior owners<br />
or operators and, in some jurisdictions, without regard to fault or the lawfulness of the original activity. We<br />
are also subject to regulations regarding the control and removal of asbestos-containing material and the<br />
identification of potential exposure of employees to asbestos.<br />
To prevent, control and remediate environmental problems and maintain compliance with regulatory<br />
requirements, we maintain an environmental policy designed to monitor and control environmental matters.<br />
Because of the wide variety of environmental regulations we face, our policy is decentralized with the group<br />
environmental department providing advice on environmental compliance, assisting in the recruitment,<br />
training and retention of personnel experienced in environmental matters and ensuring the interchange of<br />
ideas between our subsidiaries.<br />
Our policy requires each subsidiary to respect local laws and meet our own internal standards to<br />
minimize the use of non-renewable resources and the generation of hazardous and other wastes. Our<br />
subsidiaries are encouraged to take a proactive role with respect to the environment and cooperate with the<br />
regulatory authorities to evaluate the costs and benefits of proposed regulations. In each of our plants, our<br />
policy requires that each operational unit implement programs:<br />
s preventing accidental releases, and,<br />
s providing for emergency action plans.<br />
Our environmental policy also requires environmental audits to be performed periodically at all of our<br />
properties to ensure environmental compliance and to assess whether improvements to the site are required to<br />
meet environmental laws or our own internal standards.<br />
In 2000, we entered into a voluntary environmental conservation partnership with the World Wildlife<br />
Fund (‘‘WWF’’) and became a founding member of its Conservation Partner program and lent our support to<br />
the Forest Reborn program. In 2001, we worked with the WWF on a number of areas including<br />
environmental performance indictors (audits, CO2 emissions, energy consummation and the contribution of<br />
recycling), biodiversity and the restoration of quarries and the development of a voluntary CO2 reduction<br />
program. On November 6, 2001, we announced, in conjunction with the WWF, that we had entered into a<br />
voluntary worldwide CO2 reduction commitment. We agreed with the WWF to a reduction of 20% in CO2<br />
emissions per tonne of cement produced worldwide over the period 1990-2010. This corresponds to a<br />
reduction of our CO2 emissions in industrialized countries of 15% in comparison to 1990 if alternative fuels<br />
are considered CO2 neutral, and 10% using WWF methodology. We estimate that group wide we produced<br />
670 kg of CO2 emissions per tonne of cement produced in 2003, a reduction of 10.7% in comparison to<br />
56
1990, and that in industrialized countries our CO2 emissions amounted to 46 million tonnes, a reduction of<br />
11.85% in comparison to 1990. In calculating our CO2 emissions, we follow the requirements of the<br />
WBCSD/WRI Carbon Dioxide Protocol and consider alternative fuels, (where in general we incinerate waste<br />
and recover the energy), to be CO2 neutral.<br />
We are currently involved in the remediation of contamination of certain properties. Following is a<br />
description of the most significant, but we believe, based on current information, that these activities, as well<br />
as the other less significant ones that are not described here, will not have a material adverse effect on our<br />
financial condition or results of operations. It should be noted, in addition and as evidence of our dedication<br />
to a strict environmental policy, most of these situations arose from alleged events or practices that took place<br />
before we acquired the relevant properties or subsidiaries.<br />
In The Netherlands, a former subsidiary of the group, Tollens Coatings B.V., is one of the defendants in<br />
an action brought in 1990 by the government in connection with the discharge of certain waste in the<br />
Lekkerker canal between 1968 and 1971. At that time, Tollens Coatings B.V. operated a paint manufacturing<br />
plant and had hired another company to carry and dispose of waste produced by the plant. The government is<br />
seeking Dutch guilders 160,000,000 (approximately 72.6 million euros) in damages, plus interest. Tollens<br />
Coatings B.V. contends that it did not instruct the disposal company to dump the waste in the Lekkerker<br />
canal and that it had no knowledge of the disposal company’s conduct. With the consent of the parties, the<br />
proceedings, which are still at the level of first instance, have been postponed several times by the court and<br />
since late 1993 no proceedings on the merits have taken place. In July 2001, the Dutch government took<br />
sufficient action to delay the running of the statute of limitations, without any other consequence. As a result,<br />
the case is still pending. Tollens Coating B.V. was disposed of with the Specialty Products division.<br />
However, pursuant to the disposition arrangements, including the subsequent sale of Materis Participations to<br />
LBO France, the group has agreed to indemnify the acquirers for any damages incurred in connection with<br />
this litigation<br />
On October 27, 2003, our majority owned subsidiary, <strong>Lafarge</strong> North America, received an order of the<br />
Natural Resources and Environmental Protection Cabinet of the Commonwealth of Kentucky assessing a<br />
$250,000 penalty for certain air quality violations relating to our storage of synthetic gypsum at our drywall<br />
manufacturing plant in Silver Grove, Kentucky. The order also directed us to adopt adequate air pollution<br />
control, monitoring and record keeping measures with respect to our storage of gypsum at the plant, which<br />
<strong>Lafarge</strong> North America has already implemented.<br />
Environmental matters cannot be predicted with certainty and there can be no assurance that the amounts<br />
we have budgeted and reserved will be adequate. In addition, future developments, such as the discovery of<br />
new facts or conditions or future changes in environmental laws, regulations or case law, could result in<br />
increased environmental costs and liabilities that could have a material adverse effect on our financial<br />
condition or results of operations. We are not currently aware of any environmental liabilities or of any noncompliance<br />
with environmental regulations that we expect will have a material adverse effect on our financial<br />
condition or results of operations.<br />
We regularly incur capital expenditures that have an environmental component or that are impacted by<br />
environmental regulations. However, we do not keep separate accounts for such mixed expenditures.<br />
Environmental expenditures that extend the life, increase the capacity, improve the safety or efficiency of<br />
assets or are incurred to mitigate or prevent future environmental contamination may be capitalized. Other<br />
environmental costs are expensed when incurred. For the years ended December 31, 2003, 2002 and 2001,<br />
environmental capital expenditures and remediation expenses were not material. However, our environmental<br />
expenditures may increase in the future.<br />
In 2003, the European Union adopted a directive implementing the Kyoto Protocol on climate change<br />
and establishing a greenhouse gas emissions allowance trading scheme within the European Union. The<br />
directive came into force on October 25, 2003 and requires European Member States to impose binding caps<br />
on CO2 and certain other greenhouse gas emissions from installations involved in energy activities, the<br />
production and processing of ferrous metals, the mineral industry (including cement production) and the pulp,<br />
paper or board production business. Under this scheme, companies with operations in these sectors will<br />
receive from the relevant Member States allowances that will set limitations on the levels of greenhouse gas<br />
57
emissions from their installations. These allowances will be tradable so as to enable companies that manage<br />
to reduce their emissions to sell their excess allowances to companies that are not reaching their emissions<br />
objectives. Failure to meet the emissions caps will be subject to heavy penalties. Each Member State is to<br />
establish a National Allocation Plan that will set out the allowance allocations for an initial period of three<br />
years, from 2005 to 2007. The directive provides that the Member States’ National Allocation Plans are to be<br />
published by March 31, 2004 and will become effective as of January 1, 2005 after having been approved by<br />
the European Commission. A proposed directive to link the current trading scheme to the flexibility<br />
mechanisms under the Kyoto Protocol is currently under review by the European Commission. These<br />
flexibility mechanisms provide that credits (equivalent to allowances) can be obtained by companies for<br />
projects that reduce greenhouse gas emissions in emerging markets. These projects are referred to as clean<br />
development mechanisms or joint implementation projects depending on the countries where they take place.<br />
The National Allocation Plans that will apply to our operations in Western Europe may require us to<br />
reduce CO2 emissions below the levels we have targeted in our agreement with the WWF. These plans will<br />
mainly apply to our Cement operations and to a much lesser extent to our Roofing and Gypsum operations.<br />
We cannot presently determine what our allowance will be or whether these allowance allocations will<br />
require capital expenditures or other remedial actions and whether any such capital expenditures or other<br />
remedial actions will materially affect our financial position, results of operations or liquidity. However, we<br />
believe that we should be in a position to mitigate some of the possible impacts of the National Allocation<br />
Plans on our operations in Western Europe by relying on other production sites and namely by using possible<br />
credits derived from the implementation of flexibility mechanisms under the proposals currently under<br />
discussion.<br />
Research and Development<br />
Over the past three years, we have focused our research and development efforts on meeting our threefold<br />
objective of further developing existing products, broadening and improving product application<br />
possibilities and creating new products. Our research and development efforts are aimed at responding to<br />
customer requirements, such as reducing construction costs, providing easy and reliable applications,<br />
improving the appearance of materials and the quality of everyday surroundings and the protection of the<br />
environment.<br />
We expense our research and development expenditures as they are incurred, and our research and<br />
development expenditures amounted to 56 million euros in 2003, compared to 55 million euros in 2002 and<br />
53 million euros in 2001. We have a Central Research Laboratory which is located at l’Ile d’Abeau near<br />
Lyon, France which had 185 employees as of December 31, 2003. We have reorganized our research and<br />
development activities to make them more customer focused. Since 2001, we have expanded the use of our<br />
new products center at l’Ile d’Abeau where customers and architects can discover our current solutions and<br />
the materials we are planning for the future. In the last three years, we also reorganized our central research<br />
activity to better reflect the priority given to product innovation as a significant source of future growth and<br />
brand differentiation. We have created separate project portfolios for each of our divisions, in order to permit<br />
the research and development team to work directly with the divisions to ensure more targeted research and<br />
at same time to exploit the synergies between the various materials.<br />
In addition to our Central Research Laboratory we have over fifteen testing and applications laboratories<br />
in our divisions and subsidiaries which are spread across eight different countries and in total we have over<br />
400 employees working in research and development.<br />
We have also expanded our resources through agreements with some prominent universities: the<br />
Massachusetts Institute of Technology (‘‘MIT’’), Princeton University and the University of California at<br />
Berkeley in the United States and the Universities of Laval and Sherbrooke in Canada. We have a history of<br />
co-operation with the CNRS, the French national center for scientific research and the leading center for<br />
fundamental research in Europe. We have signed over 40 research collaboration contracts during the past six<br />
years with CNRS laboratories. Joint projects with the CNRS have enabled us to gain a greater understanding<br />
of phenomena linked to the behavior of hydraulic binders, and have also contributed to our innovations such<br />
as DuctalÒ, where some ten different CNRS laboratories backed up the partnership between <strong>Lafarge</strong>,<br />
58
Bouygues and Rhodia. Joint research between the CNRS and <strong>Lafarge</strong> has also resulted in improvements to<br />
the strength of our wallboard products.<br />
Among the new products we have launched recently are products designed to:<br />
s reduce the cost of construction, through, for example, our AgiliaÒ Vertical concept, which consists of<br />
self-placing concrete which is pump-applied through a handheld hose, and is a further expansion of<br />
our new generation AgiliaÒ range of self-placing and self-leveling concrete,<br />
s improve appearance, thanks to products such as our decorative concrete and roof tiles, the new<br />
PLA-tecÒ wallboard system launched in 2003 and our products for the renovation and restoration of<br />
old buildings such as our Frescalys hydrated lime-based mortar, etc.,<br />
s improve comfort, whether thermal and acoustic (Prégymax 32Ô liner complex, etc.) or thermal<br />
(Span-AluÒ roof underlay, etc.), and<br />
s improve safety, whether through the enhancement of the solidity and durability of buildings through<br />
products such as our Integrated Roofing System which is designed to resist winds of over 190 km/h.<br />
Intellectual Property<br />
We currently own or have licenses to use various trademarks, patents and other intellectual property<br />
rights that are of value in the conduct of our business, but no such intellectual property right is, by itself,<br />
material to our activities. We own or otherwise have rights to the trademarks and trade names, including<br />
those mentioned in this document, used in conjunction with the marketing and sale of our products.<br />
Our Protection of Industrial Property (‘‘PIP’’) Corporate Department aims to enhance the value of this<br />
intellectual property by establishing our title through patents, trademarks, copyright and other relevant laws<br />
and conventions and by using legal and regulatory recourse in the event of infringement. Each of our<br />
divisions also has either a corresponding PIP Department or representatives linked in a network with the PIP<br />
Corporate Department, in order to coordinate our efforts to protect our intellectual property position in<br />
building materials.<br />
The use of or access to our intellectual property is governed by the terms of license and/or franchise<br />
agreements signed with our subsidiaries who pay us fees for such use. Following the Blue Circle acquisition,<br />
we carried out in 2002 a detailed review of our intellectual property portfolio in order to optimize our<br />
organization. In 2003, we launched a program under which our intellectual property portfolio is made<br />
accessible to our group subsidiaries through internal portals containing our know-how and best practices. Our<br />
PIP Corporate Department is in charge of monitoring the level of information available on such portals and<br />
how our intellectual property is used throughout the group.<br />
E-Business<br />
Our company has over 100 affiliated Internet sites that offer information about <strong>Lafarge</strong>, its partners and<br />
subsidiaries, news, shareholder information and product and service information. New information and<br />
communication technologies have been identified as a major opportunity for <strong>Lafarge</strong> to better serve the<br />
strategic aims of its existing activities and improve some of their processes in such fields as marketing, sales,<br />
procurement, internal and external communication, knowledge management, etc.<br />
Our most significant investments in e-business technologies have taken the form of two major projects:<br />
the ‘‘Place des Métiers’’, involving all <strong>Lafarge</strong> Business Units in France in each of our businesses (Cement,<br />
Aggregates & Concrete, Roofing and Gypsum), and the ‘‘Roofing project’’, involving all Roofing Division<br />
Business Units in Europe. These projects have two primary purposes:<br />
s Addressing strategic challenges of communication and interaction (product information, selection<br />
guides, calculation and configuration tools, etc.) with diffuse end-user and customer populations (in<br />
France, web sites dedicated to distributors, contractors, specifiers and home owners for instance),<br />
which have previously been difficult to reach by traditional marketing methods; and<br />
59
s Building an infrastructure for further e-business developments, not only on the marketing side, but also<br />
to carry out transactions with our customers and suppliers (e-procurement) or share data internally and<br />
externally with our partners.<br />
Similar sites are also being launched by our divisions and subsidiaries. The sites are backed up by our<br />
traditional media <strong>publication</strong>s and off-line traditional marketing tools and media.<br />
Information Systems<br />
We have developed several initiatives over the past few years to integrate through our information<br />
technology network the highest number of <strong>Lafarge</strong> personnel possible, as well as the economic community<br />
and our clients. These initiatives include the implementation of:<br />
s <strong>Lafarge</strong> Net, an Intranet system that interconnects our personnel globally (75 countries connected,<br />
amounting to approximately 33,000 people) and which provides for secured Internet access;<br />
s an Enterprise Resource Planning (ERP) system, which is a business management software that<br />
integrates Finance, Marketing, Manufacturing, Purchasing, Logistic and Human Resources,<br />
complemented by specific systems we have developed to support our particular needs, especially in the<br />
manufacturing domain (e.g., kiln management, concrete plant management). In order to improve and<br />
facilitate implementation and use of this ERP and specific systems, we have developped a common<br />
language, best practices and models for this implementation in operational units;<br />
s the data warehouse concept, which enables information sharing for day-to-day needs, including data<br />
analysis, decision support and information delivery in the area of Finance, Marketing and<br />
Manufacturing;<br />
s a system that integrates client and vendor relations (CRM) using various tools such as sales follow-up,<br />
customer follow-up, call centers and e-procurement facilities; and<br />
s an Entreprise Application Integration (EAI) system to facilitate the transfer of information between<br />
applications.<br />
Insurance Management Policy<br />
Our general policy in insurance matters is predicated on two principles: i) cover under group-wide<br />
policies subsidiaries in which we own a majority shareholding, subject to local regulatory constraints and<br />
specific geographical exclusions, and ii) retain exposure to frequency risks through self-insurance and captive<br />
insurance techniques and transfer only severity risks to the insurance and reinsurance markets. Special<br />
attention is paid to the financial strength of these market participants.<br />
Two insurance programs have been implemented within the group, one covering North America and the<br />
other covering operations in the rest of the world.<br />
Insurance policies in North America<br />
Our subsidiary <strong>Lafarge</strong> North America maintains a comprehensive insurance program to protect the<br />
company from certain types of property and casualty losses. The program utilizes commercial insurance and<br />
the company’s two captive insurance companies. Commercial property insurance is purchased to insure<br />
against losses to plants and equipment. The property insurance provides replacement cost coverage.<br />
Additionally, the property policy provides business interruption coverage for the cement manufacturing plants.<br />
Policy terms and deductibles are in line with coverage available in the market.<br />
<strong>Lafarge</strong> North America also maintains insurance for its risks associated with workers compensation, auto<br />
liability and general liability exposures. The deductibles on these coverages range from $1 million to<br />
$2.5 million per claim. <strong>Lafarge</strong> North America’s captive insurance companies are used to fund losses below<br />
these amounts. Above these amounts, <strong>Lafarge</strong> North America purchases commercial insurance. <strong>Lafarge</strong> North<br />
America maintains other insurance programs as appropriate and believes the insurance programs, policy limits<br />
and deductibles are appropriate for the risks associated with its business and in line with coverage available<br />
60
in the market. However, there can be no assurance that an event will not occur that results in damage<br />
exceeding our insurance cover.<br />
Group insurance policies excluding North America<br />
The main insurance programs in Europe, Africa, Latin America and Asia primarily cover property risks<br />
(fire, explosion, natural disasters, etc.) and ensuing business interruption. Assets are insured at their estimated<br />
market value. A study on risk of earthquakes was carried out in 2003 to evaluate the sub-limits for<br />
earthquake coverage included in our insurance programs (which vary from one region to another). The study<br />
concluded that insurance coverage is sufficient in all the high-risk countries in which we operate (Turkey,<br />
Greece, Chile, Indonesia, the Philippines and Japan), however, there can be no assurance that the studies<br />
conclusions are correct nor that our earthquake coverage is in fact adequate. Furthermore, a study of the<br />
potential impact of machinery breakdown and ensuing business interruption showed that even in a worst-case<br />
scenario, losses at cement plants would be unlikely to exceed 10 to 20 million euros. Such a scenario has<br />
never occurred in the group’s entire history, which is why we do not insure such risks. However, there can be<br />
no assurance that such an event will not occur in the future.<br />
Civil liability, product liability and environmental damage policies cover amounts we believe to be<br />
commensurate with the nature of our business activities, the countries in which we operate, our claims history<br />
and the available capacity of the insurance market.<br />
The group has two reinsurance captives. One, which was set up in 2000, covers the frequency risk of the<br />
group’s subsidiaries. The risk retained by this captive varies between 2 million euros and 3 million euros per<br />
event (property damage and civil liability risks). The other originated from the acquisition of the Redland and<br />
Blue Circle groups and mainly handles the past risks incurred by these groups.<br />
Litigation<br />
We are involved in several legal proceedings, including contract disputes, product liability cases,<br />
environmental inquiries and remediation actions (see the subsection entitled ‘‘Environment’’) and fair<br />
competition proceedings, that have arisen in the ordinary course of business. We believe that we have made<br />
adequate provisions to cover both current or contemplated general and specific litigation risks and we believe<br />
that these matters will be resolved without any significant impact on our activity levels, financial position or<br />
results of operations.<br />
On December 3, 2002, the European Commission imposed a fine on our group in the amount of<br />
250 million euros on the grounds that some of our subsidiaries had allegedly colluded on market shares and<br />
prices with their competitors between 1992 and 1998 for wallboard, essentially in the United Kingdom and<br />
Germany. <strong>Lafarge</strong> vigorously challenges this decision and has brought the case before the Court of First<br />
Instance (CFI) in Luxembourg, which has jurisdiction over such matters, on February 14, 2003. The<br />
proceedings are currently taking place before the court. The resolution procedure usually takes several years<br />
based on comparable cases. As a bank guarantee was given on our behalf, no payment will have to be made<br />
before the decision of the court.<br />
Following investigations on the German cement market, the German competition authority, the<br />
Bundeskartellamt, announced on April 14, 2003, that it was imposing fines on German cement companies,<br />
including one in the amount of 86 million euros on <strong>Lafarge</strong> Zement, our German cement subsidiary for its<br />
alleged anti-competitive practices in Germany. <strong>Lafarge</strong> Zement believes that the amount of the fine is<br />
disproportionate in light of the actual facts and has brought the case before the Higher Regional Court, the<br />
Oberlandesgericht, in Düsseldorf. The court’s decision is not expected before several years. No payment nor<br />
any guarantee is required to be made or given prior to the court’s decision.<br />
A provision of 300 million euros was recorded in our financial statements for the year ended<br />
December 31, 2002 in connection with the two matters above and we recorded an additional provision of<br />
9 million euros in 2003 in relation to interest on the amount of the fines.<br />
On March 28, 2001, Dunn Industrial Group, Inc. (‘‘Dunn Industrial’’) filed a lawsuit against our<br />
subsidiary <strong>Lafarge</strong> North America and the City of Sugar Creek, Missouri in the Circuit Court of Jackson<br />
61
County, Missouri. In the suit, Dunn Industrial, the general contractor for the construction of our new cement<br />
plant in Sugar Creek, Missouri, alleges that we expanded the scope of work expected of Dunn Industrial in<br />
the construction of the plant without commensurate increases in time required for performance and amounts<br />
to be paid to Dunn Industrial. In connection therewith, the suit alleges breach of contract, quantum meruit,<br />
breach of warranty and negligent misrepresentation and seeks foreclosure of mechanic’s liens against <strong>Lafarge</strong><br />
North America and the City of Sugar Creek, Missouri, as well as damages. The amount of the liability of<br />
<strong>Lafarge</strong> North America in connection with this suit remains uncertain. The trial court ruled that the issues<br />
raised by Dunn Industrial need not be arbitrated but rather should be litigated. In December 2002, the<br />
Missouri appellate court reversed the trial court’s ruling and agreed with <strong>Lafarge</strong> North America that Dunn<br />
Industrial must arbitrate its claims. Upon further appeal by Dunn Industrial, the Missouri Supreme Court<br />
upheld the lower appellate court’s ruling and agreed that Dunn Industrial must arbitrate its claims. In its<br />
demand for relief in the arbitration, Dunn Industrial claims damages in excess of $120.5 million. <strong>Lafarge</strong><br />
North America has filed certain counter claims, and believes that Dunn Industrial’s claims are without merit<br />
and is vigorously defending its position in the arbitration.<br />
Finally, certain of our subsidiaries have litigation and claims pending in the normal course of business.<br />
Management is of the opinion that these matters will be settled without any material adverse effect on the<br />
company’s financial statements.<br />
ITEM 5. OPERATING AND FINANCIAL REVIEW AND PROSPECTS<br />
The following discussion should be read in conjunction with our consolidated financial statements which<br />
are included elsewhere in this Form 20-F. Our consolidated financial statements have been prepared in<br />
accordance with generally accepted accounting principles in France (‘‘French GAAP’’), which differ in<br />
significant respects from generally accepted accounting principles in the United States (‘‘U.S. GAAP’’). See<br />
Note 31 to our consolidated financial statements for a description of the principal differences between French<br />
GAAP and the U.S. GAAP as they relate to <strong>Lafarge</strong>.<br />
Our functional and reporting currency has been the euro since the introduction of the euro on January 1,<br />
1999. The consolidated financial statements for the years ended December 31, 2003, 2002 and 2001 have<br />
been prepared in euros.<br />
Overview<br />
The three-year period 2001 — 2003 started with the announcement of the acquisition of the United<br />
Kingdom based group Blue Circle Industries plc, which was concluded on July 11th 2001.<br />
The acquisition of what was the world’s sixth largest cement company placed us in the position of world<br />
leader in the cement industry and significantly expanded our world wide cement operations bringing us<br />
operations in the United Kingdom, Greece, Malaysia, Nigeria and Chile as well as widening our presence in<br />
the United States with operations in the North and South East, Egypt and the Philippines.<br />
However, as this was a very major acquisition, our financial position was extended as a result of the<br />
strain put on our debt and associated ratios. In 2003 we succeeded, as planned, to return our key financial<br />
ratios to the level experienced prior to the acquisition. This was achieved through our improved operational<br />
performance, tight control of capital expenditures and use of working capital, a sizeable program of<br />
divestments of non-strategic assets and a successful rights issue of 1,262 million euros. At year end 2003, our<br />
total debt amounted to 8,695 million euros, a reduction of 2,630 million euros compared to December 31,<br />
2002, while our cash and cash equivalents increased by 525 million euros to 1,634 million euros over the<br />
same period.<br />
Our strategy of geographical diversification has helped us to balance out the contrasting evolutions of<br />
our different markets. In the cement division, markets were well oriented in southern regions of Western<br />
Europe, the Mediterranean Basin and Sub-Saharan Africa in 2002/2003 while we experienced an unfavorable<br />
environment in some of our other markets, particularly in Germany, the Philippines, the United Kingdom and<br />
the United States. In Germany and the Philippines, severe price wars led prices downwards until the summer<br />
of 2003. In the United Kingdom and the United States rather weak markets, coupled with competitive<br />
62
pressure on prices in 2003, led to pressure on margins. At the same time, we continued to improve our<br />
industrial performances through our benchmarking procedures, cost reduction programs, relating in particular<br />
to energy consumption and coordinated procurement and our effort to improve plant reliability.<br />
In Aggregates & Concrete, our operations, mainly concentrated in Western Europe and North America,<br />
have faced contrasting markets conditions. Performance improvement programs have off-set in part these<br />
adverse market conditions.<br />
In 2003, we continued the restructuring of our German businesses in the Roofing division, which showed<br />
a significant improvement in our operating income on ordinary activities in 2003 despite stable conditions in<br />
the pitched roof market.<br />
The Gypsum division achieved the successful integration of Gyproc in Germany. In the United States the<br />
end of the price war, which we expected to see at the beginning of 2003, has been confirmed by the recent<br />
evolution of prices. This recovery, coupled with good market orientation and strong industrial performance<br />
has led to a significant improvement of our results.<br />
The improved contribution of our operating income from emerging markets in 2003 once again validates<br />
our long-term strategy of significantly expanding our presence in emerging markets in the Cement, Roofing<br />
and Gypsum divisions. We continue to believe emerging markets represent the best prospects for sustained<br />
long-term growth in each of these businesses. We classify all countries outside of our Western Europe and<br />
North America geographic sectors, with the exception of Japan, Australia and New Zealand, as emerging<br />
markets.<br />
Significant acquisitions and divestitures<br />
Materis. In September 2003 we sold our 33.36% stake in Materis Participations to LBO France, a French<br />
investment fund. This transaction amounted to a total of approximately 210 million euros including a fee<br />
related to the three-year license of the <strong>Lafarge</strong> trademark. We invested approximately 20 million euros, from<br />
the proceeds of the sale, in the newly created company (equivalent to a 7.27% equity stake). We realized a<br />
net capital gain on the sale of our stake in Materis to LBO France of 122 million euros. Our disposal took<br />
place concurrently with the sale by the investment funds CVC Capital Partners, Advent International and<br />
Carlyle of their own stake in Materis Participations. Materis Participations was formed when we sold a<br />
majority interest in most of the businesses in our former Specialty Products division to these three investment<br />
funds. This transaction was completed January 22, 2001. The sale price was based on a valuation of<br />
890 million euros including assumed debt. We initially retained 33.36% of the capital of Materis<br />
Participations. The agreements with respect to the disposition became legally binding on December 28, 2000<br />
and under French GAAP the transaction was recorded at that date. Under U.S. GAAP the transaction was<br />
treated as having occurred on January 22, 2001, the date payment was received in exchange for the shares.<br />
For a discussion of the difference in treatment of the establishment of Materis under French and U.S. GAAP<br />
see Note 31-10 to our consolidated financial statements.<br />
Blue Circle. We have consolidated the operations of Blue Circle since July 11, 2001, the date the High<br />
Court of London approved the scheme of arrangement for the recommended tender offer for the 77.4% of the<br />
shares of Blue Circle that we did not already own, at a price of 495 pence per share in cash. Final payment<br />
to the former Blue Circle shareholders was completed on July 25, 2001. The acquisition was funded through<br />
the issuance of 14,110,592 shares at a price of 80 euros a share in a 1 for 8 underwritten rights offering to<br />
our shareholders which was completed on February 2, 2001 and through bank financing. For a discussion of<br />
our current bank financing arrangements please see the section entitled ‘‘Liquidity and Capital Resources’’<br />
further on in this Item 5. Under French GAAP, the 22.6% investment we held in Blue Circle prior to the date<br />
of acquisition was accounted for under the cost method due to the lack of significant influence over Blue<br />
Circle as a result of a standstill agreement with the Canadian Competition Bureau.<br />
Seasonality<br />
Demand for our cement, aggregate and concrete and roofing products is seasonal and tends to be lower<br />
in the winter months in temperate countries and in the rainy season in tropical countries. We usually<br />
63
experience a reduction in sales on a consolidated basis during the first quarter reflecting the effect of the<br />
winter season in our principal markets in Western Europe and North America and an increase in sales in the<br />
second and third quarters reflecting the summer construction season.<br />
Critical accounting policies<br />
We prepare the consolidated financial statements of <strong>Lafarge</strong> in conformity with French GAAP. We also<br />
prepare a reconciliation of our consolidated financial statements to U.S. GAAP. The notes to our consolidated<br />
financial statements summarize the significant accounting policies which we believe are the most critical to<br />
aid in fully understanding and evaluating our reported financial results. See Note 2 to our consolidated<br />
financial statements regarding the significant accounting policies we apply under French GAAP and Note 31<br />
for a description of the principal differences between French GAAP and the U.S. GAAP as they relate to<br />
<strong>Lafarge</strong>.<br />
Certain of our critical accounting policies require the use of judgment in their application or require<br />
estimates of inherently uncertain matters. Although our accounting policies are in compliance with generally<br />
accepted accounting principles, a change in the facts and circumstances of the underlying transactions could<br />
significantly change the implication of the accounting policy and the resulting financial statement impact.<br />
Listed below are those policies that we believe are critical and require the use of complex judgment in their<br />
application.<br />
Impairment of Goodwill and Market Shares. The net book value of goodwill and market shares are<br />
reviewed annually to take into consideration factors that may have affected the assets’ value and<br />
recoverability.<br />
Our four divisions have been considered as the four segments of the company including reporting units,<br />
defined as being in general the activity of a segment in a country. In some specific cases, a reporting unit<br />
may be composed of different activities in one or several countries, or similar activities in several countries.<br />
The reporting unit is the level used by the company to organize activities and results in its internal reporting.<br />
In our goodwill and market shares impairment test, the company uses a combination of a market<br />
approach and an income approach. In the market approach, we compare the carrying value of our reporting<br />
units with multiples of their Gross Operating Income. For reporting units presenting an impairment risk<br />
according to the market approach we then use the income approach. In the income approach, we estimate the<br />
discounted value of the sum of the expected future cash flows. If the carrying value of the reporting unit is<br />
higher than the measured fair value of the related assets and liabilities, the company records extraordinary<br />
amortization of goodwill and market shares to reduce the carrying value of the reporting unit to its<br />
determined fair value.<br />
Evaluations for impairment are significantly impacted by estimates of future prices for our products, the<br />
evolution of expenses, economic trends in the local and international construction sector, the expectations on<br />
long-term development of emerging markets and other factors. This also depends on the discount rates used.<br />
The company has defined country specific discount rates for each of its reporting units based on their<br />
Weighted Average Cost of Capital. In some cases, the company uses a third party valuation as part of its<br />
impairment test.<br />
Pension Plans and Other Postretirement Benefits. The accounting for pension plans and other<br />
postretirement benefits requires us to make certain assumptions that have a significant impact on the expenses<br />
and liabilities that we record for pension plans and other postretirement benefits.<br />
The main defined pension plans and other postretirement benefits provided to employees by the company<br />
are in the United Kingdom and North America (The United States of America and Canada). The related<br />
projected benefit obligations as of December 31, 2003 represent 61% and 24%, respectively, of the<br />
company’s total projected benefit obligations.<br />
The primary assumptions made to account for pension plan and other postretirement benefit expenses<br />
and liabilities are disclosed in Note 23(b) to our consolidated financial statements.<br />
64
The expected long-term rate of investment return on pension plan assets is based on historical<br />
performance, current and long-term outlook and the asset mix in the pension trust funds. The discount rates<br />
reflect the rate of long term high-grade corporate bonds.<br />
The 2003 pension plan and other postretirement benefit expenses are impacted by the year-end 2002<br />
assumptions for the discount rate and the expected return rate on assets (pension plan only). For North<br />
America and the United Kingdom, if the 2002 discount rate assumption had been lowered by one percent, the<br />
2003 pension plan and other postretirement benefit expenses would have increased by approximately<br />
53 million euros. If the 2002 return rate on assets assumption had been lowered by one percent, the 2003<br />
pension plan expenses would have increased by approximately 28 million euros.<br />
For North America, we expect our pension plan and other postretirement benefit expenses to increase by<br />
$21 million from 2003 to 2004, and our minimum required cash contribution to defined benefit pension plans<br />
to increase by $56 million, due to both lower discount rates and a reduction in the expected return of pension<br />
plan assets. Also, an additional discretionary contribution of $43 million has been made to certain Canadian<br />
defined benefit plans in February 2004. For the United Kingdom, no significant increase of pension expense is<br />
expected in 2004 and the last actuarial valuation for local funding purposes, which was performed at the end<br />
of September 2003, concluded that no significant increase in employer’s contributors is necessary in 2004.<br />
The Accumulated Benefit Obligation is also impacted by the 2003 discount rate. For North America and<br />
the United Kingdom, the impact of decreasing the discount rate assumption by one percent as of<br />
December 31, 2003 would have been to increase the Accumulated Benefit Obligation as of December 31,<br />
2003 by approximately 427 million euros, and would have increased the Additional Minimum Pension<br />
Liability amount by approximately 425 million euros.<br />
Environmental costs. Costs that result in future economic benefits such as extending useful lives,<br />
increased capacity, safety or, those costs incurred to mitigate or prevent future environmental contamination<br />
are capitalized. When the company determines that it is probable that a liability for environmental costs<br />
exists, an undiscounted estimate of the future remediation is recorded as a provision without the offset of<br />
potential insurance recoveries. Environmental costs, which are not included above, are expensed as incurred.<br />
Site restoration. Where the company is legally or contractually required to restore a quarry site, the<br />
estimated costs of site restoration are accrued and amortized to cost of goods sold rateably, on a unit-ofproduction<br />
basis, over the operating life of the quarry. The estimated future costs for known restoration<br />
requirements are determined on a site by site basis and are calculated based on the present value of estimated<br />
future costs.<br />
Revenue Recognition. We derive the majority of our revenues through the direct sales of products by our<br />
subsidiaries from plants or from production sites. Consolidated revenues represent the value before sales tax<br />
of goods, products and services sold by consolidated enterprises in ordinary activities and after the<br />
elimination of intra-group sales. We record our revenues from the sales of our goods and products when<br />
ownership is transferred. Amounts billed to a customer in a sales transaction related to shipping and handling<br />
are included in ‘‘Sales’’, and costs incurred by the seller for shipping and handling are classified as ‘‘Cost of<br />
goods sold’’.<br />
Recent changes in accounting treatment<br />
As of January 1, 2002, the share of net income of equity affiliates determined in accordance with equity<br />
method consolidation principles is shown in the group consolidated statement of income on a specific line<br />
‘‘share of net income of equity affiliates’’. Prior to the adoption of this presentation, the company’s share of<br />
net income of equity affiliates was presented in the following line-items: ‘‘Operating income on ordinary<br />
activities’’, ‘‘Gains on disposals, net’’, ‘‘Other income (expenses), net’’, ‘‘Financial expenses, net’’ and<br />
‘‘Income tax’’. The presentation of the consolidated statements of income for 2001 has been revised for<br />
comparative purposes.<br />
65
Changes in accounting estimates<br />
Beginning January 1, 2002, the historical cost of cement plant assets has been reclassified into specific<br />
cost categories based upon their distinct characteristics. Each cost category represents cement plant<br />
components with specific useful lives. This new definition was based on a detailed technical study performed<br />
by the company. Prior to January 1, 2002, cement plant assets had been depreciated over their estimated<br />
useful lives, using a broader definition of cost classification. The new system of classifying costs has been<br />
applied prospectively as of January 1, 2002. On average, for a new cement plant, this change in estimate has<br />
resulted in increasing the depreciable useful life from 20 years to 28 years, which more closely reflects actual<br />
experience with modern cement plants.<br />
Origin of sales and operating income on ordinary activities<br />
We have provided an analysis of our sales by segment. Our reported segments correspond to our<br />
operating divisions. We record our revenues from the sales of our goods and products when delivery to the<br />
customer occurs. Revenues are shown net of commercial rebates and discounts. Financial discounts are<br />
accounted for as financial expenses. We report our revenues on a geographic segment basis by country of<br />
destination of the sale.<br />
Sales revenues of entities over which we have direct or indirect control of more than 50% of the<br />
outstanding voting shares, or over which we exercise effective control, are fully consolidated. Control exists<br />
where <strong>Lafarge</strong> has the power directly or indirectly to govern the financial and operating policies of an<br />
enterprise so as to obtain benefits from its activities. Revenues in companies in which we and third party<br />
investors have agreed to exercise joint control are consolidated by the proportionate consolidation method and<br />
we include our proportionate share of the joint ventures results. Revenues and expenses of subsidiaries<br />
acquired or disposed of during the year are recognized in the consolidated statements of income as from the<br />
date of control or up to the date of transfer of control, respectively.<br />
We have also provided an analysis by segment of Operating income on ordinary activities. This item<br />
corresponds to our total sales, less cost of goods sold and selling and administrative expenses and<br />
depreciation. We do not calculate operating income on ordinary activities on the basis of sales by destination.<br />
Effects of changes in the scope of our operations and currency fluctuations<br />
Variations in the scope of our operations, such as acquisitions and divestitures, together with changes in<br />
how we account for our business units, such as a change from proportionate to global consolidation, may<br />
increase or decrease our consolidated sales and operating results in comparison to prior years and thus make<br />
it difficult to discern the underlying performance of our continuing operations. Similarly, as a global business<br />
operating in numerous currencies, changes in exchange rates against our reporting currency, the euro, may<br />
result in an increase or a diminution in the sales and operating income on ordinary activities reported in euros<br />
by a business unit that are separate and apart from its results of operations.<br />
Except as otherwise noted, we calculate the impact of currency variances by converting the previous<br />
year’s figures as reported in their local currencies by the companies within the scope of consolidation using<br />
the current year’s exchange rates. We then calculate the exchange rate impact by measuring the difference<br />
between the previous year’s consolidated figures (historically converted using the previous year’s exchange<br />
rates) and the result of the above conversion using the current year’s exchange rates.<br />
Except as otherwise noted, we calculate the changes in the scope of consolidation (‘‘scope effects’’) for<br />
the year in question, by taking into account changes in our scope of operations resulting from acquisitions<br />
and dispositions of businesses during the period in question. We also include in the calculation of the scope<br />
effects the impact of the changes in the method of consolidation of the companies included within our scope<br />
of consolidation. With respect to acquired businesses, the scope effect for the first year of consolidation<br />
(‘‘Year 1’’) reflects operations subsequent to the initial date of consolidation. For the year following Year 1<br />
(‘‘Year 2’’), the scope effect reflects Year 2 operations of those businesses for the period in Year 2 that<br />
corresponds to the period in Year 1 when such businesses were not within the scope of consolidation. With<br />
66
espect to businesses leaving the scope of consolidation and with respect to the calculation of the specific<br />
scope effect attributable to Blue Circle, a similar method is used.<br />
Reconciliation of non-GAAP financial measures utilized — Net debt and total equity<br />
We use net debt to measure the evolution of our financial ratios in particular the net-debt-to-equity ratio<br />
(see the subsection entitled ‘‘Net cash (used in) provided by financing activities’’). Our senior management<br />
follows the net-debt-to-equity ratio to assess the financial structure of the group and more specifically the<br />
percentage of its equity that is leveraged by debt. We believe that this ratio is useful to investors as it<br />
provides a view of the group level of indebtedness as compared to its total equity.<br />
Our net debt is defined as the total of our long-term debt, current portion of long-term debt and our<br />
short-term bank borrowings less our cash and cash equivalents.<br />
Year ended<br />
December 31, 2003<br />
Year ended<br />
December 31, 2002<br />
Year ended<br />
December 31, 2001<br />
(in million euros)<br />
Long-term debt ;;;;;;;;;;;; 7,370 10,271 11,041<br />
Current portion of long-term debt ;;;; 985 524 1,350<br />
Short-term bank borrowings;;;;;;; 340 530 513<br />
Cash and cash equivalents ;;;;;;; (1,634) (1,109) (1,201)<br />
Net debt;;;;;;;;;;;;;;; 7,061 10,216 11,703<br />
We calculate the net-debt-to-equity ratio by dividing the amount of our net debt as computed above by<br />
our total equity, which we define as the sum of shareholder’s equity, minority interests and other equity as set<br />
out in our consolidated balance sheet.<br />
Year ended<br />
December 31, 2003<br />
Year ended<br />
December 31, 2002<br />
Year ended<br />
December 31, 2001<br />
(in million euros)<br />
Shareholder’s equity ;;;;;;;;;; 8,185 6,981 7,882<br />
Minority interests ;;;;;;;;;;; 2,191 2,155 2,551<br />
Other equity ;;;;;;;;;;;;; 118 134 163<br />
Total equity ;;;;;;;;;;;;; 10,494 9,270 10,596<br />
Results of Operations for the Fiscal Years ended December 31, 2003 and 2002<br />
In the discussion of our results for the years ended December 31, 2003 and 2002 that follows, the sales<br />
figures, unless noted otherwise, are consolidated sales by destination and include the contributions of our<br />
proportionately consolidated subsidiaries. The gross sales volumes figures we have provided for each division<br />
or geographic zone are the total volumes sold by destination, including the volumes sold to our other<br />
divisions and adjusted for the contributions of our proportionately consolidated subsidiaries.<br />
Sales<br />
Overview. Sales declined by 6.5% between 2002 and 2003, from 14,610 million euros to 13,658 million<br />
euros. Currency fluctuations had a significant negative impact of 9.0% reflecting in particular the strong<br />
appreciation of the euro against the majority of other currencies. Changes in the scope of consolidation had a<br />
net negative impact of 255 million euros, or 2.1%. Positive scope changes amounted to 156 million euros,<br />
while negative scope changes amounted to 411 million euros primarily reflecting the impact of divestments of<br />
certain cement operations in Spain in 2002 and Florida in 2003, as well as various Aggregates & Concrete<br />
activities in North America. Our sales from continuing operations at constant exchange rates grew by 4.6%<br />
after a significant recovery in North America in the second half and sustained levels of growth throughout the<br />
year in many emerging markets.<br />
Contributions to our sales by segment for the years ended December 31, 2003 and 2002 and the<br />
percentage variation between the two periods were as follows:<br />
67
Year ended<br />
December 31, 2003 % Var.<br />
Year ended<br />
December 31, 2002<br />
Sales (in million euros) % 2003/2002 (in million euros) %<br />
Cement ;;;;;;;;;; 6,383 46.7 (8.1) 6,948 47.6<br />
Aggregates & Concrete;;;; 4,465 32.7 (6.3) 4,768 32.6<br />
Roofing ;;;;;;;;;; 1,510 11.1 (1.8) 1,538 10.5<br />
Gypsum ;;;;;;;;;; 1,194 8.7 4.2 1,146 7.8<br />
Other ;;;;;;;;;;; 106 0.8 (49.5) 210 1.4<br />
Total ;;;;;;;;; 13,658 100.0 (6.5) 14,610 100.0<br />
Cement<br />
Contributions to our sales by geographic regions for the years ended December 31, 2003 and 2002 and<br />
the percentage variation between the two periods were as follows:<br />
Year ended<br />
December 31, 2003 % Var.<br />
Year ended<br />
December 31, 2002<br />
Sales (in million euros) % 2003/2002 (in million euros) %<br />
Western Europe;;;;;;; 2,099 32.9 (7.7) 2,274 32.7<br />
North America ;;;;;;; 1,345 21.1 (14.8) 1,579 22.7<br />
Central & Eastern Europe;;; 409 6.4 2.0 401 5.8<br />
Mediterranean Basin ;;;;; 441 6.9 (3.1) 455 6.6<br />
Latin America ;;;;;;; 416 6.5 (17.1) 502 7.2<br />
Sub-Saharan Africa and Indian<br />
Ocean;;;;;;;;;; 766 12.0 1.3 756 10.9<br />
Asia Pacific ;;;;;;;; 907 14.2 (7.5) 981 14.1<br />
Total ;;;;;;;;; 6,383 100.0 (8.1) 6,948 100.0<br />
Sales of the Cement division declined by 8.1% between 2002 and 2003, to 6,383 million euros, down<br />
from 6,948 million euros in 2002. This decline was in large part due to the appreciation of the euro against<br />
the majority of other currencies. Currency fluctuations had a negative impact on sales of 11.0% which<br />
amounted to 743 million euros. Overall changes in the scope of consolidation at constant exchange rates<br />
decreased sales by 2.2% representing 127 million euros. At constant scope and exchange rates, our sales grew<br />
by 5.1%.<br />
The total volumes sold by the Division in 2003 increased by 2% to 108 million tonnes of cement.<br />
In Western Europe sales totaled 2,099 million euros, a decrease of 7.7% compared to 2002. The<br />
divestment in 2002 of certain operations in Spain decreased sales by 115 million euros. The volumes sold in<br />
the region decreased by 7% to 30.6 million tonnes reflecting the impact of the divestment in Spain. Volumes<br />
in France were down due to contrasting regional markets, but favorable pricing trends resulted in sales being<br />
stable for the year. Volumes in the United Kingdom declined in a rather weak market. In addition imports put<br />
some pressure on volumes and prices. However the majority of the 17% decline in sales resulted from the<br />
translation impact of the appreciation of the euro against the pound sterling. Sales in Spain were down by<br />
28% reflecting the divestment of the cement operations in Andalusia in 2002. The remaining operations in<br />
Spain recorded another year of solid growth in a buoyant construction market. In Italy sales were marginally<br />
up from the previous year. Greece showed strong levels of growth in sales, up 15%, in the run up to the<br />
Olympic Games and due to a very buoyant residential housing market. In Germany, sales were negatively<br />
impacted by a severe price war throughout the year and were down by 15%. The situation finally stabilized<br />
towards year end.<br />
In North America, we achieved sales of 1,345 million euros, a decrease by 14.8%. The strengthening of<br />
the euro versus the U.S. dollar and the Canadian dollar adversely affected the evolution of our sales in the<br />
region. In addition the negative scope effect resulting from the divestment of our cement operations in Florida<br />
in 2003 had an unfavorable impact. Our sales volumes in the region increased by 3% to 18.0 million tonnes.<br />
The construction market in the United States in 2003 was mixed. While residential construction remained<br />
68
obust throughout the year, activity in the non-residential sector was weak and the many individual State<br />
budget deficits impacted the level of infrastructure spending. The strong recovery in the second half<br />
compensated for the shortfall in volumes experienced in the first half beset by unfavorable weather<br />
conditions. Exceptionally strong gains in sales were recorded across the United States in the last quarter with<br />
particularly strong growth in the Great Lakes, the Mississippi River region, the West and the North East.<br />
Prices however remained under some pressure and declined for the year as a whole particularly in the<br />
Southeast, Northeast and Mississippi River districts. In Canada demand was strong for the year overall, with<br />
the Western provinces showing the most favorable trends. A solid increase in prices was achieved in Canada<br />
in the year.<br />
In emerging markets we experienced a decline of 5.0% to 2,938 million euros, with these markets<br />
accounting for 46% of the division’s sales in 2003, compared to 45% in 2002. The drop in sales was almost<br />
entirely derived from the appreciation of the euro against the majority of local currencies.<br />
Our sales in Central and Eastern Europe rose by 2.0% to 409 million euros, but this progression was<br />
held back by the negative impact of foreign currency fluctuations on all currencies in the region. Our sales<br />
volumes in the region increased by 11% to 9 million tonnes. Sales grew by 12% in Romania, in a context of<br />
high demand and increased prices. In Poland sales were down by 18% as a result of foreign exchange impact<br />
and as the recession in the building industry continued to affect volumes and prices. In Serbia, Russia,<br />
Slovenia and the Ukraine, sales progressed favorably in spite of the negative foreign exchange impact.<br />
In the Mediterranean Basin we saw a 3.1% decline in sales to 441 million euros. Our reported sales were<br />
adversely affected by foreign exchange fluctuation. Our sales volumes in the region increased by 4% to<br />
9.9 million tonnes. In Morocco, the construction market was healthy throughout the year and despite a<br />
negative foreign exchange impact, sales increased by 8%. In Jordan the construction market for residential<br />
housing was very buoyant in the year and sales which were down by 5% would have risen strongly before<br />
the negative foreign exchange impact. In Egypt, market conditions and prices in local currency improved<br />
gradually in the year. However the devaluation of the Egyptian pound resulted in our sales being down by<br />
30%. In Turkey where the market improved in the second part of the year, our sales were up at constant<br />
scope of consolidation and exchange rates.<br />
Our sales in Latin America were down by 17.1% to 416 million euros. This primarily reflects the impact<br />
on sales in the region of the appreciation of the euro against the various regional currencies in the year. Our<br />
sales volumes in the region fell by 5% to 6.2 million tonnes of cement. Volumes were down in Brazil due to<br />
slower demand in the South and South-East, but despite the favorable impact of price increases put in place<br />
in the second half of 2002, the fall in the real led to sales being down by 13%. In the context of the political<br />
and economic turmoil and the collapse of the bolivar, sales in Venezuela fell by 41%. The operations in<br />
Chile performed well with both positive volume and price trends, but the negative foreign exchange impact<br />
led to a drop in sales of 15%. In Mexico sales were down by 9% as a result of the foreign exchange impact,<br />
otherwise sales grew strongly.<br />
In the Sub-Saharan Africa and Indian Ocean region our sales grew by 1.3% to 766 million euros. Our<br />
sales volumes in the area increased by 10% to 11.2 million tonnes of cement. Currency fluctuations had a<br />
negative impact on sales generated in many countries in the region but with the significant exception of South<br />
Africa where the rand’s strong appreciation against the euro and buoyant market conditions delivered sales<br />
growth of 49%.<br />
In Nigeria, sales grew strongly on the back of improved prices and some volume growth, but after<br />
negative currency impacts were down by 8%. In Kenya and Uganda, sales fell by 13% in each country due to<br />
negative currency impacts, although strong domestic market conditions and prices allowed for good growth in<br />
sales in local currency. Sales in Cameroon remained stable. South East Africa, which covers Zambia, Malawi,<br />
Tanzania and Zimbabwe contributed a 3% increase in sales.<br />
Our operations in the Asia Pacific region saw sales fall by 7.5% to 907 million euros as a consequence<br />
of negative foreign currency fluctuations. Our sales volumes in the region increased by 9% to 23.1 million<br />
tonnes. In South Korea, sales continued to show strong growth in local currency which was offset by the<br />
won’s depreciation against the euro. Domestic sales volumes were strong as construction spending continued<br />
69
to increase and prices developed favorably over the year. In Malaysia, sales decreased by 7% primarily as a<br />
result of the devaluation of the ringgit against the euro. Volumes improved on increased domestic demand,<br />
thanks to the resolution of the foreign construction labor issue in 2002 and continued economic development.<br />
Intense competition had a negative impact on selling prices. In the Philippines sales fell by 15% in large part<br />
as a consequence of the devaluation of the peso. Sales were also adversely affected by severe price<br />
competition in the first half of the year, but improved along with volumes during the second half. In India<br />
sales dropped by 16% largely due to negative currency fluctuations. Favorable pricing trends helped to offset<br />
lower volumes on sales. China has continued to deliver a strong growth in sales of 69% benefiting from the<br />
full-year operation of the Dujiangyan plant into the Greater Chengdu market and of the acquisition of the<br />
Chongqing plant in 2003. In Indonesia, sales were down 4%, due to currency fluctuations while they<br />
progressed in local monetary units, due to positive market conditions.<br />
Aggregates & Concrete<br />
Contributions to our sales by activity and by main geographic regions for the years ended December 31,<br />
2003 and 2002 and the percentage variation between the two periods were as follows:<br />
Year ended<br />
December 31, 2003 % Var.<br />
Year ended<br />
December 31, 2002<br />
Sales (in million euros) % 2003/2002 (in million euros) %<br />
Aggregates and related products 2,050 45.9 (6.6) 2,196 46.1<br />
Ready mix concrete and<br />
concrete products ;;;;; 2,415 54.1 (6.1) 2,572 53.9<br />
Total Aggregates & Concrete 4,465 100 (6.3) 4,768 100<br />
Western Europe;;;;;;; 1,845 41.3 (0.6) 1,856 38.9<br />
North America ;;;;;;; 2,130 47.7 (11.4) 2,405 50.5<br />
Other regions;;;;;;;; 490 11.0 (3.4) 507 10.6<br />
Total ;;;;;;;;; 4,465 100.0 (6.3) 4,768 100.0<br />
Sales of the Aggregates & Concrete division dropped by 6.3% to 4,465 million euros in 2003 from<br />
4,768 million euros in 2002. This decline was primarily due to the appreciation of the euro against other<br />
currencies. At constant scope and exchange rates, our sales rose by 3.8%. Changes in the scope of<br />
consolidation decreased sales by 1.7%. In Western Europe our sales declined by 0.6% to 1,845 million euros.<br />
In North America, our sales fell by 11.4% to 2,130 million euros.<br />
Sales of our aggregates operations, which also include our asphalt and road contracting businesses, were<br />
down by 6.6% between 2002 and 2003, to 2,050 million euros. At constant scope and exchange rates our<br />
sales from our operations rose by 2.8%. Currency fluctuations had a negative impact of 8.9% on sales. Our<br />
sales volumes of aggregates rose by 3% to 214 million tonnes in 2003.<br />
Our aggregates sales in Western Europe were stable at 791 million euros. In France sales rose as a<br />
consequence of a number of small acquisitions in the Western and South Western regions. Excluding these<br />
acquisitions, sales were at a similar level to the previous year, but with Northern France showing a marked<br />
decline compared to a growing South-West market. Volumes were down but prices however followed a<br />
favorable trend across all regions. In the United Kingdom, sales were down by 3% as a consequence of the<br />
depreciation of pound sterling against the euro. Excluding this factor sales grew on the back of good pricing<br />
in aggregates and asphalt and paving operations benefiting from major road contracts. With the healthy<br />
construction market in Spain, sales continued to grow in 2003.<br />
In North America, sales fell by 12% to 1,175 million euros. Currency fluctuations were behind this<br />
decline with an 11% negative impact on sales in euros. Sales at constant scope and exchange rates were<br />
almost flat but with contrasting markets. After a slow first half, due to poor weather conditions and slower<br />
construction activity in some markets, the second half brought stronger sales driven by a recovery in the<br />
United States. The Southern and Eastern United States showed strong sales growth by the end of the year.<br />
70
Eastern Canada also grew favorably, but the Western United States suffered from a declining activity in<br />
paving projects. Pricing improved with increases recorded in most markets and particularly in Canada.<br />
Sales of our concrete operations which include ready mix concrete and our pre-cast concrete products,<br />
declined by 6.1% between 2002 and 2003, from 2,572 million euros to 2,415 million euros. At constant scope<br />
and exchange rates our sales increased by 4.7%. Currency fluctuations had a negative impact on sales of<br />
8.0%. Our sales volumes of concrete decreased by 3% to 34 million m 3 .<br />
In Western Europe concrete sales dropped slightly by 1% to 1,054 million euros. In France, sales grew<br />
despite a decline in volumes, due to good pricing resulting from an increase in sales of higher value products<br />
and improved client mix. In the United Kingdom, at constant exchange rates, sales grew favorably in a<br />
number of markets and prices were sustained by sales of high value products. The favorable construction<br />
sector in Spain more than offset the impact of reduced public spending in Portugal. Sales in Greece were<br />
down mainly due to the poor weather in the first quarter. Sales in Germany decreased to 3 million euros from<br />
21 million euros following our withdrawal and the closure of our operations in that country.<br />
In North America, sales were down by 11% from 1,069 million euros in 2002 to 955 million euros in<br />
2003. Currency fluctuations had a negative impact on sales of 12%. In the United States, sales suffered from<br />
weak demand in Colorado but were helped by growth in Louisiana driven by a large project work. In Canada<br />
sustained residential demand and increased project work in the energy and minerals sector led to strong levels<br />
of sales growth in local currency.<br />
In the rest of the world, sales declined largely as a result of the negative foreign exchange impact. Sales<br />
at constant scope of consolidation and exchange rates grew strongly in Latin America, particularly in Chile.<br />
In South Africa sales grew strongly, however sales were down in Malaysia following the completion of a<br />
major project.<br />
Roofing<br />
Contributions to our sales by markets for the years ended December 31, 2003 and 2002 and the<br />
percentage variation between the two periods were as follows:<br />
Year ended<br />
December 31, 2003 % Var.<br />
Year ended<br />
December 31, 2002<br />
Sales (in million euros) % 2003/2002 (in million euros) %<br />
Western Europe ;;;;;;;;; 1,138 75.4 (2.1) 1,162 75.6<br />
Germany ;;;;;;;;;;; 439 29.1 (2.0) 448 29.1<br />
Other countries in Western Europe ; 699 46.3 (2.1) 714 46.5<br />
Other regions ;;;;;;;;;; 372 24.6 (1.1) 376 24.4<br />
Total ;;;;;;;;;;;; 1,510 100.0 (1.8) 1,538 100.0<br />
The Roofing division saw sales decline by 1.8% between 2002 and 2003, from 1,538 million euros to<br />
1,510 million euros. At constant scope and exchange rates sales rose by 3.0%. Currency fluctuations had a<br />
negative impact on sales of 3.7%.<br />
Sales of concrete tiles were down 4% to 764 million euros, but clay tiles were up by 5% to 267 million<br />
euros. Roof System Components grew by 2% to 251 million euros. Chimney sales increased by 5% to<br />
174 million euros.<br />
In Western Europe sales (including chimneys) were down by 2.1% to 1,138 million euros. In Germany<br />
sales declined overall with a further drop in concrete tiles but with an increase in clay tiles. Furthermore the<br />
favorable trends in the second half of the year resulting from the acceleration of the construction of private<br />
houses, in anticipation of an abolition of subsidies for home building had a positive impact. Sales grew<br />
strongly in the United Kingdom, excluding the foreign exchange impact. In France sales were down overall<br />
as demand for concrete tiles dropped not only due to a weaker market but also in the face of growing<br />
preference for clay tiles for which sales rose. In Italy, sales of concrete tiles and of clay tiles were well above<br />
last year, but overall sales decreased as the result of the reduction of the sales of the other activities.<br />
71
In North America, sales were down by 10% as a result of the negative impact of the U.S. dollar’s<br />
depreciation against the euro. Otherwise sales grew strongly in the context of the favorable residential<br />
housing market.<br />
In other regions sales were up by 3%. Good growth was recorded in Eastern European countries overall.<br />
In Asia, the level of sales was impacted by the negative currency fluctuations, but improved in local currency<br />
terms.<br />
Gypsum<br />
Contributions to our sales by main geographic regions for the years ended December 31, 2003 and 2002<br />
and the percentage variation between the two periods were as follows:<br />
Year ended<br />
December 31, 2003 % Var.<br />
Year ended<br />
December 31, 2002<br />
Sales (in million euros) % 2003/2002 (in million euros) %<br />
Western Europe;;;;;;; 657 55.0 8.8 604 52.7<br />
North America ;;;;;;; 226 18.9 (7.8) 245 21.4<br />
Other regions;;;;;;;; 311 26.1 4.7 297 25.9<br />
Total ;;;;;;;;; 1,194 100.0 4.2 1,146 100.0<br />
In 2003, sales of the Gypsum division continued to recover growing by 4.2% from 1,146 million euros<br />
in 2002 to 1,194 million euros in 2003. At constant exchange rates and scope of consolidation sales grew by<br />
6.4%. Changes in the scope of consolidation at constant exchange rates increased sales by 5.2% as a result of<br />
the acquisition in February 2003 of the plasterboard businesses of Gyproc in Germany and Poland from the<br />
British building materials company BPB. Currency fluctuations had a negative impact on sales of 7.4%. The<br />
volumes of wallboard grew by 13% to 632 million m2 with strong rises in the United Kingdom, in Germany<br />
due to the integration of Gyproc, in the United States and in Asia.<br />
In Western Europe, sales grew by 8.8% to 657 million euros with strong sales growth in the United<br />
Kingdom reflecting a very buoyant wallboard market throughout the year. The integration of Gyproc resulted<br />
in a significant improvement in Germany despite a declining market.<br />
In North America, sales dropped by 7.8% to 226 million euros from 245 million euros as a result of a<br />
39 million euros negative foreign exchange impact offsetting a good recovery. Volumes sold rose as the<br />
efficiency of our plants increased and at the same time a solid recovery in prices was realized, particularly in<br />
the second half of the year. Prices reached 105 U.S. dollars per thousand square feet (1,000 square feet is<br />
roughly 93 square meters) in December, the highest level since 2000 although annual average prices were<br />
only up to 97 U.S. dollars per thousand square feet in the United States compared to 96 U.S. dollars in 2002.<br />
In our other zones our sales in the division rose 4.7% to 311 million euros. In Asia all markets showed<br />
sustained growth but the full impact was held back due to the negative impact of currency fluctuations.<br />
Eastern Europe grew as a result of the increase in sales in Romania where our operations were expanded. We<br />
increased our stake from 50% to 90% in <strong>Lafarge</strong> Arcom Gips in Romania.<br />
Other<br />
Sales of our other operations fell by 50% between 2002 and 2003, from 210 million euros to 106 million<br />
euros following further divestments made, principally being construction operations in Spain as we continue<br />
to divest and wind down these non-strategic operations.<br />
Operating income on ordinary activities<br />
Operating income on ordinary activities takes into account Sales, Cost of Goods Sold, Selling and<br />
Administrative Expenses and Depreciation. We do not report Cost of Goods Sold, Selling and Administrative<br />
Expenses and Depreciation by segment.<br />
72
Cost of Goods Sold declined by 6.6% between 2002 and 2003, from 9,734 million euros to 9,088 million<br />
euros. Currency fluctuations and changes in the scope of consolidation decreased Cost of Goods Sold by 826<br />
and 204 million euros, respectively. Cost of Goods Sold was adversely affected by an increase in pension<br />
cost of 28 million euros. At constant scope and exchange rates Cost of Goods Sold increased by 4.3%.<br />
Selling and Administrative Expenses remained almost stable, amounting to 1,750 million euros in 2003<br />
compared to 1,775 million euros in 2002. Currency fluctuations and changes in the scope of consolidation<br />
decreased Selling and Administrative Expenses by 137 and 8 million euros, respectively. At constant scope<br />
and exchange rates Selling and Administrative Expenses increased by 7.4%, adversely affected by a<br />
significant increase of pension costs in the United Kingdom and North America, which amounted to 71 million<br />
euros. At constant scope and exchange rates Selling and Administrative Expenses, excluding the pension<br />
increase effect, increased by 3.0%.<br />
Depreciation decreased by 8.6% between 2002 and 2003, from 969 million euros to 886 million euros.<br />
Currency fluctuations and changes in the scope of consolidation decreased Depreciation by 84 and 6 million<br />
euros, respectively. At constant scope and exchange rates, Depreciation remained almost constant.<br />
Operating income on ordinary activities declined by 9.3% between 2002 and 2003, from 2,132 million<br />
euros to 1,934 million euros. The appreciation of the euro against the majority of other currencies had a<br />
negative impact of 185 million euros. Changes in the scope of consolidation accounted for a net decrease of<br />
46 million euros and are essentially due to the divestments of cement operations in 2002 in Spain and in<br />
2003 in Florida. At constant scope and exchange rates, operating income on ordinary activities from our<br />
ongoing operations recorded a limited increase of 1.7%. As a percentage of our sales, operating income on<br />
ordinary activities represented 14.2% in 2003, compared to 14.6% in 2002. Excluding the effect of the<br />
99 million euros increase in pension cost, our operating income on ordinary activities, expressed as a<br />
percentage of sales, would have been 14.9% in 2003.<br />
Contributions to our operating income on ordinary activities by segment for the years ended<br />
December 31, 2003 and 2002, and the percentage change between the periods were as follows:<br />
Year ended<br />
December 31, 2003 % Var.<br />
Year ended<br />
December 31, 2002<br />
Operating income on ordinary activities (in million euros) % 2003/2002 (in million euros) %<br />
Cement ;;;;;;;;;;;;;;;; 1,466 75.8 (8.7) 1,606 75.3<br />
Aggregates & Concrete;;;;;;;;;; 283 14.6 (15.8) 336 15.8<br />
Roofing ;;;;;;;;;;;;;;;; 142 7.3 7.6 132 6.2<br />
Gypsum ;;;;;;;;;;;;;;;; 84 4.3 64.7 51 2.4<br />
Others ;;;;;;;;;;;;;;;; (41) –2.0 — 7 0.3<br />
Total ;;;;;;;;;;;;;;; 1,934 100.0 (9.3) 2,132 100.0<br />
Cement<br />
Contributions to our Cement operating income on ordinary activities by geographic regions for the years<br />
ended December 31, 2003 and 2002, and the percentage change between the periods were as follows:<br />
Year ended<br />
December 31, 2003 % Var.<br />
Year ended<br />
December 31, 2002<br />
Operating income on ordinary activities (in million euros) % 2003/2002 (in million euros) %<br />
Western Europe;;;;;;;;;;;;; 606 41.4 (7.6) 656 40.8<br />
North America ;;;;;;;;;;;;; 247 16.8 (25.2) 330 20.5<br />
Central & Eastern Europe;;;;;;;;; 90 6.1 4.7 86 5.4<br />
Mediterranean Basin ;;;;;;;;;;; 121 8.3 8.0 112 7.0<br />
Latin America ;;;;;;;;;;;;; 164 11.2 (18.8) 202 12.6<br />
Sub-Saharan Africa and Indian Ocean;;;; 135 9.2 12.5 120 7.5<br />
Asia Pacific ;;;;;;;;;;;;;; 103 7.0 3.0 100 6.2<br />
Total ;;;;;;;;;;;;;;; 1,466 100.0 (8.7) 1,606 100.0<br />
73
Operating income on ordinary activities of the Cement division declined by 8.7% to 1,466 million euros<br />
in 2003 compared to 1,606 million euros in 2002. At constant scope of consolidation and exchange rates,<br />
operating income on ordinary activities rose by 4.0%. Currency fluctuations had a negative impact of 9.3% or<br />
149 million euros. Changes in the scope of consolidation had a negative impact of 3.4% or 48 million euros.<br />
As a percentage of the division’s gross sales (see Note 3(a) to our consolidated financial statements),<br />
operating income on ordinary activities represented 21.2% in 2003, compared to 21.4% in 2002.<br />
We estimate that the synergy programs launched after the acquisition of Blue Circle Industries are on<br />
target. They contributed to the improvement of our operating income on ordinary activities, but were partially<br />
offset by adverse market effects such as the price war in the Philippines and the unfavorable environment in<br />
the Northeast and Southeast regions in the United States.<br />
Operating income on ordinary activities in Western Europe declined by 7.6% to 606 million euros<br />
compared to 656 million euros in 2002. Currency fluctuations had a negative impact of 12 million euros. The<br />
effect of changes in the scope of consolidation resulting from the divestment of the Cement operations in<br />
Andalusia in 2002 amounted to 30 million euros. Operating income on ordinary activities at constant scope of<br />
consolidation and exchange rates declined by 1% compared to 2002, primarily reflecting the impact of a<br />
highly competitive pricing environment in Germany and the weak market environment in the United<br />
Kingdom. In the United Kingdom operating income on ordinary activities was further impacted by a 7 million<br />
euros increase in pension costs. These adverse effects were partly compensated by the strong level of<br />
domestic sales in Greece, in the run up to the Olympic Games, improved margins in France and solid sales<br />
growth in Spain. Improved industrial performance throughout the region contributed positively.<br />
Operating income on ordinary activities in North America declined by 25.2% to 247 million euros<br />
compared to 330 million euros in 2002. Currency fluctuations had a negative impact on operating income on<br />
ordinary activities of 40 million euros. The scope effect resulting from the divestment of our operations in<br />
Florida amounted to 7 million euros. At constant scope and exchange rates, operating income in North<br />
America was down by 13%. Higher volumes and higher prices in Canada were offset by an increase in<br />
pension costs of 14 million euros, weaker U.S. prices, particularly in the Southeast, Northeast and Mississippi<br />
River regions and an unfavorable inventory variation effect. Manufacturing costs improved year-on-year due<br />
to a reduction in maintenance costs, as well as to the absence of the exceptional costs incurred in 2002 for<br />
the startup of the Sugar Creek, Missouri, and Roberta, Alabama, plants, and the strike at the Bath plant in<br />
Ontario.<br />
In emerging markets, operating income on ordinary activities declined by 1.1% to 613 million euros<br />
compared to 620 million euros in 2002, representing 42% of the Cement division’s operating income on<br />
ordinary activities, compared to 39% in 2002. Currency fluctuations and changes in the scope of consolidation<br />
had a negative impact of respectively 97 and 11 million euros. Operating income on ordinary activities at<br />
constant scope and exchange rates grew by 20%.<br />
In Central and Eastern Europe operating income on ordinary activities grew by 4.7% to 90 million euros<br />
compared to 86 million euros in 2002. The negative impact of currency fluctuations and of changes in the<br />
scope of consolidation on the region’s operating income on ordinary activities amounted, respectively, to 11<br />
and 6 million euros. Operating income on ordinary activities at constant scope and exchange rates grew by<br />
28%, with strong margin improvement in Romania and to a lesser extent in Russia, Serbia and Slovenia. In<br />
Poland, where we opened a new production line at the Kujawy plant in the Summer of 2003, the adverse<br />
volume and price effects were entirely offset by reductions in manufacturing costs. In the Czech Republic<br />
operating income on ordinary activities was unfavorably affected by the decline in volumes and deterioration<br />
in prices which occurred both on the domestic market and in Germany, the main export market.<br />
Operating income on ordinary activities from the Mediterranean Basin countries increased by 8.0% to<br />
121 million euros compared to 112 million euros in 2002. The negative impact of currency fluctuations and<br />
of changes in the scope of consolidation on the region’s operating income on ordinary activities amounted,<br />
respectively, to 14 and 4 million euros. Operating income on ordinary activities at constant scope and<br />
exchange rates grew by 29% with well oriented markets in Jordan and in Morocco. In Egypt and in Turkey<br />
operating income on ordinary activities was favorably affected by a progressive improvement in prices.<br />
74
The operating income on ordinary activities from Latin America declined by 18.8% from 202 million<br />
euros in 2002 to 164 million euros in 2003. The negative impact of currency fluctuations and of changes in<br />
the scope of consolidation on the region’s operating income on ordinary activities amounted, respectively, to<br />
45 and 4 million euros. At constant scope and exchange rates, operating income on ordinary activities grew<br />
by 7% with improved margins in Brazil despite slower demand. In Venezuela, the local turmoil and bolivar<br />
devaluation resulted in operating income on ordinary activities being down by 42%. In Honduras, a weak<br />
local market and unfavorable foreign exchange impact resulted in operating income on ordinary activities<br />
declining by 35%. A decline was recorded in Chile as the result of the negative foreign exchange impact. In<br />
Mexico, operating income on ordinary activities remained stable compared to 2002.<br />
Operating income on ordinary activities in Sub-Saharan Africa and the Indian Ocean increased by 12.5%<br />
from 120 million euros in 2002 to 135 million euros in 2003. The negative impact of currency fluctuations<br />
and changes in the scope of consolidation on the region’s operating income on ordinary activities amounted,<br />
respectively, to 9 and 1 million euros. At constant scope of consolidation and exchange rates, operating<br />
income on ordinary activities grew by 23% with improvements particularly noticeable in Nigeria and South<br />
Africa. In Nigeria where the new Ewekoro plant started in the second part of the year we benefited from<br />
favorable pricing conditions, but our operations were penalized by a general strike and the poor performance<br />
of the Sagamu plant. In South Africa the strengthening of the rand and increased margins have resulted in<br />
operating income on ordinary activities being up by 39%. Operating income on ordinary activities in Kenya<br />
was down primarily as a result of the negative currency fluctuation. Cameroon increased its operating income<br />
on ordinary activities.<br />
Operating income on ordinary activities in the Asia Pacific region increased by 3.0% from 100 million<br />
euros in 2002 to 103 million euros in 2003. The negative impact of currency fluctuations on the region’s<br />
operating income on ordinary activities amounted to 18 million euros. The positive impact of changes in the<br />
scope of consolidation amounted to 4 million euros. At constant scope of consolidation and exchange rates,<br />
operating income on ordinary activities increased by 21% with strong growth in Malaysia, South Korea and<br />
Indonesia. Operating income on ordinary activities benefited from the significant volume growth in Malaysia,<br />
from favorable market conditions in South Korea, improved margins in Indonesia and plant performance<br />
improvements with improved kiln reliability in Indonesia and in the Philippines in particular. The small loss<br />
incurred in Indonesia in 2002 was reversed to record an operating profit. In India, improved industrial<br />
performance had a positive effect on margins, but operating income on ordinary activities was adversely<br />
affected by higher local taxes, while the impact of the fall in volumes was entirely compensated by improved<br />
pricing. Despite plant performance improvements, operating income on ordinary activities in the Philippines<br />
was weak due to deteriorated pricing. In China operating income on ordinary activities benefited from the<br />
favorable effect of changes in the scope of consolidation with the full-year operation of the Dujiangyan plant<br />
and the acquisition in 2003 of the Chongqing plant.<br />
Aggregates & Concrete<br />
Contributions to our Aggregates & Concrete operating income on ordinary activities by activity and by<br />
main geographic regions for the years ended December 31, 2003 and 2002, and the percentage change<br />
between the periods were as follows:<br />
Year ended<br />
December 31, 2003 % Var.<br />
Year ended<br />
December 31, 2002<br />
Operating income on ordinary activities (in million euros) % 2003/2002 (in million euros) %<br />
Aggregates and related products ;;;;;; 191 67.5 (22.4) 246 73.2<br />
Ready mix concrete and concrete products ;; 92 32.5 2.2 90 26.8<br />
Total Aggregates & Concrete ;;;;;; 283 100.0 (15.8) 336 100.0<br />
Western Europe;;;;;;;;;;;;; 133 47.0 (10.1) 148 44.0<br />
North America ;;;;;;;;;;;;; 126 44.5 (29.2) 178 53.0<br />
Other regions;;;;;;;;;;;;;; 24 8.5 140.0 10 3.0<br />
Total ;;;;;;;;;;;;;;; 283 100.0 (15.8) 336 100.0<br />
75
Operating income on ordinary activities of the Aggregates & Concrete division declined by 15.8%<br />
between 2002 and 2003, from 336 million euros to 283 million euros. Currency fluctuations had a negative<br />
impact of 7% or 27 million euros. The net effect of changes in the scope of consolidation, primarily resulting<br />
from divestments in North America and from the withdrawal from Germany, amounted to 3 million euros. At<br />
constant scope of consolidation and exchange rates, operating income on ordinary activities declined by 9%.<br />
As a percentage of the division’s gross sales (see Note 3(a) to our consolidated financial statements),<br />
operating income on ordinary activities represented 6.3% in 2003, compared to 7.0% in 2002. Operating<br />
income on ordinary activities for aggregates totaled 191 million euros down 22.4% from 246 million euros in<br />
2002. Currency fluctuations had a negative impact of 8% being 23 million euros. Operating income on<br />
ordinary activities for Concrete totaled 92 million euros up 2.2% from 90 million euros in 2002. Currency<br />
fluctuations had a negative impact of 4 million euros.<br />
In Western Europe, operating income on ordinary activities dropped by 10.1% to 133 million euros with<br />
the decline occurring essentially in France where operating income on ordinary activities was impacted by the<br />
weaker market and an increase in production costs. In the United Kingdom operating income on ordinary<br />
activities was down as a result of the negative currency fluctuation; otherwise operating income on ordinary<br />
activities grew as operating margins improved in the concrete activities.<br />
In North America, operating income on ordinary activities was down by 29.2% to 126 million euros. The<br />
impact on operating income on ordinary activities of the weakening of the dollar against the euro amounted<br />
to 24 million euros or 11%. The net effect of changes in the scope of consolidation on operating income on<br />
ordinary activities was 2 million euros. The increase in pension costs which totaled 15 million euros<br />
contributed to the decline in operating income on ordinary activities. The remainder of the decline in<br />
operating income on ordinary activities resulted in particular from weak business conditions during the first<br />
half of the year as well as the exit cost of our highway paving business in New Mexico. All regions, with the<br />
exception of the Western United States, saw a significant improvement in the last quarter.<br />
Elsewhere in the world, operating income on ordinary activities continued to improve to 24 million euros<br />
in 2003 compared to 10 million euros in 2002. In South Africa, operating income continued to grow strongly<br />
under the combined effect of improved performance and of the rand’s appreciation against the euro. In<br />
Turkey, the operating loss was reduced, with margins favorably affected by the continued improvements in<br />
performance.<br />
Roofing<br />
Contributions to our operating income on ordinary activities in our Roofing division by main markets for<br />
the years ended December 31, 2003 and 2002, and the percentage change between the periods were as<br />
follows:<br />
Year ended<br />
December 31, 2003 % Var.<br />
Year ended<br />
December 31, 2002<br />
Operating income on ordinary activities (in million euros) % 2003/2002 (in million euros) %<br />
Western Europe ;;;;;;;;;;;; 105 73.9 1.9 103 78.0<br />
Germany ;;;;;;;;;;;;;; 44 31.0 33.3 33 25.0<br />
Other countries in Western Europe ;;;; 61 42.9 (12.9) 70 53.0<br />
Other regions ;;;;;;;;;;;;; 37 26.1 27.6 29 22.0<br />
Total ;;;;;;;;;;;;;;; 142 100.0 7.6 132 100.0<br />
The division’s operating income on ordinary activities was up 7.6% to 142 million euros from<br />
132 million euros in 2002 as a result of the cost management efforts and extensive restructuring carried out<br />
across the operations, particularly in Germany. Currency fluctuations had a negative impact of 6 million<br />
euros. As a percentage of the division’s gross sales (see Note 3(a) to our consolidated financial statements),<br />
operating income on ordinary activities represented 9.4% in 2003, compared to 8.6% in 2002.<br />
Operating income on ordinary activities in Western Europe rose by 1.9% to 105 million euros. In<br />
Germany, following the extensive restructuring, operating income on ordinary activities increased by 33.3%<br />
76
from 33 million euros to 44 million euros despite a persistent weak market. In other Western European<br />
countries operating income on ordinary activities declined from 70 million euros in 2002 to 61 million euros<br />
in 2003. In the United Kingdom operating income on ordinary activities benefited from strong sales<br />
development. However this was more than offset by the impact of unfavorable market trends in France and in<br />
the Netherlands. In addition, higher pressure on prices in Austria and Benelux hampered improvements in<br />
margins.<br />
Outside Western Europe, operating income on ordinary activities increased to 37 million euros in 2003<br />
from 29 million euros in 2002. Major contributors were Central and Eastern Europe, and in particular the<br />
Czech Republic, and North America.<br />
Gypsum<br />
Contributions to our Gypsum operating income on ordinary activities by main geographic regions for the<br />
years ended December 31, 2003 and 2002, and the percentage change between the periods were as follows:<br />
Year ended<br />
December 31, 2003 % Var.<br />
Year ended<br />
December 31, 2002<br />
Operating income on ordinary activities (in million euros) % 2003/2002 (in million euros) %<br />
Western Europe;;;;;;;;;;;;; 66 78.6 11.9 59 115.7<br />
North America ;;;;;;;;;;;;; (14) (16.7) N/A (28) (54.9)<br />
Other regions;;;;;;;;;;;;;; 32 38.1 60.0 20 39.2<br />
Total ;;;;;;;;;;;;;;; 84 100.0 64.7 51 100.0<br />
Operating income on ordinary activities grew by 64.7% from 51 million in 2002 to 84 million in 2003.<br />
This remarkable growth follows the significant improvement achieved in 2002, after the very difficult year in<br />
2001. Currency fluctuations had no impact on our operating income on ordinary activity. The positive scope<br />
effect resulting from the acquisition of Gyproc in Germany amounted to 3 million euros. At constant scope,<br />
operating income on ordinary activities increased by 56%. This was primarily due to the reduction of losses<br />
in North America, helped by better pricing and a better operational performance from our factories. As a<br />
percentage of the division’s gross sales (see Note 3(a) to our consolidated financial statements), operating<br />
income on ordinary activities represented 7.0% in 2003, compared to 4.4% in 2002.<br />
Operating income on ordinary activities in Western Europe improved by 11.9% to 66 million euros up<br />
from 59 million in 2002. At constant scope of consolidation and exchange rates, operating income on<br />
ordinary activities increased by 7%. Benefiting from better volumes and improved industrial performance,<br />
operating income on ordinary activities in France improved despite an increase in energy costs, while, in the<br />
United Kingdom, operating income on ordinary activities recorded a noticeable increase due to the buoyant<br />
market and a better performance. In Germany, we benefited from the action plan launched in 2002 together<br />
with the acquisition of Gyproc. Operating losses were reduced despite difficult market conditions.<br />
In North America, a combination of manufacturing performance improvements, the idling of the<br />
Wilmington plant and price increases reduced the operating loss in 2003 to 14 million euros, compared to a<br />
loss of 28 million euros in 2002. With improved plant performance we were able to supply the increased<br />
demand for wallboard, despite having idled the Wilmington plant. Prices recovered by the end of the year to<br />
levels not seen since 2000, but this favorable effect was partly offset by higher natural gas prices and fuel<br />
costs. The two high speed plants at Silver Grove and Palatka performed well, allowing a significant decrease<br />
in operating costs.<br />
In our other regions operating income on ordinary activities rose to 32 million euros in 2003, compared<br />
to 20 million euros in 2002. Most of this improvement was attributable to Poland, which benefited from the<br />
combined effects of increased volumes following the Gyproc acquisition, the recovery of prices and lower<br />
selling and administrative expenses. After a few months of ramp-up and after the closure of the old Gacki<br />
plant, the new Gacki plant performed well. Our operating income on ordinary activities in the Asia Pacific<br />
region increased slightly with increased volumes and improved profitability in most countries offset by<br />
currency fluctuations.<br />
77
Other (including holdings)<br />
Operating income on ordinary activities of our other operations decreased by 48 million euros between<br />
2002 and 2003, from a profit of 7 million euros to a loss of 41 million euros. In the United Kingdom our<br />
holdings were adversely affected by an increase in pension costs of 62 million euros.<br />
Operating income and net income<br />
Operating income takes into account operating income on ordinary activities, gains (losses) on disposals<br />
and other revenues (expenses). The table below shows the evolution of our operating income and net income:<br />
Year ended<br />
December 31, 2003<br />
(in million euros)<br />
% Var.<br />
2003/2002<br />
Year ended<br />
December 31, 2002<br />
(in million euros)<br />
Operating income on ordinary activities ;;;; 1,934 (9.3) 2,132<br />
Gains on disposals, net ;;;;;;;;;;;; 299 38.4 216<br />
Other income (expenses), net ;;;;;;;;; (177) (525)<br />
Operating income ;;;;;;;;;;;;; 2,056 12.8 1,823<br />
Financial expenses, net ;;;;;;;;;;;; (568) 9.0 (521)<br />
Income tax ;;;;;;;;;;;;;;;;; (425) (5.1) (448)<br />
Share of net income in equity affiliates ;;;;; 37 12.1 33<br />
Amortization of goodwill ;;;;;;;;;;; (135) (14.6) (158)<br />
Minority interests ;;;;;;;;;;;;;; (237) (13.2) (273)<br />
Net income ;;;;;;;;;;;;;;;; 728 59.6 456<br />
Gains on disposals, net represented a net gain of 299 million euros in 2003, compared to 216 million<br />
euros in 2002. The most significant capital gains were earned on:<br />
s The sale of certain cement assets in North America which generated capital gains of 111 million<br />
euros; and<br />
s The sale of our stake in Materis Participations which generated capital gains of 122 million euros;<br />
Other income (expenses), net, represented a net loss of 177 million euros in 2003, compared to a net loss<br />
of 525 million euros in 2002. The most significant expense items were the costs relating to exceptional<br />
amortization of 35 million euros and to restructuring charges of 65 million euros split between Roofing at<br />
29 million euros, Cement at 24 million euros, Aggregates & Concrete at 11 million euros and Gypsum at<br />
1 million euros. In 2002, Other income (expenses), net included a provision of 300 million euros recorded to<br />
cover the risks related to the European Commission decision against our Gypsum activities in Europe, and in<br />
anticipation of the German competition authority’s (Bundeskartellamt) decision to fine our subsidiary <strong>Lafarge</strong><br />
Zement for its Cement activities in Germany, both of which <strong>Lafarge</strong> has appealed against.<br />
Operating income increased by 12.8% between 2002 and 2003, from 1,823 million euros to 2,056 million<br />
euros. Operating income represented 15.1% of sales in 2003, compared to 12.5% in 2002.<br />
Financial expenses, net increased by 9.0% between 2002 and 2003, from 521 million euros to 568 million<br />
euros. Financial expenses, net is comprised of financial expenses on net indebtedness and other financial<br />
income and expenses including in particular foreign exchange gains and losses. Financial expenses on net<br />
indebtedness decreased by 12% between 2002 and 2003, from 577 million euros to 505 million euros as the<br />
result of the significant decrease of our net indebtedness. The average interest rate on our debt was 5.8% on<br />
December 31, 2003 as compared to 5.2% on December 31, 2002. Other financial income and expenses was a<br />
net loss in 2003 of 63 million euros compared to a net gain of 56 million euros in 2002. In 2003, we were<br />
adversely affected by a 75 million euros foreign exchange loss, while in 2002, we benefited from a foreign<br />
exchange gain of 66 million euros.<br />
Income tax decreased by 5.1% between 2002 and 2003, from 448 million euros to 425 million euros.<br />
The effective tax rate for 2003 of 28.6% decreased by 5.8 points compared to the effective tax rate for 2002<br />
of 34.4%. This is mainly due to the exceptional provision of 300 million euros that was recorded in 2002 (in<br />
78
connection with the competition law issues discussed above) and which is not tax deductible. Our world wide<br />
tax agreement with the French Tax Authorities,which had been renewed for three years in 2001, expired on<br />
December 31, 2003. We decided not to renew this agreement beyond December 31, 2003 (see Note 9 to our<br />
consolidated financial statements).<br />
Share of net income in equity affiliates grew by 12.1% between 2002 and 2003, from 33 million euros to<br />
37 million euros. The share of net income in equity affiliates in our Cement division amounted to 42 million<br />
euros, of which Molins accounted for 27 million euros. The share of net income in equity affiliates in our<br />
Roofing and Gypsum divisions amounted to 20 million euros. The share of the net loss of Carmeuse North<br />
America amounted to 33 million euros.<br />
Amortization of goodwill declined by 14.6% between 2002 and 2003, from 158 million euros to<br />
135 million euros. This decrease primarily reflects the impact of currency fluctuations.<br />
Minority interests decreased by 13.2% between 2002 and 2003, from 273 million euros to 237 million<br />
euros, reflecting primarily the negative impact of currency fluctuations on our reported results.<br />
Net income increased by 59.6% between 2002 and 2003, from 456 million euros to 728 million euros,<br />
reflecting primarily the impact of the 2002 exceptional provision of 300 million euros. Net income<br />
represented 5.3% of sales in 2003, compared to 3.1% in 2002.<br />
Earnings per Share<br />
Earnings per share were up 39.8% at 4.92 euros compared to 3.52 euros in 2002. The average number of<br />
shares outstanding during the year was 147.9 million, as compared to 129.6 million in 2002.<br />
Results of operations for the fiscal years ended December 31, 2002 and 2001<br />
In the discussion of our results for the years ended December 31, 2002 and 2001 that follows the sales<br />
figures unless noted otherwise are consolidated sales by destination and include the contributions of our<br />
proportionately consolidated subsidiaries. The gross sales volumes figures we have provided for each division<br />
or geographic zone are the total volumes sold by destination, including the volumes sold to our other<br />
divisions and adjusted for the contributions of our proportionately consolidated subsidiaries.<br />
Sales<br />
Overview. Sales grew by 6.7% between 2001 and 2002, from 13,698 million euros to 14,610 million<br />
euros. Our sales from continuing operations at constant exchange rates decreased by 0.3% reflecting the<br />
weaker market conditions experienced in the latter part of the year and especially in the last quarter. Changes<br />
in the scope of consolidation at constant exchange rates had a net positive effect of 1,493 million euros, or<br />
11.4%. Acquisitions had a positive impact on sales of 1,772 million euros, primarily reflecting the full-year<br />
consolidation of the former Blue Circle operations, while disposals had a negative impact of 160 million<br />
euros. The change in accounting treatment of <strong>Lafarge</strong> Morocco, from global consolidation to proportionate<br />
consolidation, resulted in a reduction in sales of 119 million euros. Currency fluctuations had a negative<br />
impact of 4.4% reflecting the depreciation of the U.S. and Canadian dollars and other currencies such as the<br />
Brazilian real and South African rand.<br />
79
Contributions to our sales by segment for the years ended December 31, 2002 and 2001 and the<br />
percentage variation between the two periods were as follows:<br />
Year ended<br />
December 31, 2002 % Var.<br />
Year ended<br />
December 31, 2001<br />
Sales (in million euros) % 2002/2001 (in million euros) %<br />
Cement ;;;;;;;;;; 6,948 47.6 15.9 5,995 43.8<br />
Aggregates & Concrete;;;; 4,768 32.6 (0.8) 4,806 35.1<br />
Roofing ;;;;;;;;;; 1,538 10.5 (3.0) 1,585 11.6<br />
Gypsum ;;;;;;;;;; 1,146 7.8 6.9 1,072 7.8<br />
Other ;;;;;;;;;;; 210 1.4 (12.5) 240 1.8<br />
Total ;;;;;;;;; 14,610 100.0 6.7 13,698 100.0<br />
Cement<br />
Contributions to our sales by geographic regions for the years ended December 31, 2002 and 2001 and<br />
the percentage variation between the two periods were as follows:<br />
Year ended<br />
December 31, 2002 % Var.<br />
Year ended<br />
December 31, 2001<br />
Sales (in million euros) % 2002/2001 (in million euros) %<br />
Western Europe;;;;;;; 2,274 32.7 31.8 1,725 28.8<br />
North America ;;;;;;; 1,579 22.7 7.5 1,469 24.5<br />
Central & Eastern Europe;;; 401 5.8 33.2 301 5.0<br />
Mediterranean Basin ;;;;; 455 6.6 (17.3) 550 9.2<br />
Latin America ;;;;;;; 502 7.2 (8.2) 547 9.1<br />
Sub-Saharan Africa and Indian<br />
Ocean;;;;;;;;;; 756 10.9 16.3 650 10.8<br />
Asia Pacific ;;;;;;;; 981 14.1 30.3 753 12.6<br />
Total ;;;;;;;;; 6,948 100.0 15.9 5,995 100.0<br />
Sales of the Cement division grew by 15.9% between 2001 and 2002, to 6,948 million euros up from<br />
5,995 million euros in 2001. This large increase primarily reflects the full-year consolidation of the former<br />
Blue Circle operations for the first time. In 2001, these operations had only been consolidated from July 11,<br />
2001 (the effective date of the acquisition). The contribution of the former Blue Circle cement operations<br />
amounted to 2,240 million euros in 2002, compared to 1,205 million euros in 2001. At constant scope and<br />
exchange rates, our sales grew by 1.2%. The slower growth in 2002, reflects the mixed trends in some of our<br />
markets. Overall changes in the scope of consolidation at constant exchange rates increased sales by 20.5%,<br />
contributing an additional 1,174 million euros. Currency fluctuations had a negative impact on sales of 5.8%<br />
which amounted to 286 million euros and resulted mostly from the decline in strength of the U.S. dollar and<br />
the Brazilian real against the euro.<br />
Volumes sold increased by 21% in 2002 to 106 million tonnes of cement.<br />
In Western Europe, sales totaled 2,274 million euros, an increase of 31.8% over 2001. The contribution<br />
of the former Blue Circle operations, chiefly in the United Kingdom and in Greece, amounted to 986 million<br />
euros in 2002, compared to 476 million euros in 2001. Currency fluctuations had no material effect on sales.<br />
The volumes sold in the region increased by 26% to 32.8 million tonnes, of which the former Blue Circle<br />
operations accounted for 13.2 million tonnes compared to 6.7 million tonnes in 2001. Volumes in France<br />
remained flat, but favorable pricing trends resulted in our sales increasing by 5%. Sales in the United<br />
Kingdom more than doubled, reflecting mainly the full-year consolidation of the former Blue Circle<br />
operations. Favorable pricing trends also contributed to the increase in sales. Spain and Italy realized solid<br />
growth in volumes and positive price trends. The buoyant construction markets in Spain led to another year<br />
of strong sales growth which increased by 8%. In Italy, sales grew by 13%. The social relations issues which<br />
impacted production at the Halkis plant in Greece did not impact our sales in this country and our sales in<br />
80
Greece were up by 130%, resulting primarily from the full-year consolidation of the former Blue Circle<br />
operations but also from favorable volumes and pricing trends. In Germany, the impact of a highly<br />
competitive pricing environment in the context of the very weak construction market was significant. Sales<br />
were down with prices falling significantly.<br />
In North America, we achieved sales of 1,579 million euros, an increase of 7.5%. The contribution of<br />
the Blue Circle North America operations amounted to 441 million euros in 2002, compared to 257 million<br />
euros in 2001. The weaker U.S. and Canadian dollars against the euro in 2002 had a negative impact. Our<br />
sales volumes in the region increased by 9% to 17.5 million tonnes, of which Blue Circle North America<br />
accounted for 4.9 million tonnes compared to 3.0 million tonnes in 2001.<br />
Sales in North America held up well overall in an increasingly more difficult construction market. While<br />
residential construction has remained robust throughout the year, activity in the commercial sector has<br />
continued to weaken. The pressure on individual State budgets impacted the level of infrastructure spending<br />
and some slowing of demand from public works and highway projects was felt particularly from the third<br />
quarter. The impact of the weaker construction market varied from region to region. The Western region saw<br />
an increase in demand in the mining and oil sectors whereas the North East was negatively affected by the<br />
decline in demand in the Baltimore and Boston markets. Prices overall showed some increase in the year with<br />
the notable exception of the South East, where aggressive competition was experienced in the weak Atlanta<br />
market. Sales in the fourth quarter are sensitive to weather and the return to more normal winter conditions in<br />
the last quarter reduced the volumes sold in comparison to the last quarter of 2001 when the very mild<br />
weather helped to stimulate the construction activity.<br />
In emerging markets we experienced a positive growth in sales of 10.5% to 3,092 million euros, and<br />
these markets accounted for 45% of the division’s sales in 2002, compared to 47% in 2001. Sales in 2002<br />
varied greatly not only from region to region but also within regions. The contribution of the former Blue<br />
Circle operations in the emerging markets amounted to 813 million euros in 2002, compared to 472 million<br />
euros in 2001. The currency fluctuations had a negative impact on sales.<br />
Our sales in Central and Eastern Europe rose by 33.2% to 401 million euros. The operations in Serbia<br />
and Slovenia generated additional sales of 74 million euros. Our sales volumes in the region increased by<br />
2 million tonnes to 8 million tonnes. Sales grew by 20% in Romania, in a context of high demand and<br />
increased prices. In Poland sales were down by 3% as the recession in the building industry continued to<br />
affect volumes, however, the situation showed signs of improvement towards the end of the year. In the<br />
Czech Republic, our sales were up by 6%, due to a favorable foreign exchange impact. In both Russia and<br />
the Ukraine sales increased significantly.<br />
In the Mediterranean Basin we saw a 17.3% decline in sales to 455 million euros primarily reflecting the<br />
change in accounting treatment of our Moroccan operations from global to proportionate consolidation. The<br />
contribution of the former Blue Circle operations in the region amounted to 26 million euros in 2002,<br />
compared to 25 million euros in 2001. Our sales volumes in the region were down by 17% to 9.5 million<br />
tonnes, compared to 11.4 million tonnes in 2001, primarily reflecting the change in accounting treatment of<br />
our Moroccan operations.<br />
In Morocco, the construction market was healthy throughout the year and without the impact of the<br />
change in accounting treatment, our sales would have increased. Jordan delivered solid sales in the year, up<br />
6%, thanks to a buoyant residential sector. In Egypt, over supply in the markets continued to create highly<br />
competitive market conditions with significant price erosion; our sales were down by 20%. The economic<br />
crisis in Turkey continues to severely impact the market, but an improvement in selling prices resulted in an<br />
increase of our sales by 4%.<br />
Our sales in Latin America were down by 8.2% to 502 million euros. This primarily reflects the impact<br />
on sales in the region of the devaluation of the various regional currencies in the year against the euro. The<br />
contribution of the former Blue Circle operations in Chile amounted to 79 million euros in 2002, compared to<br />
32 million euros in 2001. Our sales volumes in the region rose by 1.6% to 6.5 million tonnes of cement of<br />
which former Blue Circle accounted for 1.3 million tonnes.<br />
81
Volumes held up well in Brazil. Despite price increases in reals, up 14%, prices were down in euros<br />
which resulted in our sales falling by 21% overall. In the context of the political and economic turmoil in<br />
Venezuela sales fell significantly by 28%, with volumes down by 17% and prices by 6%. Honduras ended the<br />
year with sales down 11%. The operations in Chile showed some favorable pricing evolution. In Mexico,<br />
sales were up by 10%.<br />
In the Sub-Saharan Africa and Indian Ocean region, our sales grew by 16.3% to 756 million euros. The<br />
contribution of the former Blue Circle operations in this region amounted to 265 million euros in 2002,<br />
compared to 173 million euros in 2001. Our sales volumes in the area increased by 42% to 10.2 million<br />
tonnes of cement, of which former Blue Circle accounted for 4 million tonnes, compared to 1.6 million<br />
tonnes in 2001. Currency fluctuations had a negative impact on sales in the region. In South Africa, our sales<br />
were down by 16% primarily reflecting the significant devaluation of the rand against the euro. The business<br />
recorded higher volumes and improved prices in local currency terms. Our operations in Kenya and Uganda<br />
saw sales improve 10% and 17%, respectively, with strong domestic market conditions and prices. Sales in<br />
Cameroon increased by 5% in the context of solid local demand and improved prices. South East Africa,<br />
which covers Zambia, Malawi, Tanzania and Zimbabwe, contributed sales of 72 million euros. Sales volumes<br />
have generally followed a favorable trend during the year, however, prices have been negatively affected by<br />
exchange rate depreciation. The market trends in Nigeria have been poor, partly due to a downturn in market<br />
conditions, partly due to the pre-election situation with flat volumes and weaker prices overall.<br />
Our operations in the Asia Pacific region saw sales increase by 30.3% to 981 million euros. The<br />
contribution of the former Blue Circle operations in this region, mainly in Malaysia and the Philippines,<br />
amounted to 432 million euros in 2002, compared to 231 million euros in 2001.<br />
Our sales volumes in the region increased by 46% to 21.1 million tonnes of cement, of which the former<br />
Blue Circle operations accounted for 8.9 million tonnes, compared to 4.3 million tonnes in 2001. In South<br />
Korea, sales continued to show strong growth up by 13%. Domestic sales volumes were strong as<br />
construction spending continued to increase and prices developed favorably over the year. The impact of the<br />
typhoon that has affected the country was limited mainly to the month of September. In the Philippines our<br />
sales increased by 42%, primarily reflecting the full-year consolidation of the former Blue Circle operations,<br />
with volumes increasing strongly in the context of severe price competition where prices have fallen by 21%<br />
in the year.<br />
In India sales volumes showed a satisfactory level of growth; however prices have remained at a low<br />
level and sales were up by 5%. China has continued to deliver a strong growth in sales of 63% benefiting<br />
from the start-up of the Dujiangyan plant and strong demand on the Beijing market. In Indonesia, sales grew<br />
by 28% as prices started to show some signs of improvement. In Malaysia, sales increased by 79%, primarily<br />
reflecting the full-year consolidation of the former Blue Circle operations. However, our operations were<br />
negatively impacted by the slow-down in the second half, due to the impact on the construction industry of<br />
governmental measures relating to the employment of foreign workers.<br />
82
Aggregates & Concrete<br />
Contributions to our sales by activity and main geographic regions for the years ended December 31,<br />
2002 and 2001 and the percentage variation between the two periods were as follows:<br />
Year ended<br />
December 31, 2002 % Var.<br />
Year ended<br />
December 31, 2001<br />
Sales (in million euros) % 2002/2001 (in million euros) %<br />
Aggregates and related products 2,196 46.1 (5.5) 2,325 48.4<br />
Ready mix concrete and<br />
concrete products ;;;;; 2,572 53.9 3.7 2,481 51.6<br />
Total Aggregates & Concrete 4,768 100.0 (0.8) 4,806 100.0<br />
Western Europe;;;;;;; 1,856 38.9 4.9 1,770 36.8<br />
North America ;;;;;;; 2,405 50.4 (7.3) 2,594 354.0<br />
Other regions;;;;;;;; 507 10.6 14.7 442 9.2<br />
Total ;;;;;;;;; 4,768 100.0 (0.8) 4,806 100.0<br />
Sales of the Aggregates & Concrete division slipped by 0.8% to 4,768 million euros in 2002 from<br />
4,806 million euros in 2001. At constant scope and exchange rates, our sales were down by 1.2%. Changes in<br />
the scope of consolidation at constant exchange rates increased sales by 4.9% reflecting the effect of the fullyear<br />
Blue Circle’s aggregates and concrete operations and the divestment of the concrete product businesses<br />
in Canada. Currency fluctuations had a negative impact on sales of 4.5%. In Western Europe our sales<br />
increased by 4.9% to 1,856 million euros. In North America, our sales fell by 7.3% to 2,405 million euros.<br />
Sales of our aggregates operations, which also include our asphalt and road contracting businesses, were<br />
down by 5.5% between 2001 and 2002, to 2,196 million euros. At constant scope and exchange rates, our<br />
sales from our ongoing operations declined by 3%. Currency fluctuations had a negative impact of 4% on<br />
sales. Our sales volumes of aggregates were down by 1% to 207 million tonnes in 2002.<br />
Our aggregates sales in Western Europe increased by 4% to 789 million euros. In France sales declined<br />
as a result of lower activity in the road building sector; however, this decline was limited by the rise in<br />
average prices. In the United Kingdom, the subdued ready mix market and the effect of the aggregates levy<br />
from April 1, led to a weak aggregates market. Several delays in road building contracts slowed the paving<br />
operations, although these picked up in the last quarter. Sales increased however with buoyant prices and an<br />
increase in recycled products sales. Sales were up by 11%, including the effect of the aggregates levy. With<br />
the healthy construction market in Spain sales continued to grow in 2002.<br />
In North America, sales fell by 10% to 1,336 million euros. Changes in the scope of consolidation<br />
(mainly consisting of the full-year consolidation of the Blue Circle North America operations) generated<br />
50 million euros of additional sales. Currency fluctuations had a 6% negative impact on sales in euros. Sales<br />
at constant scope and exchange rates declined by 7% with much of the weakness seen in our road paving<br />
activities. In Canada, the residential sector saw a good level of growth but the industrial and commercial<br />
construction activity was weaker. In the West we benefited from favorable residential construction activity in<br />
Alberta, although the paving sector sales were down, as in 2001 they had benefited from the second runway<br />
project at Vancouver airport. Sales in Eastern Canada were favorable in Western Quebec and Ottawa, but<br />
softer in Central Ontario. Our road paving operations experienced a significant decline in the year due to<br />
delays in road building projects brought about by a civil servants’ strike early in the year. In the United<br />
States we experienced weak market conditions. A significant softening in activity was seen in New Mexico,<br />
Colorado, Missouri, Georgia, and in the Great Lakes. Average prices saw some increase in both countries in<br />
2002.<br />
Sales of our concrete operations which include ready mix concrete and our pre-cast concrete products,<br />
increased by 3.7% between 2001 and 2002, from 2,481 million euros to 2,572 million euros. At constant<br />
scope and exchange rates our sales increased by 0.8%. Changes in the scope of consolidation at constant<br />
exchange rates had a positive impact of 7% on sales with the consolidation of the Blue Circle concrete<br />
83
operations in Greece, North America, Chile and Malaysia. Currency fluctuations had a negative impact on<br />
sales of 5%. Our sales volumes of ready mix concrete increased by 9.5% to 35 million m 3 .<br />
In Western Europe, concrete sales improved 6% to 1,067 million euros. In France, sales grew favorably<br />
due to the strong level of activity in the first half, despite a softening in demand levels in the second half of<br />
the year. In the United Kingdom sales grew favorably with overall market demand being positive in the year.<br />
Sales in Spain and Portugal were marginally down in 2002 as the rate of growth in the Spanish market was<br />
not sufficient to offset the slowdown in Portugal, where both volumes and prices were under pressure.<br />
Net changes in the scope of consolidation in Western Europe had a positive impact on our sales. These<br />
additional sales result primarily from the full-year consolidation of the former Blue Circle operations in<br />
Greece, partially offset with the divestiture of our operations in Germany and Italy.<br />
In North America, sales were down by 4% from 1,116 million euros in 2001 to 1,069 million euros in<br />
2002. Changes in the scope of consolidation impacted sales by 63 million euros with the additional sales<br />
primarily from the full-year consolidation of Blue Circle North America operations more than offsetting the<br />
impact of the divestment of concrete product businesses in Canada. Currency fluctuations had a negative<br />
impact on sales of 6%. In Canada, we experienced a sharp decline in commercial construction in Toronto and<br />
the overcapacity in the industry led to a difficult pricing environment. In Montreal, we suffered from a five<br />
month strike. In the U.S., weak markets conditions were experienced in the West with declining economic<br />
conditions in Colorado and New Mexico. In the Eastern U.S., most of the shortfall occurred in the fourth<br />
quarter with wintry weather and slowing activity in Maryland and New York state.<br />
In the rest of the world, sales grew significantly due mainly to the scope effect of the full-year<br />
consolidation of the former Blue Circle operations in Chile, Malaysia and Singapore. Sales grew strongly in<br />
Turkey due to increased volumes and prices, and held up well, at constant scope and exchange rates, in<br />
Brazil.<br />
Roofing<br />
Contributions to our sales by main markets for the years ended December 31, 2002 and 2001 and the<br />
percentage variation between the two periods were as follows:<br />
Year ended<br />
December 31, 2002 % Var.<br />
Year ended<br />
December 31, 2001<br />
Sales (in million euros) % 2002/2001 (in million euros) %<br />
Western Europe ;;;;;;; 1,162 75.6 (7.9) 1,261 79.6<br />
Germany ;;;;;;;;; 448 29.1 (9.5) 495 31.2<br />
Other countries in Western<br />
Europe ;;;;;;;;; 714 46.4 (6.8) 766 48.3<br />
Other regions ;;;;;;;; 376 24.4 16.0 324 20.4<br />
Total ;;;;;;;;;; 1,538 100 (3.0) 1,585 100<br />
The Roofing division experienced another year of difficult market conditions. Sales declined by 3%<br />
between 2001 and 2002, from 1,585 million euros to 1,538 million euros.<br />
At constant scope and exchange rates sales fell by 5.9%. Currency fluctuations had a negative impact on<br />
sales of 1.2%. Sales of concrete tiles were down 7.5% to 792 million euros and clay tiles down 5.9% to<br />
255 million euros. Roof System Components continued to expand by 20% to 246 million euros primarily<br />
reflecting the impact of full-year consolidation of Kloeber. Chimney sales decreased by 2% to 166 million<br />
euros.<br />
In 2002, new operations included the acquisition of a concrete tile producer in Scotland and the<br />
construction of a new concrete tile plant in Denver, Colorado. New clay tile activities comprised a production<br />
line for a ‘‘Nordic’’ clay tile, and the entry into the prosperous Thai market. We have expanded the business<br />
of the roofing accessories producer Kloeber, which was acquired in 2001 and it is now active in six countries.<br />
84
In the chimneys segment sales, offices in Eastern and Northern Europe have been opened. Kami metal roof<br />
tiles, a business which was acquired in 2001, began operations in the United Kingdom.<br />
In Western Europe sales (including chimneys) were down by 7.9% to 1,162 million euros, which was<br />
mainly due to a further decline in Germany, were overall sales were down 9%, and in France, where sales<br />
dropped by 4% in a weakening market. In Scandinavia sales, were up but were marginally down in the UK<br />
and were stable in Italy.<br />
In North America, emphasis was given to price increases which improved results, excluding the impact<br />
of central cost allocations. However, the decrease in volumes led to a decrease in our sales of 7%.<br />
In Eastern Europe, sales increased to 128 million euros in 2002 which in part reflects the growth in sales<br />
in the Czech Republic and Hungary. Sales of concrete roof tiles continued to decline in Poland, but chimney<br />
sales improved. After several years of growth, Poland saw a declining market in which sales of clay tiles<br />
continued to increase, but concrete tiles sales declined.<br />
In Asia, sales remained stable with strong growth in Malaysia but with lower sales in China and in<br />
Japan.<br />
Gypsum<br />
Contributions to our sales by main geographic regions for the years ended December 31, 2002 and 2001<br />
and the percentage variation between the two periods were as follows:<br />
Year ended<br />
December 31, 2002 %Var.<br />
Year ended<br />
December 31, 2001<br />
Sales (in million euros) % 2002/2001 (in million euros) %<br />
Western Europe;;;;;;; 604 52.7 0.3 602 56.2<br />
North America ;;;;;;; 245 21.4 45.0 169 15.7<br />
Other regions;;;;;;;; 297 25.9 (1.3) 301 28.1<br />
Total ;;;;;;;;; 1,146 100.0 6.9 1,072 100.0<br />
In 2002, sales of the Gypsum division grew by 6.9% from 1,072 million euros in 2001 to 1,146 million<br />
euros. At constant exchange rates and scope sales grew by 7.2%. Changes in the scope of consolidation at<br />
constant exchange rates increased sales by 2%. Currency fluctuations had a negative impact on sales of 2%.<br />
The volumes of wallboard grew by 10% to 560 million m 2 helped by the increased production efficiency of<br />
the recently built plants in the United States, the acquisition of the Continental plant in Newark, New Jersey<br />
and growth in many of our markets.<br />
In Western Europe, the division performed relatively well, given the continued weakness in the German<br />
construction market, with sales up by 0.3% to 604 million euros. In France and the United Kingdom, market<br />
conditions were generally favorable and sales were up in 2002. In Germany, the weak construction market<br />
continued to affect sales with significantly lower volumes, however prices did improve from the low of<br />
December 2001.<br />
In North America, sales grew to 245 million euros, up by 45% compared to 2001, due mainly to the<br />
recovery in prices. The acquisition of Continental in Newark in the first quarter increased sales by 31 million<br />
euros. Prices improved significantly in the year to an average $96 per thousand square feet (1,000 square feet<br />
is roughly 93 square meters), in comparison with an average price of $72 per thousand square feet in 2001.<br />
In our other zones our sales in the division were down slightly to 297 million euros. This decline reflects<br />
the difficult market conditions in Poland and weak markets in Latin America. However, in the Asia Pacific<br />
region, sales grew as a result of generally good market conditions across the region.<br />
Other (including Specialty Products)<br />
Sales of our other operations fell by 12.5% between 2001 and 2002, from 240 million euros to<br />
210 million euros, principally reflecting the difficult year experienced by our road marking operations in the<br />
85
United States as well as the scope effect related to the divestment at the end of 2002 of our former mortar<br />
operations in Spain.<br />
Operating income on ordinary activities<br />
Operating income on ordinary activities takes into account Sales, Cost of Goods Sold, Selling and<br />
Administrative Expenses and Depreciation. We do not report Cost of Goods Sold, Selling and Administrative<br />
Expenses and Depreciation by segment.<br />
Cost of goods sold grew by 5.1% between 2001 and 2002, from 9,258 million euros to 9,734 million<br />
euros. Changes in the scope of consolidation accounted for a net increase of 12.4%. This increase was<br />
principally due to the full-year consolidation of the former Blue Circle operations. Fluctuations in exchange<br />
rates accounted for a net decrease of 3.7% reflecting principally the depreciation of the U.S. and Canadian<br />
dollars, and to a minor extent of the Brazilian real and the South African rand, against the euro. The 3.6%<br />
decrease in cost of goods sold at our ongoing operations at constant exchange rates primarily reflects the<br />
lower volumes we recorded over the year in our aggregates and roofing operations as well as cost reductions<br />
achieved in our four divisions.<br />
Selling and administrative expenses increased by 12.5% between 2001 and 2002, from 1,578 million<br />
euros to 1,775 million euros. Changes in the scope of consolidation accounted for a net increase of 8.9%,<br />
primarily reflecting the full-year consolidation of the former Blue Circle operations. Fluctuations in exchange<br />
rates accounted for a net decrease of 3.1%. Selling and administrative expenses increased by 6.7% at our<br />
ongoing operations at constant exchange rates, partly due to the increase at our Aggregates & Concrete<br />
division associated with the efforts made in the field of information systems, management of performance and<br />
reinforcement of the sales force. The increase also reflects the reclassification in 2002, as selling and<br />
administrative expenses, of certain costs at our Aggregates & Concrete division which were recorded as cost<br />
of goods sold in previous years as well as the negative impact of pension cost adjustments, especially in the<br />
United Kingdom.<br />
Depreciation increased by 4.4% between 2001 and 2002, from 928 million euros to 969 million euros.<br />
Changes in the scope of consolidation together with the change in the depreciation estimate of cement plant<br />
assets accounted for a net increase of 5.9%. The impact of the new definition of cost categories and related<br />
useful lives was a reduction of the annual depreciation expense by 83 million euros in 2002. Fluctuations in<br />
exchange rates accounted for a net decrease of 3.1%. Depreciation increased by 1.6% at our ongoing<br />
operations at constant exchange rates.<br />
Operating income on ordinary activities grew by 10.2% between 2001 and 2002, from 1,934 million<br />
euros to 2,132 million euros. The increase was principally due to the full-year consolidation in 2002 of the<br />
former Blue Circle operations as well as the overall improved performance of our Cement division and the<br />
reduced losses of our gypsum operations in North America. At constant exchange rates and depreciable lives,<br />
our ongoing operations saw an increase of 1.9%. As a percentage of our sales, operating income on ordinary<br />
activities represented 14.6% in 2002, compared to 14.1% in 2001.<br />
Contributions to our operating income on ordinary activities by segment for the years ended<br />
December 31, 2002 and 2001, and the percentage change between the periods, were as follows:<br />
Year ended<br />
December 31, 2002 % Var.<br />
Year ended<br />
December 31, 2001(a)<br />
Operating income on ordinary activities (in million euros) % 2002/2001 (in million euros) %<br />
Cement ;;;;;;;;;;;; 1,606 75.3 12.0 1,434 74.1<br />
Aggregates & Concrete;;;;;; 336 15.8 (11.1) 378 19.5<br />
Roofing ;;;;;;;;;;;; 132 6.2 3.1 128 6.6<br />
Gypsum ;;;;;;;;;;;; 51 2.4 — 3 0.2<br />
Others ;;;;;;;;;;;; 7 0.3 — (9) (0.5)<br />
Total ;;;;;;;;;;; 2,132 100.0 10.2 1,934 100.0<br />
(a) Revised for the change in presentation of equity affiliates.<br />
86
Cement<br />
Contributions to our Cement operating income on ordinary activities by geographic regions for the years<br />
ended December 31, 2002 and 2001, and the percentage change between the periods were as follows:<br />
Year ended<br />
December 31, 2002 % Var.<br />
Year ended<br />
December 31, 2001(a)<br />
Operating income on ordinary activities (in million euros) % 2002/2001 (in million euros) %<br />
Western Europe;;;;;;;;; 656 40.8 26.9 517 36.1<br />
North America ;;;;;;;;; 330 20.5 (5.7) 350 24.4<br />
Central & Eastern Europe;;;;; 86 5.4 38.7 62 4.3<br />
Mediterranean Basin ;;;;;;; 112 7.0 (10.4) 125 8.7<br />
Latin America ;;;;;;;;; 202 12.6 (1.5) 205 14.3<br />
Sub-Saharan Africa and Indian Ocean 120 7.5 8.1 111 7.7<br />
Asia Pacific ;;;;;;;;;; 100 6.2 56.3 64 4.5<br />
Total ;;;;;;;;;;; 1,606 100.0 12.0 1,434 100.0<br />
(a) Revised for the change in presentation of equity affiliates<br />
Operating income on ordinary activities of the Cement division increased by 12.0% to 1,606 million<br />
euros in 2002 compared to 1,434 in 2001. At constant scope, depreciable lives and exchange rates, operating<br />
income on ordinary activities rose by 3%. The change in the estimated useful life of cement plant assets had<br />
a favorable impact of 83 million euros on operating income. The change in the treatment of Morocco from<br />
the global to proportional consolidation method reduced operating income in the Mediterranean Basin by<br />
41 million euros. Currency fluctuations had a negative impact of 5% or 73 million euros. As a percentage of<br />
the division’s gross sales (see Note 3(a) to our consolidated financial statements), operating income on<br />
ordinary activities represented 21.4% in 2002, compared to 22.1% in 2001.<br />
We estimate that we achieved our 2002 objective of synergies as a result of the integration of the<br />
operations of Blue Circle Industries, of which one third related to overhead synergies and two thirds related<br />
to operational synergies. Unfortunately, the effect of these synergies was only partly evident at the operating<br />
income level due to specific negative circumstances in countries such as Nigeria (due to downturn and poor<br />
operating performance), the Philippines (due to price war), Malaysia (due to governmental measures against<br />
illegal immigrants in the construction industry) and the United States (due to sharp decline in infrastructure<br />
projects in the Boston area, lower prices in the southeast, kiln failure at the Ravena Plant and start-up costs at<br />
new the Roberta facility).<br />
Operating income on ordinary activities in Western Europe grew by 26.9% to 656 million euros<br />
compared to 517 million euros in 2001. The scope effect resulting from the full-year consolidation of the<br />
former Blue Circle operations amounted to 111 million euros. Operating income on ordinary activities at<br />
constant scope, depreciable lives and exchange rates increased by 1.5% compared to 2001 due to improved<br />
margins in France, Spain and Italy. Operating income in the United Kingdom was favorably impacted by the<br />
improvement in operational performance. In Germany, as a direct result of the economic slowdown and<br />
highly competitive pricing environment, operating income fell to one fourth of the 2001 level.<br />
Operating income on ordinary activities in North America declined by 5.7% to 330 million euros<br />
compared to 350 million euros in 2001. Currency fluctuations had a negative impact on operating income on<br />
ordinary activities of 20 million euros. The scope effect resulting from the full-year consolidation of Blue<br />
Circle North America amounted to 12 million euros. At constant scope, depreciable lives and exchange rates,<br />
operating income in North America was down by 7%.<br />
In emerging markets, operating income on ordinary activities rose by 9.3% to 620 million euros<br />
compared to 567 million euros in 2001, representing 39% of the Cement division’s operating income,<br />
compared to 40% in 2001. The scope impact resulting from the full-year consolidation of the former Blue<br />
Circle operations in emerging markets amounted to 56 million euros. Operating income on ordinary activities<br />
at constant scope depreciable lives and exchange rates grew by 10%.<br />
87
In Central and Eastern Europe operating income on ordinary activities continued to improve with an<br />
increase of 38.7% to 86 million euros compared to 62 million euros in 2001. The impact of negative currency<br />
fluctuations on the region’s operating income on ordinary activities amounted to 2 million euros. Operating<br />
income on ordinary activities at constant scope, depreciable lives and exchange rates grew by 21%, with<br />
strong growth in Romania where both margins and operating income grew substantially due to favorable<br />
market conditions coupled with reductions in variable costs. Operating income in Poland increased as<br />
operating margins improved due to cost reductions, partly due to the full impact on the year of the reduction<br />
in headcount following the closure of one plant in 2001. In the Czech Republic, the level of prices of export<br />
sales to Germany resulted in lower operating income. Margins improved in Russia and the Ukraine with both<br />
countries increasing their operating income.<br />
The operating income on ordinary activities from the Mediterranean Basin countries decreased by 10.4%<br />
to 112 million euros compared to 125 million euros in 2001 due to the change in accounting treatment of our<br />
Moroccan operations from global to proportionate consolidation. Operating income on ordinary activities at<br />
constant scope, depreciable lives and exchange rates, and excluding the impact of the change in the<br />
accounting treatment of our Moroccan operations grew by 21%. The impact of negative currency fluctuations<br />
on the region’s operating income on ordinary activities amounted to 7 million euros. Strong growth in income<br />
was realized in Morocco and Jordan due to favorable market conditions in these two countries. The small loss<br />
incurred in Turkey in 2001 was reversed to record an operating profit. Egypt saw a decline in operating<br />
income in the context of the poor price trends partly offset by the positive impact on variable costs of the<br />
new production line at Alexandria.<br />
The operating income on ordinary activities from Latin America was slightly down from 205 million<br />
euros in 2001 to 202 million euros in 2002. The positive scope effect resulting from the full-year<br />
consolidation of the former Blue Circle operations in Chile amounted to 22 million euros. The negative<br />
foreign exchange impact on the region’s operating income on ordinary activities amounted to 30 million<br />
euros. At constant scope, depreciable lives and exchange rates, operating income grew by 5%. Operating<br />
income was down in Brazil due to the foreign exchange impact which offset the improvement in operating<br />
income in reals and to the scope effect resulting from the divestment of Brumado. In Venezuela, the local<br />
turmoil and bolivar devaluation have resulted in operating income being down by 21%, in spite of drastic<br />
cost control measures taken internally. A small decline was recorded in Honduras. Both Chile and Mexico<br />
increased their operating income.<br />
Operating income on ordinary activities in Sub-Saharan Africa and the Indian Ocean increased by 8.1%<br />
to 120 million euros. The scope effect resulting from the full-year consolidation of the former Blue Circle<br />
operations in Nigeria and Zimbabwe amounted to 5 million euros. The negative foreign exchange rates and<br />
impact on the region’s operating income on ordinary activities amounted to 10 million euros. At constant<br />
scope, depreciable lives and exchange operating income on ordinary activities grew by 22%. Existing<br />
operations in Kenya, Cameroon and South Africa achieved higher operating margins. The operations in<br />
Nigeria, however, recorded a significant decline in operating income due to a market decrease and to<br />
significant cost and production issues relating to delays with the start-up of the new plant at Ewekoro.<br />
The Asia Pacific region saw operating income on ordinary activities grow by 56.3% to 100 million<br />
euros. The scope effect resulting from the full-year consolidation of the former Blue Circle operations in<br />
Malaysia and the Philippines amounted to 30 million euros. The negative foreign exchange impact on the<br />
region’s operating income on ordinary activities amounted to 3 million euros. At constant scope, depreciable<br />
lives and exchange rates, operating income fell by 11%. South Korea delivered a strong growth in operating<br />
income mainly due to the favorable market conditions. India improved operating income as a consequence of<br />
continued production performance improvement. Operating income in the Philippines was weak due to<br />
deteriorated pricing. In Indonesia a small operating loss was incurred, though much reduced from the loss<br />
incurred in 2001.<br />
88
Aggregates & Concrete<br />
Contributions to our Aggregates & Concrete operating income on ordinary activities by activity and main<br />
geographic regions for the years ended December 31, 2002 and 2001, and the percentage change between the<br />
periods were as follows:<br />
Year ended<br />
December 31, 2002 % Var.<br />
Year ended<br />
December 31, 2001 (a)<br />
Operating income on ordinary activities (in million euros) % 2002/2001 (in million euros) %<br />
Aggregates and related products ;;;;;; 246 73.2 (8.9) 270 71.4<br />
Ready mix concrete and concrete products ;; 90 26.8 (16.7) 108 28.6<br />
Total Aggregates & Concrete ;;;;;; 336 100.0 (11.1) 378 100.0<br />
Western Europe;;;;;;;;;;;;; 148 44.0 2.8 144 38.1<br />
North America ;;;;;;;;;;;;; 178 53.0 (24.9) 237 62.7<br />
Other regions;;;;;;;;;;;;;; 10 3.0 N/A 2 0.5<br />
Overheads ;;;;;;;;;;;;;;; N/A (5) (1.3)<br />
Total ;;;;;;;;;;;;;;; 336 100.0 (11.1) 378 100.0<br />
(a) Revised for the change in presentation of equity affiliates<br />
Operating income on ordinary activities of the Aggregates & Concrete division declined by 11.1%<br />
between 2001 and 2002, from 378 million euros to 336 million euros. The scope effect from the full-year<br />
consolidation of the former Blue Circle operations was 16 million euros. At constant scope and exchange<br />
rates, operating income on ordinary activities declined by 10%. Currency fluctuations had a negative impact<br />
of 4%. As a percentage of the division’s gross sales (see Note 3(a) to our consolidated financial statements),<br />
operating income on ordinary activities represented 7.0% in 2002, compared to 7.9% in 2001. The operating<br />
income on ordinary activities for aggregates totaled 246 million euros down 8.9% from 270 million euros in<br />
2001. While currency fluctuations had a negative impact of 10 million euros the remainder of the decline was<br />
due to the weaker North American results. The operating income on ordinary activities for Concrete totaled<br />
90 million euros down 16.7% from 108 million euros in 2001. Currency fluctuations had a negative impact of<br />
4 million euros with the remainder of the decline also due to the weaker North American results.<br />
In Western Europe, operating income on ordinary activities grew by 2.8% to 148 million euros.<br />
Operating income in France was at a similar level to 2001. In the UK, operating income grew as operating<br />
margins improved in the concrete activity.<br />
In North America, operating income on ordinary activities was down by 24.9% to 178 million euros. The<br />
net effect of changes in the scope of consolidation on the operating income on ordinary activities from the<br />
former Blue Circle operations and divestments was 3 million euros. The impact on operating income on<br />
ordinary activities of the weakening dollar against the euro amounted to 12 million euros or 5%. The decline<br />
in operating income on ordinary activities occurred primarily in three markets: the Western U.S.A. where the<br />
weak market conditions prevailed throughout the second half of the year, the South Eastern U.S.A. and<br />
Canada with the difficult year experienced in Toronto and Montreal.<br />
Elsewhere in the world, operating income on ordinary activities continued to improve up to 10 million<br />
euros from 2 million euros in 2001. The effect of changes in the scope of consolidation of the former Blue<br />
Circle operations was 1 million euro. In South Africa, operating income continued to grow strongly and in<br />
Turkey, while the market remains very unstable and competitive, the operating loss was reduced significantly.<br />
89
Roofing<br />
Contributions to our operating income on ordinary activities in our Roofing division by main markets for<br />
the years ended December 31, 2002 and 2001, and the percentage change between the periods were as<br />
follows:<br />
Year ended<br />
December 31, 2002 % Var.<br />
Year ended<br />
December 31, 2001 (a)<br />
Operating income on ordinary activities (in million euros) % 2002/2001 (in million euros) %<br />
Western Europe ;;;;;;;;; 103 78.0 6.2 97 75.8<br />
Germany ;;;;;;;;;; 33 25.0 120.0 15 11.7<br />
Other countries in Western Europe 70 53.0 (14.6) 82 64.1<br />
Other regions ;;;;;;;;;; 29 22.0 (6.5) 31 24.2<br />
Total ;;;;;;;;;;;; 132 100.0 3.1 128 100.0<br />
(a) Revised for the change in presentation of equity affiliates<br />
The division’s operating income on ordinary activities was up 3.1% to 132 million euros from<br />
128 million euros in 2001, largely as a result of the cost management efforts and extensive restructuring<br />
carried out across the operations, particularly in Germany where the sales forces of the two leading brands<br />
were merged in 2002. Germany accounted for 25% of operating profits in 2002, all other European markets<br />
for 61% and non-European operations for 14%. As a percentage of the division’s gross sales (see Note 3(a) to<br />
our consolidated financial statements), operating income on ordinary activities represented 8.6% in 2002,<br />
compared to 8.1% in 2001.<br />
Operating income on ordinary activities in Western Europe rose 6.2% to 103 million euros. In Germany,<br />
following the extensive restructuring, the operating income increased from 15 million euros to 33 million<br />
euros including the effect of a change in the central cost allocation method within the division. The<br />
underlying increase in German operating income amounted to 2 million euros or 13%. In other Western<br />
European countries operating income declined from 82 million euros in 2001 to 70 million euros in 2002 due<br />
to the same change in cost allocation method. The underlying decrease of 6 million euros or 7% was a result<br />
of weaker markets in France and in the Netherlands that could not be entirely compensated by the<br />
improvement recorded in Scandinavia and further growth in Italy.<br />
Outside Western Europe, operating income on ordinary activities was down marginally to 29 million<br />
euros in 2002 from 31 million euros in 2001, which also reflects the change in the central cost allocation. At<br />
constant scope and exchange rates, underlying operating income on ordinary activities was up 9 million euros<br />
excluding change in central allocation costs. Major contributors were Eastern Europe, Malaysia and North<br />
America.<br />
Gypsum<br />
Contributions to our Gypsum operating income on ordinary activities by main geographic regions for the<br />
years ended December 31, 2002 and 2001, and the percentage change between the periods were as follows:<br />
Year ended<br />
December 31, 2002 % Var.<br />
Year ended<br />
December 31, 2001 (a)<br />
Operating income on ordinary activities (in million euros) % 2002/2001 (in million euros) %<br />
Western Europe;;;;;;;;;;;;; 59 115.7 36.4 44 N/A<br />
North America ;;;;;;;;;;;;; (28) (54.9) N/A (76) N/A<br />
Other regions;;;;;;;;;;;;;; 20 39.2 (40.6) 32 N/A<br />
Overheads ;;;;;;;;;;;;;;; N/A 3 N/A<br />
Total ;;;;;;;;;;;;;;; 51 100.0 N/A 3 100.0<br />
(a) Revised for the change in presentation of equity affiliates<br />
90
Operating income on ordinary activities grew strongly after the very difficult year in 2001, and was up<br />
from 3 million euros to 51 million euros. This was mainly as a result of the reduction of losses in North<br />
America, helped by better pricing coupled with our division wide performance plans, particularly in the area<br />
of purchasing and manufacturing efficiency. As a percentage of the division’s gross sales (see Note 3(a) to<br />
our consolidated financial statements), operating income on ordinary activities represented 4.4% in 2002,<br />
compared to 0.3% in 2001.<br />
Operating income on ordinary activities in Western Europe improved strongly to 59 million euros from<br />
44 million euros, including the effect of a change in the central cost allocation method within the Division.<br />
The underlying increase in operating income amounted to 2 million euros or 5%. France and the United<br />
Kingdom continued to increase operating margins as a consequence of their operating performance plans,<br />
however Germany continued to make losses reflecting the difficult market conditions.<br />
In North America, the operating loss in 2002 was significantly reduced to 28 million euros, compared to<br />
a loss of 76 million euros in 2001. This reduction in losses was due to the increase in prices and also to the<br />
improvement in production performance benefiting sales volumes and reducing our cost base. The level of<br />
demand for wallboard remained stable during the year with a sound residential construction market. At the<br />
end of 2002 the decision was taken to mothball the Wilmington plant in the North East region allowing us to<br />
concentrate our production at lower cost facilities. The idling of this plant is expected to save 10 million U.S.<br />
dollars per annum and contribute significantly to returning the operations to profitability.<br />
In our other regions, operating income on ordinary activities fell to 20 million euros, compared to<br />
32 million euros in 2001. This decline was mainly attributable to Poland where the very poor market<br />
conditions led to a significant increase in losses. However, the old Gacki plant was closed and a more<br />
efficient production facility, also at Gacki, started operations in the fourth quarter. Our operating income on<br />
ordinary activities in the Asia Pacific region benefited from good performances seen in Australia and<br />
continuing benefits of our joint venture in Asia resulting in a significant improvement in profits at constant<br />
scope. In particular, in 2002, the joint venture benefited from the successful integration of Siam Gypsum<br />
Industry, which was acquired in June 2001, and the construction of our new facility in Korea using<br />
equipment transferred from our Chinese operations following the restructuring of the two businesses in<br />
Shanghai.<br />
Other (including Specialty Products). Operating income on ordinary activities of our other operations<br />
improved between 2001 and 2002, from a loss of 9 million euros to 7 million euros of operating income on<br />
ordinary activities.<br />
Operating income and net income<br />
Operating income takes into account operating income on ordinary activities, gains (losses) on disposals<br />
and other revenues (expenses). The table below shows the evolution of our operating income and net income:<br />
Year ended<br />
December 31, 2002 % Var.<br />
Year ended<br />
December 31, 2001 (a)<br />
(in million euros) 2002/2001 (in million euros)<br />
Operating income on ordinary activities ;;;;;; 2,132 10.2 1,934<br />
Gains on disposals, net ;;;;;;;;;;;;;; 216 (21.2) 274<br />
Other income (expenses), net ;;;;;;;;;;;; (525) (152)<br />
Operating income ;;;;;;;;;;;;;;;; 1,823 (11.3) 2,056<br />
Financial expenses, net ;;;;;;;;;;;;;; (521) (4.2) (544)<br />
Income tax ;;;;;;;;;;;;;;;;;;; (448) 21.7 (368)<br />
Share of net income in equity affiliates;;;;;;;; 33 83.3 18<br />
Amortization of goodwill ;;;;;;;;;;;;; (158) 11.3 (142)<br />
Minority interests ;;;;;;;;;;;;;;;; (273) 1.1 (270)<br />
Net income ;;;;;;;;;;;;;;;;;;; 456 (39.2) 750<br />
(a) Revised for the change in presentation of equity affiliates<br />
91
Gains on disposals, net represented a net gain of 216 million euros in 2002, compared to 274 million<br />
euros in 2001. The most significant capital gains were earned on:<br />
s The sale of certain cement assets in Southern Spain, Brazil and South Africa which generated<br />
aggregate capital gains of 148 million euros;<br />
s The sale of property in Paris, namely our headquarters building, which we now lease, which generated<br />
a capital gain of 51 million euros;<br />
Other income (expenses), net represented a net loss of 525 million euros in 2002, compared to a net loss<br />
of 152 million euros in 2001. This primarily results from a provision of 300 million euros recorded in 2002.<br />
This provision has been recorded to cover the risks related to the European Commission decision against our<br />
Gypsum activities in Europe, and to the German competition authority (Bundeskartellamt) decision to fine our<br />
subsidiary <strong>Lafarge</strong> Zement for its cement activities in Germany, both of which <strong>Lafarge</strong> has appealed against.<br />
Other non recurring charges relate to restructuring charges and write offs. Restructuring and closure charges<br />
for our businesses in Germany and Poland amounted to 69 million euros, split between Roofing at 39 million<br />
euros, Concrete at 17 million euros and Gypsum at 13 million euros. An amount of 27 million euros was<br />
accounted for as a charge in relation to the idling of the Wilmington plant in Delaware, U.S.A. Other non<br />
recurring items relating to the reorganization of our businesses amounted to 60 million euros.<br />
Operating income decreased by 11.3% between 2001 and 2002, from 2,056 million euros to 1,823 million<br />
euros. Operating income represented 12.5% of sales in 2002, compared to 15.0% in 2001.<br />
Financial expenses, net decreased by 4.2% between 2001 and 2002, from 544 million euros to<br />
521 million euros. Financial expenses, net is comprised of financial expenses on net indebtedness and other<br />
financial income and expenses including in particular foreign exchange gains and losses on monetary items.<br />
Financial expenses on net indebtedness increased by 3% between 2001 and 2002, from 559 million euros to<br />
577 million euros. The average interest rate on our debt was 5.2% on December 31, 2002 as compared to<br />
5.4% on December 31, 2001. Other financial income and expenses was a net gain, in 2002, of 56 million<br />
euros compared to a net gain of 15 million euros in 2001. Exchange gains amounted to 66 million euros in<br />
2002, and to 49 million euros in 2001. In 2001, other financial income and expenses included the dividends<br />
received from Blue Circle during the first half of the year.<br />
Income tax increased by 21.7% between 2001 and 2002, from 368 million euros to 448 million euros.<br />
The increase of the effective tax rate for 2002 to 34.4% is mainly due to the exceptional provision of<br />
300 million euros that was recorded in 2002 (in connection with the competition law issues discussed above)<br />
and which is not tax deductible. Moreover, we had one-off gains of 10 million euros in 2002, compared to<br />
40 million euros in 2001.<br />
Share of net income in equity affiliates grew by 83% between 2001 and 2002, from 18 million euros to<br />
33 million euros. The share of net income in equity affiliates in our Cement division amounted to 49 million<br />
euros, of which Molins accounted for 37 million euros. The share of net income in equity affiliates in our<br />
Roofing and Gypsum divisions amounted to 18 million euros. The share of the net loss of Carmeuse North<br />
America amounted to 28 million euros.<br />
Amortization of goodwill grew by 11.3% between 2001 and 2002, from 142 million euros to 158 million<br />
euros. The increase primarily reflects the scope impact resulting from the acquisition of Blue Circle.<br />
Minority interests increased by 1.1% between 2001 and 2002, from 270 million euros to 273 million<br />
euros, reflecting primarily the full-year consolidation of the former Blue Circle operations, partially offset by<br />
the change in consolidation method of our Moroccan operations.<br />
Net Income decreased by 39.2% between 2001 and 2002, from 750 million euros to 456 million euros,<br />
reflecting primarily the impact of the exceptional provision of 300 million euros. Net income represented<br />
3.1% of sales in 2002, compared to 5.5% in 2001.<br />
92
Earnings per Share<br />
Earnings per share were down 41.0% at 3.52 euros compared to 5.97 euros in 2001. The average number<br />
of shares outstanding during the year was 129.6 million, as compared to 125.6 million in 2001.<br />
Liquidity and Capital Resources<br />
Our senior management establishes our overall funding policies. The intent of these policies is to ensure<br />
our capability to meet our obligations by maintaining a strong financial structure. This policy takes into<br />
consideration, our expectations on the required level of leverage, coverage ratios, the average maturity of<br />
debt, and the acceptable sensitivity of our results to interest rate fluctuations. These targets are monitored on<br />
a regular basis. As a consequence of this policy a significant portion of our indebtedness is issued on a longterm<br />
basis. Most of this debt has been raised at fixed rates or has been converted into fixed rates using<br />
interest rate derivatives. We constantly maintain a significant amount of unused long-term committed credit<br />
lines.<br />
Our policies emphasize diversification of funding sources. Our main funding sources are long-term<br />
debenture loans, long-term notes, private placements, bank loans, committed and uncommitted credit lines<br />
and short-term commercial paper.<br />
We are subject to limited foreign exchange risks as a result of our subsidiaries’ transactions in currencies<br />
other than their operating currencies. We, however, promote the investment of excess cash balances in U.S.<br />
dollars or euros in emerging markets. Our general policy is for subsidiaries to borrow and invest excess cash<br />
in the same currency as their functional currency. Typically, a portion of our subsidiaries’ debt funding is<br />
borrowed in euros at the parent company level then converted into foreign currencies through currency swaps.<br />
For the past three years, our main sources of liquidity have been:<br />
s Cash provided by operating activities,<br />
s Cash provided by the divestment of non strategic assets, and<br />
s Cash provided by the issuance of debt and the increase of the amount of our share capital.<br />
These funds have been mainly used to finance a significant investment program (capital expenditures and<br />
acquisitions). In 2003 the level of our debt was significantly reduced. We believe, based on our current<br />
financial projections, that we have sufficient resources for our ongoing operations in both the near term and<br />
the long term.<br />
Components of our cash flows are set forth below:<br />
Year ended<br />
December 31, 2003<br />
Year ended<br />
December 31, 2002<br />
Year ended<br />
December 31, 2001<br />
(in million euros)<br />
Net cash provided by operating activities ; 2,089 1,791 1,842<br />
Net cash used in investing activities ;;; (673) (774) (4,679)<br />
Net cash (used in) provided by financing<br />
activities ;;;;;;;;;;;;; (866) (926) 2,310<br />
Net increase (decrease) in cash and cash<br />
equivalents;;;;;;;;;;;;; 550 91 (527)<br />
Net cash provided by operating activities<br />
Net cash provided by operating activities increased by 298 million euros in 2003 to 2,089 million euros.<br />
This compares to 1,791 million euros in 2002 and 1,842 million euros in 2001. The increase is mainly due to<br />
a decrease in working capital requirements between December 31, 2002 and December 31, 2003. In this area,<br />
we have launched specific initiatives to optimize our use of resources and, including, but not limited to,<br />
adoption of internal and external benchmarking, formalization of best practices, use of self assessment<br />
questionnaire and detailed reporting.<br />
93
Net cash used in investing activities<br />
Funds used in investing activities amounted to 673 million euros in 2003 (compared to 774 million euros<br />
and 4,679 million euros in 2002 and 2001, respectively). Investing activities is comprised of investment in<br />
consolidated companies, investment in non-consolidated companies, disposals, capital expenditures and the<br />
net variation in long-term receivables.<br />
In 2003, investment in consolidated companies amounted to 218 million euros, including net cash<br />
acquired. The most significant acquisitions included (amounts are converted using the average yearly<br />
exchange rates):<br />
s <strong>Lafarge</strong> Polska minority shareholders for 84 million euros in the Cement division,<br />
s Gyproc for 42 million euros in the Gypsum division (net of cash acquired).<br />
Investment in non consolidated companies includes investments accounted for using the cost method. In<br />
2003 they amounted to 102 million euros and included the acquisition from Molins of its 2.64% stake in<br />
Cimpor for 72 million euros and the investment of 20 million euros for a 7.27% stake of the newly created<br />
company which holds the former Materis activities.<br />
The disposals in 2003 amounted to 603 million euros. The most significant disposals included:<br />
s our stake in Materis Participations for 190 million euros (excluding the license payment),<br />
s cement assets in North America for 142 million euros,<br />
s Halla Cement 25% stake in Tong Yang Cement for 49 million euros, and<br />
s aggregates & concrete businesses in North America for 36 million euros.<br />
Capital expenditures (in which we include external development expenditures) totaled 864 million euros<br />
in 2003, compared with 1,149 million euros in 2002 and 1,455 million euros in 2001. Of these capital<br />
expenditures 58% were in the Cement division, 20% were in the Aggregates & Concrete division, 10% were<br />
in the Roofing division, 7% were in the Gypsum division and 5% were for holdings and other activities.<br />
Approximately 25% of our capital expenditures were for operations in North America.<br />
Our expenditures for the ongoing upgrading and modernization of our existing industrial plants totaled<br />
536 million euros in 2003, compared with 704 million euros in 2002 and 816 million euros in 2001. In 2003,<br />
49% of our sustaining capital expenditures were in the Cement division, 25% were for Aggregates &<br />
Concrete, 11% were for Roofing, 6% were for Gypsum, with the rest for holding companies and other<br />
activities.<br />
In 2003, we also invested 328 million euros in additional production capacity, including:<br />
s a cement plant in Chongqing in China for 60 million euros,<br />
s the new kiln in Ewekoro, Nigeria for 37 million euros, and<br />
s the new kiln in Tetouan, Morocco for 16 million euros.<br />
Long-term receivables include, in particular, prepaid pension assets, subordinated deposits for our<br />
securitization agreements and loans to our equity affiliates and to companies consolidated proportionally.<br />
Net cash (used in) provided by financing activities<br />
Net cash used in financing activities (in particular debt reimbursement) amounted to 866 million euros in<br />
2003 (compared with cash used in financing activities 926 million euros in 2002 and to cash provided by<br />
financing activities 2,310 million euros in 2001).<br />
At December 31, 2003, our total debt amounted to 8,695 million (compared to 11,325 million euros and<br />
to 12,904 million euros, respectively, in 2002 and 2001). Long-term indebtedness (excluding current portion)<br />
totaled 7,370 million euros compared with 10,271 million euros and 11,041 million euros, respectively, in<br />
2002 and 2001. Approximately 26% of the 2003 long-term indebtedness (excluding current portion) will<br />
94
mature after 2008. Long-term indebtedness largely comprises fixed rate debt (after taking into account interest<br />
rate swaps). Most of this debt is denominated in euros, partially converted into foreign currencies through<br />
currency swaps (see Item 11 and Notes 24 and 25 of our consolidated financial statements for further<br />
discussion of our financial indebtedness).<br />
Our net financial debt totaled 7,061 million euros at December 31, 2003 (10,216 million euros and<br />
11,703 million euros at December 31, 2002 and 2001, respectively). Our cash and cash equivalents amounted<br />
to 1,634 million euros at year end and are mainly denominated in euros, U.S. dollars and Canadian dollars.<br />
At December 31, 2003 the average interest rate on our debt was 5.8% compared to 5.2% and 5.4% at<br />
December 31, 2002 and 2001, respectively.<br />
Our net debt-to-equity ratio stood at 67% at December 2003 (compared to 110% at December 31, 2002<br />
and 2001). For a reconciliation of our net debt and the reasons we believe this information is useful to<br />
investors, please see the section entitled ‘‘Reconciliation of non-GAAP Financial Measures Utilized — Net<br />
Debt’’ in this item 5.<br />
At the end of 2003, we reclassified 89 million euros of short-term debt (1,664 million euros and<br />
1,662 million euros, respectively, at the end of 2002 and 2001) into long-term debt, on the basis of our ability<br />
to refinance this obligation using the available funding provided by medium and long-term committed credit<br />
lines.<br />
At December 31, 2003, our short-term debt (including the current portion of long-term debt) amounted<br />
to 1,325 million euros. We are subject to fluctuation of our short-term debt due to the significant seasonality<br />
of our operations. We usually experience a slowdown in building activity during winter season in our<br />
principal markets in Western Europe and North America, while working capital requirements tend to increase<br />
during the first semester.<br />
In general, we meet our long-term financing needs through bond issuances and the use of long-term<br />
instruments, such as our Euro Medium-Term Note program and bank loans. Short-term needs are mainly met<br />
through the issuance of domestic commercial paper as well as the use of credit lines.<br />
The principal programs currently at our disposal in order to issue financial market debt are as follows:<br />
s a Euro Medium-Term Note program with a maximum available amount of 7,000 million euros. At<br />
December 31, 2003, we had approximately 3,238 million euros of debt outstanding under the Euro<br />
Medium-Term Note program.<br />
s a euro denominated Commercial Paper program, with a maximum available amount of 4,000 million<br />
euros. At the end of 2003, 86 million euros of commercial paper were outstanding under this program.<br />
s a U.S. dollar denominated Commercial Paper program, set up by our subsidiary <strong>Lafarge</strong> North<br />
America, for a maximum amount of 300 million U.S. dollars (238 million euros). At the end of 2003,<br />
there is no outstanding commercial paper under this program.<br />
We maintain committed long-and-medium-term credit lines from various banks at the parent and<br />
subsidiary level to ensure the availability of funding on an as-needed basis.<br />
At December 31, 2003, these committed credit lines on a consolidated basis amounted to approximately<br />
3,400 million euros (compared to approximately 4,000 million euros and 4,200 million euros, respectively, at<br />
December 31, 2002 and 2001). Of this amount, approximately 3,380 million euros were available at<br />
December 31, 2003 compared to approximately 3,800 million and 2,900 million respectively, at December 31,<br />
2002 and 2001).<br />
The average maturity of these credit facilities was approximately 3.6 years at the end of 2003 versus 2.5<br />
years at the end of 2002. The extension in the maturity of our credit facilities reflects the signing of a<br />
1,400 million euros syndicated credit facility with a 5-year maturity.<br />
On June 29, 2001, we issued an aggregate amount of approximately 1,300 million euros of OCEANE<br />
bonds. Each bond is convertible and/or exchangeable into new or existing shares, and has a nominal value of<br />
127 euros. The bonds are currently convertible and/or exchangeable into approximately 10.8 million shares<br />
95
(this reflects the adjustment required by French law following the July 2003 right issue which resulted in a<br />
conversion/exchange ratio of 1 bond for 1.052 share). The bonds bear an effective interest rate of 3.5% per<br />
annum. They will mature on January 1, 2006, with a redemption price of 139.17 euros, representing<br />
approximately 109.58% of the nominal value of the bonds. Early redemption is possible after two years at our<br />
option under specific conditions.<br />
In December 2003 the group issued a 0.5 billion euros of bonds in partial exchange for existing bonds<br />
with maturities ranging from 2005 to 2007. The new bonds bear an interest rate of 5.448% with a 10-year<br />
maturity.<br />
In addition, we issued the following debt securities in 2001 and 2002:<br />
s on November 6, 2001, 1,000 million in euro bonds bearing a fixed interest rate of 5.875% with a 7year<br />
maturity,<br />
s on November 6 and December 20, 2001, 350 million in British pound bonds bearing a fixed interest<br />
rate of 6.875% with an 11-year maturity,<br />
s on December 4, 2001, 250 million in euro bonds bearing a fixed interest rate of 4.625% with a 3.25year<br />
maturity, and<br />
s on November 29, 2002, 200 million in British pound bonds bearing a fixed interest rate of 6.625%<br />
with a 15-year maturity.<br />
In 2001, we also conducted private placements of debt securities under existing programs and incurred<br />
additional bank indebtedness, including 50 million euros of notes issued under our Euro Medium-Term Note<br />
program with a two-year maturity, and a 100 million euro bank loan with a five-year maturity.<br />
We have also significantly increased our equity over the last three years. In July 2003, we raised<br />
1,305 million euros (1,262 million euros net of issuance expenses), through the issuance of 31,831,528 new<br />
shares at a price of 41 euros a share in a 4 for 17 underwritten rights offering to our shareholders.<br />
In February 2001, we raised 1,113 million euros, net of issuance expenses, through the issuance of<br />
14,110,592 shares at a price of 80 euros a share in a 1 for 8 underwritten rights offering to our shareholders.<br />
In addition, in 2001 we issued 2,099,000 shares for a total amount of 152 million euros upon the<br />
exercise of stock subscription warrants attached to bonds we had previously issued in an underwritten rights<br />
offering to our shareholders in 2000. The bonds were to be used to finance our initial bid for Blue Circle in<br />
February 2000 and were redeemed when the bid failed. The stock subscription warrants remained outstanding<br />
after the redemption of the bonds and were exercisable for a total of 5,833,086 shares at a rate of 4<br />
subscription warrants for 1 share and a price of 74 euros per share and had to be exercised before April 2001.<br />
Approximately 3,763,000 shares were issued as result of the exercise of these warrants in 2000 for a total<br />
amount of 278 million euros. The remaining warrants were exercised in 2001.<br />
Some of our loan agreements contain restrictions on the ability of subsidiaries to transfer funds to the<br />
parent company in certain specific situations. The nature of these restrictions can be either regulatory, when<br />
the transfers of funds are subject to approval of local authorities, or contractual, when the loan agreements<br />
include restrictive provisions such as negative covenants on the payment of dividends. However, we do not<br />
believe that any of these covenants or restrictions will have any material impact on our ability to meet our<br />
cash obligations. Please see the risk factor in Item 3 entitled ‘‘Our ability to pay dividends and repay debt<br />
depends on our ability to transfer income and dividends from our subsidiaries’’.<br />
Our reliance on external sources to finance a significant portion of our capital requirements makes our<br />
access to global sources of financing important. The cost and availability of unsecured financing are generally<br />
dependent on our short-term and long-term credit rating. Factors that are significant in the determination of<br />
our credit ratings or that otherwise could affect our ability to raise short-term and long-term financing<br />
include: our level and volatility of earnings, our relative positions in the markets in which we operate, our<br />
global and product diversification, our risk management policies, and our leverage ratios such as debt to total<br />
capital and interest coverage. We expect credit rating agencies will focus, in particular, on our ability to<br />
generate sufficient operating cash flows to provide for future reductions in our indebtedness. A deterioration<br />
96
in any of the previously mentioned factors or combination of these factors may lead rating agencies to<br />
downgrade our credit ratings, thereby increasing our costs in obtaining unsecured financing.<br />
Conversely, an improvement of these factors may lead rating agencies to upgrade our credit ratings.<br />
As of March 25, 2004, the credit ratings for our short and long-term debt were as follows:<br />
Short-term Long-term<br />
Standard & Poor’s ;;;;;;;;;;;;;;;;;;;;;; A-3 BBB (negative)<br />
Moody’s ;;;;;;;;;;;;;;;;;;;;;;;;;; NR Baa2 (stable)<br />
In September 2003, Moody’s downgraded our long-term credit rating from Baa1 to Baa2 and Standard &<br />
Poor’s downgraded our short-term rating from A-2 to A-3. However, these changes had a very limited impact<br />
on the price of our outstanding bonds and on our short-term financing costs<br />
Cash surpluses<br />
We do not operate a worldwide centralized cash management program, and each company within the<br />
group manages its own cash surpluses in accordance with policies set by senior management. In order to<br />
ensure that cash surpluses are used efficiently we have adopted in a number of cases cash pooling structures<br />
on a country-by-country basis. Moreover, with the introduction of the euro, we have established a daily<br />
process for centralizing cash surplus for most of the euro-zone countries.<br />
As a general policy, cash surpluses are to be invested in liquid short-term instruments with at least twothirds<br />
of any cash surplus being invested in instruments with a maturity of less than three months.<br />
Effect of currency fluctuations on our results and balance sheet<br />
We publish our consolidated financial statements in euros. In 2003, approximately 33% of our sales were<br />
realized in euro-zone countries. The principal portion of our assets, liabilities, sales and earnings are<br />
denominated in currencies other than the euro, particularly the U.S. dollar and U.S. dollar-influenced<br />
currencies, such as certain South American and Asian currencies, as well as the British pound. As a result,<br />
we are exposed to fluctuations in the values of such currencies against the euro, with respect to the translation<br />
into euros of amounts to be reflected in our consolidated financial statements.<br />
Disclosure about contractual and contingent commitments including tabular disclosure<br />
The following table sets forth our estimate of our exposure to our significant contractual obligations with<br />
respect to repayment of debt, payments under capital lease obligations and operating leases, exercisable<br />
purchase obligations held by third party shareholders and other purchase obligations and payments under<br />
other commitments.<br />
Less than<br />
1 year<br />
1-5<br />
years<br />
More than<br />
5 years<br />
Total<br />
2003 2002 2001<br />
(in million euros)<br />
Debt* ;;;;;;;;;;; 1,325 5,420 1,950 8,695 11,325 12,904<br />
Capital lease obligations ;;; 3 5 24 32 14 20<br />
Operating leases ;;;;;; 142 318 263 723 735 400<br />
Capital expenditures and other<br />
purchase obligations ;;;; 332 259 191 782 613 337<br />
Other commitments ;;;;; 20 27 45 92 138 49<br />
TOTAL ;;;;;;;;;; 1,822 6,029 2,473 10,324 12,825 13,710<br />
* Excludes accrued interest and includes convertible debt. See Note 24(a) to our consolidated financial<br />
statements.<br />
97
We expect to have the ability to refinance our debt obligations as they fall due. Our short-term debt<br />
commitments due in 2004 amount to 1,325 million euros at December 31, 2003 (including the current portion<br />
of long-term debt).<br />
Capital expenditures and other purchase commitments amounted to 782 million euros at December 31,<br />
2003 (compared to 613 million euros and 337 million euros at December 31, 2002 and 2001 respectively).<br />
For more information about expected capital expenditures please see the subsections entitled ‘‘Capital<br />
Expenditures’’ in the description of each of our divisions in ‘‘Item 4. Information on the Company’’.<br />
As part of the acquisition process of certain entities, we have granted third party shareholders the option<br />
to require us to purchase their shares at a predetermined price, according to fair market value. These<br />
shareholders are either international institutions, such as the European Bank for Reconstruction and<br />
Development, or private investors which are essentially financial or industrial investors or the former<br />
shareholders of the relevant companies. In the event these shareholders exercise these options, our percentage<br />
ownership interest in the relevant company would increase. Assuming that all of these options were exercised,<br />
the purchase price to be paid by the company, including net debt acquired, would amount to 448 million<br />
euros as of December 31, 2003. Based upon the terms of these agreements, a portion of the total amount<br />
could be exercised in 2004 and 2005 for 197 million euros and 112 million euros, respectively. The residual<br />
139 million euros can be exercised commencing in 2006.<br />
Subsequent the closing, we purchased an additional 10.2% equity interest in our South Korean subsidiary<br />
<strong>Lafarge</strong> Halla Cement for $71 million (56 million euros) from the State of Wisconsin Investment Board<br />
(‘‘SWIB’’). <strong>Lafarge</strong> Halla Cement will be fully consolidated in 2004, as opposed to proportionately<br />
consolidated in previous years, which will result in an increase in the consolidated net debt by 15 millions<br />
euros. As a consequence of this transaction, a put option previously granted to SWIB by the company has<br />
been cancelled. After taking this acquisition into consideration and assuming that all of the options were<br />
exercised, the purchase price to be paid by the company, including net debt acquired, would amount to<br />
377 million euros of which 126 million euros would be payable pursuant to options exercisable in 2004.<br />
We do not expect all of these options to be exercised immediately when they become exercisable. Some<br />
of these options have expiry dates. It is likely that those options will be exercised by such dates.<br />
We have implemented new procedures with respect to outstanding commitments and contingencies<br />
which provide information about material collateral and other guarantees. At December 31, 2003, we had<br />
outstanding collateral and other guarantees amounting to 812 million euros, comprised of 18 million euros of<br />
pledged assets and other assets, 603 million euros of mortgages over property and 191 million euros of other<br />
guarantees provided.<br />
Disclosure about derivative instruments<br />
Our policy is in general to use derivative instruments only to hedge against our exposure to exchange<br />
rate and interest rate risk. However, to manage our exposure to commodity risks we enter, from time to time,<br />
into derivative instruments. With the prior authorization of our senior management, we have occasionally<br />
entered into agreements to reduce our exposure to equity risk.<br />
We have defined strict policies and procedures to measure, manage and monitor our market risk<br />
exposures. Our policies do not permit any speculative market position. We have instituted management rules<br />
based on a segregation of operations, financial and administrative control and risk measurement. We have<br />
also instituted, for all operations managed at corporate level, an integrated system that permits real time<br />
monitoring of hedging strategies.<br />
For additional information, please refer to the ‘‘Item 11. Quantitative and Qualitative Disclosures About<br />
Market Risk’’, and Note 25 to our consolidated financial statements.<br />
Discussion of differences in Operating income under French GAAP and U.S. GAAP.<br />
We prepare our financial statements in accordance with French GAAP, which differs in certain<br />
significant respects from US GAAP, as discussed in Notes 31, 32, 33 and 34 to the consolidated financial<br />
98
statements. The individual differences discussed in Notes 31 and 32 describe the main adjustments to the<br />
French GAAP consolidated financial statements.<br />
Reclassification between French GAAP and US GAAP of fully consolidated and proportionately<br />
consolidated entities.<br />
We account for various entities as either proportionately consolidated or fully consolidated for purposes<br />
of French GAAP and as equity method investees for US GAAP. The statement of income and balance sheet<br />
effects of these and other US GAAP reclassifications and adjustments are included in the condensed US<br />
GAAP financial statements presented in Note 32 to the consolidated financial statements.<br />
If the above noted entities were accounted for under the equity method in our French GAAP financial<br />
statements, we would have reported revenues of 12,468 million euros (1,190 million euros less than under<br />
French GAAP) for the year ended December 31, 2003, 13,406 million euros (1,204 million euros less than<br />
under French GAAP) for the year ended December 31, 2002, and 12,363 million euros (1,335 million euros<br />
less than under French GAAP) for the year ended December 31, 2001. Our operating income after reflecting<br />
our proportionately consolidated and fully consolidated entities as equity method investees would have been<br />
1,835 million euros (221 million euros less than under French GAAP), 1,624 million euros (199 million euros<br />
less than under French GAAP), and 1,967 million euros (89 million euros less than under French GAAP) for<br />
the years ended December 31, 2003, 2002 and 2001, respectively.<br />
Reclassification of income statement items between French GAAP and US GAAP for the year ended<br />
December 31, 2003.<br />
The variation between French and US GAAP operating income, apart from the effect of the<br />
proportionately consolidated and fully consolidated entities discussed above was primarily due to the<br />
following items:<br />
Items classified as non operating income under French GAAP have been reclassified as operating income<br />
under US GAAP, including amortization of goodwill of 135 million euros.<br />
Adjustments related to differences in accounting for business combinations under French GAAP and US<br />
GAAP.<br />
For purposes of US GAAP and in accordance with the SFAS 142 ‘‘Goodwill and Other Intangible<br />
Assets’’ , goodwill is no longer amortized. The goodwill amortization charge of 117 million of euros recorded<br />
under French GAAP is reversed under US GAAP.<br />
We also present the impact of negative goodwill amortization as non operating in French GAAP,<br />
whereas under US GAAP, negative goodwill is offset against long-lived assets which in turn impacts<br />
depreciation expense recorded as operating expense. The net result of the above adjustments is an increase in<br />
operating income of 20 million euros.<br />
Adjustments resulting from accounting for stock based compensation under US GAAP.<br />
We do not record compensation expense under French GAAP for our employee stock compensation<br />
plans. Under US GAAP we record the change in intrinsic value for the period as compensation expense or<br />
recovery of prior period expense. The effect upon operating income for the year was a decrease under US<br />
GAAP of 2 million euros.<br />
Adjustments related to differences in accounting for restructuring provisions under French GAAP and<br />
US GAAP.<br />
Differences between French and US GAAP with respect to accounting for restructuring provisions results<br />
in a decrease of 7 million euros to French GAAP operating income.<br />
99
Adjustments related to differences in accounting for derivative instruments under French GAAP and US<br />
GAAP.<br />
French GAAP does not require the recognition of the fair value of derivatives instruments in the<br />
financial statements. Under US GAAP, derivative instruments are marked to market. As a result of the<br />
application of SFAS 133, ‘‘Accounting for Derivative Instruments and Hedging Activities’’, we recorded<br />
17 million euros as an increase of the operating income, which relates to the fair value of embedded<br />
derivatives on forward purchase contracts for electricity.<br />
Reclassification of income statement items between French GAAP and U.S. GAAP for the year ended<br />
December 31, 2002.<br />
The variation between French and U.S. GAAP operating income, apart from the effect of the<br />
proportionately consolidated and fully consolidated entities discussed above, was primarily due to the<br />
following items:<br />
Items classified as non operating income under French GAAP have been reclassified as operating income<br />
under U.S. GAAP including amortization of goodwill of 158 million euros which is not a component of<br />
operating income under French GAAP has been reclassified as operating income under U.S. GAAP.<br />
Adjustments related to differences in accounting for business combinations under French GAAP and U.S.<br />
GAAP.<br />
For purposes of U.S. GAAP and accordance with the SFAS 142 Goodwill and Other Intangible Assets,<br />
goodwill is no longer amortized. The result is a decrease in the French GAAP goodwill amortization of<br />
158 million of euros which relates to such acquisitions.<br />
We also present the impact of negative goodwill amortization as non operating in French GAAP,<br />
whereas under U.S. GAAP, negative goodwill is offset against long lived assets which in turn impacts<br />
depreciation expense recorded as operating expense. The net result of the above adjustments is an increase in<br />
operating income of 23 million euros.<br />
Adjustments resulting from accounting for stock based compensation under U.S. GAAP.<br />
We do not record compensation expense under French GAAP for our employee stock compensation<br />
plans. Under U.S. GAAP we record the change in intrinsic value for the period as compensation expense or<br />
recovery of prior period expense. The effect upon operating income for the year was an increase under U.S.<br />
GAAP of 60 million euros.<br />
Adjustments related to differences in accounting for provisions under French GAAP and U.S. GAAP.<br />
Differences between French and U.S. GAAP with respect to accounting for restructuring provisions<br />
results in a decrease of 87 million euros to French GAAP operating income.<br />
Reclassification of income statement items between French GAAP and U.S. GAAP for the year ended<br />
December 31, 2001.<br />
The variation between French and U.S. GAAP operating income, apart from the effect of the<br />
proportionately consolidated and fully consolidated entities discussed above was primarily due to the<br />
following items:<br />
Items classified as operating income under French GAAP have been reclassified as non operating income<br />
under U.S. GAAP including:<br />
s Realized gains from disposals of long-term equity investments (marketable securities under U.S.<br />
GAAP) amounting to 205 million euros,<br />
s Amortization of goodwill of 128 million euros which is not a component of operating income under<br />
French GAAP has been reclassified as operating income under U.S. GAAP.<br />
100
Adjustments related to differences in accounting for business combinations under French GAAP and U.S.<br />
GAAP.<br />
For French GAAP, we included in operating income the gain on disposal of the Specialty Products<br />
division in the year ended December 31, 2000. The sale of these entities was not considered to be<br />
consummated under U.S. GAAP until January 22, 2001, the formal date of closing. Accordingly, for the year<br />
ended December 31, 2001 there is an increase in operating income of 88 million euros under U.S. GAAP.<br />
For U.S. GAAP we recorded goodwill amortization expense related to amounts classified as market share<br />
and trademarks and which are not amortized under French GAAP. For purposes of U.S. GAAP, goodwill<br />
resulting from business combinations subsequent to June 30, 2001 is not amortized. The result is a decrease<br />
in the French GAAP goodwill amortization which relates to such acquisitions, the most significant effect<br />
resulting from the acquisition of Blue Circle on July 11, 2001. We also present the impact of negative<br />
goodwill amortization as non operating in French GAAP, whereas under U.S. GAAP, negative goodwill is<br />
offset against long lived assets which in turn impacts depreciation expense recorded as operating expense.<br />
The net result of the above adjustments is an increase in operating income of 3 million euros.<br />
French GAAP provides that where a business combination results in regional over capacity, costs<br />
associated with restructuring the acquirer’s operations should be included as a cost of the acquisition. U.S.<br />
GAAP specifically excludes from costs of an acquisition those costs associated with closing duplicate<br />
facilities and restructuring operations of the acquirer. As a result, U.S. GAAP operating income is decreased<br />
by 94 million euros related to certain of our plant closure costs which result from the purchase of Blue Circle<br />
and which are included as a cost of the acquisition under French GAAP.<br />
Adjustments resulting from accounting for stock based compensation under U.S. GAAP.<br />
We do not record compensation expense under French GAAP for our employee stock compensation<br />
plans. Under U.S. GAAP we record the change in intrinsic value for the period as compensation expense or<br />
recovery of prior period expense. The effect upon operating income for the year was a decrease under U.S.<br />
GAAP of 50 million euros.<br />
Adjustments related to differences in accounting for provisions under French GAAP and U.S. GAAP.<br />
Differences between French and U.S. GAAP with respect to accounting for restructuring provisions<br />
results in a decrease of 71 million euros to French GAAP operating income.<br />
Summary.<br />
Our operating income under US GAAP taking into consideration the above effects, totaled 1,854 million<br />
euros (202 million euros lower than under French GAAP), 1,580 million euros (243 million euros lower than<br />
under French GAAP), and 1,403 million euros (653 million euros lower than under French GAAP) for the<br />
years ended December 31, 2003, 2002 and 2001, respectively.<br />
Forward Looking Discussion of Available Trend Information<br />
Looking forward, we do not expect to see any major turn-around in our markets in 2004 compared to the<br />
average for 2003, except for the progressive return to normality of cement prices in Germany and in the<br />
Philippines and generally well-oriented pricing conditions expected in our other markets. In Western Europe<br />
we believe that our major markets will remain broadly stable in 2004, compared to 2003, with the exception<br />
of Greece, where the demand can be expected to decrease following the completion of the projects for the<br />
Olympic Games. In North America we do not expect a boom year for construction in 2004, and in the United<br />
States in particular, we believe construction activity should achieve only marginal growth as residential<br />
construction starts to cool down. We believe the turn around in these sectors will begin in late 2004 or early<br />
2005. In 2004, we expect to see growth in emerging markets and more specifically from Asia, Central Europe<br />
and Africa.<br />
With respect to our industrial performance, we believe we have improved our planning cycle and have<br />
the appropriate tools and organization to share our knowledge and experience better throughout our entire<br />
101
operation. We expect this to help us to deliver continuous performance improvements and thus to mitigate the<br />
impact of the energy cost increases we expect to see in 2004, through reduced energy consumption and<br />
improvements in the fuel source mix.<br />
As far as pension costs are concerned, we expect another increase in our expense of approximately<br />
25 million euros in 2004.<br />
We intend to pursue the strengthening of our financial structure in the future, through our capacity to<br />
generate strong cash flows and our ongoing focus on working capital management associated with a strict<br />
monitoring of sustaining capital expenditures and further selective divestments.<br />
We also intend to pursue our development strategy through small and medium-size growth projects with<br />
attractive returns, primarily in Cement worldwide and in Aggregates in Europe and North America.<br />
The foregoing are intended to be forward-looking statements made in reliance on the safe harbor<br />
provisions of the Private Securities Litigation Reform Act of 1995. For a discussion of the risks and<br />
uncertainties inherent in these forward-looking statements, see the sections entitled ‘‘Risk Factors’’ and<br />
‘‘Presentation of Information’’. These statements are made only as of the date hereof. We do not undertake to<br />
update any of these forward-looking statements to reflect new information or subsequent events or<br />
circumstances.<br />
ITEM 6. DIRECTORS, SENIOR MANAGEMENT AND EMPLOYEES<br />
Directors and Executive Officers<br />
In accordance with French law governing a société anonyme, as amended on May 15, 2001, and our bylaws<br />
(statuts), our affairs are managed by the Board of Directors, the Chairman of the board (président) and<br />
the Chief Executive Officer (directeur général), with the Chairman and the Chief Executive Officer being the<br />
same person or different persons, as may be decided from time to time by the Board of Directors. The Board<br />
of Directors sets forth our business strategy and monitors its implementation. Within the limit of our<br />
corporate purpose and subject to the powers expressly reserved to our shareholders by law and by our statuts,<br />
it can make decisions on any matter regarding our company.<br />
The Chairman organizes and presides over the Board of Directors’ proceedings and ensures that the<br />
directors are capable of fulfilling their tasks, and reports on these proceedings to the meetings of shareholders,<br />
monitors the compliance with our corporate governance principles and presides over general meetings of<br />
shareholders. Our Chairman is Bertrand Collomb.<br />
The Chief Executive Officer has full executive authority to manage the affairs of our company and has<br />
broad powers to act on behalf of our company and to represent <strong>Lafarge</strong> in dealings with third parties, subject<br />
only to the powers expressly reserved to its Board of Directors or its shareholders by law, by our statuts, by<br />
decision of the Board of Directors or by decision of the shareholders. Our Chief Executive Officer is Bernard<br />
Kasriel.<br />
Pursuant to the May 15, 2001 act amending French law governing a société anonyme, and after approval<br />
by the extraordinary general meeting of shareholders on November 5, 2002, we have amended our statuts to<br />
set forth the conditions pursuant to which the Board of Directors can decide, by a majority decision, to vest<br />
the management of our company either in a single Chairman of the Board and Chief Executive Officer, or in<br />
a Chief Executive Officer that is distinct from the Chairman of the Board. Pursuant to these amendments, the<br />
Board of Directors decided on February 26, 2003 to appoint a Chief Executive Officer distinct from the<br />
Chairman of the Board, effective as of May 20, 2003. The Board may subsequently change the form of<br />
general management pursuant to the same conditions as to majority voting; in any event, the Board shall<br />
render a decision as to the form of general management at the time of the appointment or the renewal of the<br />
term of office of the Chief Executive Officer if such person is not the Chairman.<br />
Our statuts also include provisions providing for the possibility of the appointment of up to five Chief<br />
Operating Officers (directeurs généraux délégués) by the Board, pursuant to a proposal by the Chief<br />
Executive Officer. We currently have two Chief Operating Officers, Michel Rose and Bruno Lafont, that were<br />
appointed by the Board of Directors on February 27, 2002 and May 20, 2003, respectively.<br />
102
Directors and Senior Management<br />
Board of Directors<br />
Presently, the Board of Directors consists of fifteen members. Our statuts currently provide that there<br />
must be at least three directors and no more than 18 directors elected by the general meeting of shareholders,<br />
that the term of office of directors elected in 2002 and in subsequent years shall be four years, that the term<br />
of office of directors elected in 2001 is five years and that directors elected prior to 2001 have a term of<br />
office of six years. Our Board of Directors met five times during the course of fiscal year 2003. None of our<br />
shareholders has the right to appoint a director to the Board of Directors. There is no arrangement or<br />
understanding with major shareholders, customers, suppliers or others, pursuant to which any person referred<br />
to below was selected as a director or an executive officer.<br />
The Board of Directors cannot increase the actual number of members serving on the Board. Only the<br />
shareholders, acting as a simple majority, can do so. Each director must also be a shareholder and must hold<br />
such number of shares of the company in registered form as represent in the aggregate a nominal value of at<br />
least 4,572 euros, which, at the current par value of 4 euros, amounts to 1,143 shares per director. Under<br />
French law, a director may be an individual or a legal entity, but the Chairman and/or the Chief Executive<br />
Officer must be an individual or individuals. The Chairman and/or the Chief Executive Officer are elected by<br />
the Board of Directors.<br />
Directors are elected by the shareholders and serve until the expiry of their respective term, or until their<br />
resignation, death or removal, with or without cause by the shareholders. Under certain conditions, the Board<br />
of Directors may fill vacancies on the Board of Directors, pending the next shareholders’ meeting. The Board<br />
of Directors has the power to appoint and remove the Chairman and/or the Chief Executive Officer at any<br />
time.<br />
In consideration for their services on the board, directors are entitled to receive directors’ fees. The total<br />
annual amount of directors’ fees (jetons de presence) is fixed by the shareholders’ meeting, but the Board of<br />
Directors determines their allocation among the directors. In addition, remuneration may be granted to<br />
directors who serve as members of committees formed from among board members or who are entrusted with<br />
specific tasks or duties. In such event, such remuneration is charged to operating costs, notified to the<br />
auditors, submitted for prior authorization of the Board of Directors and subsequently approved by the<br />
shareholders’ meeting. A director may not vote for his or her own remuneration. If he or she does, the<br />
decision is void. The board may also authorize the reimbursement of travel and accommodation expenses as<br />
well as other expenses incurred by directors in the corporate interest.<br />
Under French law, the Board of Directors presents the year-end accounts to the shareholders and<br />
convenes shareholders’ meetings. In addition, the Board of Directors reviews and monitors the economic,<br />
financial and technical strategies of the company.<br />
Meetings of the Board of Directors, which are held as often as required in the corporate interest, and in<br />
any case at least four times a year, are normally convened by the Chairman. Our statuts provide, in<br />
accordance with French company law, that if our Board of Directors has not met for over two months, at<br />
least one-third of the members of the board may request that the Chairman convene the board regarding<br />
matters listed in the agenda for the meeting. A quorum consists of one-half of the members of the Board of<br />
Directors, and decisions are made by a vote of the majority of the members present or represented by other<br />
members of the Board of Directors. A director may give a proxy to another director but a director cannot<br />
represent more than one other member at any particular meeting. Members of the Board of Directors<br />
represented by another member at meetings do not count for purposes of determining the existence of a<br />
quorum. However, members participating via authorized videoconference are deemed present for such<br />
purposes, except where the vote concerns the appointment or reappointment of the Chairman, the Chief<br />
Executive Officer or the Chief Operating Officers, or in the event of the adoption of the decisions enumerated<br />
in Article L 225-37 of the French Commercial Code. A director may not vote for an arrangement or contract<br />
in which he or she is materially interested. If he or she does vote, the decision will be void.<br />
Under French law and the company’s statuts, any accommodation with respect to a negotiable<br />
instrument, or to any other type of guaranty or surety by the company requires the prior authorization of the<br />
103
Board of Directors. The authorization is generally granted for a period of one year. Under French law, the<br />
directors and the Chief Executive Officer are liable for violations of French legal and regulatory requirements<br />
applicable to sociétés anonymes, violations of our by-laws and negligent mismanagement. A director or the<br />
Chief Executive Officer may be held liable for such actions both individually and jointly with the other<br />
directors.<br />
French law prohibits us from making, directly or indirectly, any type of loan, including in the form of an<br />
open account or guaranty, to our directors (including permanent representatives of companies on the Board of<br />
Directors). Furthermore, this prohibition extends to their spouses, parents and grandparents and descendants.<br />
This provision also applies to certain of our executive officers (Chief Executive Officer and Chief Operating<br />
Officers).<br />
The table below sets forth, at February 29, 2004, the names and ages of our directors, their current<br />
positions with our company, the dates of their initial appointment as directors, the expiration dates of their<br />
current terms and their current principal occupation or employment. There is no family relationship between<br />
any of the persons listed in this chart. The address of each person listed is 61, rue des Belles Feuilles, BP 40,<br />
75782 Paris Cedex 16, France.<br />
Name Age<br />
Current Position with<br />
<strong>Lafarge</strong><br />
Bertrand Collomb;; 61 Chairman of the<br />
Board of the<br />
company<br />
Bernard Kasriel ;; 57 Vice-Chairman of<br />
the Board and Chief<br />
Executive Officer of<br />
the company(2)<br />
Jacques Lefèvre ;; 65 Vice-Chairman of<br />
the Board of the<br />
company<br />
Principal Business Activities Performed<br />
Outside <strong>Lafarge</strong> S.A.<br />
– Chairman of <strong>Lafarge</strong> North America<br />
– Director of Total, Vivendi Universal<br />
and Atco<br />
– Member of the Supervisory Board of<br />
Allianz<br />
– Member of the Advisory Board of<br />
Unilever<br />
– Director of <strong>Lafarge</strong> North America<br />
and Sonoco Products Company<br />
– Chairman of the Supervisory Board<br />
of Compagnie de Fives Lille<br />
– Director of Société Nationale<br />
d’Investissement (Morocco),<br />
Cimentos de Portugal and<br />
Petrokazakhstan Inc. (Canada).<br />
Michael Blakenham ; 66 Director – President of the British Trust for<br />
Ornithology<br />
– Director of Sotheby’s Holdings Inc.<br />
Michel Bon ;;;; 60 Director – Honorary Chairman of France<br />
Télécom<br />
– Chairman of the Supervisory Board<br />
of Editions du Cerf<br />
– Director of Sonepar<br />
– Member of the Supervisory Board of<br />
Grand Vision and Air Liquide<br />
Guilherme Frering ; 45 Director – President of the Instituto Desiderata<br />
(Brazil)<br />
Juan Gallardo ;;; 56 Director – Chairman of Grupo Embotelladoras<br />
Unidas S.A. de C.V. (Mexico)<br />
– Director of Nacional Drogas, Grupo<br />
Mexico and Caterpillar Inc.<br />
– Member of the International Advisory<br />
Council of Textron Inc. and<br />
– Member of the Mexican Business<br />
Roundtable<br />
104<br />
Initial Year of<br />
Appointment<br />
Expiration of Term<br />
of Office: General<br />
Meeting approving<br />
financial statements<br />
for financial year<br />
ended<br />
1987 2004<br />
1989 2005<br />
1989 2005<br />
1997 2006<br />
1993 2004<br />
1997 2006<br />
2003 2004(2)
Name Age<br />
Current Position with<br />
<strong>Lafarge</strong><br />
Principal Business Activities Performed<br />
Outside <strong>Lafarge</strong> S.A.<br />
Patrice le Hodey ;; 59 Director – Vice Chairman of Libre Belgique<br />
Dernière Heure (IPM),<br />
– Chairman of Audiopresse and Derouk<br />
Cartographie<br />
– Director of RTL-TVI and the Belga<br />
press agency<br />
Bernard Isautier ;; 61 Director – Chairman and Chief Executive<br />
Officer of Petrokazakhstan Inc.<br />
(Canada).<br />
Alain Joly ;;;;; 65 Director – Chairman of the Supervisory Board<br />
of Air Liquide<br />
– Director of BNP-Paribas<br />
Jean Keller ;;;; 69 Director – Member of the Standards Advisory<br />
Council of the International<br />
Accounting Standards Board and of<br />
the Supervisory Council of the<br />
European Financial and Accounting<br />
Advisory Group<br />
Initial Year of<br />
Appointment<br />
Expiration of Term<br />
of Office: General<br />
Meeting approving<br />
financial statements<br />
for financial year<br />
ended<br />
1987 2004<br />
1989 2005<br />
1993 2004<br />
1998 2003(1)<br />
Raphaël de <strong>Lafarge</strong> ; 61 Director – Director of Borgey S.A. 1982 2006<br />
Robert W. Murdoch; 62 Director – Director of <strong>Lafarge</strong> North America,<br />
<strong>Lafarge</strong> Canada, Sierra Systems<br />
Group Inc., Lallmand Inc., A.P.<br />
Plasman, Inc. and Timber West<br />
Forest Corp. (Canada)<br />
Michel Pébereau ;; 62 Director – Chairman of BNP-Paribas<br />
– Director of Total and Saint-Gobain<br />
(France)<br />
– Member of the Supervisory Board of<br />
Axa and Galeries Lafayette<br />
Hélène Ploix;;;; 59 Director – Chairman of Pechel Industries S.A.S.<br />
and CDC Participations<br />
– Chairman of the Supervisory Board<br />
of CDC Gestion (France)<br />
– Director of Publicis Groupe (France),<br />
BNP-Paribas, Ferring S.A.,<br />
(Switzerland) and the Boots Group<br />
Plc. (Great Britain)<br />
1993 2004<br />
1991 2006<br />
1999 2004<br />
(1) Director whose term of office is expected to be renewed for an additional period of four years by the<br />
shareholder’s meeting to be held on May 25, 2004.<br />
(2) Juan Gallardo was co-opted by the Board of Directors as the replacement for Mr. Richard<br />
Haythornthwaite who resigned as a director effective as of July 1, 2003. His appointment is subject to<br />
ratification by the annual general meeting of shareholders to be held on May 25, 2004.<br />
The following directors are also executive officers at March 15, 2004:<br />
Bertrand Collomb and Bernard Kasriel.<br />
Board practices and committees<br />
The Board of Directors usually meets four times a year in France or abroad. The Board held four regular<br />
meetings in 2003, on February 26, May 20, September 3 and December 10 and a special meeting on June 11<br />
to decide on a rights issue. The directors’ attendance rate was 89% in 2003. The Board approved a charter<br />
governing board and committee practices as well as a code of conduct for directors. The Board of Directors<br />
comprises the following committees:<br />
The Nominations and Remunerations Committee (comité des nominations et des rémunérations) assists<br />
the Chairman and the Board of Directors with decisions concerning the composition of the Board of Directors<br />
and its remuneration, management remuneration policy, the allocation of stock subscription and purchase<br />
105
options and the organizational structure of management. The Committee also issues recommendations to the<br />
Board of Directors concerning the remuneration of senior management and the nomination of new directors<br />
and executive officers when appropriate. The Committee has responsibility for the periodic assessment of the<br />
Board of Directors. The Committee was previously named the Organization and Management Committee.<br />
The Committee normally meets twice a year in February and in December to review the remuneration of<br />
senior management and decide on the allocation of stock options, respectively. It may also be convened at<br />
other dates to discuss specific matters depending on the evolution of the composition of the Board of<br />
Directors or management. In 2003, the Nominations and Remunerations Committee met four times on<br />
February 28, April 25, and on May 20, to review the remuneration of our senior management, the structure of<br />
management as well as the appointment of a new director and on December 10 to issue recommendations to<br />
the Board of Directors in relation to the allocation of director’s fees for 2003, the granting of stock options<br />
and retirement plan arrangements for members of senior management above 55 years of age as at<br />
December 11, 2003. The member’s attendance rate was 97% in 2003. In 2004, the Committee met on<br />
February 23, to discuss the performance-based remuneration of senior management and retirement plan<br />
arrangements for members of senior management below 55 years of age and members of the executive<br />
committee. The following directors are currently members of the Nominations and Remunerations Committee:<br />
Michel Pébereau, Michael Blakenham and Alain Joly, who is the Chairman of the Committee.<br />
The Strategy and Investment Committee (comité stratégie et développement) examines in detail<br />
important strategic issues and major investment and divestment projects. The Strategy and Investment<br />
Committee meets usually twice a year during in May and September. It met twice in 2003 on May 20th, and<br />
September 3rd, and reviewed our performance as compared to our competitors, the rights issue that was<br />
subsequently decided by the Board of Directors on June 11, and our development strategy in our different<br />
activities. The following directors are currently members of the Strategy and Investment Committee: Michel<br />
Bon, Guilherme Frering, Alain Joly, Raphaël de <strong>Lafarge</strong>, Jacques Lefèvre, Robert W. Murdoch, and Michel<br />
Pébereau, who is the Chairman of the Committee.<br />
The Audit Committee (comité des comptes et des questions financières) performs a preliminary review of<br />
the semi-annual and annual financial statements, reviews accounting methods used to establish such financial<br />
statements and the scope of consolidated companies and performs an assessment of material liabilities, off<br />
balance sheet commitments and financial reporting. The Committee holds meetings with the statutory auditors<br />
and with general and financial management including the head of the internal audit department. Our<br />
management provides the Audit Committee with regular updates on our financial position, on the main thrust<br />
of current financial policy and advises the committee on the terms of major financial transactions prior to<br />
their completion. The Committee also receives copies of all earnings press releases prior to their issue. The<br />
Committee reviews the report prepared by the statutory auditors and can request to hear members of our<br />
internal audit department with such hearing taking place without the presence of our management, provided<br />
our Chairman so agrees. More generally, the Audit Committee may be consulted by our management in<br />
relation to various other issues. The Audit Committee was previously named the Finance Committee. It<br />
usually meets twice a year in February and in September. The Committee met four times in 2003 on<br />
February 26, and on September 3, to perform a preliminary review of our 2002 annual and 2003 semi-annual<br />
financial statements, respectively, and on May 19, to review certain financing aspects in relation to our<br />
development, and on December 2, to review internal controls and hear the head of our internal audit<br />
department in this respect. In 2003, the Audit Committee also established certain rules governing the<br />
engagement of auditors in accordance with U.S. regulations. See the section entitled ‘‘Principal Accountant<br />
Fees and Services’’ under Item 16. The member’s attendance rate was 95% in 2003. In February 2004, the<br />
Audit Committee performed a preliminary review of our financial statements for 2003 and held meetings with<br />
the statutory auditors, without the presence of our management, and with financial management. Since<br />
February 2004, the following directors are members of the Audit Committee: Michel Bon, Juan Gallardo,<br />
Patrice le Hodey, Jean Keller and Hélène Ploix, who is the Chairman of the Committee. These directors all<br />
satisfy the director independence requirements set by the Securities and Exchange Commission pursuant to<br />
Rule 10A-3.<br />
106
Corporate governance matters<br />
Our Board of Directors has spent a considerable period of time evaluating corporate governance issues<br />
and particularly those raised by the report of the working group set up by the French employers’ associations,<br />
the MEDEF and AFEP-AGREF, which was chaired by Daniel Bouton, President of Société Générale, and<br />
entitled ‘‘Promoting Better Corporate Governance In Listed Companies’’ and by the recently adopted changes<br />
to the New York Stock Exchange listing rules which adopted new corporate governance standards (which<br />
primarily apply to U.S. domestic issuers). As the Bouton report and NYSE listing standards highlight, the<br />
approach to corporate governance in France and the United States differs, and accordingly our approach to<br />
corporate governance differs in certain respects from those of U.S. domestic issuers listed on the NYSE.<br />
Our board has determined, following the approach recommended by the Bouton report, that a majority of<br />
its members qualify as ‘‘independent’’. However, definitions used for that determination may differ from those<br />
found in the NYSE rules. Our Board’s internal charter provides that non-management directors meet once a<br />
year to assess the performance of our senior management and discuss the same with the Nominations and<br />
Remuneration Committee.<br />
We have a Nomination and Remunerations Committee, whose functions are defined in our Board’s<br />
internal charter, a majority of the members of which we consider to be ‘‘independent’’ directors, in<br />
accordance with the recommendations of the Bouton report.<br />
We have an Audit Committee, whose functions and duties are defined in our Board’s internal charter.<br />
The Audit Committee is comprised of members who we consider to be ‘‘independent’’ directors and who<br />
meet the independence test for audit committee members established by the Securities and Exchange<br />
Commission, but who do not necessarily meet the definition of ‘‘independent’’ found in the NYSE rules. We<br />
consider Mrs. Hélène Ploix to satisfy the committee’s financial expert requirements under the Securities and<br />
Exchange Commission rules; however, we do not apply the definition of ‘‘expertise’’ found in the NYSE<br />
rules.<br />
Our Board approved a directors’ code of conduct that sets out certain standards that our directors must<br />
abide by in relation to qualification, conflicts of interest, training, insider trading and access to company<br />
information and to management. Our Board’s internal charter establishes the responsibilities of the Board and<br />
its committees and requires the Board to hold a meeting at least once a year to discuss its performance with<br />
the goal of improving its functioning efficiency. However neither the directors’ code of conduct, nor our<br />
Board’s internal charter necessarily meet the definition of ‘‘corporate governance guidelines’’ found in the<br />
NYSE rules.<br />
Directors’ fees<br />
Policy regarding directors’ fees<br />
The combined ordinary and extraordinary general meeting of May 28, 2001 established the maximum<br />
amount of directors fees to be paid in 2001 and in subsequent years at FRF 4 million (609,796 euros).<br />
Each of our directors is entitled to receive a fixed fee of 15,245 euros per year (increased by 25% for the<br />
chairmen of our committees). A director who is appointed or whose office terminates in the course of the<br />
year is entitled to 50% of the fixed fee.<br />
In 2003, an additional fee of 1,557 euros was payable to each director who attended a meeting of our<br />
Board of Directors or one of its committees.<br />
107
Fees paid<br />
The following table presents the fees paid to our directors in 2004 with respect to the 2003 fiscal year:<br />
Director<br />
Fees received in 2003<br />
(amounts in euros)<br />
Bertrand Collomb ;;;;;;;;;;;;;;;;;;;;;;;;;;;; 24,587<br />
Bernard Kasriel ;;;;;;;;;;;;;;;;;;;;;;;;;;;;; 24,587<br />
Jacques Lefèvre;;;;;;;;;;;;;;;;;;;;;;;;;;;;; 33,929<br />
Michael Blakenham ;;;;;;;;;;;;;;;;;;;;;;;;;;; 29,258<br />
Michel Bon ;;;;;;;;;;;;;;;;;;;;;;;;;;;;;; 33,929<br />
Guilherme Frering ;;;;;;;;;;;;;;;;;;;;;;;;;;;; 32,372<br />
Juan Gallardo;;;;;;;;;;;;;;;;;;;;;;;;;;;;;; 7,623<br />
Richard Haythornthwaite ;;;;;;;;;;;;;;;;;;;;;;;;; 12,294<br />
Patrice le Hodey ;;;;;;;;;;;;;;;;;;;;;;;;;;;; 32,372<br />
Bernard Isautier ;;;;;;;;;;;;;;;;;;;;;;;;;;;;; 29,258<br />
Alain Joly ;;;;;;;;;;;;;;;;;;;;;;;;;;;;;;; 37,741<br />
Jean Keller;;;;;;;;;;;;;;;;;;;;;;;;;;;;;;; 29,258<br />
Raphaël de <strong>Lafarge</strong> ;;;;;;;;;;;;;;;;;;;;;;;;;;; 30,815<br />
Robert W. Murdoch ;;;;;;;;;;;;;;;;;;;;;;;;;;; 32,372<br />
Michel Pébereau ;;;;;;;;;;;;;;;;;;;;;;;;;;;; 36,184<br />
Hélène Ploix ;;;;;;;;;;;;;;;;;;;;;;;;;;;;;; 30,815<br />
TOTAL 457,393<br />
In comparison, in 2003 we paid 457,364 euros in directors’ fees with respect to the 2002 fiscal year.<br />
Directors’ Share Ownership<br />
The following table presents share ownership information for each member of our Board of Directors at<br />
December 31, 2003:<br />
Director<br />
Number of shares held at<br />
December 31, 2003*<br />
Bertrand Collomb ;;;;;;;;;;;;;;;;;;;;;;;;;; 19,960<br />
Bernard Kasriel ;;;;;;;;;;;;;;;;;;;;;;;;;;; 16,762<br />
Jacques Lefèvre ;;;;;;;;;;;;;;;;;;;;;;;;;;; 6,358<br />
Michael Blakenham;;;;;;;;;;;;;;;;;;;;;;;;;; 1,806<br />
Michel Bon ;;;;;;;;;;;;;;;;;;;;;;;;;;;;; 3,425<br />
Guilherme Frering ;;;;;;;;;;;;;;;;;;;;;;;;;; 2,207<br />
Juan Gallardo ;;;;;;;;;;;;;;;;;;;;;;;;;;;; 1,500<br />
Patrice le Hodey ;;;;;;;;;;;;;;;;;;;;;;;;;;; 3,255<br />
Bernard Isautier ;;;;;;;;;;;;;;;;;;;;;;;;;;; 1,767<br />
Alain Joly;;;;;;;;;;;;;;;;;;;;;;;;;;;;;; 2,525<br />
Jean Keller ;;;;;;;;;;;;;;;;;;;;;;;;;;;;; 1,388<br />
Raphaël de <strong>Lafarge</strong> ;;;;;;;;;;;;;;;;;;;;;;;;;; 42,165<br />
Robert W. Murdoch;;;;;;;;;;;;;;;;;;;;;;;;;; 1,599<br />
Michel Pébereau ;;;;;;;;;;;;;;;;;;;;;;;;;;; 2,024<br />
Hélène Ploix ;;;;;;;;;;;;;;;;;;;;;;;;;;;; 1,827<br />
* Each director owns less than 0.03% of the 167,217,813 shares outstanding at December 31, 2003.<br />
Collectively our directors held approximately 0.03% of our share capital as at December 31, 2003 and<br />
0.04% of our voting rights.<br />
108
Senior management and executive officers<br />
French law governing a société anonyme, as amended on May 15, 2001, and our revised statuts, permit<br />
the Board of Directors to appoint up to five Chief Operating Officers proposed by the Chief Executive<br />
Officer. The Board of Directors, upon the recommendation by the Chief Executive Officer, determines the<br />
extent and the duration of the powers of the chief operating officers. Currently, Bernard Kasriel is our Chief<br />
Executive Officer and Michel Rose and Bruno Lafont are our Chief Operating Officers. Under French law, a<br />
Chief Operating Officer, like the Chief Executive Officer, has broad powers to represent and bind the<br />
company in dealing with third parties. A Chief Operating Officer may be removed by the Board of Directors<br />
at any time upon proposal of the Chief Executive Officer. A Chief Operating Officer may be held responsible<br />
individually for actions he takes that are contrary to the company’s interests.<br />
The table below shows, the names and ages of our executive officers and their responsibilities at <strong>Lafarge</strong><br />
in 2003.<br />
Name Age Position with <strong>Lafarge</strong><br />
Bertrand Collomb;;;; 61 Chairman<br />
Direction Générale<br />
Bernard Kasriel ;;;; 57 Chief Executive Officer*<br />
Michel Rose ;;;;;; 61 Chief Operating Officer*<br />
Bruno Lafont ;;;;; 47 Chief Operating Officer*<br />
Executive Committee<br />
Jean-Jacques Gauthier ;; 44 Executive Vice President and CFO<br />
Ulrich Glaunach ;;;; 47 Executive Vice President, Roofing<br />
Christian Herrault;;;; 53 Executive Vice President, Human Resources & Organization<br />
Charles de Liedekerke ;; 50 Executive Vice President, Aggregates & Concrete<br />
Isidoro Miranda ;;;; 45 Executive Vice President, Gypsum<br />
Other Senior Executives<br />
Jean Carlos Angulo ;;; 54 Executive Vice President, Regional President, Western Europe<br />
Yves de Clerck;;;;; 61 Executive Vice President, Regional President, Central Europe<br />
Miguel del Campo ;;; 62 Executive Vice President, Regional President, Latin America**<br />
Philippe Rollier ;;;; 61 Executive Vice President, Regional President, North America<br />
Jean-Marie Schmitz ;;; 60 Executive Vice President, Morocco<br />
* also members of the Executive Committee<br />
** until November 30, 2003<br />
The following is a brief biography of each of our executive officers:<br />
Bertrand Collomb, Chairman of the Board of Directors of <strong>Lafarge</strong>. Mr Collomb was appointed to the<br />
Board of Directors in 1987 and served as Chairman and Chief Executive Officer from 1989 to 2003. Prior to<br />
his appointment as Chairman and Chief Executive Officer, he held various executive positions within the<br />
group, namely in North America, from 1975 to 1989 and in the French Ministry of Industry and<br />
governmental cabinets from 1966 to 1975. He is also Chairman of <strong>Lafarge</strong> North America and a Company<br />
officer of several group subsidiaries. He is a Director of Total, Atco, Vivendi Universal, a member of the<br />
Allianz Supervisory Board, and a member of the Advisory Board of Unilever. He is a member of the French<br />
Institute (Academy of moral and political sciences), the President of the French Association of Private<br />
Companies (AFEP) and a board member of the World Economic Forum in Davos.<br />
Direction Générale<br />
Bernard Kasriel, Chief Executive Officer of <strong>Lafarge</strong> since 2003. He was appointed as director of <strong>Lafarge</strong><br />
in 1989. Prior to his current position, Mr. Kasriel was Vice Chairman since 1995 and Chief Operating Officer<br />
109
etween 1989 and 2003. He served as Senior Executive Vice President from 1982 to 1989, President and<br />
Chief Operating Officer of National Gypsum in Dallas, Texas, from 1987 to 1989 and held various executive<br />
position within the group since he joined <strong>Lafarge</strong> in 1977. From 1975 to 1977, he served as Senior Executive<br />
Vice President of the Société Phocéenne de Métallurgie, and from 1972 to 1974 he served as Chief Executive<br />
Officer of Braud. Mr. Kasriel began his career in 1970 at the Institut du Développement Industriel. He is Vice<br />
Chairman of <strong>Lafarge</strong> North America and holds various executive positions in the subsidiaries of <strong>Lafarge</strong>. He<br />
is a Director of Sonocco Products Company.<br />
Michel Rose, Chief Operating Officer since February 2002. He was named Senior Executive Vice<br />
President in 1989, served as Senior Executive Vice President in charge of emerging countries from 1996 to<br />
2002 and was President and Chief Executive Officer of <strong>Lafarge</strong> North America from 1992 to 1996. He has<br />
held various positions within the group, including Chairman and Chief Executive Officer of Orsan, which has<br />
since been divested, Executive Vice President in charge of Human Resources and Internal Communications<br />
and Chief Executive Officer of our activities in Brazil. He first joined <strong>Lafarge</strong> in 1970, as a plant engineer.<br />
Bruno Lafont, Chief Operating Officer since May 2003. He was named Executive Vice President in 1995<br />
and served as Executive Vice President, Gypsum, from October 1998 to May 2003 and Executive Vice<br />
President and CFO, from 1995 to 1998. Mr. Lafont previously served in a variety of financial and managerial<br />
positions with <strong>Lafarge</strong>, including in Turkey and the Eastern Mediterranean and with our German sanitary<br />
ware subsidiary, Allia. Mr. Lafont joined <strong>Lafarge</strong> in January 1983 as an internal auditor for the finance<br />
department.<br />
Executive Committee<br />
Jean-Jacques Gauthier, Executive Vice President and CFO, since March 2001. Prior to joining <strong>Lafarge</strong><br />
in March 2001, Mr. Gauthier had been serving as Executive Vice President, Finance since 2000 for the<br />
Astrium group, which resulted from the merger of Matra Marconi Space with the space activities of Daimler<br />
Benz. From 1996 to 2000, he served as Executive Vice President, Finance of Matra Marconi Space. Prior to<br />
this appointment, he held various financial positions both in France and the United States with the Matra<br />
group from 1986.<br />
Ulrich Glaunach, Executive Vice President, Roofing, and member of the executive committee since May<br />
2000. Prior to holding his current position, Mr. Glaunach was Chief Operating Officer of the Roofing division<br />
in charge of concrete tiles from July 1998 to May 2000, after holding the position of President and Chief<br />
Executive Officer of <strong>Lafarge</strong> Perlmooser, our Austrian subsidiary, from June 1995 to July 1998.<br />
Christian Herrault, Executive Vice President, Human Resources and Organization, since October 1998.<br />
Prior to holding his current position, Mr. Herrault was General Manager of the Aluminates and Admixtures<br />
business area from 1995. From 1985 until 1995, he assumed successive managerial responsibilities in our<br />
bioactivities sector. Prior to joining <strong>Lafarge</strong> in 1985, he occupied several positions in French Ministries.<br />
Charles de Liedekerke, Executive Vice President, Aggregates & Concrete, since October 1998. Prior to<br />
holding his current position, Mr. de Liedekerke was in charge of integrating our aggregates activities in the<br />
United Kingdom since early 1998. In 1992, he left <strong>Lafarge</strong> to take up a position as Chief Financial Officer of<br />
Bekaert, a Belgian group (of which he has been a director since 1988), and held this position until his return<br />
to <strong>Lafarge</strong> in 1998. From 1982, when he first joined <strong>Lafarge</strong>, until 1992, Mr. de Liedekerke held various<br />
managerial positions in our aggregates & concrete activities in France and North America.<br />
Isidoro Miranda, Executive Vice President, Gypsum since May 2003 and member of the executive<br />
committee since March 2001. Prior to holding his current position, Mr. Miranda served as Executive Vice<br />
President, Cement between March 2001 and May 2003. He previously served as Chief Executive Officer of<br />
<strong>Lafarge</strong> Asland, our cement subsidiary in Spain. He joined <strong>Lafarge</strong> in 1995 as group Director of Strategic<br />
Studies. Prior to this, he worked in London and in Paris in a strategic consulting firm.<br />
Other Senior Executive Officers<br />
Jean Carlos Angulo, Executive Vice President since September 2000 and Regional President of Western<br />
Europe since January 2001. From 1997 to 2000, he was Chief Executive Officer of <strong>Lafarge</strong> Ciments, our<br />
110
French cement subsidiary. Mr. Angulo joined <strong>Lafarge</strong> in 1975, and subsequently held various positions<br />
including Managing Director of our Brazilian operations between 1990 and 1996. He is a member of the<br />
board of Cimentos de Portugal.<br />
Yves de Clerck, Executive Vice President and Regional President of Central Europe since March 2001.<br />
From February 1997 to March 2001, Mr. De Clerck served as Executive Vice President in charge of the<br />
Cement division. Prior to this, he was Chief Executive Officer of <strong>Lafarge</strong> Ciments, our French cement<br />
subsidiary, from September 1988 to February 1997. From September 1983 until September 1988, he was<br />
responsible for social development at our headquarters.<br />
Miguel del Campo, Executive Vice President and Regional President of Latin America from March 2001<br />
to November 2003. Mr. Del Campo served as Executive Vice President, Finance between October 1998 and<br />
March 2001. From 1970, when he joined <strong>Lafarge</strong>, to 1998, he held various managerial positions, including<br />
President and Chief Executive Officer of Asland and Regional President, Western Mediterranean region<br />
(Spain, Portugal, Morocco and Tunisia).<br />
Philippe Rollier, Executive Vice President and Regional President of North America since May 2001. He<br />
is President and Chief Executive Officer of <strong>Lafarge</strong> North America. Prior to holding his current position,<br />
Mr. Rollier served as Executive Vice President in charge of Central Europe and CIS between January 1999<br />
and May 2001, before which he served as Regional President of Central Europe and CIS from January 1995<br />
to December 1998. From 1989 to 1994, he was President and Chief Executive Officer of Orsan, which has<br />
since been divested.<br />
Jean-Marie Schmitz, Executive Vice President and Chief Executive Officer of <strong>Lafarge</strong> Morocco since<br />
December 1998. He is Chief Executive Officer of <strong>Lafarge</strong> Maroc. Prior to holding his current position,<br />
Mr. Schmitz was Executive Vice President in charge of Human Resources and Communication and member<br />
of the executive committee from 1988 to September 1998. Prior to joining the group in 1978, he served as<br />
head of the cabinet of François Ceyrac, President of the CNPF (the French national employers’ union).<br />
Compensation of Executive Officers<br />
Remuneration of senior management<br />
Our Nominations and Remunerations Committee is responsible for recommending to our Board of<br />
Directors a remuneration policy for our Chairman, Chief Executive Officer and our Chief Operating Officers.<br />
The Nominations and Remunerations Committee, in establishing the remuneration policy, seeks guidance<br />
from outside consultants on the market practices of comparable companies.<br />
The remuneration is composed of a fixed portion and a performance-based portion, which may be up to<br />
80% of the fixed remuneration for our Chairman, 160% of the fixed remuneration of our Chief Executive<br />
Officer and 120% of the fixed remuneration for our Chief Operating Officers. All remuneration received by<br />
the officers with respect to the various offices they hold within our consolidated subsidiaries is imputed with<br />
respect to the fixed portion.<br />
Two-thirds of the performance related pay is established in light of the financial results of the group in<br />
comparison to the objectives established at the beginning of the year and for one third on the basis of<br />
individual performance over the course of the year.<br />
For 2003, the financial criteria used were the increase in economic value added, which reflects the return<br />
on capital employed, the relative performance of <strong>Lafarge</strong> as compared to its competitors, BCI integration<br />
synergies and the reduction of our group’s debt. The portion based on individual performance is determined<br />
in part by reference to the personal targets set at the beginning of the year with respect to the major tasks to<br />
be undertaken.<br />
111
In 2003, the outcome in relation to the increase in economic value added was poor. The performance of<br />
senior management was very good in relation to the reduction of group debt (before foreign exchange<br />
fluctuations and irrespective of the July 2003 rights issue) and BCI synergies and average as regards the<br />
relative performance of <strong>Lafarge</strong> as compared to its competitors. Taking into consideration the appointments<br />
and change of remunerations decided by the Board on May 20, 2003, the compensation we paid to our<br />
Chairman of the Board, Chief Executive Officer and to our Chief Operating Officers for the fiscal year 2003<br />
was the following:<br />
B. Collomb B. Kasriel M. Rose(3) B. Lafont(4)<br />
(in thousands of euros)<br />
Fixed remuneration paid in 2003(1) ;;;;; 875 662 437 370<br />
2003 Variable remuneration paid in 2004 ;;; 733 700 361 262<br />
2003 <strong>Lafarge</strong> S.A. directors’ fees paid in 2004 ; 24.6 24.6 N/A(2) N/A(2)<br />
Total 2003 ;;;;;;;;;;;;;;; 1,632.6 1,386.6 798 632<br />
Fixed remuneration paid in 2002(1) ;;;;; 875 500 400 N/A<br />
2002 Variable remuneration paid in 2003 ;;; 889 325 260 N/A<br />
2002 <strong>Lafarge</strong> S.A. directors’ fees paid in 2003 ; 24.6 24.6 N/A(2) N/A(2)<br />
Fixed remuneration paid in 2001(1) ;;;;; 854 488 N/A N/A<br />
2001 Variable remuneration paid in 2002 ;;; 512 244 N/A N/A<br />
2001 <strong>Lafarge</strong> S.A. directors’ fees paid in 2002 ; 26.9 26.9 N/A(2) N/A(2)<br />
(1) Including directors’ fees for directorships in our subsidiaries (but excluding directors’ fees for<br />
<strong>Lafarge</strong> S.A.).<br />
(2) Not a director.<br />
(3) Prior to 2002, Michel Rose was not a member of senior management and therefore we did not separately<br />
report his compensation.<br />
(4) Prior to 2003, Bruno Lafont was not a member of senior management and therefore we did not separately<br />
report his compensation.<br />
Global remuneration paid to executive officers in 2003<br />
The aggregate amount of compensation paid to our Chairman and other executive officers for the fiscal<br />
year 2003 (14 persons, one of whom left in 2003) for services in all capacities was approximately<br />
9.103 million euros. This amount:<br />
s includes the fixed share of executive officers’ salaries in 2003 as well as the bonuses paid in 2003 in<br />
respect of 2002;<br />
s includes a long-term bonus relating to the fiscal years 2000, 2001 and 2002 that was paid for the first<br />
time to our executive officers excluding our senior management;<br />
s concerns all those who were executive officers in 2002, for the time during that year during which<br />
they were executive officers.<br />
s does not include the directors’ fees paid by <strong>Lafarge</strong> S.A. to the two members of senior management<br />
who are also board members (see the subsection entitled ‘‘Directors’ Fees’’)<br />
This compares to the aggregate amount of compensation paid to our Chairman and other executive<br />
officers for the fiscal year 2002 (14 persons) of approximately 7.4 million euros and for the fiscal year 2001<br />
(14 persons, including two appointed in 2001, and two who left <strong>Lafarge</strong> in 2001) of approximately 8.6 million<br />
euros.<br />
Pensions and other retirement benefits<br />
Prior to their appointment to senior management duties, our current members of senior management<br />
were all employed by the group as officers and as such were beneficiaries of a supplemental retirement plan<br />
that applies generally to officers of the group. Following their appointment to senior management duties in<br />
112
1987, 1989 and in 2002, as regards Bertrand Collomb, Bernard Kasriel, and Michel Rose, respectively, they<br />
have retained the benefit of such retirement plan, that provides for a guaranteed retirement pension amount<br />
subject to the following terms.<br />
In 2003, the Board of Directors, upon the proposal of the Nominations and Remunerations Committee,<br />
reviewed the benefits of senior management and decided to limit the retirement plan benefits for those<br />
members of senior management over 55 years of age at December 10, 2003, date of the meeting of the Board<br />
of Directors, by capping the guaranteed retirement pension amount between 1 and 1.2 times the average fixed<br />
remunerations in 2001, 2002 and 2003 (this new cap applies to Messrs. Bertrand Collomb, Bernard Kasriel<br />
and Michel Rose).<br />
As regards and members of senior management below 55 years of age at December 10, 2003 (being<br />
currently Mr. Bruno Lafont) and members of the Executive Committee, the Board of Directors has decided to<br />
set up a retirement plan that provides for a retirement pension amount equal to 40% of their last salary as<br />
regards their fixed remuneration and the average of their variable remuneration over their last three years of<br />
employment.<br />
In addition, the aggregate amount set aside or accrued to provide pension, retirement or similar benefits<br />
for persons who were executive officers at December 31, 2003, 13 persons in all, was approximately<br />
29.6 million euros at December 31, 2003.<br />
Stock options granted to executive officers<br />
The tables showing the number of subscription or purchase stock options held by our executive officers<br />
(13 persons) at December 31, 2003 are presented under a separate line item in the tables under the subsection<br />
entitled ‘‘Subscription and purchase stock options at December 31, 2003’’.<br />
In the financial year ended December 31, 2003, 12 of our executive officers were granted 345,000<br />
subscription stock options at an exercise price of 65.95 euros per share.<br />
113
Stock options granted to our senior management<br />
The following table sets forth the options granted to our senior management, Messrs. Collomb, Kasriel,<br />
Rose and Lafont, by all of our consolidated subsidiaries and all options exercised by them in 2003.<br />
Total number of shares<br />
covered/exercised Price<br />
Option Exercise<br />
Period Lapses<br />
Plan<br />
number<br />
Options Granted:<br />
B. Collomb:<br />
<strong>Lafarge</strong> ;;;;;;;;;;; 56,000 E65.95 12/10/2013 M13<br />
24,000* E65.95 12/10/2013 M13<br />
<strong>Lafarge</strong> North America ;;;;;<br />
B. Kasriel:<br />
20,000 $29.81 02/02/2013<br />
<strong>Lafarge</strong> ;;;;;;;;;;; 84,000 E65.95 12/10/2013 M13<br />
36,000* E65.95 12/10/2013 M13<br />
<strong>Lafarge</strong> North America ;;;;;<br />
M. Rose:<br />
15,000 $29.81 02/02/2013<br />
<strong>Lafarge</strong> ;;;;;;;;;;; 21,000 E65.95 12/10/2013 M13<br />
9,000* E65.95 12/10/2013 M13<br />
<strong>Lafarge</strong> North America ;;;;;<br />
B. Lafont:<br />
1,000 $29.81 02/02/2013<br />
<strong>Lafarge</strong> ;;;;;;;;;;; 17,500 E65.95 12/10/2013 M13<br />
7,500* E65.95 12/10/2013 M13<br />
<strong>Lafarge</strong> North America ;;;;;<br />
Options Exercised:<br />
B. Collomb:<br />
5,000 $29.81 02/02/2013<br />
<strong>Lafarge</strong> North America ;;;;;<br />
B. Kasriel:<br />
15,000 $24.13<br />
<strong>Lafarge</strong> ;;;;;;;;;;; 8,000 E45.80 M2<br />
* The exercise of these options is subject to the performance of our share price. See subsection entitled<br />
‘‘Stock Options’’ under ‘‘Employees’’ in this item 6.<br />
Options granted by us and our consolidated subsidiaries to each of Messrs. Collomb, Kasriel, Rose and<br />
Lafont outstanding as of December 31, 2003.<br />
Options exercisable as<br />
of December 31, 2003<br />
Options not exercisable as<br />
of December 31, 2003<br />
Total number of<br />
options held<br />
B. Collomb:<br />
<strong>Lafarge</strong> ;;;;;;;;;; 116,145 276,457* 392,602<br />
<strong>Lafarge</strong> North America ;;;; 105,000 50,000 155,000<br />
B. Kasriel:<br />
<strong>Lafarge</strong> ;;;;;;;;;; 41,391 218,230* 259,621<br />
<strong>Lafarge</strong> North America ;;;; 52,000 38,000 90,000<br />
M. Rose:<br />
<strong>Lafarge</strong> ;;;;;;;;;; 17,405 94,919* 112,324<br />
<strong>Lafarge</strong> North America ;;;; 5,000 0 5,000<br />
B. Lafont:<br />
<strong>Lafarge</strong> ;;;;;;;;;; 26,810 60,824* 87,634<br />
<strong>Lafarge</strong> North America ;;;; 0 5,000 5,000<br />
* Includes the options the exercise of which is subject to the performance of our share.<br />
114
Ten highest options grants to our employees other than our senior management and our directors<br />
The following table shows the ten highest option grants made by us and our consolidated subsidiaries to<br />
our employees, other than Messrs. Collomb, Kasriel, Rose and Lafont, and the ten highest option grantss.<br />
Total number of shares covered/exercised Weighted Average Price<br />
Options Granted:<br />
<strong>Lafarge</strong> ;;;;;;;;;;;;;; 112,000 E65.95<br />
<strong>Lafarge</strong> North America ;;;;;;;;<br />
Options Exercised:<br />
212,500 $29.81<br />
<strong>Lafarge</strong> ;;;;;;;;;;;;;; 22,328 E49.05<br />
<strong>Lafarge</strong> North America ;;;;;;;; 131,875 $23.78<br />
None of our directors and officers owns 1% or more of outstanding shares.<br />
In order to align more closely the interests of the members of our Executive Committee with those of<br />
our shareholders, our Board of Directors decided on December 10, 2003, upon the proposal of the<br />
Nominations and Remunerations Committee, to require all members of the Executive Committee to hold the<br />
equivalent of their fixed annual remuneration for value in <strong>Lafarge</strong> shares. In order to achieve that objective,<br />
each member of the Executive Committee must invest one third of the net theoretical after tax gain realized<br />
upon the exercise of his stock purchase or subscription options in <strong>Lafarge</strong> shares until he reaches that<br />
objective.<br />
Stock options held by our executive officers including our senior management in our consolidated<br />
subsidiaries<br />
Four of our executive officers hold 255,000 subscription options in <strong>Lafarge</strong> North America. Our<br />
executive officers including our senior management exercised 15,000 options in <strong>Lafarge</strong> North America in<br />
2003, at an average price of $24.13 per share.<br />
Employees<br />
The following tables set forth our number of employees at December 31, 2003, 2002 and 2001 by area<br />
of primary activity and our number of employees at December 31, 2003, 2002 and 2001 by geographical<br />
region:<br />
Employees by Division<br />
Year ended<br />
December 31, 2003<br />
% Var.<br />
2003/2002<br />
Year ended<br />
December 31, 2002<br />
% Var.<br />
2002/2001<br />
Year ended<br />
December 31, 2001<br />
Number % in % Number % in % Number %<br />
Cement ;;;;;;;;;;; 35,984 47.8 (4.1) 37,521 48.4 (10.3) 41,832 50.5<br />
Aggregates & Concrete ;;;; 20,547 27.3 (2.5) 21,069 27.2 (3.6) 21,852 26.4<br />
Roofing ;;;;;;;;;;; 11,901 15.8 (1.7) 12,106 15.6 (4.0) 12,620 15.2<br />
Gypsum;;;;;;;;;;; 5,530 7.3 4 5,319 6.9 7.6 4,944 6.0<br />
Specialty Products** ;;;;; 387 0.5 (7.2) 417 0.5 (49.8) 830 1.0<br />
Others* ;;;;;;;;;;; 988 1.3 (11.3) 1,114 1.4 36.9 814 1.0<br />
Total ;;;;;;;;;; 75,338 100.0 (2.8) 77,547 100.0 (6.4) 82,892 100.0<br />
* Including employees at our corporate office and in research and development.<br />
** Figures for the 2002 and 2003 fiscal years reflect only the unsold portion of our Specialty Products<br />
division.<br />
115
Employees by Geographical Zone<br />
Year ended<br />
December 31, 2003<br />
% Var.<br />
2003/2002<br />
Year ended<br />
December 31, 2002<br />
% Var.<br />
2002/2001<br />
Year ended<br />
December 31, 2001<br />
Number % in % Number % in % Number %<br />
Western Europe ;;;;;;; 24,814 32.9 (3.4) 25,676 33.1 (3.9) 26,730 32.2<br />
North America ;;;;;;;; 15,343 20.7 (1.5) 15,573 20.1 (5.3) 16,451 19.8<br />
Mediterranean Basin ;;;;; 3,873 5.1 (9.4) 4,277 5.5 (27.0) 5,859 7.1<br />
Central and Eastern Europe ;;;<br />
Sub-Saharan Africa and Indian<br />
8,616 11.4 (7.3) 9,301 12.0 11.9 8,315 10.0<br />
Ocean ;;;;;;;;;; 7,536 10.0 (1.3) 7,632 9.8 (23.3) 9,954 12.0<br />
Latin America ;;;;;;;; 4,398 5.8 (5.0) 4,626 6.0 (9.4) 5,105 6.2<br />
Asia/Pacific ;;;;;;;;; 10,758 14.3 2.8 10,463 13.5 (0.1) 10,479 12.6<br />
Total ;;;;;;;;;; 75,338 100.0 (2.8) 77,547 100.0 (6.4) 82,892 100.0<br />
Labor Policy<br />
A significant percentage of our non-managerial employees in Europe and the United States are members<br />
of labor unions. As required by French and European law, our management holds annual meetings with a<br />
delegation of French union representatives and a delegation of European establishments of the employees in<br />
order to respond to questions regarding our economic and employment situation. While we have experienced<br />
some strikes in the past five years, we have not experienced any strikes, walkouts or work stoppages which<br />
have had a material negative impact on our financial condition, results of operations or cash flows. We<br />
believe that we enjoy good relations with our employees.<br />
In accordance with the regulation (ordonnance) No. 86-1134 of October 21, 1986 concerning employee<br />
profit-sharing schemes, almost every one of our subsidiaries has, over the past few years, passed on renewed<br />
profit sharing agreements with their employees. Such arrangements allocate a portion of the profits to<br />
employees based partly on financial results and partly on specific performance criteria, such as cost reduction<br />
and quality of products or services provided to the customer. The employees’ share of the profits may be<br />
invested in the different mutual funds of the savings scheme of <strong>Lafarge</strong>. The employees’ share of the profits<br />
that is invested in the savings scheme of our company, as well as personal investments of French and foreign<br />
employees, benefit from an additional contribution by us.<br />
We believe that our organization in decentralized divisions encourages individual initiatives and<br />
participation in our development strategy, as well as good overall relationships with our employees. To these<br />
ends, we have strived to follow a policy of social responsibility in all of the countries where we operate.<br />
As a result of our presence in a large number of countries and our acquisition strategy, integration of our<br />
employees within one global enterprise is a key element of our human resource policy. Our intranet portal,<br />
numerous seminars and ‘‘Meet the Group’’ conferences are a part of this effort.<br />
Internally, in line with our social responsibility statement, we encourage employee participation and<br />
social dialogue. We are devoted to maintaining healthy and safe working conditions, particularly as we<br />
expand to developing markets. We have also developed apprenticeship and on-the-job training programs<br />
targeted toward young employees, as well as training by business lines for others. We consider our efforts in<br />
continuing education as a way to both enhance the personal experience and development of our employees<br />
and increase their skills and qualifications for our own benefit. In addition, in most of our subsidiaries,<br />
employees are given an interest in operational results through our profit-sharing programs.<br />
Employee Share Ownership<br />
Employee shareholding, through wide ranging reserved share offerings and stock option plans, is an<br />
important part of our strategy for motivating our employees. At December 31, 2003, more than 38,000 of our<br />
employees were shareholders of <strong>Lafarge</strong>. Following our <strong>Lafarge</strong> en action 2002 employee stock ownership<br />
program, our employee share ownership levels were raised to approximately 1.7% of our outstanding shares<br />
116
as at December 31, 2002 and then decreased to 1.4% as a result of the dilutive effect of our 2003 rights<br />
issue. Our long-term goal is to raise employee ownership to 3% of our outstanding shares.<br />
Employee Reserved Share Offerings<br />
On April 15, 2002, we launched <strong>Lafarge</strong> en action 2002, an employee stock ownership program reserved<br />
for our employees outside the United States and Canada and certain other countries. The <strong>Lafarge</strong> en action<br />
2002 program was adopted pursuant to the authorization given by our shareholders at the extraordinary<br />
general meeting held on May 28, 2001.<br />
Under <strong>Lafarge</strong> en action 2002, our eligible employees were able to subscribe for 1 to 110 shares, with<br />
every share from the eleventh purchased, giving the right to receive one option. The maximum number of<br />
shares offered directly under the program was 3,425,000 shares at a price of 81.84 euros per share (a 20%<br />
discount from the market price over the reference period of the twenty trading days prior to March 29, 2002).<br />
In accordance with French laws governing a Plan d’Epargne groupe (group Savings Scheme), except in<br />
certain specific circumstances, employees who subscribed for shares in the program will be required to hold<br />
them for at least five years. The price at which the options can be exercised was set at 108.15 per share on<br />
May 28, 2002 by reference to the price over the reference period of the twenty trading days preceding this<br />
date without any discount. The options will be exercisable from the fifth anniversary of the date they are<br />
granted and will expire on the tenth anniversary.<br />
We subsidized each of our eligible employees purchase of up to ten shares under the program. The<br />
amount of the subsidy depended on the gross national product of the country the employee in question was<br />
domiciled in for tax purposes. The subsidy was 30% in countries in which the gross national product was<br />
more than U.S.$10,000 and 60% in countries in which the gross national product was less than U.S.$10,000.<br />
We also agreed to provide, where legally permitted, to each eligible employee who requested it, an interest<br />
free loan to purchase shares in the program, repayable over 24 months. The associated capital increase was<br />
completed in June 2002.<br />
Stock Options<br />
Authorization information<br />
French law requires that an extraordinary shareholders’ meeting be convened for the shareholders to<br />
authorize the grant of stock options, with a two-thirds majority vote. The authorization includes, among other<br />
things, the number of issuable shares and the conditions of exercise price determination. The shareholders<br />
may delegate power to the Board of Directors to fix the terms and conditions of the plan to grant options.<br />
The authorization is given for a limited period of time.<br />
Allotment policy<br />
The allotment policy is recommended to the Board of Directors by the Nominations and Remunerations<br />
Committee comprised by Messrs. A. Joly, committee chairman, M. Pébereau and M. Blakenham. Stock<br />
options are allotted to the executive officers and senior management, as well as to middle management and<br />
other employees who have contributed significantly to our performance.<br />
Stock options are allotted at times decided by the Board of Directors. Generally, stock options are<br />
allotted once per year at the December meeting of the Board of Directors. The number of beneficiaries varies<br />
from year to year with wide allotments taking place every two years and more limited allotments every other<br />
year.<br />
Over the last two fiscal years, the average number of stock options allocated annually represented<br />
approximately 1,091,844 shares, or, on average, 0.65% of our outstanding shares. A total of 1,703 employees<br />
received options in 2001, 14,785 in 2002 and 1,731 in 2003. The significant increase in the number of<br />
beneficiaries in 2002 was due to the option grants under the <strong>Lafarge</strong> en action 2002 employee stock<br />
ownership program.<br />
117
A total of 6,866,077 allotted stock options had still to be exercised at the end of December 2003,<br />
representing approximately 4.11% of our outstanding shares. Executive Officers (13 persons in all) held<br />
18.58% of these options.<br />
The Board of Directors may allot either subscription or purchase stock options, depending on the nature<br />
of the shareholders’ authorization.<br />
Stock options characteristics<br />
All stock options are valid for a period of 10 years.<br />
The exercise price is set, without discount or reduction, at the average trading price for our shares during<br />
the twenty trading days preceding the date of allotment.<br />
Stock options may be exercised in whole or in part.<br />
Stock options exercise conditions<br />
Stock options allotted up to and including May 1995 may be exercised freely.<br />
In December 1995, the Board of Directors decided that all stock options granted from then on would not<br />
be exercisable for the first four years following the date of allotment. The Board of Directors nonetheless<br />
decided that options allotted under the <strong>Lafarge</strong> en action 95 employee stock ownership program (share<br />
offering reserved for employees under which employees could subscribe for 1 to 110 shares, with every share<br />
from the eleventh purchased, giving the right to receive one option) could be exercised from the date of<br />
allotment.<br />
In December 1997, the Board of Directors increased the period during which stock options cannot be<br />
exercised from four to five years for all options allotted from 1997 onwards.<br />
The Board of Directors also decided that stock options that were not yet exercisable could be<br />
nevertheless exercised upon retirement, early retirement or redundancy of the beneficiary or in the event of a<br />
takeover bid for <strong>Lafarge</strong> or its merger into another company.<br />
In December 2001, the Board of Directors reduced the period during which stock options cannot be<br />
exercised from five to four years for all options allotted from December 2001 onwards in conformity with the<br />
statutory requirements. Such period during which stock options cannot be exercised also applies to options<br />
allocated under the <strong>Lafarge</strong> en action 2002 employee stock ownership program (share offering reserved for<br />
employees under which employees could subscribe for 1 to 110 shares, with every share from the eleventh<br />
purchased one, giving right to receive one option).<br />
The Board of Directors decided on December 10, 2003 to subject the exercise of part of the stock<br />
options (up to 30%) granted in 2003 to our Chairman and to the members of the Executive committee to the<br />
performance of our share price.<br />
According to the terms of these stock options, part of the options granted to our Chairman and to the<br />
members of the Executive Committee can only be exercised if the trading price of our share has reached on<br />
average during a continuous period of 60 trading days, during the first four years after the date of grant, an<br />
amount equal to the issue price increased by 20% or, failing which, during the following two years an<br />
amount equal to the issue price increased by 30%.<br />
If our share fails to perform as stated above during the first four years after the date of grant or the<br />
following two years, these stock options would no longer be exercisable and would be cancelled accordingly.<br />
Loss or retention of stock options<br />
Stock options lapse if not exercised within the ten years following their date of allotment.<br />
Dismissal or resignation of the beneficiary for cause invalidates all outstanding options granted the<br />
beneficiary. Stock options can remain valid after the beneficiary has left employment with <strong>Lafarge</strong> with the<br />
118
approval of his or her employer, or, if applicable, in the event of the disposal of our subsidiary employing the<br />
beneficiary.<br />
Subscription and purchase stock options at December 31, 2003<br />
The table below shows the number and price of subscription or purchase stock options granted to our<br />
employees, including our executive officers (13 persons), at December 31, 2003. The number of stock options<br />
featured in this table have been readjusted since their allotment each time that we have entered into financial<br />
transactions which have had an effect on the value of the shares, such as certain increases in share capital or<br />
the issue of bonus shares, so as to maintain a constant total option value for each beneficiary. For more<br />
information about our share capital increases in 2003, see ‘‘Item 10. Additional Information — Description of<br />
Share Capital’’.<br />
The number of options granted to our employees and executive officers outstanding as at December 31,<br />
2003 is, therefore, not equal to the difference between the number outstanding on December 31, 2002 and the<br />
number exercised in 2003.<br />
Stock options granted from January 1, 1993 to December 18, 1996<br />
Plan nºN8 Plan nºN9 Plan nºM1 Plan nºM2 Plan nºM3(1) Plan nºM4<br />
Allotment authorized by the<br />
shareholders’ meeting of ; 06/15/1992 06/15/1992 05/22/1995 05/22/1995 05/22/1995 05/21/1996<br />
Date of allotment by the Board<br />
of Directors ;;;;;;; 12/15/1993 09/27/1994 05/22/1995 12/13/1995 12/13/1995 12/18/1996<br />
Type of options ;;;;;;<br />
Number of stock options<br />
subscription subscription subscription subscription subscription subscription<br />
initially granted ;;;;;<br />
including to executive<br />
252,100 269,550 27,200 593,840 331,060 71,400<br />
officers(2) ;;;;;;; 28,750 37,600 2,000 83,500 800 4,500<br />
Number of initial beneficiaries 722 772 52 1,039 8,368 127<br />
including executive officers(2) 9 10 2 11 8 3<br />
Available for exercise from ; 12/15/1993 09/27/1994 05/22/1995 12/13/1999 12/13/1999 12/18/2000<br />
Options exercise period lapses<br />
Number of options outstanding<br />
12/15/2003 09/27/2004 05/22/2005 12/13/2005 12/13/2005 12/18/2006<br />
at December 31, 2002(3) ; 73,844 128,580 16,002 362,756 170,363 54,651<br />
Number of options purchased<br />
or subscribed between<br />
January 1st, 2003 and<br />
June 18, 2003 ;;;;;;<br />
Number of options outstanding<br />
at June 18, 2003 before<br />
884 0 0 9,214 843 0<br />
readjustment ;;;;;; 72,960 128,580 16,002 353,542 169,520 54,651<br />
Number of options outstanding<br />
at June 18, 2003 after<br />
readjustment as at July 15,<br />
2003;;;;;;;;;;<br />
Number of options purchased<br />
or subscribed between<br />
July 15, 2003 and<br />
77,654 136,827 17,534 376,560 181,456 58,125<br />
December 31, 2003;;;;<br />
Number of options outstanding<br />
70,185 8,947 364 8,259 4,705 582<br />
at December 31, 2003 ;; 0 127,880 17,170 368,301 176,751 57,543<br />
Exercise price at December 31,<br />
2003 (after readjustment as<br />
at July 15, 2003);;;;; 47.97 48.62 44.20 43.10 43.10 42.57<br />
119
Stock options granted from December 19, 1996 to December 13, 2000<br />
Plan nºM5 Plan nºM6 Plan nºM7 Plan nºM8 Plan nºM9 Plan nºA1<br />
Allotment authorized by the<br />
shareholders’ meeting of ;;; 05/21/1997 05/21/1997 05/21/1997 05/21/1997 05/27/1999 05/27/1999<br />
Date of allotment by the Board of<br />
Directors ;;;;;;;;; 12/17/1997 12/17/1997 05/26/1998 12/10/1998 12/15/1999 12/13/2000<br />
Type of options ;;;;;;; subscription purchase subscription purchase subscription purchase<br />
Number of stock options initially<br />
granted ;;;;;;;;;; 346,650 402,550 122,775 98,450 918,200 461,900<br />
including to executive<br />
officers(2) ;;;;;;;; 10,000 144,500 0 9,000 146,000 93,000<br />
Number of initial beneficiaries ; 999 127 108 150 1,552 438<br />
including executive officers(2) 1 9 0 4 11 11<br />
Available for exercise from ;; 12/17/2002 12/17/2002 05/26/2003 12/10/2003 12/15/2004 12/13/2005<br />
Options exercise period lapses ; 12/17/2007 12/17/2007 05/26/2008 12/10/2008 12/15/2009 12/13/2010<br />
Number of options outstanding at<br />
December 31, 2002(3);;;; 357,050 422,207 126,508 103,543 984,008 469,623<br />
Number of options purchased or<br />
subscribed between January 1st,<br />
2003 and June 18, 2003 ;;; 1,591 0 0 0 0 0<br />
Number of options outstanding at<br />
June 18, 2003 before<br />
readjustment 355,459 422,207 126,508 103,543 984,008 469,623<br />
Number of options outstanding at<br />
June 18, 2003 after<br />
readjustment as at July 15,<br />
2003 ;;;;;;;;;;; 378,108 448,768 134,484 110,119 1,046,514 499,285<br />
Number of options purchased or<br />
subscribed between July 15,<br />
2003 and December 31, 2003 ; 9,239 12,630 0 0 0 0<br />
Number of options outstanding at<br />
December 31, 2003 ;;;;; 368,869 436,138 134,484 110,119 1,046,514 499,285<br />
Exercise price at December 31,<br />
2003 (after readjustment as at<br />
July 15, 2003) ;;;;;;; 50.19 50.19 74.72 74.18 82.70 79.74<br />
120
Stock options granted from December 14, 2000 to December 10, 2003<br />
Plan nºA2 Plan nºM10 Plan nºM11 (4) Plan nºM12 Plan nºM13<br />
Allotment authorized by the shareholders’ meeting of 05/27/1999 05/28/2001 05/28/2001 05/28/2001 05/20/2003<br />
Date of allotment by the Board of Directors ;;;; 05/28/2001 12/13/2001 05/28/2002 12/11/2002 12/10/2003<br />
Type of options ;;;;;;;;;;;;;;; purchase subscription subscription subscription subscription<br />
Number of stock options initially granted ;;;;; 12,000 1,188,825 437,373 472,390 1,273,925<br />
including to executive officers (2) ;;;;;; 12,000 277,000 1,100 98,000 345,000<br />
Number of initial beneficiaries ;;;;;;;;; 1 1,703 14,364 421 1,731<br />
including executive officers(2) ;;;;;;; 1 13 11 11 12<br />
Available for exercise from ;;;;;;;;;; 05/28/2006 12/13/2005 05/28/2006 12/11/2006 12/10/2007<br />
Options exercise period lapses ;;;;;;;;; 05/28/2011 12/13/2011 05/28/2012 12/11/2012 12/10/2013<br />
Number of options outstanding at December 31,<br />
2002(3) ;;;;;;;;;;;;;;;;; 12,000 1,188,825 437,373 472,390 1,273,925<br />
Number of options purchased or subscribed between<br />
January 1st, 2003 and June 18, 2003;;;;;; — — — — —<br />
Number of options outstanding at June 18, 2003<br />
before readjustment;;;;;;;;;;;;; 12,000 1,188,825 437,373 472,390 —<br />
Number of options outstanding at June 18, 2003 after<br />
readjustment as at July 15, 2003 ;;;;;;; 12,754 1,264,338 472,985 499,021 —<br />
Number of options purchased or subscribed between<br />
July 15, 2003 and December 31, 2003 ;;;;; — — — — —<br />
Number of options outstanding at December 31, 2003 12,754 1,264,338 472,985 499,021 1,273,925<br />
Exercise price at December 31, 2003 (after<br />
readjustment as at July 15, 2003)(5) ;;;;;; 102.12 96.16 101.79 74.48 65.95<br />
(1) <strong>Lafarge</strong> en action 1995 employee stock ownership plan.<br />
(2) Including senior management (see the subsection entitled ‘‘Senior Management and Executive Officers’’).<br />
(3) after readjustments due to financial transactions in 2003.<br />
(4) <strong>Lafarge</strong> en action 2002 employee stock ownership plan.<br />
(5) The readjustment of the exercise price was only carried out in relation to options granted prior to July 15,<br />
2003.<br />
Our Board of Directors has not granted any further options since December 10, 2003.<br />
121
ITEM 7. MAJOR SHAREHOLDERS AND RELATED PARTY TRANSACTIONS<br />
Major Shareholders<br />
The following table sets out to the best of our knowledge the principal holders of <strong>Lafarge</strong>’s share capital<br />
at December 31, 2003 as well as the percentage ownership over the past three years:<br />
Group of Shareholders<br />
Number of<br />
Shares Held<br />
At December 31, 2003<br />
Number of<br />
Votes Held<br />
% of Total<br />
Issued Shares<br />
% of Total<br />
Voting Rights<br />
At December<br />
31, 2002<br />
% of Total<br />
Issued Shares<br />
At December<br />
31, 2001<br />
% of Total<br />
Issued Shares<br />
Private individuals ;;;;; 21,754,688 27,287,400 13.0% 15.5% 13.1% 14.8%<br />
Resident institutional investors<br />
(France) ;;;;;;;; 57,438,236 60,862,390 34.4% 34.5% 30.6% 25.3%<br />
Non-resident institutional<br />
investors (outside France) ; 86,168,623 88,007,054 51.5% 50.0% 54.9% 58.5%<br />
Treasury shares*;;;;;; 1,856,266 0 1.1% 0.0% 1.4% 1.4%<br />
Total ;;;;;;;; 167,217,813 176,156,844 100.0% 100.0% 100.0% 100.0%<br />
* At December 31, 2003, we held directly in treasury 1,058,296 shares purchased pursuant to prior<br />
authorizations from our shareholders. Under French law, these shares are considered outstanding but have<br />
no voting rights.<br />
For share ownership information for members of the Board of Directors, see ‘‘Item 6. Directors, Senior<br />
Management and Employees — Share Ownership’’.<br />
To our knowledge, at December 31, 2003, no individual or entity or group of individuals or entities<br />
acting together in concert held more than 5% of the outstanding shares or total voting rights. To our<br />
knowledge however, 12 institutional shareholders held more than 1% of our outstanding shares at<br />
December 31, 2003, 1% being the threshold for the notification requirement set out in our statuts, see the<br />
subsection entitled ‘‘Required Holdings Exceeding Certain Percentages’’. Of these institutional shareholders, 8<br />
of them held between 1% and 2% of our shares, one of them held between 2% and 3% of our shares, one of<br />
them held between 3% and 4% of our shares and two of them held between 4% and 5% of our shares.<br />
All of our shares bear the same conditions as to voting rights, except for our treasury shares, which bear<br />
no voting rights and except for shares held in registered form for over two years which have double voting<br />
rights (see ‘‘Item 10. Additional Information — Shareholders’ Meetings and Voting Rights — Attendance and<br />
Voting at Shareholders’ Meetings’’).<br />
To our knowledge, we are not directly or indirectly owned or controlled by another corporation, any<br />
government or any other natural or legal person severally or jointly. There is no arrangement known to us the<br />
operation of which may at any subsequent date result in a change in control of <strong>Lafarge</strong>.<br />
To our knowledge, at December 31, 2003, (i) the portion of our outstanding shares held in the United<br />
States was approximately 2.7%, (ii) the number of record holders of our shares in the United States was 12<br />
and (iii) the number of our ADRs outstanding was 19,154,224.<br />
Potential Shares — Dilution<br />
At December 31, 2003, the number of our outstanding shares could be increased by up to 16,576,285<br />
new shares as a consequence of:<br />
s The exercise of subscription stock options granted to our employees. At December 31, 2003, the<br />
maximum number of shares issuable under currently exercisable subscription options was 1,250,998<br />
shares. In addition, there were subscription options covering 4,556,783 shares that were issued after<br />
1998 and not currently exercisable (see ‘‘ Item 6. Directors, Senior Management And Employees —<br />
Share Ownership — Stock Options’’).<br />
122
s The exercise of the conversion rights attached to the OCEANE bonds issued in June 2001. The<br />
maximum number of shares issuable under the OCEANE bonds is 10,768,504 shares. Pursuant to the<br />
terms of the OCEANE bonds, upon a bondholder’s exercise of his conversion right, we have the<br />
option of converting the bond into new shares or exchanging the bonds for existing treasury shares.<br />
At December 31, 2003, there were no other securities convertible, redeemable or otherwise exchangeable<br />
in newly issued shares.<br />
Related Party Transactions<br />
Agreements between <strong>Lafarge</strong> and one of our directors, the Chairman of the Board and Chief Executive<br />
Officer or the Vice Chairman of the Board and Chief Operating Officer or a company in which our directors<br />
or these executive officers hold directorships or senior executive positions are, pursuant to the applicable laws<br />
and regulations in force, subject to the prior approval of the Board of Directors and then, on a special report<br />
from the statutory auditors, to the approval of the ordinary shareholders’ meeting. The director or executive<br />
officer concerned is required to inform the Board of all agreements covered by the law. The recent French<br />
law nº2003-706 of August 1, 2003 (the ‘‘LSF’’) extended the definition of related party transactions<br />
agreements between <strong>Lafarge</strong> and a shareholder holding more than 10% of the voting rights or, if such<br />
shareholder is a corporation, with the corporation controlling such shareholder.<br />
These procedures do not apply to agreements concerning the day-to-day business of the company entered<br />
into in the ordinary course of business and with terms and conditions that are not out of the ordinary course.<br />
However, French law requires that such agreements, as long as they are material to the company, must be<br />
provided by any interested party to the Chairman of our Board and that the Chairman of the Board provide a<br />
list of such agreements and the purpose of each to the directors and to the statutory auditors.<br />
The Board of Directors, during its September 3, 2001 meeting, authorized:<br />
— an option agreement with our majority owned North American subsidiary, <strong>Lafarge</strong> North America,<br />
to purchase the Blue Circle North American assets remaining after the dispositions required by the<br />
anti-trust authorities anytime between July 1, 2002 and December 31, 2004 at a fixed call price of<br />
$1.4 billion, subject to certain adjustments at the time of the exercise, and<br />
— a management agreement with <strong>Lafarge</strong> North America with respect to Blue Circle’s assets in North<br />
America which expires on December 31, 2002 and is renewable for one-year periods thereafter.(*)<br />
The agreement provides that <strong>Lafarge</strong> North America will manage the Blue Circle assets for a fixed<br />
annual management fee plus incentives for improving operating results and that we are required to<br />
indemnify <strong>Lafarge</strong> North America and its employees for any third party proceedings arising out of<br />
the management agreement or the underlying Blue Circle assets.<br />
(*) This agreement was renewed for 2004.<br />
On June 11, 2003, the Board of Directors authorized, in relation to a rights issue of up to 1.28 billion<br />
euros (approximately $1.61 billion), an underwriting agreement with a syndicate of banks including BNP-<br />
Paribas.<br />
Our director, Mr. Pébereau, is chairman of BNP-Paribas, and our directors, Mrs. Ploix and Mr. Joly, are<br />
directors of BNP-Paribas. We have had and we will continue to have business relationships with BNP-<br />
Paribas, including for the conclusion of financings, credit facilities and agreements relating to securities<br />
offerings. These agreements were and will be, when applicable, approved by our Board of Directors and<br />
communicated to our auditors and our shareholders in compliance with French law on related party<br />
transactions.<br />
In addition, we have entered into several agreements with Materis Holding Luxembourg, the holding<br />
company that currently owns the businesses of our former Specialty Products division and of which we own<br />
7.27%. These agreements relate principally to the use of certain brand names and trademarks, to our<br />
collaboration in the fields of research and development and purchasing and to the leasing of certain facilities.<br />
An amount of 20 million euros for the trademark license was paid by Materis Holding Luxembourg to us up<br />
123
front at the time of the sale of our stake in Materis Participations to LBO France (see ‘‘Item 4. Information<br />
on the Company — Other Operations’’).<br />
We have entered into a mutual technical cooperation agreement with Cimentos de Portugal SGPS, S.A.<br />
(Cimpor), in which we hold a 12.6% interest, in the field of industrial performance, namely productivity,<br />
safety and environmental protection. The agreement was entered into on July 12, 2002 with an initial term<br />
expiring on December 31, 2004. The agreement is renewable for one-year periods thereafter. The first stage<br />
of the implementation of the agreement was the identification by us of areas of industrial improvements for<br />
Cimpor and was completed on March 31, 2003. A fee of 750,000 euros was paid to us by Cimpor upon<br />
completion of this first stage in 2003. The second stage relating to the optimization of industrial performance<br />
was initiated in September 2003 and involved technical work performed by us regarding the equipment of<br />
certain Cimpor plants to use alternative fuels. We received another fee of 1 million euros from Cimpor for<br />
such work performed in 2003. We currently have one common director with Cimpor who is Mr. Jacques<br />
Lefèvre. One of our executive officers, Jean-Carlos Angulo, also serves on the Board of Cimpor.<br />
Between April and November 2002, we also sold the 33% equity interest we previously held in Natal<br />
Portland Cement (South Africa) as well as certain cement assets located in Brazil and in Southern Spain to<br />
Cimpor for a total of approximately 324 million euros. These transactions were more specifically described in<br />
our report on form 20-F as filed with the Securities and Exchange Commission on April 25, 2003.<br />
In May 2003, we entered into a joint venture agreement with Cementos Molins, in which we hold a<br />
40.9% interest, to build a new cement plant in Chhatak, Bangladesh and subsequently announced the sale of<br />
our stake in Cementos Molins pursuant to a limited tender offer that the company will launch for its own<br />
shares. See ‘‘Item 4. Information on the Company — Recent Developments’’ for more details on these<br />
transactions.<br />
ITEM 8. FINANCIAL INFORMATION<br />
Consolidated Statements and Other Financial Information<br />
See ‘‘Item 18. Financial Statements’’ for a list of financial statements filed with this registration<br />
statement.<br />
Legal Proceedings<br />
See ‘‘Item 4. Information on the Company — Litigation’’.<br />
Dividends Policy<br />
We have no stated dividend policy. For historical information with respect to our dividend distributions,<br />
see ‘‘Item 3. Key Information — Selected Financial Data’’.<br />
Significant Changes<br />
See ‘‘Item 4. Information on the Company — Recent Developments’’ and ‘‘Item 5. Operating and<br />
Financial Review and Prospects — Recent Developments’’.<br />
124
ITEM 9. THE LISTING<br />
Listing Details<br />
The primary market for trading in our shares is Euronext (Paris). Our shares are included in the CAC40<br />
index the SBF 250 100 index and the Dow Jones Eurostoxx 50 index. Our shares have traded on the New<br />
York Stock Exchange in the form of American Depositary Shares, or ADSs under the symbol ‘‘LR’’ since<br />
July 23, 2001. Each ADS represents one-fourth of one share. The ADSs are evidenced by American<br />
Depositary Receipts, or ADRs, which are issued by Morgan Guaranty Trust Company of New York, as<br />
Depositary, under a Deposit Agreement dated at July 18, 2001, among us, the Depositary and the registered<br />
holders of the ADRs from time to time. On December 8, 2003 we announced our decision to delist our shares<br />
from the London, Frankfurt and Düsseldorf stock exchanges due to the limited trading volumes on these<br />
exchanges. Our shares were delisted from the London Stock Exchange on January 9, 2004, and we expect the<br />
delisting of our shares from the Frankfurt and Düsseldorf stock exchanges to be effective on April 9, 2004.<br />
The following tables set forth the volume and high and low last sales prices of our shares of common<br />
stock as reported on Euronext Paris S.A.:<br />
Trading Prices for our shares of common stock on Euronext Paris S.A. for the five most recent full<br />
financial years.<br />
High Low High Low<br />
Average Daily<br />
Volume<br />
Average Monthly<br />
Volume<br />
(euros) (FRF) (in shares) (in millions of shares)<br />
1999(1);;;;; 115.60 70.10 758.29 459.83 368,218 7.82<br />
2000 ;;;;;; 118.40 73.75 776.65 483.77 521,670 11.00<br />
2001 ;;;;;; 114.00 74.00 747.79 485.41 667,518 14.05<br />
2002 ;;;;;; 111.20 67.00 729.42 439.49 772,173 16.40<br />
2003 ;;;;;; 76.25 43.26 500.17 283.77 1,175,809 24.99<br />
Source: Euronext<br />
(1) Prior to January 4, 2000, our shares were traded in FRF on the Paris Bourse. We have translated stock<br />
prices prior to this date for convenience by applying the fixed exchange rate of FRF 6.55957 per<br />
1.00 euro.<br />
Trading Prices for our shares of common stock on Euronext Paris S.A. for each full financial quarter<br />
for the two most recent full financial years.<br />
High Low<br />
Average Daily<br />
Volume<br />
Average Monthly<br />
Volume<br />
(euros) (in shares) (in millions of shares)<br />
2002 1st quarter ;;;;;;;;;;; 107.00 96.85 552,430 11.42<br />
2nd quarter ;;;;;;;;;; 111.20 97.50 764,000 16.04<br />
3rd quarter ;;;;;;;;;; 102.80 74.00 693,541 15.26<br />
4th quarter;;;;;;;;;;; 84.50 67.00 880,454 18.78<br />
2003 1st quarter ;;;;;;;;;;; 76.25 43.26 1,026,549 21.56<br />
2nd quarter ;;;;;;;;;; 64.80 49.26 1,517,404 31.36<br />
3rd quarter ;;;;;;;;;; 65.70 50.50 1,211,254 26.64<br />
4th quarter;;;;;;;;;;; 70.90 54.95 955,265 20.38<br />
Source: Euronext<br />
125
Trading Prices for our shares of common stock on Euronext Paris S.A. for each month for the most<br />
recent six months.<br />
High Low<br />
Average Daily<br />
Volume<br />
Actual Monthly<br />
Volume<br />
(euros) (in shares) (in millions of shares)<br />
2003 September ;;;;;;;;;;; 65.70 54.90 1,106,800 24.35<br />
October ;;;;;;;;;;;; 62.45 54.95 876,900 20.17<br />
November ;;;;;;;;;;; 68.90 60.60 1,158,300 23.17<br />
December ;;;;;;;;;;; 70.90 66.05 847,600 17.80<br />
2004 January ;;;;;;;;;;;; 71.90 65.40 1,071,800 22.51<br />
February ;;;;;;;;;;;; 69.60 65.00 946,600 18.93<br />
Source: Euronext<br />
The following tables set forth the volume and high and low last sales prices of our shares of American<br />
Depositary Shares as reported on the New York Stock Exchange.<br />
Trading Prices for our American Depositary Shares on the New York Stock Exchange for each full<br />
financial quarter for the two most recent full financial years.<br />
High Low<br />
Average Daily<br />
Volume<br />
Average Monthly<br />
Volume<br />
(dollars) (in ADSs(1)) (in ADSs(1))<br />
2002 1st quarter ;;;;;;;;;;;;; 24.20 21.05 4,848 96,967<br />
2nd quarter ;;;;;;;;;;;; 25.92 21.90 4,198 89,567<br />
3rd quarter ;;;;;;;;;;;; 25.55 19.91 5,484 117,000<br />
4th quarter;;;;;;;;;;;;; 21.00 16.80 11,183 238,567<br />
2003 1st quarter ;;;;;;;;;;;;; 20.05 12.10 13,400 272,467<br />
2nd quarter ;;;;;;;;;;;; 18.82 13.60 22,495 472,400<br />
3rd quarter ;;;;;;;;;;;; 18.02 15.50 21,313 454,667<br />
4th quarter;;;;;;;;;;;;; 22.45 16.29 23,778 507,267<br />
Source: NYSE<br />
(1) Each ADS represents one-fourth of one share.<br />
Trading Prices for our American Depositary Shares on the New York Stock Exchange for each month<br />
for the most recent six months.<br />
High Low<br />
Average Daily<br />
Volume Monthly Volume<br />
(dollars) (in ADSs(1)) (in ADSs(1))<br />
2003 September ;;;;;;;;;;;;; 18.02 16.16 13,319 279,700<br />
October ;;;;;;;;;;;;;; 18.10 16.29 15,617 359,200<br />
November ;;;;;;;;;;;;; 20.25 17.51 31,500 598,500<br />
December ;;;;;;;;;;;;; 22.45 20.22 25,641 564,100<br />
2004 January ;;;;;;;;;;;;;; 22.75 20.38 30,275 605,500<br />
February;;;;;;;;;;;;;; 22.10 20.32 26,489 503,300<br />
Source: NYSE<br />
(1) Each ADS represents one-fourth of one share.<br />
126
Markets<br />
Our shares of common stock have been listed on the Premier Marché of Euronext Paris S.A. (‘‘Euronext<br />
Paris’’) since July 4, 1923 (Code ISIN: FR000120537). <strong>Lafarge</strong> has been included in the SBF 250 index since<br />
its creation in December 1990, in the CAC 40 index since its creation in December 31, 1987 and in the Dow<br />
Jones Eurostoxx 50 index since September 2002. The SBF 250 is an index of shares of 250 companies<br />
selected by Euronext Paris as the most representative of the French equities listed on Euronext Paris from<br />
twelve economic sectors. The CAC 40 index is an index of shares of the 40 largest companies traded on<br />
Euronext Paris in terms of market capitalization. The Dow Jones Eurostoxx 50 index is an index of shares of<br />
market sector leading companies in the European Euro zone (covers Austria, Belgium, Finland, France,<br />
Germany, Greece, Ireland, Italy, Luxembourg, the Netherlands, Portugal and Spain).<br />
On September 22, 2000, upon successful completion of an exchange offer, the Société des Bourses<br />
Françaises (known as Paris Bourse SBF S.A.), the Amsterdam Stock Exchange and the Brussels Stock<br />
Exchange merged to create Euronext N.V., a Dutch holding company and the first pan-European stock<br />
exchange. Subsequently, Paris Bourse SBF S.A. changed its name to Euronext Paris. Securities quoted on any<br />
of the stock exchanges participating in Euronext are traded and cleared through common Euronext platforms:<br />
NSC is the common platform for trading and Clearing 21 for clearing; LIFFE CONNECTÔ, the LIFFE<br />
trading platform is already used for some Euronext futures and options trading. Euronext Paris anticipates the<br />
implementation of a central clearinghouse of settlement and custody structures. However, these securities will<br />
remain listed on their respective local exchanges. Euronext Paris retains responsibility for the admission of<br />
securities to Euronext Paris’ trading markets, as well as the regulation of these markets.<br />
Euronext N.V. is listed on the Premier Marché of Euronext Paris since July 2001. In January 2002,<br />
Euronext N.V. acquired the London International Financial Futures and Options Exchange (LIFFE), London’s<br />
derivative market. The combination of the LIFFE and Euronext N.V. will enable, amongst other things, the<br />
volumes of derivatives business conducted through LIFFE CONNECTÔ to treble. Since February 6, 2002,<br />
Bolsa de Valores de Lisboa e Porto (BVLP) has become a wholly owned subsidiary of Euronext N.V. and<br />
therefore renamed Euronext Lisbon.<br />
Securities approved for listing by Euronext Paris are traded in one of three regulated markets, the<br />
Premier Marché, the Second Marché and the Nouveau Marché. These markets are all operated and managed<br />
by Euronext Paris, a market enterprise (entreprise de marché) responsible for the admission of securities and<br />
the supervision of trading in listed securities. Euronext Paris publishes a daily official price list that includes<br />
price information on listed securities. The securities of most large public companies are listed on the Premier<br />
Marché, with the Second Marché available for small and medium-sized companies. Trading on the Nouveau<br />
Marché was introduced in March 1996 to allow small capitalization and start-up companies to access the<br />
stock market. In addition, securities of certain other companies are traded on a non-regulated, over-thecounter<br />
market, the Marché Libre OTC.<br />
Premier Marché<br />
Securities listed on the Premier Marché of Euronext Paris are officially traded through authorized<br />
financial institutions that are members of the Paris Stock Exchange. Securities are traded continuously on<br />
each business day from 9:00 a.m. to 5:25 p.m. (Paris time), with a pre-opening session from 7:15 a.m. to<br />
9:00 a.m. and, for some securities, a pre-closing session from 5:25 p.m. to 5:30 p.m. during which<br />
transactions are recorded but not executed, a closing auction at 5:30 p.m. and a ‘‘trading at loss’’ from<br />
5:30 p.m. to 5:40 p.m. Any trade of a security that occurs after a stock exchange session closes is recorded<br />
on the next Euronext Paris trading day at the previous session’s closing price for that security. Euronext Paris<br />
has introduced continuous electronic trading during trading hours for most actively listed securities.<br />
Euronext Paris places securities listed on the Premier Marché in one of the two categories, Continu or<br />
Fixing, depending on their trading volume. Our shares are placed in the category known as Continu, which<br />
includes the most actively traded securities. The minimum yearly trading volume required for a security<br />
already listed on a regulated market of Euronext Paris to be in Continu is 2,500 trades, i.e., 10 trades per<br />
business day.<br />
127
Euronext Paris may temporarily reserve trading in a security listed in Continu on the Premier Marché if<br />
purchases and sales recorded in the system would inevitably result in a price beyond a certain threshold,<br />
determined on a basis of a percentage fluctuation from a reference base. The duration of the so-called<br />
reservation period and the relevant thresholds vary depending on whether the price fluctuation occurs when<br />
trading commences or during the trading session. Euronext Paris may display an indicative trading price<br />
during such reservation period. Euronext Paris also may suspend trading of a security listed on the Premier<br />
Marché in other limited circumstances, including, for example, where there is unusual trading activity in the<br />
security. In addition, in exceptional cases, the Autorité des Marchés Financiers may also request a suspension<br />
in trading.<br />
Trades of securities listed on the Premier Marché are settled on a cash basis on the third trading day<br />
following the trade. Market intermediaries are also permitted to offer investors a deferred settlement service<br />
(ordre stipulé àrèglement différé) for a fee. The deferred settlement service is only available for trades in<br />
securities that have both a total market capitalization of at least 1 billion euros and a daily average volume of<br />
trades of at least 1 million euros. Our shares are eligible for the deferred settlement service. Investors can<br />
elect on the determination date (date de liquidation), which is the fifth trading day before the end of the<br />
month, either to settle by the last trading day of the month or to pay an additional fee and postpone the<br />
settlement decision to the determination date of the following month.<br />
Equity securities traded on a deferred settlement basis are considered to have been transferred only after<br />
they have been registered in the purchaser’s account. Under French securities regulations, any sale of a<br />
security traded on a deferred settlement basis during the month of a dividend payment date is deemed to<br />
occur after the dividend has been paid. If the sale takes place before, but during the month of, a dividend<br />
payment date, the purchaser’s account will be credited with an amount equal to the dividend paid and the<br />
seller’s account will be debited by the same amount.<br />
Prior to any transfer of securities held in registered form on the Premier Marché, the securities must be<br />
converted into bearer form and accordingly placed in an account maintained by an accredited intermediary<br />
with Euroclear France S.A., a registered clearing agency. Transactions in securities are initiated by the owner<br />
giving instructions (through an agent, if appropriate) to the relevant accredited intermediary. Trades of<br />
securities listed on the Premier Marché are cleared through Clearing 21 and settled through Euroclear France<br />
S.A. using a continuous net settlement system. A fee or a commission is payable to the broker-dealer or other<br />
agent involved the transaction.<br />
ITEM 10. ADDITIONAL INFORMATION<br />
Description of Share Capital<br />
Not Applicable<br />
By-laws (statuts)<br />
In this section, we summarize material information concerning our share capital, together with material<br />
provisions of applicable French law and our statuts as updated to reflect changes in the share capital as at<br />
December 31, 2003. An unofficial English translation of our statuts is included as an exhibit to this report.<br />
Only the official French version of our statuts governs our affairs. You may obtain copies of our statuts in<br />
French from <strong>Lafarge</strong> Legal Affairs Department, Siège social: 61, rue des Belles Feuilles 75116 Paris, France.<br />
In order to comply with amendments to French company law enacted in 2001, our statuts have been amended<br />
to allow us to authorize our directors and shareholders to attend meetings by videoconference and to allow<br />
our directors to separate the function of Chairman of the Board (président) and Chief Executive Officer<br />
(directeur général) and to include provisions regarding the appointment of up to five Chief Operating Officers<br />
(directeurs généraux délégués). The amended statuts were approved by the extraordinary general meeting of<br />
shareholders convened on initial notice on October 22, 2002, and on second notice on November 5, 2002.<br />
128
Corporate Purpose<br />
We are registered under the number 542 105 572 with Registrar of Commerce and Companies of Paris.<br />
Our corporate purpose is described in Article 2 of our statuts.<br />
Directors<br />
The following is a summary of provisions in our statuts pertaining to directors:<br />
Directors’ power to vote compensation<br />
Our by-laws authorize the Board of Directors to distribute such remuneration among its members as it<br />
sees fit, within the limits established by our shareholders. Our shareholders decided on May 28, 2001, to set<br />
the maximum amount of directors’ fees payable in fiscal year 2001 and in subsequent fiscal years at<br />
FRF 4 million (approximately 0.610 million euros). The Board of Directors may also authorize the<br />
reimbursement of traveling expenses and expenses incurred by directors in the interests of <strong>Lafarge</strong>.<br />
The remuneration of the Chairman of the Board of Directors, the Chief Executive Officer and the<br />
executive officers is set by the Board of Directors. Such remuneration may be fixed and/or proportional.<br />
The Board of Directors may award exceptional remuneration to directors who are members of<br />
committees formed from among its members or who are entrusted with specific tasks or duties. In this case,<br />
such remuneration is charged to operating costs, indicated to the statutory auditors, submitted for prior<br />
authorization of the Board of Directors and subsequently approved by the shareholders’ meeting.<br />
Borrowing powers exercisable by directors<br />
Our statuts authorize the Board of Directors to accomplish all financial transactions, open all accounts<br />
with banking institutions, make and receive all payments, subscribe all negotiable instruments and notes,<br />
agree to all credits and request all loans.<br />
The Board of Directors may not contract loans in the form of bonds except with the authorization of the<br />
ordinary shareholders’ meeting, nor may it issue convertible bonds, bonds exchangeable for shares or bonds<br />
with share warrants except with the authorization of the extraordinary shareholders’ meeting.<br />
Age requirement for retirement of directors<br />
Our statuts provide that the directors may be dismissed at any time by a duly convened shareholders’<br />
meeting. Otherwise our statuts provide that our directors shall serve a multi-year term of office and each<br />
director’s term of office may be renewed subject the condition that directors may not be more than 70 years<br />
of age. Our shareholders at our general shareholders’ meeting convened on May 28, 2001 approved a<br />
resolution which amended our statuts and progressively reduced the duration of our directors’ terms of office.<br />
Under this resolution, directors currently serving and originally appointed for six-year terms will serve out the<br />
remainder of their six-year mandate; directors appointed or renewed in office in 2001 shall serve five-year<br />
terms; and those appointed or renewed in years subsequent shall serve four-year terms. Each director’s term<br />
of office expires at the end of the ordinary shareholders’ meeting called to approve the previous year’s<br />
accounts held in the year during which the director’s term of office normally expires or during which the<br />
director reaches the age limit of 70 years.<br />
The Chairman of the Board and the Chief Executive Officer may not be more than 65 years of age. The<br />
term of office of each expires automatically on December 31 of the year in which he reaches the age of 65.<br />
However, the Board of Directors may decide to extend the term of office of the Chairman of the Board<br />
beyond the above-mentioned age limit for successive one-year periods provided that his term of office as<br />
director continues for such periods. In this case, the term of office of the Chairman of the Board shall expire<br />
definitively on December 31 of the year in which he reaches the age of 67.<br />
129
Number of shares required for a director’s qualification<br />
All members of the Board of Directors must hold, in registered form, a number of shares representing a<br />
total nominal value of at least 4,572 euros (i.e. 1,143 shares). The par value of our shares is 4 euros.<br />
Shareholders’ Meetings and Voting Rights<br />
General<br />
In accordance with the French company law, there are two types of shareholders’ general meetings,<br />
ordinary and extraordinary.<br />
Ordinary general meetings of shareholders are required for matters such as:<br />
s electing, replacing and removing directors,<br />
s appointing independent auditors,<br />
s approving the annual accounts,<br />
s declaring dividends or authorizing dividends to be paid in shares,<br />
s issuing debt securities, and<br />
s authorizing the company to trade in its equity securities<br />
Extraordinary general meetings of shareholders are required for approval of matters such as amendments<br />
to our statuts, including any amendment required in connection with extraordinary corporate actions.<br />
Extraordinary corporate actions include:<br />
s changing our company’s name or corporate purpose,<br />
s increasing or decreasing our share capital,<br />
s creating a new class of equity securities,<br />
s authorizing the issuance of investment certificates or convertible or exchangeable securities,<br />
s creating securities giving the holder the right to acquire our shares such as warrants or convertible or<br />
exchangeable debt,<br />
s amending or modifying the terms and conditions of existing securities, and<br />
s the voluntary liquidation of our company.<br />
Annual Ordinary Meetings<br />
The French company law requires our Board of Directors to convene an annual ordinary general meeting<br />
of shareholders for approval of the annual accounts and the consolidated accounts. This meeting must be held<br />
within six months of the end of each fiscal year. This period may be extended by an order of the President of<br />
the Tribunal de Commerce (Commercial Court). The Board of Directors may also convene an ordinary or<br />
extraordinary meeting of shareholders upon proper notice at any time during the year. If the Board of<br />
Directors fails to convene a shareholders’ meeting, our independent auditors may call the meeting. In a<br />
bankruptcy, the liquidator or court-appointed agent may also call a shareholders’ meeting in some instances.<br />
Any of the following may request the court to appoint an agent:<br />
s one or several shareholders holding at least 5% of our share capital,<br />
s any interested party in cases of urgency,<br />
s duly qualified associations of shareholders who have held their shares in registered form for at least<br />
two years and who together hold at least a specified percentage of the voting rights of our company, or<br />
s the Comité d’entreprise (workers’ council) in cases of urgency.<br />
130
In addition, shareholders representing a majority of the share capital or voting rights may convene a<br />
meeting after the completion of a public tender offer for our shares or the acquisition of a controlling block<br />
of our shares.<br />
Notice of Ordinary and Extraordinary Shareholders’ Meetings<br />
Ordinary and extraordinary general meetings of shareholders are convened in the same manner,<br />
according to the rules and procedures set forth by applicable French law. We must announce general<br />
meetings at least 30 days in advance by means of a preliminary notice (avis de reunion) published in the<br />
Bulletin des Annonces Légales Obligatoires, or ‘‘BALO’’. The preliminary notice must first be sent to the<br />
Autorité des Marchés Financiers (the ‘‘AMF’’). The AMF also recommends that the preliminary notice<br />
should be published in a newspaper of national circulation in France. It must contain, among other things, the<br />
time, date and place of the meeting, the agenda, a draft of the resolutions to be submitted to the shareholders,<br />
a description of the procedures which holders of bearer and registered shares must follow to attend the<br />
meeting and the procedure for voting by mail.<br />
At least 15 days prior to the date set for the meeting on first call and at least six days before any second<br />
call, we must send a final notice (avis de convocation) containing the final agenda and other information for<br />
the meeting. The final notice must be sent by mail to all registered shareholders who have held shares for<br />
more than one month prior to the date of the preliminary notice and published in a newspaper authorized to<br />
publish legal announcements in the local administrative department (département) in which our company is<br />
registered as well as in the BALO, with prior notice having been given to the AMF.<br />
In general, shareholders can only take action at shareholders’ meetings on matters listed on the agenda<br />
for the meeting. In an exception to this rule, shareholders may take action with respect to the dismissal of<br />
directors and various other matters even though these actions have not been included on the agenda.<br />
Additional resolutions to be submitted for approval by the shareholders at the meeting may be proposed to<br />
the Board of Directors within 10 days of the <strong>publication</strong> of the preliminary notice in the BALO by:<br />
s one or several shareholders holding a specified percentage of our total outstanding shares calculated on<br />
the basis of a formula relating to our share capital,<br />
s a registered association of shareholders who have held their shares in registered form for at least two<br />
years and who together hold at least a specified percentage of our voting rights, or<br />
s the Comité d’entreprise (workers’ council).<br />
The Board of Directors must submit these resolutions to a vote of the shareholders.<br />
During the two weeks preceding a meeting of shareholders, any shareholder may submit written<br />
questions to the Board of Directors relating to the agenda for the meeting. The Board of Directors must<br />
respond to these questions.<br />
Attendance and Voting at Shareholders’ Meetings<br />
Each share confers on the shareholder the right to one vote. Fully paid-up shares that have been held by<br />
the same shareholder in registered form for at least two years have a double voting right.<br />
Shareholders may attend ordinary general meetings and extraordinary general meetings and exercise their<br />
voting rights subject to the conditions specified in the French company law and our statuts. There is no<br />
requirement that a shareholder have a minimum number of shares in order to attend or to be represented at an<br />
ordinary or extraordinary general meeting.<br />
Access to the meeting is open to such shareholders, as well as to their proxies and registered<br />
intermediaries who have provided evidence of their entitlement to attend no later than 3:00 p.m. (Paris time)<br />
the day before the date of the assembly, including an attestation that their shares are registered in a share<br />
account. The Board of Directors may shorten or eliminate such time limit. Since 2002, the Board of Directors<br />
has decided not to require shareholders to block their shares prior to the general meetings, as provided by<br />
131
French law. Shareholders only had to present a certificate evidencing their share ownership to participate in<br />
the meetings in person or by proxy. The Board intends to continue to follow this approach in the future.<br />
In addition, the Board may, where deemed appropriate, provide shareholders with personal admission<br />
cards bearing the name of the shareholder and require the production of such cards at the meeting.<br />
Shareholders’ meetings may also be attended by videoconferencing or other telecommunications means, as<br />
may be decided by the Board of Directors. In organizing attendance of shareholders by videoconferencing or<br />
other telecommunications means, the Board of Directors needs to provide for a site entirely dedicated to this<br />
end and ensure the effectiveness of means enabling the identification of shareholders and guaranteeing their<br />
effective participation at the meeting.<br />
The total voting rights of one shareholder during a shareholders’ meeting, including voting rights held by<br />
other shareholders with whom this shareholder is acting in concert, is limited to 1% of the total number of<br />
existing voting rights calculated and, for the balance, according to the quorum obtained, by application of the<br />
percentage exceeding 1% to the number of voting rights corresponding to such quorum (calculated taking into<br />
account the restriction resulting from this provision). This limitation is meant to prevent the overrepresentation<br />
of a given shareholder at a general meeting as a result of the low level of participation at such<br />
meetings and ensuring that the voting rights of each shareholder are at least equal to their share in the overall<br />
share capital.<br />
Proxies and Votes by Mail<br />
In general, all shareholders who have properly registered their shares or duly presented a certificate from<br />
their accredited financial intermediary may participate in general meetings. Shareholders may participate in<br />
general meetings either in person, which includes by videoconference or by a means of telecommunication<br />
that permits them to be identified, or by proxy. Shareholders may vote in person, by proxy or by mail.<br />
Shareholders not domiciled in French territory may be represented by an intermediary registered in<br />
accordance with applicable French company law.<br />
Proxies will be sent to any shareholder on request. In order to be counted, such proxies must be received<br />
at our registered office, or at any other address indicated on the notice convening the meeting, prior to the<br />
date of the meeting. A shareholder may grant proxies to his or her spouse or to another shareholder. A<br />
shareholder that is a corporation may grant proxies to a legal representative. Alternatively, the shareholder<br />
may send us a blank proxy without nominating any representative. In this case, the chairman of the meeting<br />
will vote the blank proxies in favor of all resolutions proposed by the Board of Directors and against all<br />
others.<br />
With respect to votes by mail, we must send shareholders a voting form. The completed form must be<br />
returned to us at least three days prior to the date of the shareholders’ meeting.<br />
Any shareholder who previously submitted a vote by correspondence or granted a proxy may still attend<br />
a general meeting and participate in the vote, in which case the correspondence or proxy vote is invalidated.<br />
Quorum<br />
The French company law requires that a number of shareholders having at least 25% of the shares<br />
entitled to voting rights must be present in person or voting by mail, by proxy or by videoconference to fulfill<br />
the quorum requirement for:<br />
s an ordinary general meeting, and<br />
s an extraordinary general meeting where an increase in our share capital is proposed through<br />
incorporation of reserves, profits or share premium.<br />
The quorum requirement is 331 /3% of the shares entitled to voting rights, on the same basis, for any other<br />
extraordinary general meeting.<br />
If a quorum is not present at a meeting, the meeting is adjourned. When an adjourned ordinary meeting<br />
is resumed, there is no quorum requirement. No quorum is required when an adjourned extraordinary general<br />
132
meeting is resumed only to approve an increase in our share capital through incorporation of reserves, profits<br />
or share premium. In the case of any other resumed extraordinary general meeting, a number of shareholders<br />
having at least 25% of the outstanding voting rights must be present in person or voting by mail, by proxy or<br />
by videoconference for a quorum. If a quorum is not present, the reconvened meeting may be adjourned for a<br />
maximum of two months. However, only questions which were on the agenda of the adjourned meeting may<br />
be discussed and voted upon. No deliberation by the shareholders may take place without a quorum.<br />
Majority<br />
A simple majority of the shareholders’ votes cast (taking into account, as the case may be, double voting<br />
rights and limitations on voting rights) may pass a resolution concerning a capital increase by incorporation<br />
of reserves, profits or share premium at either an ordinary general meeting or an extraordinary general<br />
meeting. At any other extraordinary general meeting, a two-thirds majority of the shareholder votes cast<br />
(taking into account, as the case may be, double voting rights and limitations on voting rights) is required.<br />
A unanimous shareholder vote is required to increase liabilities of shareholders.<br />
Abstention from voting by those present or those represented by proxy, voting by mail or by<br />
videoconference or other means of telecommunication that allows them to be identified is counted as a vote<br />
against the resolution submitted to a shareholder vote.<br />
Under the French company law, shares of a company held by entities controlled directly or indirectly by<br />
that company are not entitled to voting rights and do not count for quorum or majority purposes.<br />
Financial Statements and Other Communications with Shareholders<br />
In connection with any shareholders’ meeting, we must provide a set of documents including our annual<br />
report and a summary of the results of the five previous fiscal years to any shareholder who so requests.<br />
Dividends<br />
We may only distribute dividends out of our ‘‘distributable profits,’’ plus any amounts held in our<br />
reserves which the shareholders decide to make available for distribution, other than those reserves which are<br />
specifically required by law or our statuts. ‘‘Distributable profits’’ consist of our unconsolidated net profit in<br />
each fiscal year, as increased or reduced by any profit or loss carried forward from prior years, less any<br />
contributions to the reserve accounts pursuant to law or our statuts. Dividends not claimed within five years<br />
of the date of payment escheat to the French state.<br />
Dividends paid on fully paid-up shares that have been held by the same shareholders in registered form<br />
for at least two years are increased by 10% over dividends paid on other shares, rounded down to the nearest<br />
centime. Similarly, any stockholder who, at the year end, has held such stock, in registered form, for a<br />
minimum of two years and still holds it at the date of a bonus issue performed by way of capitalization of<br />
reserves, retained earnings or additional paid-in capital shall receive additional shares equal to 10% of the<br />
number distributed. Where this gives rise to fractions the number of shares allotted shall be rounded down to<br />
the nearest whole number.<br />
The two-year holding period for the increased dividend runs from January 1 of the year following the<br />
date the shares were placed in registered form. To benefit from the increased dividend with respect to the<br />
2003 financial year, shareholders must have held their shares in registered form since December 31, 2001 at<br />
the latest.<br />
The number of shares eligible to such increased dividend that can be held by one shareholder is limited<br />
to 0.5% of all outstanding shares, at the end of the fiscal year for which the dividend is paid. In the event of<br />
a share dividend or bonus issue, any additional shares shall rank pari passu with the shares previously held<br />
by the shareholder and shall be included in future loyalty bonus calculations. In the event of fractions:<br />
s where the shareholder opts for payment of dividends in shares, the shareholder meeting the legal<br />
conditions may pay the balancing amount in cash to receive an additional share; or<br />
133
s in the event of a bonus issue, the rights attaching to fractional shares arising as a result of the loyalty<br />
bonus cannot be traded and the corresponding shares shall be sold and the proceeds distributed to the<br />
holders of these rights no later than thirty days after the registration in the share account of the whole<br />
number of shares allocated to them.<br />
Legal Reserve<br />
The French company law provides that French sociétés anonymes such as our company must allocate 5%<br />
of their unconsolidated statutory net profit for each year to their legal reserve fund before dividends may be<br />
paid with respect to that year. Funds must be allocated until the amount in the legal reserve is equal to 10%<br />
of the aggregate nominal value of the issued and outstanding share capital. This restriction on the payment of<br />
dividends also applies to each of our French subsidiaries on an unconsolidated basis. At December 31, 2003,<br />
our legal reserve was 53 million euros. The legal reserve of any company subject to this requirement may<br />
only be distributed to shareholders upon liquidation of the company.<br />
Approval of Dividends<br />
According to the French company law, the Board of Directors may propose a dividend for approval by<br />
the shareholders at the annual general meeting of shareholders. If we have earned distributable profits since<br />
the end of the preceding fiscal year, as reflected in an interim statement of income certified by our auditors,<br />
the Board of Directors may distribute interim dividends to the extent of the distributable profits for the period<br />
covered by the interim statement of income. The Board of Directors may declare interim dividends payable in<br />
cash, without prior shareholder approval. However, for interim dividends paid in shares, prior authorization<br />
by a shareholders’ meeting is required.<br />
Distribution of Dividends<br />
Dividends are distributed to shareholders pro rata according to their respective holdings of shares.<br />
Outstanding dividends are payable to shareholders on the date of the shareholders’ meeting at which the<br />
distribution of dividends is approved. In the case of interim dividends, distributions are made to shareholders<br />
on the date of the Board of Directors’ meeting in which the distribution of interim dividends is approved. The<br />
actual dividend payment date is decided by the shareholders in an ordinary general meeting or by the Board<br />
of Directors in the absence of such a decision by the shareholders.<br />
Timing of Payment<br />
According to the French company law, we must pay any dividends within nine months of the end of our<br />
fiscal year, unless otherwise authorized by court order. Dividends on shares that are not claimed within five<br />
years of the date of declared payment revert to the French State.<br />
Changes in Share Capital<br />
Increases in Share Capital<br />
As provided by the French company law, our share capital may be increased only with the shareholders’<br />
approval at an extraordinary general meeting following a recommendation of the Board of Directors.<br />
Increases in our share capital may be effected by:<br />
s issuing additional shares,<br />
s increasing the nominal value of existing shares, or<br />
s creating a new class of equity securities.<br />
Increases in share capital by issuing additional securities may be effected by issuing such securities:<br />
s for cash,<br />
134
s for assets contributed in kind,<br />
s for securities contributed through a tender offer,<br />
s by conversion, exchange or redemption of debt securities previously issued,<br />
s upon the exercise of stock options, warrants or other similar securities comprising rights to subscribe<br />
to our shares,<br />
s by capitalization of profits, reserves or share premiums,<br />
s subject to various conditions, in satisfaction of debt incurred by our company, or<br />
s by any combination of the above.<br />
Decisions to increase the share capital through the capitalization of reserves, profits and/or share<br />
premiums require the approval of an extraordinary general meeting, acting under the quorum and majority<br />
requirements applicable to shareholders’ meetings. Increases effected by an increase in the nominal value of<br />
shares require unanimous approval of the shareholders, unless effected by capitalization of reserves, profits or<br />
share premiums. All other capital increases require the approval of an extraordinary general meeting. See<br />
‘‘Shareholders’ Meetings and Voting Rights’’.<br />
The shareholders may delegate the right to carry out certain types of capital increases to the Board of<br />
Directors, with a maximum amount and for a certain period of time. The Board of Directors may further<br />
delegate this right to the Chairman and/or Chief Executive Officer.<br />
Each time the shareholders decide to carry out a capital increase or decide to delegate to the Board of<br />
Directors the right to carry out a capital increase (except for a contribution in kind), they must also decide<br />
whether to proceed with a capital increase reserved to employees of our company and its subsidiaries, or<br />
whether or not to delegate to the Board of Directors the right to carry out such a reserved capital increase.<br />
Our Board of Directors has received from our shareholders’ meeting held on May 20, 2003, the right to<br />
carry out share capital increases through the issue of shares or other equity securities with or without<br />
shareholders’ preemptive subscription rights, through the capitalization of reserves, through the issue of<br />
employee stock subscription options and through the issue of shares reserved for our employees.<br />
The Board used these delegations in 2003 to carry out a rights issue of 1.26 billion euros pursuant to<br />
which 31,831,528 new shares were created and to issue 1,273,925 stock subscription options to our<br />
employees, each option giving the right to subscribe to one share.<br />
As of the date of this report, our Board of Directors may carry out the following share capital increases<br />
pursuant to the delegations granted to it by our shareholders’ meeting held on May 20, 2003:<br />
Type of share capital increase<br />
Maximum nominal amount<br />
(in euros)<br />
Expiration date of<br />
delegations<br />
Issue of shares or other equity securities with shareholders’<br />
preemptive subscription rights ;;;;;;;;;;; 72,673,888* July 20, 2005<br />
Issue of shares or other equity securities without<br />
shareholders’ preemptive subscription rights ;;;;; 72,673,888* July 20, 2005<br />
Capitalization of reserves ;;;;;;;;;;;;;; 100,000,000 July 20, 2005<br />
Issue of employee stock subscription options ;;;;;; 14,970,438** July 20, 2005<br />
Issue of shares reserved for our employees ;;;;;;; 14,000,000 July 20, 2005<br />
* the cap on these issues applies to both delegations.<br />
** based on the share capital as of December 31, 2003.<br />
Decreases in Share Capital<br />
According to the French company law, any decrease in our share capital requires approval by the<br />
shareholders entitled to vote at an extraordinary general meeting. In the case of a capital reduction, other than<br />
a reduction to absorb losses or a reduction as part of a program to purchase our own shares, all holders of<br />
135
shares must be offered the possibility to participate in such a reduction. The share capital may be reduced<br />
either by decreasing the nominal value of the outstanding share capital or by reducing the number of<br />
outstanding shares. The number of outstanding shares may be reduced either by an exchange of shares or by<br />
the repurchase and cancellation of shares. Holders of each class of shares must be treated equally unless each<br />
affected shareholder agrees otherwise.<br />
Preemptive Subscription Rights<br />
According to the French company law, if we issue specific kinds of additional securities, current<br />
shareholders will have preemptive subscription rights to these securities on a pro rata basis. These preemptive<br />
rights require us to give priority treatment to those shareholders. These rights entitle the individual or entity<br />
that holds them to subscribe to an issue of any securities that may increase the share capital of our company<br />
by means of a cash payment or a settling of cash debts. Preemptive subscription rights are transferable during<br />
the subscription period relating to a particular offering. These rights may also be listed on Euronext Paris.<br />
A two-thirds majority of the shares entitled to vote at an extraordinary general meeting may vote to<br />
waive preemptive subscription rights with respect to any particular offering. French law requires that the<br />
Board of Directors and our independent auditors present reports that specifically address any proposal to<br />
waive preemptive subscription rights. In the event of a waiver, the issue of securities must be completed<br />
within the period prescribed by law. The shareholders may also decide at an extraordinary general meeting to<br />
give the existing shareholders a non-transferable priority right to subscribe to the new securities, during a<br />
limited period of time. Individual shareholders may also notify us that they wish to waive their own<br />
preemptive subscription rights with respect to any particular offering of shares if they so choose.<br />
Form, Holding and Transfer of Shares<br />
Form of Shares<br />
Our statuts provide that the shares may be held in registered or bearer form.<br />
Holding of Shares<br />
In accordance with French law concerning dematerialization of securities, shareholders’ ownership rights<br />
are represented by book entries instead of share certificates. We maintain a share account with Euroclear<br />
France for all shares in registered form, which is administered by Crédit Commercial de France. In addition,<br />
we maintain separate accounts in the name of each shareholder either directly or, at a shareholder’s request,<br />
through the shareholder’s accredited intermediary. Each shareholder account shows the name of the holder<br />
and the number of shares held and, in the case of shares held through an accredited intermediary, the<br />
shareholder account shows that the shares are held through such intermediary. Crédit Commercial de France,<br />
as a matter of course, issues confirmations to each registered shareholder as to shares registered in the<br />
shareholder’s account, but these confirmations are not documents of title.<br />
Shares held in bearer form are held on the shareholder’s behalf in an account maintained by an<br />
accredited intermediary and are registered in an account which the accredited intermediary maintains with<br />
Euroclear France. That account is separate from our company’s share account with Euroclear France. Each<br />
accredited intermediary maintains a record of shares held through it and will issue certificates of registration<br />
for the shares that it holds. Shares held in bearer form may only be transferred through accredited<br />
intermediaries and Euroclear France. Our statuts permit us to request that Euroclear France provide us at any<br />
time with the identity of the holders of our shares or other securities, held in bearer form, granting immediate<br />
or future voting rights, with the number of shares or other securities so held and any restrictions on such<br />
securities.<br />
In addition, pursuant to the May 15, 2001 act amending French company law, shares held, in registered<br />
form or bearer form, by non-French residents may be held on the shareholder’s behalf in a collective account<br />
or in several individual accounts by an intermediary. This intermediary must declare that it is acting as an<br />
intermediary and may be requested by us to provide the identity of the shareholders on whose behalf it is<br />
acting. Failure to declare that it is acting as an intermediary or the provision of inaccurate or incomplete<br />
136
information about the shareholders can result in the deprivation of both the right to vote and the right to<br />
receive dividends.<br />
Transfer of Shares<br />
Our statuts do not contain any restrictions relating to the transfer of shares, other than those provided for<br />
by law, regulation or statute.<br />
Registered shares must be converted into bearer form before being transferred on Euronext Paris and,<br />
accordingly, must be registered in an account maintained by an accredited intermediary. A shareholder may<br />
initiate a transfer by giving instructions to the relevant accredited intermediary. A fee or commission is<br />
payable to the broker involved in the transaction, regardless of whether the transaction occurs inside or<br />
outside of France. Normally, no registration duty is payable in France, unless a transfer instrument has been<br />
executed in France.<br />
Liquidation Rights<br />
In the event of a liquidation, any assets remaining after payment of our debts, liquidation expenses and<br />
all of our remaining obligations would first be distributed to repay in full the nominal value of our shares.<br />
Any surplus would then be distributed pro rata among shareholders in proportion to the nominal value of<br />
their shareholdings.<br />
Requirements for Holdings Exceeding Certain Percentages<br />
The French company law provides that any individual or entity, acting alone or in concert with others,<br />
that becomes the owner, directly or indirectly, of more than 5%, 10%, 20%, 331 /3%, 50% or 662 /3% ofthe<br />
outstanding shares or voting rights of a listed company in France, such as our company, or that increases or<br />
decreases its shareholding or voting rights above or below any of those percentages, must notify the company<br />
within five trading days of the date it crosses the threshold of the number of shares and ADSs it holds and<br />
their voting rights. The individual or entity must also notify the AMF, within five trading days of the date it<br />
crosses the threshold.<br />
French law and the AMF regulations impose additional reporting requirements on persons who acquire<br />
more than 10% or 20% of the outstanding shares or voting rights of a listed company. These persons must<br />
file a report with the company and the AMF within 10 trading days of the date they cross the threshold. In<br />
the report, the acquirer must specify its intentions for the following 12-month period, including whether or<br />
not it intends to continue its purchases, to acquire control of the company in question or to seek nomination<br />
to the Board of Directors. The AMF must make the notice public. The acquirer must also publish a press<br />
release stating its intentions in a financial newspaper of national circulation in France. The acquirer may<br />
amend its stated intentions, provided that it does so on the basis of significant changes in its own situation or<br />
shareholders. Upon any change of intention, it must file a new report. These requirements also apply to<br />
registered intermediaries who hold stock on behalf of non-resident shareholders.<br />
Under French regulations, and subject to limited exemptions granted by the AMF, any person or persons<br />
acting in concert who come to own in excess of 331 /3% of the share capital or voting rights of a French listed<br />
company must initiate a public tender offer for the balance of the share capital of such company.<br />
In addition, our statuts provide that any person acting alone or in concert who becomes, directly or<br />
indirectly, the owner of more than 1% of our share capital or voting rights must notify us within 15 days, by<br />
registered mail with return receipt requested, fax or telex, of the number of shares or voting rights it holds.<br />
The same notification requirement applies to each subsequent increase or decrease in ownership of 1% or<br />
whole multiples of 1%. If a person does not comply with this notification requirement, one or more<br />
shareholders holding 1% or more of our share capital or voting rights may require a shareholders’ meeting to<br />
deprive the shares in excess of the relevant threshold of voting rights for all shareholders’ meetings for two<br />
years following the date on which the owner complies with the notification requirements. Such sanction is<br />
independent of any legal sanction which may be issued by a court upon the request of the Chairman, a<br />
shareholder or the AMF.<br />
137
In order to permit holders or intermediaries to give the required notice, we must publish in the BALO,<br />
not later than 15 calendar days after the annual ordinary general meeting of shareholders, information with<br />
respect to the total number of voting rights outstanding as of the date of such meeting. In addition, if the<br />
number of outstanding voting rights changes by 5% or more between two annual ordinary general meetings,<br />
we must publish in the BALO, within 15 calendar days of such change, the number of voting rights<br />
outstanding and provide the AMF with a written notice. The AMF publishes the total number of voting rights<br />
so notified by all listed companies in a weekly notice (avis), including the date each such number was last<br />
updated. In order to facilitate compliance with the notification requirements, a holder of ADSs may deliver<br />
any such notification to the depositary and the depositary shall, as soon as practicable, forward such<br />
notification to us and to the AMF.<br />
If any person fails to comply with the legal notification requirement, the shares or voting rights in excess<br />
of the relevant threshold will be deprived of voting rights for all shareholders’ meetings until the end of a<br />
two-year period following the date on which the owner thereof complies with the notification requirements. In<br />
addition, any shareholder who fails to comply with these requirements may have all or part of its voting<br />
rights suspended for up to five years by the Commercial Court at the request of our Chairman of the Board,<br />
any shareholder or the AMF. In addition, individuals who are shareholders, the Chairman, members of the<br />
Board, managers and managing directors of corporate shareholders may be subject to a fine of 18,000 euros.<br />
There have been no public takeover offers by third parties for our shares during the last or the current<br />
financial year.<br />
Purchase of Our Own Shares<br />
Under French law, our company may not issue shares to itself. However, we may, either directly or<br />
through a financial intermediary acting on our behalf, purchase our shares for one of three purposes:<br />
(1) to reduce our share capital by canceling the shares we purchase, with our shareholders’ approval at<br />
an extraordinary general meeting,<br />
(2) to provide shares to our employees under a profit-sharing plan or stock option plan, with our<br />
shareholders’ approval at an extraordinary general meeting, or<br />
(3) to acquire up to 10% of our share capital in connection with a corporate share repurchase program,<br />
with our shareholders’ approval at an ordinary general meeting and the <strong>publication</strong>, either at the<br />
latest 15 days before such general shareholders’ meeting or right after the Board of Directors<br />
implements the share repurchase program, of a notice (note d’information) approved by the AMF.<br />
On May 20, 2003, the shareholders authorized a share repurchase program as described in clause (3)<br />
above for up to 10% of our outstanding shares. The purchase price may not exceed 120 euros per share and<br />
the selling price must be at least 50 euros per share. The shares purchased pursuant to this program can be<br />
used to:<br />
s stabilize the price of our shares on the market,<br />
s provide shares for distribution to employees under a profit sharing, employee offering or stock option<br />
plan,<br />
s provide consideration in the context of an acquisition or of the issuance of securities exchangeable,<br />
redeemable or otherwise convertible into our shares.<br />
These shares can be also kept as treasury shares or cancelled pursuant to a specific resolution approved<br />
by the extraordinary general shareholders’ meeting of May 20, 2003. This authorization to repurchase our<br />
own shares will expire on November 20, 2004.<br />
In 2003 we acquired from our subsidiary <strong>Lafarge</strong> Asland 843,255 shares at an average price of 51.50<br />
euros a share. In the same period we sold 12,630 shares pursuant to the exercise of outstanding purchase<br />
stock options at an average price of 50.19 euros per share.<br />
138
At December 31, 2003, we held directly in treasury 1,856,266 shares purchased pursuant to prior<br />
authorizations from our shareholders. Under French law these shares are considered outstanding but have no<br />
voting rights. These treasury shares represented 1.11% of our outstanding shares for a total book value of<br />
approximately 110 million euros as of December 31, 2003. 1,058,296 of these shares are reserved to be<br />
attributed to our employees upon exercise of stock options granted in December 1997, 1998, 2000 and 2001.<br />
In addition, at the shareholders’ meeting of May 20, 2003, the shareholders granted the Board of<br />
Directors the authorization to cancel some or all of the shares purchased under the share repurchase program<br />
up to a limit of 10% of our share capital in any 24-month period. This authorization is valid for a 26-month<br />
period from the date of this shareholders’ meeting.<br />
In addition, we may not repurchase under either clause (2) or (3) above an amount of shares that would<br />
result in our company holding, directly or through a person acting on our behalf, more than 10% of our<br />
outstanding share capital, or, if we have different classes of shares, 10% of the shares in each class.<br />
We must hold any shares we repurchase in registered form. These shares also must be fully paid up.<br />
Shares repurchased by us are deemed outstanding under French law but are not entitled to dividends or voting<br />
rights, and we may not exercise the preemptive subscription rights attached to them.<br />
The shareholders, at an extraordinary general meeting, may decide not to take these shares into account<br />
in determining the preemptive subscription rights attached to the other shares. However, if the shareholders<br />
do decide to take them into account, we must either sell the rights attached to the shares we hold on the<br />
market before the end of the subscription period or distribute them to the other shareholders on a pro rata<br />
basis.<br />
Trading in Our Own Shares<br />
Under French regulations, we may not trade in our own shares for the purpose of manipulating the<br />
market. There are three requirements in order for trades by a company in its own shares to be considered<br />
valid. Specifically, in order to be valid:<br />
s trades must be executed on our behalf by only one intermediary in each trading session, except if we<br />
use derivatives in our share repurchase program, in which case trades can be executed by two<br />
intermediaries in each trading session, provided that we ensure that they coordinate their interventions,<br />
s any block trades may not be made at a price above the current market price, and<br />
s each trade must be made at a price that falls between the lowest and the highest trading pricse of the<br />
trading session during which such trade is executed.<br />
If a company’s shares are continuously quoted (cotation en continu), such as ours are, then a trade must<br />
meet the following further requirements to be considered valid:<br />
s the trade must not influence the determination of the quoted price before the opening of trading, at the<br />
opening of the trading session, at the first trade of the shares, at the reopening of trading following a<br />
suspension, or, as applicable, in the last half-hour of any trading session or at the fixing of the closing<br />
price,<br />
s the trade must not be carried out in order to influence the price of a derivative instrument relating to<br />
the company’s shares, and<br />
s the trade must not account for more than 25% of the average total daily trading volume on the<br />
Premier Marché in the shares during the three trading days immediately preceding the trade for shares<br />
that, like our shares, are eligible for the deferred settlement service; this requirement is not applicable<br />
to block trades and to trades executed on behalf of the issuer by an intermediary acting pursuant to a<br />
liquidity agreement that complies with a code of ethics approved by the AMF.<br />
In addition, there are two periods during which we are not permitted to trade in our own securities: the<br />
15-day period before the date on which we make our consolidated or annual accounts public, and the period<br />
139
eginning on the date at which we become aware of information that, if disclosed, would have a significant<br />
impact on the market price of our securities and ending on the date this information is made public.<br />
This requirement does not apply to trades executed on behalf of the issuer by an intermediary acting<br />
pursuant to a liquidity agreement (contrat de liquidité) complying with a charter of ethics approved by the<br />
AMF.<br />
After making an initial purchase of our own shares, we must file monthly reports with the AMF that<br />
contain specified information about subsequent transactions. The AMF makes this information publicly<br />
available.<br />
Ownership of Shares by Non-French Persons<br />
Under French law, there is no limitation on the right of non-residents or non-French shareholders to own<br />
or, where applicable, to vote securities of a French company.<br />
A French law dated February 14, 1996 abolished the requirement that a person who is not a resident of<br />
the European Union (‘‘E.U.’’) obtain an autorisation préalable, or prior authorization, prior to acquiring a<br />
controlling interest in a French company. However, pursuant to Decree nº 2003-196 of March 7, 2003 the<br />
acquirer/investor must file a déclaration administrative, or administrative notice, with French authorities in<br />
connection with the realization of certain investments in French companies. Under existing administrative<br />
rules, for example, any transaction realized in the share capital of a French company by a non-resident person<br />
or company, that will result, after the completion of the contemplated transactions, in the aggregate amount of<br />
the share capital or voting rights held by such non-resident person or company exceeding 33.33% of the share<br />
capital or voting rights, is considered as a foreign investment subject to the filing of a déclaration<br />
administrative.<br />
In addition, pursuant to the May 15, 2001 act amending French company law, shares held, in registered<br />
form or bearer form, by non-French residents may be held on the shareholder’s behalf in a collective account<br />
or in several individual accounts by an intermediary. This intermediary must declare that it is acting as an<br />
intermediary and may be requested by us to provide the identity of the shareholders on whose behalf it is<br />
acting. Failure to declare that it is acting as an intermediary or the provision of inaccurate or incomplete<br />
information about the shareholders can result in the deprivation of both the right to vote and the right to<br />
receive dividends.<br />
Material Contracts<br />
On August 1, 2000, we transferred our interests in <strong>Lafarge</strong> North America, our U.S. subsidiary and<br />
Fabrica Nacional de Cementos SACA, our Venezuelan subsidiary, to voting trusts set up under the laws of<br />
the State of New York. These trusts are designed to make available to the public shareholders of these<br />
subsidiaries, for a period of ten years, an opportunity comparable to that presently enjoyed under French Law<br />
and regulations by public shareholders of French subsidiaries of French corporations to receive a tender offer<br />
for their shares in the event of a tender or exchange offer under French law for the shares of <strong>Lafarge</strong> S.A., if<br />
at the time of commencement of such offer <strong>Lafarge</strong> S.A.’s beneficial interest in these subsidiaries comprises<br />
20% or more of the voting power represented by the outstanding voting securities of the relevant subsidiary.<br />
The minority shareholders of <strong>Lafarge</strong> North America benefited from a similar protection from July 31,<br />
1990 until July 31, 2000.<br />
The common shares of <strong>Lafarge</strong> North America are listed on the New York Stock Exchange. The<br />
exchangeable preference shares of <strong>Lafarge</strong> Canada Inc., a subsidiary of <strong>Lafarge</strong> North America, are listed on<br />
the Toronto stock exchange and are exchangeable, at any time at the option of the holder, into common<br />
shares of <strong>Lafarge</strong> North America. The common shares of Fabrica Nacional de Cementos SACA are listed on<br />
the Caracas stock exchange.<br />
Each of the trust agreements provides, among other things, that unless an acquirer of <strong>Lafarge</strong> S.A., or<br />
<strong>Lafarge</strong> S.A. itself consummates a comparable tender offer for all publicly held voting securities, or securities<br />
convertible, redeemable or otherwise exchangeable into voting securities, of the relevant subsidiary, the<br />
140
trustees will, for a five year protective period, exercise our voting rights with respect to the voting securities<br />
held in the trust, in general, by voting those securities in favor of any resolution proposed by the subsidiary’s<br />
Board of Directors and in opposition to any resolutions opposed by the subsidiary’s Board of Directors.<br />
Before an acquirer commences a tender or exchange offer for <strong>Lafarge</strong> S.A., we have the power to direct<br />
the trustees how to vote all of the voting securities held in the trust.<br />
A ‘‘comparable tender offer’’ is defined in each trust agreement to be a tender offer for any or all of the<br />
outstanding voting securities, or securities convertible, redeemable or otherwise exchangeable into voting<br />
securities, held by public shareholders of the relevant subsidiary upon specified terms and conditions,<br />
including, but not limited to, the requirement that the price offered to the holders of such securities reflect a<br />
premium to the current market price for such securities at least equal to the highest premium publicly offered<br />
or paid by the acquirer (or publicly offered by any other person making a tender or exchange offer for<br />
<strong>Lafarge</strong> S.A. after the acquirer commences a tender or exchange offer for <strong>Lafarge</strong> S.A.) in making its tender<br />
or exchange offer to acquire a controlling interest in <strong>Lafarge</strong> S.A. The tender offer may be conditioned only<br />
on the acquirer’s acquisition of more than 50% of <strong>Lafarge</strong> S.A.’s voting shares (which condition is not<br />
waivable).<br />
Pursuant to each trust agreement, until a potential acquirer commences an offer for <strong>Lafarge</strong> S.A., we (i)<br />
are permitted to transfer the voting securities held by the relevant trust to establish another comparable trust<br />
and (ii), through the trust, are permitted to sell all or some of the voting securities held by the trust to a<br />
person or an entity who or which is not affiliated with us. Other than as specifically provided in the trust<br />
agreement, we shall not have the right to withdraw, sell, assign, transfer or otherwise dispose of the whole or<br />
any part of the corpus of the trust. In the event that we beneficially own less than 20% of the voting power<br />
represented by the then outstanding voting shares of the relevant subsidiary, we may revoke the trust<br />
agreement.<br />
Each trust agreement also provides that, unless otherwise directed by us, all income received by the<br />
relevant trust shall be distributed to us, provided that, during a protective period, the trustees shall be<br />
permitted to use income from the trust to pay certain expenses.<br />
On May 23, 2003, we amended the trust agreements pertaining to <strong>Lafarge</strong> North America in order to (i)<br />
make <strong>Lafarge</strong> North America a direct beneficiary of the trusts and (ii) to change the law applicable to the<br />
trusts from New York law to Maryland law, the state of incorporation of <strong>Lafarge</strong> North America.<br />
On May 23, 2003, we amended the trust agreement, pertaining to Fabrica Nacional de Cementos SACA<br />
to (i) make Fabrica Nacional de Camentos SACA a direct beneficiary of the trust, and (ii) to change the law<br />
applicable to the trusts from New York law to English law.<br />
Exchange Controls and Other Limitations Affecting Security Holders<br />
Under current French exchange control regulations, there are no limitations on the amount of payments<br />
that may be remitted by us to non-residents of France. Laws and regulations concerning foreign exchange<br />
controls do require, however, that all payments or transfers of funds made by a French resident to a nonresident<br />
be handled by an authorized intermediary bank. All credit establishments in France, including all<br />
registered banks, are accredited intermediaries.<br />
Neither French law nor our statuts presently impose any restrictions on the ability of non-French holders<br />
to hold or vote the Shares.<br />
Other<br />
For other limitations affecting shareholders, see ‘‘Requirements for Holdings Exceeding Certain<br />
Percentages’’.<br />
141
Taxation<br />
French Taxation<br />
The following is a general summary of the material French tax consequences of owning and disposing of<br />
the shares of our company. This summary may only be relevant to you if you are not a resident of France<br />
and you do not hold your shares in connection with a permanent establishment or a fixed base in France<br />
through which you carry on a business or perform personal services.<br />
This discussion is intended only as a descriptive summary. It does not address all aspects of French tax<br />
laws that may be relevant to you in light of your particular circumstances. It is based on the laws,<br />
conventions and treaties in force as of the date of this prospectus, all of which are subject to change, possibly<br />
with retroactive effect, or different interpretations.<br />
In particular, holders of shares should be aware that the French Budget Law for 2004 (nº 2003-1311<br />
dated December 30, 2003) has abolished the avoir fiscal and the précompte with respect to dividends to be<br />
paid to French individual shareholders as of January 1, 2005. However, French non-individual shareholders<br />
will no longer be entitled to use the avoir fiscal as of January 1, 2005.<br />
Although yet unclear, non-resident individual shareholders that are entitled to and that comply with the<br />
procedures for claiming benefits under an applicable tax treaty should be entitled to the refund of the avoir<br />
fiscal with respect to distributions paid until December 31, 2004. Also, non-resident shareholders that are not<br />
entitled to benefit from the transfer of the avoir fiscal, but are otherwise entitled to benefit from a double tax<br />
treaty (i.e., corporate shareholders and individuals, if they are not entitled to the avoir fiscal refund) should be<br />
entitled to a refund of the précompte, if any, that our company will pay in cash on distributions it will make<br />
in 2004.<br />
In addition, the French Budget Law for 2004 has implemented a temporary equalization tax that will be<br />
levied at the rate of 25% (assessed on the net dividends before withholding tax) on dividends paid in 2005<br />
out of profits that have not been taxed at the ordinary corporate income tax rate or that have been earned and<br />
taxed more than five years before the distribution. However, unlike the précompte, such temporary<br />
equalization tax will not be refundable to non-resident shareholders.<br />
If you are considering buying shares of our company, you should consult your own tax adviser about the<br />
potential tax effects of owning or disposing of shares in your particular situation.<br />
Taxation on Sale or Disposal of Shares<br />
Generally, you will not be subject to any French income tax or capital gains tax when you sell or<br />
dispose of shares of our company if both of the following apply to you:<br />
(1) you are not a French resident for French tax purposes, and<br />
(2) you have held not more than 25% of our company’s dividend rights, known as droits aux bénéfices<br />
sociaux, at any time during the preceding five years, either directly or indirectly, alone or with<br />
relatives.<br />
Subject to specific conditions, foreign states, international organizations and a number of foreign public<br />
bodies are not considered French residents for these purposes.<br />
If a double tax treaty between France and your country contains more favorable provisions, you may not<br />
be subject to any French income tax or capital gains tax when you sell or dispose of any shares of our<br />
company, even if one or both of the above statements apply to you.<br />
If you transfer listed shares using a written agreement, that agreement must generally be registered. You<br />
will be required to pay a registration duty of 1% of either the purchase price or the market value of the<br />
shares transferred, whichever is higher. The maximum duty is 3,049 euros per transfer. However, in some<br />
circumstances, if the agreement is executed outside France, you will not be required to pay this duty.<br />
142
Taxation of Dividends<br />
In France, companies may only pay dividends out of income remaining after tax has been paid.<br />
Shareholders of our company that are residents of France were entitled to a tax credit, known as the<br />
avoir fiscal, on dividends paid by our company in 2003.<br />
The amount of the avoir fiscal attached to dividends paid in 2003 is equal to:<br />
(1) 50% of the dividend paid for (i) individuals and (ii) companies which own at least 5% of the capital<br />
of the French distributing company and meet the conditions to qualify under the French parentsubsidiary<br />
regime; or<br />
(2) 10% of the dividend paid for other shareholders.<br />
In addition, if the distribution of dividends by us gave rise to the précompte, shareholders entitled to the<br />
avoir fiscal at the rate of 10%, generally were entitled to an additional amount of avoir fiscal equal to 80% of<br />
the précompte paid in cash by our company (as further described below, the précompte is a tax which is<br />
currently paid by French companies when they distribute dividends out of certain profits and such dividends<br />
carry an avoir fiscal).<br />
Pursuant to the French Budget Law for 2004, French individual residents will generally be entitled to the<br />
avoir fiscal in respect of dividends to be distributed by our company until December 31, 2004, while French<br />
corporate shareholders will not.<br />
Under French domestic law, French companies must generally deduct a 25% French withholding tax<br />
from dividends paid to non-residents and shareholders who are not resident in France are not eligible for the<br />
avoir fiscal. Under most tax treaties between France and other countries, the rate of this withholding tax may<br />
be reduced in specific circumstances. Generally, a holder who is a non-French resident is subsequently<br />
entitled to a tax credit in his or her country of residence for the amount of tax actually withheld. Under some<br />
tax treaties, the withholding tax is eliminated altogether. Certain tax treaties further provide for a refund of<br />
the avoir fiscal to such non-residents.<br />
Although unclear, the provisions of a treaty, insofar as they provide for the transfer of the avoir fiscal or,<br />
as the case may be, a refund of the précompte (see paragraph on the précompte below), should continue to<br />
apply to distributions paid until December 31, 2004.<br />
The following countries, French overseas territories, known as Territoires d’Outre-Mer, and other<br />
territories have entered into income tax treaties with France that provide for the arrangements summarized<br />
below:<br />
Australia<br />
Austria<br />
Belgium<br />
Bolivia<br />
Brazil<br />
Burkina Faso<br />
Canada<br />
Estonia<br />
Finland<br />
Gabon<br />
Ghana<br />
Iceland<br />
India<br />
Israel<br />
Italy<br />
Ivory Coast<br />
Japan<br />
Latvia<br />
Lithuania<br />
Luxembourg<br />
Malaysia<br />
Mali<br />
Malta<br />
Mauritius<br />
Mexico<br />
Namibia<br />
Netherlands<br />
New Zealand<br />
Niger<br />
Norway<br />
Pakistan<br />
Senegal<br />
Singapore<br />
South Korea<br />
Spain<br />
Sweden<br />
Switzerland<br />
Togo<br />
Turkey<br />
Ukraine<br />
United Kingdom<br />
United States<br />
Venezuela<br />
French Territoires<br />
d’Outre-Mer and<br />
Other:<br />
Mayotte<br />
New Caledonia<br />
Saint-Pierre et Miquelon<br />
Under these treaties, a shareholder who fulfills specific conditions may generally apply to the French tax<br />
authorities for the following:<br />
(1) a lower rate of withholding tax, generally 15%, and<br />
(2) a refund equal to the avoir fiscal, after deduction of withholding tax payable on the avoir fiscal, to<br />
the extent, however, that the avoir fiscal is still available.<br />
143
Some of the countries and territories listed above impose additional conditions for corporate entities<br />
wishing to receive the avoir fiscal. In other countries and territories, individual residents may receive the<br />
avoir fiscal but corporate entities may not.<br />
Except for the United States, none of the countries or territories listed above has a treaty granting<br />
benefits to holders of ADSs, as opposed to shares. Accordingly, this discussion of treaty benefits does not<br />
apply to ADS holders.<br />
If the arrangements provided for by any of the above-listed treaties apply to a shareholder, we will<br />
withhold tax from the dividend at the lower rate, provided that the shareholder has established, before the<br />
date of payment of the dividend, that he or she is entitled to the lower rate and has complied with the filing<br />
formalities. Otherwise, we must withhold tax at the full rate of 25%, and the shareholder may subsequently<br />
claim the excess tax paid.<br />
The Précompte<br />
A French company must currently pay a tax known as the précompte to the French tax authorities if it<br />
distributes, before December 31, 2004, dividends which carry an avoir fiscal out of:<br />
(1) profits which have not been taxed at the ordinary corporate income tax rate; or<br />
(2) profits which have been earned and taxed more than five years before the distribution.<br />
The amount of the précompte is 50% of the net dividends before withholding tax.<br />
As regards dividends distributed in 2003, a shareholder that is not a French resident for French tax<br />
purposes generally may obtain a refund of all or part of the précompte we actually paid in cash, net of<br />
applicable withholding tax, in two cases:<br />
(1) if the shareholder is entitled to the benefits of a tax treaty but the treaty does not provide for a<br />
refund of the avoir fiscal, or<br />
(2) if the shareholder is entitled to the benefits of a tax treaty but not to the refund of all of the avoir<br />
fiscal.<br />
It is unclear, however, whether such non-resident shareholders will be entitled to a refund of the<br />
précompte, if any, that we shall pay on distributions to be made in 2004.<br />
As a consequence of the suppression of the précompte for dividends which will be paid as of January 1,<br />
2005, French Budget Law for 2004 implements a temporary equalization tax that will be levied at the rate of<br />
25% (assessed on the net dividends before withholding tax) on dividends paid in 2005 out of profits that have<br />
not been taxed at the ordinary corporate income tax rate or that have been earned and taxed more than five<br />
years before the distribution. However, unlike the précompte, such temporary equalization tax will not be<br />
refundable to the non-resident shareholders.<br />
Estate and Gift Tax<br />
France imposes estate and gift tax where an individual or entity acquires shares of a French company<br />
from a non-resident of France by way of inheritance or gift. France has entered into estate and gift tax<br />
treaties with a number of countries. Under these treaties, residents of those countries may be exempt from<br />
this tax or obtain a tax credit, assuming specific conditions are met. You should consult your own tax adviser<br />
about whether French estate and gift tax will apply to you and whether you may claim an exemption or tax<br />
credit.<br />
Wealth Tax<br />
You will not be subject to French wealth tax, known as impôt de solidarité sur la fortune, on your<br />
shares if both of the following apply to you:<br />
(1) you are not a French resident for the purpose of French taxation, and<br />
144
(2) you own less than 10% of our company’s capital stock, either directly or indirectly, provided that<br />
your shares do not enable you to exercise influence on our company.<br />
If a double tax treaty between France and your country of residence contains more favorable provisions,<br />
you may not be subject to French wealth tax even if one or both of the above statements applies to you.<br />
Taxation of U.S. Investors<br />
The following is a general summary of the material U.S. federal income tax and French tax<br />
consequences of owning and disposing of our shares or ADSs. This discussion applies only to U.S. holders.<br />
You will be a U.S. holder if you are the beneficial owner of shares or ADSs and all of the following five<br />
points apply to you:<br />
(1) You own, directly, indirectly or by attribution, less than 10% of our share capital or voting stock;<br />
(2) You are any one of the following below:<br />
(a) an individual who is a citizen or resident of the United States for U.S. federal income tax<br />
purposes,<br />
(b) a corporation or certain other entities (taxable as corporations for U.S. federal income tax<br />
purposes) created in or organized under the laws of the United States or any state thereof,<br />
(c) an estate the income of which is subject to U.S. federal income taxation regardless of its<br />
source, or<br />
(d) a trust if a court within the United States is able to exercise primary supervision over the<br />
administration of the trust, and if one or more U.S. persons have the authority to control all<br />
substantial decisions of the trust;<br />
(3) You are entitled to the benefits of the ‘‘Convention between the Government of the United States of<br />
America and the Government of the French Republic for the Avoidance of Double Taxation and the<br />
Prevention of Fiscal Evasion with Respect to Taxes on Income and Capital’’, signed August 31,<br />
1994 (the ‘‘U.S.-France income tax treaty’’) under the ‘‘Limitation on Benefits’’ article of that<br />
treaty;<br />
(4) You hold your shares or ADSs in the company as capital assets; and<br />
(5) Your functional currency is the U.S. dollar.<br />
If a partnership (including for this purpose any entity treated as a partnership for U.S. federal income tax<br />
purposes) holds shares or ADSs, the tax treatment of a partner generally will depend upon the status of the<br />
partner and the activities of the partnership. If you are a partner in a partnership that holds shares or ADSs,<br />
you are urged to consult your own tax adviser regarding the specific tax consequences of owning and<br />
disposing of such shares or ADSs.<br />
Special rules may apply to U.S. expatriates, insurance companies, tax-exempt entities, banks, financial<br />
institutions, persons subject to the alternative minimum tax, securities broker-dealers, persons holding shares<br />
or ADS as part of a hedging transaction, straddle or conversion transaction, persons who acquired their shares<br />
or ADSs pursuant to the exercise of employee stock options or otherwise as compensation, among others.<br />
Those special rules, except certain rules applicable to certain tax-exempt investors, are not discussed in this<br />
annual report. Furthermore, this discussion is based upon current U.S. and French law and practice, including<br />
the U.S. Internal Revenue Code of 1986, as amended (the ‘‘Internal Revenue Code’’), the Treasury<br />
regulations promulgated thereunder, rulings, judicial decisions and administrative pronouncements. This<br />
summary is subject to any changes to (or changes in the interpretation of) U.S. or French law or practice<br />
occurring after the date hereof, which may have retroactive effect. In addition, this summary is based, in part,<br />
upon representations made by the depositary to us and assumes that the Deposit Agreement, and all other<br />
related agreements, will be performed in accordance with its terms. Holders should consult their own tax<br />
advisers concerning the U.S. federal, state and local tax consequences of the ownership or disposition of our<br />
145
shares or ADSs in light of their particular situations as well as any consequences arising under the laws of<br />
any other taxing jurisdiction.<br />
Taxation of Dividends<br />
Withholding Tax and Avoir Fiscal<br />
As indicated under ‘‘French Taxation’’ above, under French domestic law, French companies must<br />
normally deduct a 25% French withholding tax from dividends paid to non-residents, and shareholders who<br />
are not resident in France are not eligible for the avoir fiscal.<br />
Under the U.S.-France income tax treaty, this withholding tax is reduced to 15% if your ownership of<br />
the shares or ADSs is not effectively connected with a permanent establishment or a fixed base that you have<br />
in France and certain other requirements are satisfied.<br />
As regards distributions made by us in 2003, additional provisions of the U.S.-France income tax treaty<br />
apply to you if you are considered an ‘‘eligible’’ U.S. holder of shares or ADSs.<br />
As regards distributions that were made in 2003, you are considered ‘‘eligible’’ if your ownership of the<br />
shares or ADSs is not effectively connected with a permanent establishment or a fixed base that you have in<br />
France and any one of the following four points applies to you:<br />
(1) You are an individual or other non-corporate holder that is a resident of the United States for<br />
purposes of the U.S.-France income tax treaty;<br />
(2) You are a U.S. corporation, other than a regulated investment company;<br />
(3) You are a U.S. corporation which is a regulated investment company, provided that less than 20%<br />
of your shares are beneficially owned by persons who are neither citizens nor residents of the<br />
United States; or<br />
(4) You are a partnership, estate or trust that is a resident of the United States for purposes of the<br />
U.S.- France income tax treaty, but only to the extent that your partners, beneficiaries or grantors<br />
would qualify as ‘‘eligible’’ under point (1) or point (2) above.<br />
Assuming that non-resident individual shareholders will remain entitled to the transfer of the avoir fiscal<br />
for distributions to be made in 2004, an individual holder that is a resident of the United States as defined<br />
pursuant to the provisions of the treaty and whose ownership of our shares is not connected with a permanent<br />
establishment in France should remain an ‘‘eligible’’ U.S. holder with respect to distributions to be made by<br />
our company in 2004. A U.S. holder other than an individual will no longer be ‘‘eligible’’ with respect to<br />
distributions to be made in 2004.<br />
If you are and so long as you will remain an eligible U.S. holder, we shall withhold tax from your<br />
dividend at the reduced rate of 15%, provided that you have previously established that you are a resident of<br />
the United States under the U.S.-France income tax treaty in accordance with the following procedures:<br />
(1) You complete French Treasury Form RF I A EU-No. 5052 and send it to the French tax authorities<br />
before the date of payment of the dividend. If you are not an individual, you will also have to send<br />
to the French tax authorities an affidavit attesting that you are the beneficial owner of all the rights<br />
attached to the full ownership of the shares or ADSs, including, among other things, the dividend<br />
rights.<br />
(2) If you are not able to complete Form RF I A EU-No. 5052 before the date of payment of the<br />
dividend, you may complete a simplified certificate and send it to the French tax authorities. This<br />
certificate must state all of the following five points:<br />
(a) You are a resident of the United States for purposes of the U.S.-France income tax treaty;<br />
(b) Your ownership of our shares or ADSs is not effectively connected with a permanent<br />
establishment or a fixed base in France;<br />
146
(c) You own all the rights attached to the full ownership of the shares or ADSs, including, among<br />
other things, the dividend rights;<br />
(d) You fulfill all the requirements under the U.S.-France income tax treaty to be entitled to the<br />
reduced rate of withholding tax and to be entitled to receive the avoir fiscal; and<br />
(e) You claim the reduced rate of withholding tax and, so long as it exists, the payment of the<br />
avoir fiscal.<br />
If you are not an eligible U.S. holder, but you are entitled to the reduced rate of withholding tax, French<br />
withholding tax will be levied at the reduced rate of 15%, provided, however, that you file French tax Form<br />
RF I B EU-No. 5053 (or any other form that may replace it in the future) with the paying agent before the<br />
date of payment of the dividend.<br />
If you complete the applicable form or, where applicable, the five-point certificate before the dividend<br />
payment date, we shall deduct French withholding tax at the rate of 25%. In that case, you may claim a<br />
refund from the French tax authorities of the excess withholding tax.<br />
If you are an eligible U.S. holder, you may also be entitled to a payment from the French Treasury equal<br />
to the avoir fiscal, which you may claim by completing Form RF I A EU-No. 5052 and sending it to the<br />
French tax authorities before December 31 of the second year following the year during which the dividend<br />
was paid. You will be entitled to a payment equal to the avoir fiscal, less a 15% withholding tax on the avoir<br />
fiscal. As noted below, you will not receive this payment until after the close of the calendar year in which<br />
the dividend was paid. To receive the payment, you must submit a claim to the French tax authorities and<br />
attest that you are subject to U.S. federal income taxes on the payment of the avoir fiscal and the related<br />
dividend. For partnerships, estates or trusts, the partners, beneficiaries or grantors must make the attestation.<br />
Specific rules apply to the following:<br />
(1) tax-exempt U.S. pension funds, which include the exempt pension funds established and managed in<br />
order to pay retirement benefits subject to the provisions of Section 401(a) of the Internal Revenue Code<br />
(qualified retirement plans), Section 403(b) of the Internal Revenue Code (tax deferred annuity contracts)<br />
or Section 457 of the Internal Revenue Code (deferred compensation plans), and<br />
(2) various other tax-exempt entities, including certain state-owned institutions, not-for-profit organizations<br />
and individuals with respect to dividends which they beneficially own and which are derived from an<br />
investment retirement account.<br />
Entities in these two categories are eligible for the reduced withholding tax rate of 15% on dividends,<br />
subject to the same withholding tax filing requirements as eligible U.S. holders, except that they may have to<br />
supply additional documentation evidencing their entitlement to these benefits. These entities are not entitled<br />
to the full avoir fiscal. However, such entities may currently claim a partial avoir fiscal equal to 30/85 of the<br />
gross avoir fiscal, less withholding tax on such amount, provided that they own, directly or indirectly, less<br />
than 10% of our capital and they satisfy the filing requirements specified by the Internal Revenue Service or<br />
in the Treasury regulations. Please note that tax-exempt U.S. pension funds and such other tax-exempt entities<br />
will be treated like any other corporate shareholders as regards the suppression of the avoir fiscal, and thus,<br />
will no longer be entitled to their partial avoir fiscal with respect to dividends that our company will pay as<br />
of January 1, 2004.<br />
The avoir fiscal or partial avoir fiscal and any French withholding tax refund are generally expected to<br />
be paid within 12 months after the holder of shares or ADSs files Form RF I A EU-No. 5052. However, they<br />
will not be paid before January 15 following the end of the calendar year in which the dividend is paid.<br />
The form or, where applicable, the certificate, together with its respective instructions, are provided by<br />
the depositary to all U.S. Holders of ADSs registered with the depositary and is also available from the<br />
United States Internal Revenue Service. The depositary will arrange for the filing with the French tax<br />
authorities of all forms or certificates completed by U.S. Holders of ADSs that are returned to the depositary<br />
in sufficient time.<br />
147
For U.S. federal income tax purposes, the gross amount of any distribution and any related avoir fiscal,<br />
including any French tax withheld thereon, will be included in your gross income as ordinary dividend<br />
income when any such payment is actually or constructively received by you if you hold shares (or received<br />
by the depositary, if you hold ADSs), to the extent it is paid or deemed paid out of our current or<br />
accumulated earnings and profits as calculated for U.S. federal income tax purposes. To the extent that the<br />
amount of any distribution exceeds our current and accumulated earnings and profits as calculated for U.S.<br />
federal income tax purposes, it will be treated first as a tax-free return of capital and thereafter any balance in<br />
excess of your adjusted tax basis will be taxable as capital gain. Dividends paid by us will not give rise to<br />
the dividends received deduction generally allowed to U.S. corporations with respect to dividends received<br />
from other U.S. corporations. Such dividends generally will constitute foreign source ‘‘passive’’ income for<br />
foreign tax credit purposes (or, for some holders, foreign source ‘‘financial services’’ income).<br />
Further, for U.S. federal income tax purposes, the amount of any dividend paid in euros including any<br />
French tax withheld will be equal to the U.S. dollar value of the euro amount received calculated by<br />
reference to the exchange rate in effect on the date the dividend is actually or constructively received by you,<br />
in the case of shares, or received by the depositary, in the case of ADSs, regardless of whether the payment<br />
is in fact converted into U.S. dollar. If you do not convert any such foreign currency that is distributed to you<br />
into U.S. dollars on the date you receive it, you generally will have a basis in that foreign currency equal to<br />
its U.S. dollar value on the date of receipt. You generally may be required to recognize U.S. ordinary income<br />
or loss resulting from currency exchange fluctuations upon a subsequent conversion or other disposition of the<br />
foreign currency. You also may be required to recognize foreign currency gain or loss if you receive a refund<br />
under the U.S.-France income tax treaty of tax withheld in excess of the treaty rate. This foreign currency<br />
gain or loss generally will be U.S. source ordinary income or loss.<br />
French withholding tax imposed on the dividends you receive and on any avoir fiscal at 15% under the<br />
U.S.-France income tax treaty is treated as payment of a foreign income tax. You may take this amount as a<br />
credit against your U.S. federal income tax liability, subject to complex conditions and limitations, or<br />
alternatively you may choose to deduct all foreign taxes paid by you in a particular year as an itemized<br />
deduction. The United States Treasury has expressed concerns that parties to whom ADSs are released may<br />
be taking actions that are inconsistent with the claiming of foreign tax credits for U.S. holders of ADSs.<br />
Accordingly, the discussion above regarding the creditability of French withholding tax on dividends could be<br />
affected by future actions that may be taken by the United States Treasury.<br />
The Précompte<br />
As indicated above under ‘‘French Taxation’’, a French company must generally pay an equalization tax<br />
known as the précompte to the French tax authorities if it distributes, before December 31, 2004, dividends<br />
that carry an avoir fiscal out of certain profits.<br />
Under the U.S.-France income tax treaty, if you are not entitled to the full avoir fiscal, you may<br />
generally obtain a refund from the French tax authorities of any précompte paid by us with respect to<br />
dividends distributed to you in 2003. However, it is unclear whether, if you are not entitled to the avoir fiscal<br />
on distributions to occur in 2004, you will nonetheless be able to obtain a refund of any précompte that we<br />
shall pay with respect to the dividends that we will distribute to you in 2004.<br />
Under the U.S.-France income tax treaty, the amount of the précompte refunded to U.S. residents is<br />
reduced by the 15% withholding tax applicable to dividends and by the partial avoir fiscal, if any. You are<br />
entitled to a refund of any précompte, which we actually pay in cash, but not to any précompte, which we<br />
pay by off-setting French and/or foreign tax credits.<br />
To apply for a refund of the précompte, you should file French Treasury Form RF I B EU-No. 5053<br />
before the end of the second year following the year in which the dividend was paid. The form and its<br />
instructions are available from the United States Internal Revenue Service or from the French Centre des<br />
Impôts des Non-Résidents whose address is 9, rue d’Uzès, 75094 Paris Cedex 2, France.<br />
For U.S. federal income tax purposes, the gross amount of the précompte will be included in your gross<br />
income as ordinary income in the year you actually or constructively receive it. It generally will constitute<br />
148
foreign source ‘‘passive’’ income for foreign tax credit purposes (or, for some holders, foreign source<br />
‘‘financial services’’ income). The amount of any précompte paid in euros, including any French withholding<br />
taxes, will be equal to the U.S. dollar value of the euros on the date the précompte is included in income<br />
which, for a U.S. holder of ADSs, will be the date of receipt by the depositary, regardless of whether the<br />
payment is in fact converted into U.S. dollars. Any gain or loss upon a subsequent conversion or other<br />
disposition of such euros will be treated as U.S. source ordinary income or loss.<br />
As a consequence of the suppression of the précompte for dividends which will be paid as of January 1,<br />
2005, French Budget Law for 2004 implements a temporary equalization tax that will be levied at the rate of<br />
25% (assessed on the net dividends before withholding tax) on dividends paid in 2005 out of profits that have<br />
not been taxed at the ordinary corporate income tax rate or that have been earned and taxed more than five<br />
years before the distribution. However, unlike the précompte, such temporary equalization tax will not be<br />
refundable to the U.S. holders.<br />
Recent U.S. Tax Law Changes Applicable to Individuals<br />
Under 2003 U.S. tax legislation, some U.S. holders (including individuals) are eligible for reduced rates<br />
of U.S. federal income tax (currently a maximum of 15%) in respect of ‘‘qualified dividend income’’ received<br />
in taxable years beginning after December 31, 2002 and beginning before January 1, 2009. For this purpose,<br />
qualified dividend income generally includes dividends paid by non-U.S. corporations if, among other things,<br />
certain minimum holding periods are met and either (i) the shares (or ADSs) with respect to which the<br />
dividend has been paid are readily tradable on an established securities markets in the United States, or (ii)<br />
the non-U.S. corporation is eligible for the benefits of a comprehensive U.S. income tax treaty (such as the<br />
U.S.-France income tax treaty) which provides for the exchange of information. We currently believe that<br />
dividends paid with respect to our shares and ADSs will constitute qualified dividend income for U.S. federal<br />
income tax purposes, provided that the individual U.S. holders of our shares and ADSs meet certain<br />
requirements. Some of the eligibility requirements for non-U.S. corporations are not entirely certain, however,<br />
and further guidance from the Internal Revenue Service is anticipated. In addition, the Internal Revenue<br />
Service is expected to issue certification procedures in 2004 whereby a non-U.S. corporation will be required<br />
to certify as to the eligibility of its dividends for the reduced U.S. federal income tax rates.<br />
Taxation of Capital Gains<br />
If you are a resident of the United States for purposes of the U.S.-France income tax treaty, you will not<br />
be subject to French tax on any capital gain if you sell or dispose of your shares or ADSs, unless you have a<br />
permanent establishment or fixed base in France and the shares or ADSs you sold or disposed of were part of<br />
the business property of that permanent establishment or fixed base. Special rules apply to individuals who<br />
are residents of more than one country.<br />
In general, for U.S. federal income tax purposes, you will recognize capital gain or loss if you sell or<br />
dispose of your shares or ADSs in an amount equal to the U.S. dollar value of the difference between the<br />
amount realized for the share or ADS and your basis (determined in U.S. dollars) in the share or ADS. Such<br />
gain or loss generally will be U.S. source gain or loss and will be treated as long-term capital gain or loss if<br />
your holding period in the shares or ADSs exceeds one year at the time of disposition. The deductibility of<br />
capital losses is subject to significant limitations. If you are an individual, any capital gain generally will be<br />
subject to U.S. federal income tax at preferential rates if you meet specified minimum holding periods.<br />
Deposits or withdrawals of shares by you for ADSs will not be subject to U.S. federal income tax.<br />
Passive Foreign Investment Company Status<br />
A non-U.S. corporation will be classified as a Passive Foreign Investment Company (a ‘‘PFIC’’) for any<br />
taxable year if at least 75% of its gross income consists of passive income (such as dividends, interest, rents<br />
or royalties (other than rents or royalties derived in the active conduct of a trade or business and received<br />
from an unrelated person), or gains on the disposition of certain minority interests), or at least 50% of the<br />
average value of its assets consists of assets that produce, or are held for the production of, passive income.<br />
We believe that we did not qualify as a PFIC for our taxable year ending December 31, 2003. If we were<br />
149
characterized as a PFIC for any taxable year, you would suffer adverse tax consequences. These<br />
consequences may include having gains realized on the disposition of shares or ADSs treated as ordinary<br />
income rather than capital gains and being subject to punitive interest charges on certain dividends and on the<br />
proceeds of the sale or other disposition of the shares or ADSs. Furthermore, dividends paid by us would not<br />
be ‘‘qualified dividend income’’ and would be taxed at the higher rates applicable to other items of ordinary<br />
income. You should consult your own tax adviser regarding the potential application of the PFIC rules to<br />
your ownership of our shares or ADSs.<br />
French Estate and Gift Taxes<br />
Under the ‘‘Convention between the United States of America and the French Republic for the<br />
Avoidance of Double Taxation and the Prevention of Fiscal Evasion with Respect to Taxes on Estates,<br />
Inheritance and Gifts of November 24, 1978,’’ if you transfer your shares or ADSs by gift, or if they are<br />
transferred by reason of your death, that transfer will only be subject to French gift or inheritance tax if one<br />
of the following applies:<br />
(1) you are domiciled in France at the time of making the gift or at the time of your death, or<br />
(2) you used the shares or ADSs in conducting a business through a permanent establishment or fixed<br />
base in France, or you held the shares or ADSs for that use.<br />
French Wealth Tax<br />
The French wealth tax does not generally apply to shares or ADSs if the holder is a ‘‘resident’’ of the<br />
United States for purposes of the U.S.-France income tax treaty.<br />
U.S. Information Reporting and Backup Withholding<br />
Dividend payments made to you and proceeds paid from the sale, exchange, redemption or disposal of<br />
your shares or ADSs may be subject to information reporting to the Internal Revenue Service and possible<br />
U.S. federal backup withholding imposed at a current rate of 28%. Backup withholding will not apply to a<br />
holder who furnishes a correct taxpayer identification number or certificate of foreign status and makes any<br />
other required certification, or who is otherwise exempt from backup withholding. U.S. persons who are<br />
required to establish their exempt status generally must provide Internal Revenue Service Form W-9 (Request<br />
for Taxpayer Identification Number and Certification). Non-U.S. holders generally are not subject to U.S.<br />
information reporting or backup withholding. However, such holders may be required to provide certification<br />
of non-U.S. status (generally on Internal Revenue Service Form W-8BEN) in connection with payments<br />
received in the United States or through U.S.-related financial intermediaries. Backup withholding is not an<br />
additional tax. Amounts withheld as backup withholding may be credited against your U.S. federal income<br />
tax liability. You may obtain a refund of any excess amounts withheld under the backup withholding rules by<br />
filing the appropriate claim for refund with the Internal Revenue Service in a timely manner and furnishing<br />
any required information.<br />
Dividends and Paying Agents<br />
Not applicable.<br />
Experts<br />
Not applicable.<br />
Documents on Display<br />
Please see ‘‘Item 19. Exhibits’’.<br />
150
ITEM 11. QUANTITATIVE AND QUALITATIVE DISCLOSURES ABOUT MARKET RISK<br />
We are exposed to foreign currency risk and interest rate risk. Other market risk exposures are generated<br />
by our equity investments and commodity prices.<br />
We have defined strict policies and procedures to measure, manage and monitor our market risk<br />
exposures. Our policies do not permit any speculative market position. We have instituted management rules<br />
based on a segregation of operations, financial and administrative control and risk measurement. We have<br />
also instituted, for all operations managed at corporate level, an integrated system that permits real time<br />
monitoring of hedging strategies.<br />
Our policy is in general to use derivative instruments only to hedge against our exposure to exchange<br />
rate and interest rate risks. However, to manage our exposure to commodity risks, we enter into long-term<br />
contracts and, from time to time, we also use derivative instruments. With the prior authorization of our<br />
senior management, we have occasionally entered into agreements to limit our or another party’s exposure to<br />
equity risk.<br />
We are subject to commodity risk with respect to price changes principally in the coal, pet coke, gas,<br />
and electricity markets. We attempt to limit our exposure to changes in commodity prices by entering into<br />
long-term contracts and increasing our use of alternative fuels. For further information on our use of<br />
alternative fuels, please see ‘‘Item 4. Information About the Company’’. From time to time, we use forward<br />
contracts to manage our exposure to these commodity risks. These contracts are not normally required to be<br />
accounted for as derivative instruments as they are subject to the normal purchases or sales exception, as<br />
contracts that provide for the purchase or sale of something other than a financial instrument or derivative<br />
instrument that will be delivered in quantities expected to be used or sold by us over a reasonable period in<br />
the normal course of business. When the normal purchases or sales exception is not applied, the derivatives<br />
are recognized, for the purposes of the U.S. GAAP reconciliation at their fair value. Under French GAAP,<br />
these contracts are considered off balance sheet commitments (engagements hors bilan) and are described in<br />
Note 27 to our consolidated financial statements. At December 31, 2003, such commitments were limited to<br />
forward purchase contracts for electricity and natural gas, and the amount of our exposure under such<br />
contracts was not significant.<br />
We are subject to equity risk with respect to our minority holdings in certain public companies. We<br />
occasionally enter into transactions with respect to our equity investments with financial institutions. We<br />
account for such instruments by taking the fair value at period end in accordance with applicable valuation<br />
rules, and in accordance with French GAAP we record any negative variation between the fair value and the<br />
book value under the line item ‘‘Financial expenses, net’’. For the year ended December 31, 2003, we<br />
recorded a gain of 27 million euros with respect to contracts limiting our exposure to equity risk and we<br />
believe we had no additional material exposure to such contracts. In addition, in respect of certain joint<br />
ventures and other acquisitions we have also entered into shareholders agreements which have written call<br />
and put options with respect to our and our partners’ interests. For a discussion of our exposure to these<br />
options, see ‘‘Item 5. Operating and Financial Review and Prospects — Liquidity and Capital Resources —<br />
Disclosures about Contractual Obligations and Contingent Commitments’’.<br />
Derivative Instruments<br />
In order to reduce our exposure to the risks of currency and interest rate fluctuations, we manage our<br />
exposure both on a central basis through our treasury department and in conjunction with some of our<br />
subsidiaries. We use various standard derivative financial instruments, such as forward exchange contracts,<br />
interest rate and currency swaps and forward rate agreements, to hedge currency and interest rate fluctuations<br />
on assets, liabilities and future commitments, in accordance with guidelines established by our senior<br />
management.<br />
We use financial instruments only to hedge existing or anticipated financial and commercial exposures.<br />
We undertake this hedging in the over-the-counter market with a limited number of highly rated<br />
counterparties. Our positions in derivative financial instruments are monitored using various techniques,<br />
including the fair value approach.<br />
151
Foreign Currency Risk<br />
Translation Risks. The assets, liabilities, income and expenses of our operating entities are denominated<br />
in various currencies. Our financial statements are presented in euros. Thus, assets, liabilities, income and<br />
expenses denominated in currencies other than the euro must be translated into euros at the applicable<br />
exchange rate to be included in our financial statements.<br />
If the euro increases in value against a currency, the value in euros of assets, liabilities, income and<br />
expenses originally recorded in such other currency will decrease. Conversely, if the euro decreases in value<br />
against a currency, the value in euros of assets, liabilities, income and expenses originally recorded in such<br />
other currency will increase. Thus, increases and decreases in the value of the euro can have an impact on the<br />
value in euros of our non-euro assets, liabilities, income and expenses, even if the value of these items has<br />
not changed in their original currency.<br />
In 2003, approximately 11% of our net income was contributed by subsidiaries which prepare their<br />
financial statements in U.S. dollars and Canadian dollars. As such, a 10% change in the U.S.$/euro exchange<br />
rate and in the Canadian dollar/euro exchange rate would have an impact on our net income of approximately<br />
8 million euros, net of any other impact.<br />
Transaction Risks. We are subject to foreign exchange risks as a result of our subsidiaries’ purchase and<br />
sale transactions in currencies other than their operating currencies. Our exposure to these risks remains<br />
however somewhat limited thanks to the very local nature of our business, where, in most cases, costs of<br />
production and revenues are denominated in the same local currency.<br />
With regard to transactional foreign currency exposures, our policy is to hedge all material foreign<br />
currency exposures through derivative instruments at the latest when a firm commitment is entered into or<br />
known. These derivative instruments are generally limited to forward contracts and standard foreign currency<br />
options, with terms generally less than one year. We also from time to time hedge future cash flows in<br />
foreign currencies when such flows are highly probable. We do not enter into foreign currency exchange<br />
contracts for other than hedging purposes.<br />
Each subsidiary is responsible for managing the foreign exchange positions arising as a result of<br />
commercial and financial transactions performed in currencies other than its domestic currency. Exposures are<br />
hedged with banks using foreign currency forward contracts and occasionally foreign currency options.<br />
However, our corporate treasury department attempts, when possible, to act as a direct counterparty of the<br />
group subsidiaries and immediately return its position in the market. It also attempts to reduce our overall<br />
exposure by netting purchases and sales in each currency on a global basis when feasible.<br />
As far as financing is concerned, our general policy is for subsidiaries to borrow and invest excess cash<br />
in the same currency as their functional currency. A significant portion of our financing is in U.S.$, British<br />
pounds and other U.S.$ related currencies, reflecting our significant operations in these countries. Part of this<br />
debt was initially borrowed in euros at the parent company level then converted into foreign currencies<br />
through currency swaps. At December 31, 2003, before these currency swaps, 9% of our consolidated<br />
indebtedness was denominated in U.S.$ and 13% was denominated in British Pounds. After taking into<br />
account the swaps, our consolidated U.S.$ denominated debt amounted to 26% of our total consolidated debt,<br />
while our British Pound denominated debt represented 21%.<br />
For a further discussion of the financial instruments we use, see Notes 24 and 25 to our consolidated<br />
financial statements.<br />
Interest Rate Risk<br />
We are exposed to interest rate risk through our debt and cash. Our interest rate exposure can be subdivided<br />
into the following risks:<br />
Price risk for fixed-rate financial assets and liabilities. By contracting a fixed-rate liability, for example,<br />
we are exposed to an opportunity cost in the event of a fall in interest rates. Changes in interest rates impact<br />
the market value of fixed-rate assets and liabilities, leaving the associated financial income or expense<br />
unchanged.<br />
152
Cash-flow risk for floating rate assets and liabilities. Changes in interest rates have little impact on the<br />
market value of floating-rate assets and liabilities, but directly influence the future income or expense flows of<br />
the company.<br />
In accordance with the general policy established by our senior management we seek to manage these<br />
two types of risks, including by using interest rate swaps and forward rate agreements. Our corporate treasury<br />
department manages our financing and hedges interest rate risk exposure in accordance with rules defined by<br />
our senior management in order to keep a balance between fixed rate and floating rate exposure.<br />
Before taking into account the interest rate swaps, at December 31, 2003, 85% of our consolidated<br />
indebtedness was at fixed rate. After taking into account these swaps, the portion of fixed debt in our<br />
consolidated indebtedness amounted to 91%.<br />
For a further discussion of our financial policy and interest rate exposure, see Notes 24 and 25 to our<br />
consolidated financial statements.<br />
Interest Rate Sensitivity<br />
The table below provides information about our interest rate swaps and debt obligations that are sensitive<br />
to changes in interest rates. For debt obligations, the table presents principal cash flows by expected maturity<br />
dates and related weighted average interest rates before swaps. For interest rate swaps, the table presents<br />
notional amounts by contractual maturity dates and related weighted average fixed interest rates. Notional<br />
amounts are used to calculate the contractual payments to be exchanged under the contract. Weighted average<br />
floating rates are based on effective rates at year-end.<br />
At December 31, 2003<br />
Maturities of notional contract values<br />
Average<br />
Rate 2004 2005 2006 2007 2008 > 5 years Total Fair Value<br />
(in million euros)<br />
Liabilities<br />
Long-term debt ;;;; 5.7 985 1,033 2,005 975 1,407 1,950 8,355 8,705<br />
Fixed rate portion ;; 5.8 836 882 1,781 770 1,301 1,830 7,400 7,748<br />
Floating rate portion ; 5.0 149 151 224 205 106 120 955 957<br />
Short-term borrowing ;;<br />
Interest rate derivatives<br />
Interest Rate swaps<br />
Pay Fixed<br />
7.2 340 — — — — — 340 340<br />
Euro;;;;;;;; 8.4 — 865 117 151 70 — 1,203 (89)<br />
Other currencies ;;;<br />
Receive Fixed<br />
10.1 7 — 19 16 — 4 46 (2)<br />
Euro;;;;;;;; 2.3 — 49 — — — — 49 1<br />
Other currencies ;;; 5.2 — 2 — — — — 2 0<br />
153
Exchange Rate Sensitivity<br />
The table below provides information about our debt and foreign exchange derivative financial<br />
instruments that are sensitive to exchange rates. For debt obligations, the table presents principal cash flows<br />
in foreign currencies by expected maturity dates. For foreign exchange forward agreements, the table presents<br />
the notional amounts by contractual maturity dates. These notional amounts are generally used to calculate<br />
the contractual payments to be exchanged under the contract.<br />
At December 31, 2003<br />
Maturities of notional contract values<br />
2004 2005 2006 2007 2008 45 years Total Fair Value<br />
(in million euros)<br />
Liabilities<br />
Debt in foreign currencies;;;; 426 450 216 122 226 1,383 2,823 2,915<br />
U.S.$ ;;;;;;;;;;;; 89 219 38 1 163 295 805 845<br />
British Pounds ;;;;;;;; 12 8 39 11 8 1,033 1,111 1,150<br />
Other currencies ;;;;;;;; 325 223 139 110 55 55 907 920<br />
Foreign Exchange Derivatives<br />
Forward purchase agreements<br />
U.S.$ ;;;;;;;;;;;; 120 5 — — — — 125 (4)<br />
British Pounds ;;;;;;;; 9 — — — — — 9 0<br />
Other currencies ;;;;;;;; 93 — — — — — 93 3<br />
Total ;;;;;;;;;;<br />
Forward sales agreements<br />
222 5 — — — — 227 (1)<br />
U.S.$ ;;;;;;;;;;;; 1,420 — — — — — 1,420 127<br />
British Pounds ;;;;;;;; 803 — — — — — 803 5<br />
Other currencies ;;;;;;;; 184 — — — — — 184 2<br />
Total ;;;;;;;;;; 2,407 — — — — — 2,407 134<br />
Assumptions<br />
Debt: The fair values of long-term debt were determined by estimating future cash flows on a<br />
borrowing-by-borrowing basis, and discounting these future cash flows using an interest rate which takes into<br />
consideration the company’s incremental borrowing rate at year-end for similar types of debt arrangements.<br />
Market price is used to determine the fair value of publicly traded instruments.<br />
Off balance sheet financial instruments: The fair values of forward exchange contracts and interest and<br />
currency swaps have been calculated, using market prices that the company would pay or receive to settle the<br />
related agreements. Primarily, dealer quotes have been used to estimate the fair values of these instruments at<br />
the reporting dates.<br />
Credit risk<br />
We are exposed to credit risk in the event of a counterparty’s default. We attempt to limit our exposure<br />
to counterparty risk by rigorously selecting the counterparties with which we trade, through regularly<br />
monitoring the ratings assigned by credit rating agencies as well as the nature and maturity of operations with<br />
them. We establish counterparty limits which are regularly reviewed. We believe we have no material<br />
concentration of risk with any counterparty. We do not anticipate any third party default that might have a<br />
significant impact on our financial positions and results of operations.<br />
ITEM 12. DESCRIPTION OF SECURITIES OTHER THAN EQUITY SECURITIES<br />
Not applicable.<br />
154
PART II<br />
ITEM 13. DEFAULTS, DIVIDENDS ARREARAGES AND DELINQUENCIES<br />
To our knowledge, there has been no material default in the payment of principal or interest or any other<br />
material default not cured within 30 days relating to indebtedness of <strong>Lafarge</strong> or any of its subsidiaries.<br />
ITEM 14. MATERIAL MODIFICATIONS OF THE RIGHTS OF SECURITY HOLDERS AND USE<br />
OF PROCEEDS<br />
Other than set forth herein (including the financial statements and notes thereto), there have been no<br />
material modifications in the rights of our security holders and there are no specific assets securing any class<br />
of our securities.<br />
ITEM 15. CONTROLS AND PROCEDURES<br />
Bernard Kasriel, our Chief Executive Officer, and Jean-Jacques Gauthier, our Executive Vice President<br />
for Finance (Chief Financial Officer), have carried out an evaluation of the effectiveness of the design and<br />
operations of <strong>Lafarge</strong>’s disclosure controls and procedures pursuant to Exchange Act requirements as of the<br />
end of the period covered by of this annual report on form 20-F. Based upon such evaluation and as of its<br />
date, both Mr. Kasriel and Mr. Gauthier have concluded that our disclosure controls and procedures are<br />
adequate and effective in ensuring that all material information relating to <strong>Lafarge</strong> and its consolidated<br />
subsidiaries, and which is required to be filed in the annual report, has been made known to them,<br />
particularly during the period in which this annual report was being prepared.<br />
There have been no significant changes in <strong>Lafarge</strong>’s internal controls and procedures, nor, to our<br />
knowledge, have there been any changes to other factors that could significantly affect the disclosure controls<br />
and procedures subsequent to the Evaluation Date. There were no significant deficiencies or material<br />
weaknesses in our internal controls and procedures requiring corrective actions.<br />
Pursuant to a new French act of August 1, 2003 (Loi de sécurité financière), the Chairman of our Board<br />
of Director is required to deliver a special report to the ordinary shareholders’ meeting regarding our Board’s<br />
governance practices, the status of the internal control procedures implemented by our company and on the<br />
restrictions that our Board of Directors has placed on the powers granted to the Chief Executive Officer. In<br />
general, this report describes the objectives of our internal controls, the organization of the participants in our<br />
internal controls and the internal control procedures we currently have in place.<br />
The report for 2003 described how, with the assistance of our Internal Audit department, which<br />
comprises of 40 auditors, 15 of whom are attached to our subsidiary <strong>Lafarge</strong> North America, in 2003, we<br />
began developing a formal methodology for analyzing and managing risks, which we tested at a certain<br />
number of pilot sites and intend to expand to a larger number of operating entities in 2004. It also described<br />
how, in 2003, we also began developing a program in relation to the future obligation of our management to<br />
provide a report on internal controls over financial reporting. The first step involved a detailed analysis of our<br />
internal controls. Finally, the report described how, following the evaluation of our disclosure controls by our<br />
different levels of management with the assistance of Internal Audit department, our operating entities are<br />
developing specific action plans to improve their contribution to our disclosure controls.<br />
ITEM 16. [RESERVED]<br />
ITEM 16A. AUDIT COMMITTEE FINANCIAL EXPERT<br />
The Board of Directors, after having reviewed the composition of its Audit Committee, has determined<br />
that Mrs. Hélène Ploix qualifies as the committee’s financial expert in accordance with the audit committee<br />
financial expert requirements set by the Securities and Exchange Commission.<br />
Mrs. Hélène Ploix is an independent director pursuant to Rule 10A-3. She is currently the chairman of<br />
Pechel Industries S.A.S., a French private investment fund and was previously deputy chief operating officer<br />
of the Caisse des Dépôts et Consignations, a French public sector financial institution, and chairman of CDC<br />
155
Participations, the institution’s investment fund, from 1989 to 1995. She served as special advisor for the<br />
single currency at KPMG Peat Marwick from 1995 to 1996.<br />
ITEM 16B. CODE OF ETHICS<br />
We adopted at the beginning of 2004 a code of business conduct that applies to all our officers and<br />
employees. This code promotes:<br />
s compliance with applicable laws and regulations,<br />
s the prevention of conflicts of interests,<br />
s the fact that proper attention be given to people and the environment,<br />
s the protection of the group’s assets,<br />
s fairness in financial reporting, and<br />
s internal controls.<br />
Training sessions will be organized in relation to the principles set out in the code throughout the group.<br />
The full text of the code is available on our website at www.lafarge.com. Amendments to, or waivers from<br />
one or more provisions of, the code will be disclosed on our website.<br />
ITEM 16C. PRINCIPAL ACCOUNTANT FEES AND SERVICES<br />
This table sets out the amount of fees billed for each of the last two fiscal years by our auditors, Deloitte<br />
Touche Tomatsu, in relation to audit services, audit-related services, tax and other services provided to us.<br />
2003 2002<br />
U.S.$ euros U.S.$ euros<br />
(in millions)<br />
Audit Fees ;;;;;;;;;;;;;;;;;;;;;;;; 13.4 10.6 12.5 9.9<br />
Audit-Related Fees ;;;;;;;;;;;;;;;;;;;; 3.5 2.8 4.3 3.4<br />
Tax Fees ;;;;;;;;;;;;;;;;;;;;;;;; 1.0 0.8 0.6 0.5<br />
Other Fees ;;;;;;;;;;;;;;;;;;;;;;;; 0 0 1.4 1.1<br />
Total Fees;;;;;;;;;;;;;;;;;;;;;; 17.9 14.2 18.8 14.9<br />
Deloitte Touche Tohmatsu has responsibility for the audit of the accounts of all of our French and<br />
foreign subsidiaries (except for the accounts of <strong>Lafarge</strong> North America, which are audited by Ernst &<br />
Young).<br />
Fees billed by Deloitte Touche Tohmatsu in 2003 were pre-approved by the Audit Committee and by<br />
our Board of Directors.<br />
Auditors’ pre-approval policies and procedures were approved by our Board of Directors in 2003 and are<br />
contained in its charter. These policies and procedures provide that the Audit Committee shall:<br />
s update every year the list of services that can be provided by the auditors in light of new rules and<br />
regulations in this area (in particular, anticipated independence rules to be issued by the French<br />
Accounting Oversight Council (Haut Conseil du Commissariat aux Comptes) and ensure that the fees<br />
paid by the group to its auditors for services other than audit services (due diligence prior to an<br />
acquisition or disposal of companies in the scope of consolidation, accounting advice and advice on<br />
control procedures prior to an acquisition, audit or advisory services for the benefit of third parties,<br />
specific procedures relating to the consolidation process, the review of information systems and<br />
internal control procedures, the provision of attestations, etc.) do not exceed 60% of the total amount<br />
of audit fees paid,<br />
s pre-approve audit fees relating to (i) the audit of group’s financial statements (including <strong>Lafarge</strong> S.A.<br />
and its subsidiaries), (ii) the issuance of attestation or comfort letters in relation to the filing of a<br />
156
eport or prospectus with a securities commission or another regulator, (iii) assistance in responding to<br />
the request of regulatory authorities, (iv) the issuance of an attestation relating to the Chairman’s<br />
report on internal controls required by French law and (v) advising on certain accounting treatments,<br />
the actual or potential impact of new laws and regulations, the interpretation of French GAAP, IASB,<br />
FASB pronouncements, rules of the Securities and Exchange Commission and any other rules<br />
published by a regulatory body,<br />
s pre-approve engagements relating to tax services (compliance with local tax laws, preparation and<br />
review of tax filings in accordance with applicable rules) and the corresponding fees,<br />
s ensure that auditors do not engage in prohibited services for the group, and<br />
s report the same to the Board of Directors for ratification.<br />
The charter of the Board and its committees provides that the scope of audit services are to be preapproved<br />
for each year. Any amendment to the list of audit services or any fees in excess of those that have<br />
been pre-approved (other than by reason of exchange rate variations) shall be pre-approved by the Audit<br />
Committee and the Board.<br />
Auditors shall confirm every year to the Audit Committee that the services pre-approved are in<br />
compliance with applicable rules and regulations relating to auditor’s independence.<br />
The charter also provides that any engagement letter or service proposal prepared by the auditors shall<br />
be submitted to the Control and Consolidation Department which will verify whether the relevant services are<br />
within the scope of services that have been pre-approved by the Audit Committee, failing which such services<br />
shall be presented to the Audit Committee for approval. Such services may only be initiated when<br />
confirmation has been received that they fall within the scope of services pre-approved by the Audit<br />
Committee or that they have been approved by the Audit Committee.<br />
This table set outs the percentage of fees paid in 2003 for audit-related, tax or other services that have<br />
been pre-approved.<br />
Percentage of fees pre-approved<br />
versus total fees paid in 2003<br />
Audit-Related Fees;;;;;;;;;;;;;;;;;;;;;;;; 100%<br />
Tax Fees ;;;;;;;;;;;;;;;;;;;;;;;;;;;; 100%<br />
Other ;;;;;;;;;;;;;;;;;;;;;;;;;;;;; N/A<br />
ITEM 17. FINANCIAL STATEMENTS<br />
Not applicable.<br />
157
ITEM 18. FINANCIAL STATEMENTS<br />
The following financial statements are filed as part of this registration statement:<br />
<strong>Lafarge</strong> Financial Statements Page<br />
Independent Auditors’ Report;;;;;;;;;;;;;;;;;;;;;;;;;;;;; F-1<br />
Report of Independent Auditors (Ernst & Young) ;;;;;;;;;;;;;;;;;;;; F-2<br />
Report of Independent Public Accountants (Arthur Andersen) ;;;;;;;;;;;;;;; F-3<br />
Report of Independent Auditors (Ernst & Young) ;;;;;;;;;;;;;;;;;;;; F-4<br />
Consolidated Statements of Income for the years ended December 31, 2003, 2002 and 2001 ;;; F-5<br />
Consolidated Balance Sheets at December 31, 2003, 2002 and 2001 ;;;;;;;;;;;;; F-6<br />
Consolidated Statements of Cash Flows for the years ended December 31, 2003, 2002 and 2001 ;<br />
Consolidated Statements of Changes in Shareholders’ Equity for the years ended December 31,<br />
F-7<br />
2003, 2002 and 2001 ;;;;;;;;;;;;;;;;;;;;;;;;;;;;;;; F-8<br />
Notes to the Consolidated Financial Statements ;;;;;;;;;;;;;;;;;;;;; F-9<br />
158
ITEM 19. EXHIBITS<br />
Exhibits<br />
1 By-laws (statuts), as amended, of <strong>Lafarge</strong> S.A. (English translation).*<br />
2 Deposit Agreement, dated July 18, 2001 among <strong>Lafarge</strong> S.A., Morgan Guaranty Trust Company of<br />
New York, as depositary, and the holders of American Depositary Receipts.**<br />
3 Instruments with respect to long-term debt which do not exceed 10 percent of the total assets of the<br />
company and its consolidated subsidiaries have not been filed. The company agrees to furnish a copy<br />
of such instruments to the Commission upon request.<br />
4.1 Merger Agreement, dated January 2001, between <strong>Lafarge</strong> S.A. and Blue Circle Industries.**<br />
4.2 <strong>Lafarge</strong> (U.S.) Holdings Agreement and Articles of Trust, dated August 1, 2000, among <strong>Lafarge</strong> S.A.<br />
and Alfred J. Ross, John H.F. Haskell and The United States Trust Company, as trustees.**<br />
4.2.1 First Amendment to the <strong>Lafarge</strong> (U.S.) Holdings Agreement and Articles of Trust, dated May 23,<br />
2003, among <strong>Lafarge</strong> S.A. and Alfred J. Ross of New York, New York, John H.F. Haskell, Jr. of New<br />
York, The Bank of New York, a New York banking corporation, as trustees.*<br />
4.3 <strong>Lafarge</strong> Paris-Zurich Holdings Agreement and Articles of Trust, dated August 1, 2000, among <strong>Lafarge</strong><br />
(U.S.) Holdings, <strong>Lafarge</strong> (Swiss) Holdings and Alfred J. Ross, John H.F. Haskell and The United<br />
States Trust Company, as trustees.**<br />
4.3.1 <strong>Lafarge</strong> Paris-Zurich Holdings Agreement and Articles of Trust, dated May 23, 2003, among <strong>Lafarge</strong><br />
S.A. and Alfred J. Ross of New York, New York, John H.F. Haskell, Jr. of New York, The Bank of<br />
New York, a New York banking corporation, as trustees.*<br />
4.4 <strong>Lafarge</strong> (Swiss) Holdings Agreement and Articles of Trust, dated August 1, 2000, among Financière<br />
<strong>Lafarge</strong> and Alfred J. Ross, John H.F. Haskell and The United States Trust Company, as trustees.**<br />
4.5 <strong>Lafarge</strong> (Venezuela) Holdings Agreement and Articles of Trust, dated August 1, 2000, among <strong>Lafarge</strong><br />
Asland S.A. and Alfred J. Ross, John H.F. Haskell and The United States Trust Company, as<br />
trustees.**<br />
4.5.1 <strong>Lafarge</strong> (Venezuela) Holdings Agreement and Articles of Trust, dated May 23, 2003, among <strong>Lafarge</strong><br />
S.A. and Alfred J. Ross of New York, New York, John H.F. Haskell, Jr. of New York, The Bank of<br />
New York, a New York banking corporation, as trustees.*<br />
8 List of significant subsidiaries.*<br />
10.1 Certification of Chief Executive Officer Pursuant to Section 906 of the Sarbanes-Oxley Act of 2002<br />
(10 U.S.C. § 1350).*<br />
10.2 Certification of Chief Financial Officer Pursuant to Section 906 of the Sarbanes-Oxley Act of 2002<br />
(10 U.S.C. § 1350).*<br />
11 <strong>Lafarge</strong> Code of business conduct.*<br />
12.1 Certification of Chief Executive Officer pursuant to Rule 13a-14(a).*<br />
12.2 Certification of Chief Financial Officer pursuant to Rule 13a-14(a).*<br />
* Provided herewith.<br />
** Incorporated by reference to the Registration Statement on Form 20-F filed by <strong>Lafarge</strong> with the Securities<br />
and Exchange Commission on July 19, 2001.<br />
159
SIGNATURE<br />
The registrant hereby certifies that it meets all of the requirements for filing on Form 20-F and that it has<br />
duly caused and authorized the undersigned to sign this annual report on its behalf.<br />
Date: March 26, 2004<br />
160<br />
LAFARGE<br />
By:<br />
/s/ BERNARD KASRIEL<br />
Bernard Kasriel<br />
Chief Executive Officer
INDEPENDENT AUDITORS’ REPORTS<br />
To the Board of Directors and shareholders of <strong>Lafarge</strong>:<br />
We have audited the accompanying consolidated balance sheets of <strong>Lafarge</strong> S.A. and subsidiaries (the<br />
‘‘Company’’) at December 31, 2003, 2002 and 2001, and the related consolidated statements of income, changes<br />
in shareholders’ equity, and cash flows for each of the three years in the period ended December 31, 2003 (all<br />
expressed in euros). These consolidated financial statements are the responsibility of the Company’s management.<br />
Our responsibility is to express an opinion on these financial statements based on our audits. We did not audit the<br />
consolidated financial statements of <strong>Lafarge</strong> North America Inc. (formerly <strong>Lafarge</strong> Corporation, a consolidated<br />
subsidiary), which statements reflect total assets constituting 13%, 14% and 14%, respectively, of consolidated<br />
total assets at December 31, 2003, 2002 and 2001, and total sales constituting 22%, 24% and 28%, respectively, of<br />
consolidated total sales for each of the three years in the period ended December 31, 2003. We did not audit the<br />
consolidated balance sheet of Blue Circle North America Inc. (a consolidated subsidiary) at December 31, 2001 or<br />
the related consolidated statements of income, changes in shareholders’ equity or cash flows of Blue Circle North<br />
America Inc. for the period from July 11, 2001 to December 31, 2001, which statements reflect total assets<br />
constituting 3 % of total consolidated assets at December 31, 2001 and total sales constituting 3% of total<br />
consolidated sales for the year ended December 31, 2001. Those statements, prepared in accordance with<br />
accounting principles generally accepted in the United States of America, were audited by other auditors whose<br />
reports have been provided to us, and our opinion, insofar as it relates to the amounts included for <strong>Lafarge</strong> North<br />
America Inc. and Blue Circle North America Inc., is based solely on the reports of such other auditors. The<br />
consolidated financial statements of <strong>Lafarge</strong> North America Inc. at December 31, 2003, and for the year then<br />
ended, were audited by other auditors whose report dated January 21, 2004 expressed an unqualified opinion on<br />
those statements. The consolidated financial statements of <strong>Lafarge</strong> North America Inc. at December 31, 2001 and<br />
for the year then ended were audited by other auditors who have ceased operations and whose report dated<br />
January 22, 2002 expressed an unqualified opinion on those statements before restatement for the transitional<br />
disclosures required by SFAS No. 142.<br />
We conducted our audits in accordance with auditing standards generally accepted in the United States<br />
of America. Those standards require that we plan and perform the audit to obtain reasonable assurance about<br />
whether the consolidated financial statements are free of material misstatement. An audit includes examining,<br />
on a test basis, evidence supporting the amounts and disclosures in the financial statements. An audit also<br />
includes assessing the accounting principles used and significant estimates made by management, as well as<br />
evaluating the overall financial statement presentation. We believe that our audits and the reports of the other<br />
auditors provide a reasonable basis for our opinion. In our opinion, based on our audits and the reports of the<br />
other auditors, such consolidated financial statements present fairly, in all material respects, the financial<br />
position of the Company at December 31, 2003, 2002 and 2001, and the results of its operations and its cash<br />
flows for each of the three years in the period ended December 31, 2003, in conformity with accounting<br />
principles generally accepted in France.<br />
Our audits also included auditing the adjustments to convert the consolidated financial statements of<br />
<strong>Lafarge</strong> North America Inc. and Blue Circle North America Inc. into accounting principles generally accepted<br />
in France for purposes of consolidation.<br />
Accounting principles generally accepted in France vary in certain significant respects from accounting<br />
principles generally accepted in the United States of America. The application of the latter would have<br />
affected the determination of net income for each of the three years in the period ended December 31, 2003,<br />
and the determination of shareholders’ equity at December 31, 2003, 2002 and 2001, to the extent<br />
summarized in Notes 31, 32, 33 and 34.<br />
Our audits also included the translation of the euro amounts into United States dollar amounts and, in<br />
our opinion, such translation has been made in conformity with the basis stated in Note 2 (x). Such United<br />
States dollar amounts are presented solely for the convenience of the readers in the United States of America.<br />
DELOITTE TOUCHE TOHMATSU<br />
Paris, France<br />
March 26, 2004<br />
F-1
REPORTS OF INDEPENDENT AUDITORS<br />
Board of Directors and Shareholders<br />
<strong>Lafarge</strong> North America Inc.:<br />
We have audited the accompanying consolidated balance sheets of <strong>Lafarge</strong> North America Inc. (a<br />
Maryland corporation) and subsidiaries as of December 31, 2003 and 2002, and the related consolidated<br />
statements of income, shareholders’ equity, comprehensive income and cash flows for the years then ended<br />
(not presented separately herein). Our audit also included Financial Statement Schedule II for the years ended<br />
December 31, 2003 and 2002 on page 90 of this Form 10-K (not presented separately herein). These financial<br />
statements and financial statement schedule are the responsibility of the company’s management. Our<br />
responsibility is to express an opinion on these financial statements based on our audits. The consolidated<br />
financial statements and financial statement schedule of <strong>Lafarge</strong> North America Inc. as of December 31, 2001<br />
were audited by other auditors who have ceased operations and whose report dated January 22, 2002<br />
expressed an unqualified opinion on those statements and schedule before the restatement disclosures<br />
described in Note 5.<br />
We conducted our audits in accordance with auditing standards generally accepted in the United States.<br />
Those standards require that we plan and perform an audit to obtain reasonable assurance about whether the<br />
financial statements are free of material misstatement. An audit includes examining, on a test basis, evidence<br />
supporting the amounts and disclosures in the financial statements. An audit also includes assessing the<br />
accounting principles used and significant estimates made by management, as well as evaluating the overall<br />
financial statement presentation. We believe that our audits provide a reasonable basis for our opinion.<br />
In our opinion, the 2003 and 2002 financial statements referred to above present fairly, in all material<br />
respects, the consolidated financial position of <strong>Lafarge</strong> North America Inc. and subsidiaries at December 31,<br />
2003 and 2002, and the consolidated results of their operations and their cash flows for the years then ended,<br />
in conformity with accounting principles generally accepted in the United States. Also, in our opinion, the<br />
related financial statement schedule for the years ended December 31, 2003 and 2002, when considered in<br />
relation to the basic financial statements taken as a whole, present fairly in all material respects the<br />
information set forth therein.<br />
As discussed above, the financial statements of <strong>Lafarge</strong> North America, Inc. and subsidiaries for the year<br />
ended December 31, 2001 were audited by other auditors who have ceased operations. As described in Note<br />
1, these financial statements have been revised to include the transitional disclosures required by Statement of<br />
Financial Accounting Standards No. 142, Goodwill and Other Intangible Assets, which was adopted by the<br />
Company as of January 1, 2002. Our audit procedures with respect to the disclosures in Note 5 with respect<br />
to 2001 included (a) agreeing the previously reported net income to the previously issued financial statements<br />
and the adjustments to reported net income representing amortization expense (including any related tax<br />
effects) recognized in those periods related to goodwill and intangible assets that are no longer being<br />
amortized to the Company’s underlying records obtained from management, and (b) testing the mathematical<br />
accuracy of the reconciliation of adjusted net income to reported net income, and the related earnings-pershare<br />
amounts. In our opinion, the disclosures for 2001 in Note 5 are appropriate. However, we were not<br />
engaged to audit, review, or apply any procedures to the 2001 financial statements of the Company other than<br />
with respect to such disclosures and, accordingly, we do not express an opinion or any form of assurance on<br />
the 2001 financial statements taken as a whole.<br />
As discussed in Note 1 to the consolidated financial statements, in 2002 the Company changed its<br />
method of accounting for goodwill and other intangibles. Also, in 2003 the Company changed its method of<br />
accounting for asset retirement obligations.<br />
ERNST & YOUNG LLP<br />
McLean, Virginia<br />
January 21, 2004<br />
F-2
THIS REPORT SET FORTH BELOW IS A COPY OF A PREVIOUSLY ISSUED AUDIT REPORT BY<br />
ARTHUR ANDERSEN LLP. THIS REPORT HAS NOT BEEN REISSUED BY ARTHUR ANDERSEN<br />
LLP IN CONNECTION WITH ITS INCLUSION IN THIS FORM 20-F.<br />
REPORT OF INDEPENDENT PUBLIC ACCOUNTANT<br />
To <strong>Lafarge</strong> North America Inc.:<br />
We have audited the consolidated balance sheets of <strong>Lafarge</strong> North America Inc. (formerly <strong>Lafarge</strong><br />
Corporation) (a Maryland corporation) and subsidiaries as of December 31, 2001 and 2000, and the related<br />
consolidated statements of income, shareholders’ equity, comprehensive income and cash flows for each of<br />
the three years in the period ended December 31, 2001 (not presented separately herein). These financial<br />
statements are the responsibility of the company’s management. Our responsibility is to express an opinion on<br />
these financial statements based on our audits.<br />
We conducted our audits in accordance with auditing standards generally accepted in the United States.<br />
Those standards require that we plan and perform an audit to obtain reasonable assurance about whether the<br />
financial statements are free of material misstatement. An audit includes examining, on a test basis, evidence<br />
supporting the amounts and disclosures in the financial statements. An audit also includes assessing the<br />
accounting principles used and significant estimates made by management, as well as evaluating the overall<br />
financial statement presentation. We believe that our audits provide a reasonable basis for our opinion.<br />
In our opinion, the financial statements referred to above (not presented separately herein) present fairly,<br />
in all material respects, the financial position of <strong>Lafarge</strong> North America Inc. and subsidiaries as of<br />
December 31, 2001 and 2000, and the results of their operations and their cash flows for each of the three<br />
years in the period ended December 31, 2001, in conformity with accounting principles generally accepted in<br />
the United States.<br />
ARTHUR ANDERSEN LLP<br />
Vienna, Virginia<br />
January 22, 2002<br />
F-3
REPORT OF INDEPENDENT AUDITORS<br />
Board of Directors and Shareholder<br />
Blue Circle North America Inc.<br />
We have audited the consolidated balance sheets of Blue Circle North America Inc. (a wholly-owned<br />
subsidiary of Blue Circle Industries PLC) and Subsidiaries as of July 10, 2001 and December 31, 2001, and<br />
the related consolidated statements of income and retained earnings and cash flows for the periods of<br />
January 1, 2001 through July 10, 2001 and July 11, 2001 through December 31, 2001 and for the year ended<br />
December 31, 2001 (not presented separately herein). These financial statements are the responsibility of the<br />
company’s management. Our responsibility is to express an opinion on these financial statements based on<br />
our audits.<br />
We conducted our audits in accordance with auditing standards generally accepted in the United States.<br />
Those standards require that we plan and perform the audit to obtain reasonable assurance about whether the<br />
financial statements are free of material misstatement. An audit includes examining, on a test basis, evidence<br />
supporting the amounts and disclosures in the financial statements. An audit also includes assessing the<br />
accounting principles used and significant estimates made by management, as well as evaluating the overall<br />
financial statement presentation. We believe that our audits provide a reasonable basis for our opinion.<br />
In our opinion, the financial statements referred to above (not presented separately herein) present fairly,<br />
in all material respects, the consolidated financial position of Blue Circle North America Inc. and Subsidiaries<br />
at July 10, 2001 and December 31, 2001, and the consolidated results of their operations and their cash flows<br />
for the periods of January 1, 2001 through July 10, 2001 and July 11, 2001 though December 31, 2001 and<br />
for the year ended December 31, 2001 in conformity with accounting principles generally accepted in the<br />
United States.<br />
Ernst & Young LLP<br />
Atlanta, Georgia<br />
February 11, 2002<br />
F-4
LAFARGE<br />
CONSOLIDATED STATEMENTS OF INCOME<br />
Notes<br />
Years ended December 31,<br />
2003<br />
(Note 2 x) 2003 2002 2001 (a)<br />
(in million USD<br />
except per<br />
share data)<br />
(in million euros,<br />
except per share data)<br />
Sales ;;;;;;;;;;;;;; (3) 17,205 13,658 14,610 13,698<br />
Cost of goods sold ;;;;;;;; (11,448) (9,088) (9,734) (9,258)<br />
Selling and administrative expenses ; (2,205) (1,750) (1,775) (1,578)<br />
Gross operating income;;;;;; 3,552 2,820 3,101 2,862<br />
Depreciation ;;;;;;;;;;; (3) (1,116) (886) (969) (928)<br />
Operating income on ordinary<br />
activities ;;;;;;;;;;; (3) 2,436 1,934 2,132 1,934<br />
Gains on disposals, net ;;;;;; (6) 377 299 216 274<br />
Other income (expenses), net ;;;; (7) (223) (177) (525) (152)<br />
Operating income ;;;;;;;; (3) 2,590 2,056 1,823 2,056<br />
Financial expenses, net ;;;;;; (8) (716) (568) (521) (544)<br />
Income before income tax, share of<br />
net income of equity affiliates,<br />
amortization of goodwill and<br />
minority interests ;;;;;;; 1,874 1,488 1,302 1,512<br />
Income tax ;;;;;;;;;;; (9) (535) (425) (448) (368)<br />
Income before share of net income of<br />
equity affiliates, amortization of<br />
goodwill and minority interests ; 1,339 1,063 854 1,144<br />
Share of net income of equity affiliates (4) 47 37 33 18<br />
Amortization of goodwill;;;;;; (11) (170) (135) (158) (142)<br />
Minority interests ;;;;;;;;; (21) (299) (237) (273) (270)<br />
Net income ;;;;;;;;;;; 917 728 456 750<br />
Earnings per share (euros) ;;;; (10) 6.20 4.92 3.52 5.97<br />
Diluted earnings per share (euros) ; (10) 6.01 4.77 3.49 5.85<br />
Average number of outstanding shares<br />
(in thousands) ;;;;;;;;; (10) 147,949 147,949 129,629 125,616<br />
(a) Revised for the change in presentation of equity affiliates (Note 4).<br />
The proforma statement of income including Blue Circle Industries from January 1, 2001 is set forth in<br />
Note 5.<br />
The accompanying notes are an integral part of these consolidated financial statements<br />
F-5
LAFARGE<br />
CONSOLIDATED BALANCE SHEETS<br />
At December 31,<br />
Notes<br />
2003<br />
(Note 2 x) 2003 2002 2001<br />
(in million USD) (in million euros)<br />
ASSETS<br />
Goodwill, net;;;;;;;;;;;; (11) 5,227 4,149 4,633 4,974<br />
Intangible assets, net ;;;;;;;;; (11) 3,556 2,823 2,835 3,225<br />
Property, plant and equipment, net ;;; (12) 13,103 10,402 11,667 13,353<br />
Investments in equity affiliates;;;;; (13) 483 383 652 439<br />
Other investments ;;;;;;;;;; (14) 606 481 462 671<br />
Other long-term assets ;;;;;;;; (15) 1,020 810 919 900<br />
Long-term assets ;;;;;;;;;; 23,995 19,048 21,168 23,562<br />
Inventories, net ;;;;;;;;;;; (16) 1,791 1,422 1,591 1,776<br />
Accounts receivable-trade, net ;;;;; (17) 2,210 1,754 1,816 2,230<br />
Other receivables ;;;;;;;;;; (18) 1,231 977 955 1,133<br />
Cash and cash equivalents *;;;;;; (19) 2,058 1,634 1,109 1,201<br />
Current assets ;;;;;;;;;;; 7,290 5,787 5,471 6,340<br />
Total assets ;;;;;;;;;;;; (3) 31,285 24,835 26,639 29,902<br />
SHAREHOLDERS’ EQUITY AND<br />
LIABILITIES<br />
Common stock ;;;;;;;;;;; (20) 843 669 532 521<br />
Additional paid-in capital ;;;;;;; (20) 7,304 5,798 4,546 4,324<br />
Retained earnings ;;;;;;;;;; 5,105 4,053 3,548 3,389<br />
Cumulative translation adjustments ;;; (2,941) (2,335) (1,645) (352)<br />
Shareholders’ equity ;;;;;;;; 10,311 8,185 6,981 7,882<br />
Minority interests ;;;;;;;;;; (21) 2,760 2,191 2,155 2,551<br />
Other equity ;;;;;;;;;;;; (22) 149 118 134 163<br />
Deferred taxes ;;;;;;;;;;; (9) 1,096 870 979 937<br />
Provisions ;;;;;;;;;;;;; (23) 2,339 1,857 1,922 1,688<br />
Long-term debt ;;;;;;;;;;; (24) 9,284 7,370 10,271 11,041<br />
Long-term liabilities ;;;;;;;; 15,628 12,406 15,461 16,380<br />
Accounts payable, trade ;;;;;;; 1,554 1,234 1,205 1,467<br />
Other payables ;;;;;;;;;;; (26) 2,123 1,685 1,938 2,310<br />
Current portion of long-term debt ;;; (24) 1,241 985 524 1,350<br />
Short-term bank borrowings ;;;;;; (24) 428 340 530 513<br />
Current liabilities ;;;;;;;;; 5,346 4,244 4,197 5,640<br />
Total shareholders’ equity and liabilities 31,285 24,835 26,639 29,902<br />
* At December 31, 2003 ‘‘Cash and cash equivalents’’ includes treasury shares for 71 million euros, which<br />
aim at covering employee stock purchase option plans.<br />
The accompanying notes are an integral part of these consolidated financial statements<br />
F-6
LAFARGE<br />
CONSOLIDATED STATEMENTS OF CASH FLOWS<br />
Years ended December 31,<br />
Notes<br />
2003<br />
(Note 2 x) 2003 2002 2001<br />
(in million<br />
USD)<br />
(in million euros)<br />
NET CASH PROVIDED BY OPERATING<br />
ACTIVITIES<br />
Net income ;;;;;;;;;;;;;;;;;;;;<br />
Adjustments to reconcile net income to net cash provided<br />
by operating activities:<br />
917 728 456 750<br />
Minority interests ;;;;;;;;;;;;;;;;; (21) 299 237 273 270<br />
Depreciation and amortization of assets and goodwill<br />
Share of net income of equity affiliates less dividends<br />
;; 1,286 1,021 1,127 1,070<br />
received ;;;;;;;;;;;;;;;;;;;; (14) (11) (17) —<br />
Gains on disposals, net ;;;;;;;;;;;;;;; (6) (377) (299) (216) (274)<br />
Deferred income taxes and tax provisions ;;;;;;; 19 15 92 (59)<br />
Other, net ;;;;;;;;;;;;;;;;;;;; 136 108 241 (89)<br />
Changes in operating working capital items (see analysis<br />
below) ;;;;;;;;;;;;;;;;;;;; 366 290 (165) 174<br />
Net cash provided by operating activities;;;;;;;<br />
NET CASH USED IN INVESTING ACTIVITIES<br />
2,632 2,089 1,791 1,842<br />
Capital expenditures ;;;;;;;;;;;;;;;; (3) (1,089) (864) (1,149) (1,455)<br />
Investment in consolidated companies (1)* ;;;;;;; (275) (218) (337) (4,537)<br />
Investment in non-consolidated companies ;;;;;;; (128) (102) (27) (81)<br />
Disposals (2) ;;;;;;;;;;;;;;;;;;; 760 603 725 1,537<br />
Net (increase) decrease in other long-term assets ;;;; (116) (92) 14 (143)<br />
Net cash used in investing activities ;;;;;;;;;<br />
NET CASH PROVIDED BY FINANCING ACTIVITIES<br />
(848) (673) (774) (4,679)<br />
Proceeds from issuance of common stock ;;;;;;; 1,811 1,438 260 1,513<br />
(Increase) decrease in treasury shares ;;;;;;;;; — — (4) —<br />
Increase (decrease) in other equity ;;;;;;;;;;<br />
Dividends paid (including those paid to minority interests in<br />
— — — 2<br />
subsidiaries) ;;;;;;;;;;;;;;;;;; (498) (395) (388) (337)<br />
Proceeds from long-term debt ;;;;;;;;;;;; 218 173 642 5,596<br />
Repayment of long-term debt ;;;;;;;;;;;; (2,572) (2,042) (751) (4,746)<br />
Increase (decrease) in short-term debt ;;;;;;;;; (50) (40) (685) 282<br />
Net cash (used in) provided by financing activities;;; (1,091) (866) (926) 2,310<br />
(Decrease) Increase in cash and cash equivalents ;;;<br />
Net effect of foreign currency translation on cash and cash<br />
693 550 91 (527)<br />
equivalents ;;;;;;;;;;;;;;;;;;; (132) (105) (183) (12)<br />
Treasury shares reclassification 100 80 — —<br />
Cash and cash equivalents at beginning of year ;;;;; 1,397 1,109 1,201 1,740<br />
Cash and cash equivalents at end of year ;;;;;; (19) 2,058 1,634 1,109 1,201<br />
(1) Net of cash and cash equivalents of companies acquired 31 25 — 256<br />
(2) Net of cash and cash equivalents of companies disposed of 5 4 1 2<br />
SUPPLEMENTAL DISCLOSURES<br />
Analysis of changes in operating working capital items<br />
(Increase) decrease in inventories ;;;;;;;;;;; 43 34 (40) 35<br />
(Increase) decrease in accounts receivable-trade ;;;;; (48) (38) 446 85<br />
(Increase) decrease in other receivables ;;;;;;;; (89) (71) 11 (50)<br />
Increase (decrease) in accounts payable-trade ;;;;;; 108 86 (532) (46)<br />
Increase (decrease) in other payables ;;;;;;;;; 352 279 (50) 150<br />
Cash payments during the period for<br />
Interest expense ;;;;;;;;;;;;;;;;;; 592 470 604 503<br />
Income taxes ;;;;;;;;;;;;;;;;;;; 503 399 442 234<br />
* including Blue Circle Industries (3,804) for the year 2001<br />
The accompanying notes are an integral part of these consolidated financial statements<br />
F-7
LAFARGE<br />
CONSOLIDATED STATEMENTS OF CHANGES IN SHAREHOLDERS’ EQUITY<br />
Outstanding<br />
shares<br />
Treasury<br />
shares<br />
Common<br />
stock<br />
Additional<br />
paid-in<br />
capital<br />
Retained<br />
earnings<br />
Cumulative<br />
translation<br />
adjustments<br />
Shareholders’<br />
equity<br />
Comprehensive<br />
income<br />
(in number of shares) (in million euros) (in million euros)<br />
Balance at January 1, 2001 ;;; 112,441,935 1,837,840 429 3,028 2,910 (324) 6,043 (154)<br />
Net income ;;;;;;;;;; — — — — 752 (2) 750 750<br />
Dividends paid ;;;;;;;;; — — — — (273) — (273) —<br />
Issuance of rights (conversion to<br />
common stock) ;;;;;;; 14,110,592 — 54 1,059 — — 1,113 —<br />
Issuance of common stock (dividend<br />
reinvestment plan) ;;;;;; 1,125,007 — 5 103 — — 108 —<br />
Exercise of stock options ;;;; 369,455 — 1 16 — — 17 —<br />
Exercise of stock subscription<br />
warrants ;;;;;;;;;; 2,098,811 — 8 142 — — 150 —<br />
Purchase of treasury shares ;;;; — 26,532 — — — — — —<br />
Change in translation adjustments ; — — 24 (24) — (26) (26) (26)<br />
Balance at December 31, 2001 ;; 130,145,800 1,864,372 521 4,324 3,389 (352) 7,882 724<br />
Net income ;;;;;;;;;; — — — — 460 (4) 456 456<br />
Dividends paid ;;;;;;;;; — — — — (297) — (297) —<br />
Issuance of common stock (dividend<br />
reinvestment plan) ;;;;;; 1,400,494 — 5 127 — — 132 —<br />
Exercise of stock options ;;;; 171,583 — 1 7 — — 8 —<br />
Employee stock purchase plan ;; 708,718 — 3 42 — — 45 —<br />
Issuance of common stock<br />
(Cementia exchange offer) ;;; 453,838 — 2 46 — — 48 —<br />
Purchase of treasury shares ;;;; — 56,587 — — (4) — (4) —<br />
Change in translation adjustments ; — — — — — (1,289) (1,289) (1,289)<br />
Balance at December 31, 2002 ;; 132,880,433 1,920,959 532 4,546 3,548 (1,645) 6,981 (833)<br />
Net income ;;;;;;;;;; — — — — 728 — 728 728<br />
Dividends paid ;;;;;;;;; — — — — (303) — (303) —<br />
Issuance of common stock ;;;; 31,831,528 — 127 1,135 — — 1,262 —<br />
Issuance of common stock (dividend<br />
reinvestment plan) ;;;;;; 2,391,039 — 10 111 — — 121 —<br />
Exercise of stock options ;;;; 114,813 — — 6 — — 6 —<br />
Treasury shares* ;;;;;;;; — (1,122,989) — — 80 — 80 —<br />
Change in translation adjustments ; — — — — — (690) (690) (690)<br />
Balance at December 31, 2003 ;; 167,217,813 797,970 669 5,798 4,053 (2,335) 8,185 38<br />
* As of December 31, 2003, treasury shares, which aim at covering employee stock purchase option plans,<br />
are classified as short-term investments.<br />
The accompanying notes are an integral part of these consolidated financial statements<br />
F-8
LAFARGE<br />
NOTES TO THE CONSOLIDATED FINANCIAL STATEMENTS<br />
Note 1 — Business Description<br />
As used herein, the terms ‘‘<strong>Lafarge</strong> S.A.’’ or ‘‘the parent company’’ refers to <strong>Lafarge</strong>, a société anonyme<br />
organized under French law, without its consolidated subsidiaries. The terms the ‘‘Company’’ or ‘‘<strong>Lafarge</strong>’’<br />
refer to <strong>Lafarge</strong> S.A. together with its consolidated subsidiaries.<br />
The Company is headquartered in France and specializes in the production of materials for the<br />
construction industry in all the world’s major markets. At December 31, 2003, the Company operated in the<br />
following business segments: Cement, Aggregates and Concrete, Roofing and Gypsum. The Company’s<br />
customers are from both the private and public sectors.<br />
<strong>Lafarge</strong> is listed on the ‘‘Premier Marché‘‘ of Euronext Paris S.A. and, since July 23, 2001, on the New<br />
York Stock Exchange (‘‘NYSE’’).<br />
Note 2 — Summary of Significant Accounting Policies<br />
(a) Basis of preparation<br />
The consolidated financial statements of the Company have been prepared in accordance with the<br />
provisions of French accounting legislation and standards (‘‘French GAAP’’).<br />
French GAAP differs in certain respects from accounting principles generally accepted in the United<br />
States of America (‘‘US GAAP’’). A description of the main differences is set forth in Notes 31, 32 and 33.<br />
(b) Principles of consolidation<br />
Investments over which the Company has direct or indirect control of more than 50% of the outstanding<br />
voting shares, or over which it exercises effective control, are fully consolidated. Control exists when the<br />
Company has the power directly or indirectly, to govern the financial and operating policies of an enterprise<br />
so as to obtain benefits from its activities.<br />
Investments in companies in which the Company and third party investors have agreed to exercise joint<br />
control are consolidated by the proportionate consolidation method with the Company’s share of the joint<br />
ventures results of operations, assets and liabilities recorded in the consolidated financial statements.<br />
Investments in which the Company has an equity interest representing a voting right of more than 20%<br />
and over which the Company exercises significant influence, but not control, are accounted for under the<br />
equity method.<br />
All other investments in affiliates, which are not consolidated, are accounted for at cost.<br />
Revenues and expenses of subsidiaries acquired or disposed of during the year are recognized in the<br />
consolidated statements of income from the initial date of control or up to the date control was transferred,<br />
respectively.<br />
All significant intercompany balances and transactions have been eliminated in consolidation. With<br />
respect to proportionately consolidated companies, intercompany transactions are eliminated on the basis of<br />
the Company’s interest in the entity involved.<br />
(c) Use of estimates<br />
The preparation of financial statements in conformity with French GAAP requires the use of estimates<br />
and assumptions that affect the reported amounts of assets and liabilities, such as depreciation and provisions,<br />
the disclosure of contingent assets and liabilities at the date of the financial statements and the reported<br />
amounts of revenues and expenses. Management reviews its estimates on an ongoing basis using currently<br />
F-9
available information. Changes in facts and circumstances may result in revised estimates, and actual results<br />
could differ from the estimates.<br />
(d) Translation of financial statements denominated in foreign currencies<br />
The functional currency of the Company’s foreign subsidiaries is the applicable foreign currency except<br />
for enterprises operating in hyper-inflationary economies. The accounts of foreign subsidiaries outside the<br />
Euro zone are translated into the Euro using the year end closing rate of exchange for all balance sheet<br />
accounts and the average annual rate of exchange is applied to revenues, expenses and amounts presented on<br />
the statements of cash flows. The resulting translation adjustments are included as a separate component of<br />
shareholders’ equity.<br />
For companies that operate in countries, which have been designated as hyper-inflationary, fixed assets,<br />
investments and operating supplies are not revalued and the original values are translated to the US dollar,<br />
which is considered by the Company as the functional currency in these countries, at historical rates of<br />
exchange. Revenues and expenses are translated to this functional currency using the exchange rates of the<br />
month of the transaction date. Translation gains and losses arising from the translation of revenues and<br />
expenses are included in income. In defining hyper-inflationary, the Company employs criteria, which include<br />
characteristics of the economic environment, such as inflation and foreign currency exchange rate fluctuations,<br />
and evaluates this information in relation to its economic exposure in the subsidiaries’ operations.<br />
The exchange rates for the translation of main currencies were as follows:<br />
1 for euro monetary unit 2003 2002 2001<br />
Average<br />
rate<br />
Year end<br />
rate<br />
Average<br />
rate<br />
Year end<br />
rate<br />
Average<br />
rate<br />
Year end<br />
rate<br />
Brazilian real (BRL) ;;;; 0.2871 0.2727 0.3619 0.2690 0.4745 0.4866<br />
Canadian dollar (CAD) ;;; 0.6320 0.6160 0.6743 0.6065 0.7209 0.7123<br />
Chilean peso (CLP) ;;;; 0.0013 0.0013 0.0015 0.0013 0.0018 0.0017<br />
Chinese yuan (CNY) ;;;; 0.1068 0.0957 0.1279 0.1152 0.1349 0.1371<br />
Egyptian pound (EGP) ;;; 0.1499 0.1277 0.2290 0.2062 0.2768 0.2469<br />
British pound (GBP) ;;;; 1.4452 1.4188 1.5903 1.5373 1.6081 1.6434<br />
Moroccan dirham (MAD) ;; 0.0922 0.0902 0.0961 0.0937 0.1000 0.0976<br />
Malaysian ringitt (MYR) ;; 0.2326 0.2083 0.2784 0.2509 0.2937 0.2986<br />
Nigerian naira (NGN);;;; 0.0068 0.0057 0.0088 0.0075 0.0096 0.0101<br />
Philippine peso (PHP) ;;; 0.0163 0.0143 0.0205 0.0178 0.0219 0.0220<br />
Polish zloty (PLN) ;;;;; 0.2273 0.2127 0.2595 0.2487 0.2725 0.2861<br />
US dollar (USD) ;;;;;; 0.8842 0.7918 1.0582 0.9536 1.1165 1.1347<br />
Venezuelan bolivar (VEB) ;; 0.0006 0.0005 0.0009 0.0007 * *<br />
South African rand (ZAR) ;; 0.1172 0.1201 0.1010 0.1110 0.1296 0.0959<br />
* Designated as hyper-inflationary<br />
LAFARGE<br />
NOTES TO THE CONSOLIDATED FINANCIAL STATEMENTS — (Continued)<br />
(e) Business combinations<br />
Since January 1, 1989, all business combinations have been accounted for using the purchase method of<br />
accounting. Under this method, assets and liabilities acquired by the Company are recorded at their fair value.<br />
Under the purchase method, the excess of the purchase price over the fair value of the net assets acquired, if<br />
any, is allocated to goodwill. Before January 1, 1989, positive and negative goodwill were written off against<br />
retained earnings.<br />
When the Company initially acquires a controlling interest in a business, any portion of the assets and<br />
liabilities retained by minority shareholders is also recorded at its fair value.<br />
F-10
LAFARGE<br />
NOTES TO THE CONSOLIDATED FINANCIAL STATEMENTS — (Continued)<br />
Accordingly, if the Company subsequently acquires the assets and liabilities considered held by minority<br />
shareholders, no additional fair value adjustment is recorded at that time.<br />
Initial estimates of fair values are finalized within a one-year allocation period. Subsequent to this<br />
period, releases of estimated provisions in excess of the actual costs incurred related to the purchase price<br />
allocation are applied to goodwill.<br />
Non-amortizable intangible assets, such as market share and trademarks, are recognized through the<br />
purchase price allocation to the extent that they can be valued using a sufficiently accurate and objective<br />
method based on economic benefits. This value is reviewed periodically on the same basis.<br />
The Company amortizes goodwill on a straight-line basis over the estimated period of benefit, up to 40<br />
years, which reflects the long-term nature of our business.<br />
Negative goodwill is amortized into income on a rational, systematic basis, based upon estimates of<br />
future operating results of the acquiree at the date of the acquisition.<br />
(f) Revenue recognition<br />
Consolidated revenues represent the value, before sales tax, of goods, products and services sold by<br />
consolidated enterprises in the ordinary activities and after elimination of intra-group sales.<br />
Revenues from the sale of goods and products are recorded when ownership is transferred.<br />
Amounts billed to a customer in a sales transaction related to shipping and handling are included in<br />
‘‘Sales’’, and costs incurred by the seller for shipping and handling are classified as ‘‘Cost of goods sold.’’<br />
(g) Other income (expenses)<br />
Other income (expenses) results from operations and includes net restructuring costs, provisions for<br />
litigation and other non-recurring items.<br />
(h) Intangible assets<br />
Intangible assets include software, mineral rights, and real estate development rights. Market shares and<br />
trademarks, which are valued as described in Note 2 (e), are not amortized.<br />
Intangible assets are amortized using the straight-line method over their useful lives ranging from 3 to 5<br />
years, except for mineral rights, which are amortized based upon tonnes extracted, and real estate<br />
development rights, which are amortized over the estimated life of the development program.<br />
(i) Property, plant and equipment<br />
Property, plant and equipment is recorded at historical cost. The Company capitalizes assets financed<br />
through capital leases where the lease arrangement transfers to the Company substantially all the benefits and<br />
risks of ownership. Lease arrangement are evaluated upon the following criteria:<br />
s leased assets expected period of future benefit in relation to the assets’ useful lives,<br />
s the total future payments in relation to the fair value of the financed assets<br />
s existence of transfer of ownership,<br />
s existence of a favorable purchase option.<br />
Interest on borrowings directly related to the financing of construction projects and incurred during<br />
development activities is capitalized to project costs.<br />
F-11
LAFARGE<br />
NOTES TO THE CONSOLIDATED FINANCIAL STATEMENTS — (Continued)<br />
Depreciation on property, plant and equipment is calculated as follows:<br />
s Land is not depreciated.<br />
s Mineral reserves consisting of proven and probable limestone, gypsum and aggregates reserves are<br />
depleted using the units-of-production method<br />
s Buildings are depreciated using the straight-line method over estimated useful lives varying from 20<br />
years for industrial buildings to 50 years for offices or residential properties.<br />
s Plant, machinery, equipment and installation costs are depreciated using the straight-line method over<br />
their estimated useful lives, ranging from 8 to 30 years.<br />
Beginning January 1, 2002, the historical cost of cement plant assets are reclassified into specific cost<br />
categories based upon their distinct characteristics. Each cost category represents cement plant components<br />
with specific useful lives. This new definition was based on a detailed technical study performed by the<br />
Company. Prior to January 1, 2002, cement plant assets had been depreciated over estimated useful lives,<br />
using a broader definition of cost classification.<br />
The new system of classifying costs has been applied prospectively as of January 1, 2002. On average,<br />
for a new cement plant, this change in estimate has resulted in increasing the depreciable useful life from 20<br />
years to 28 years, which more closely reflects actual experience with modern cement plants.<br />
Accordingly, the new definition of cost categories and related useful lives has reduced the annual<br />
depreciation expense. The impact on results for year ended December 31, 2002 are as follows: operating<br />
income on ordinary activities improved by 83 million euros; income before share of net income of equity<br />
affiliates, amortization of goodwill and minority interests increased by 58 million euros. Net income increased<br />
by 46 million euros, basic earning per share increased by 0.36 euro.<br />
(j) Other investments<br />
Other investments, which consist either of shares held in non consolidated companies or shares in listed<br />
companies treated as long-term equity investments are recorded at the lower of historical cost or net<br />
realizable value, assessed on an individual investment basis. The net realizable value is measured according<br />
to such criteria as the Group share of net assets, the stock price or expected future profitability, weighted by<br />
the effects of holding these investments in terms of the Company’s strategy, or synergy with existing<br />
businesses.<br />
(k) Impairment of long-lived assets<br />
Goodwill and market share<br />
The net book value of goodwill and market share is reviewed annually to take into consideration factors<br />
that may have affected the assets value and recoverability. Our four divisions have been considered as the<br />
four segments of the Company including reporting units, defined as being in general the activity of a segment<br />
in a country. In some specific cases, a reporting unit may be composed of different activities in one or several<br />
countries, or similar activities in several countries. The reporting unit is the level used by the Company to<br />
organize and present activities and results in its internal reporting.<br />
In its goodwill and market share impairment test, the Company uses a combination of a market approach<br />
and an income approach. In the market approach, we compare the carrying value of our reporting units with<br />
multiples of their Gross Operating Income. For reporting units presenting an impairment risk according to the<br />
market approach we then use the income approach. In the income approach, we estimate the discounted value<br />
of the sum of the expected future cash flows. If the carrying value of the reporting unit is higher than the<br />
F-12
LAFARGE<br />
NOTES TO THE CONSOLIDATED FINANCIAL STATEMENTS — (Continued)<br />
measured fair value of the related assets and liabilities, the Company records extraordinary amortization of<br />
goodwill and market share to reduce the carrying value of the reporting unit to its determined fair value.<br />
Evaluations for impairment are significantly impacted by estimates of future prices for our products, the<br />
evolution of expenses, economic trends in the local and international construction sector, the expectations on<br />
long-term development of emerging markets and other factors. This also depends on the discount rates used.<br />
The Company has defined country specific discount rates for each of its reporting units based on their<br />
Weighted Average Cost of Capital. In some cases, the Company uses a third party valuation as part of its<br />
impairment test.<br />
Property, plant and equipment<br />
Whenever events or changes in circumstances indicate that the carrying amount of property, plant and<br />
equipment may not be recoverable, the carrying value is compared with the estimated undiscounted future<br />
cash flows expected to result from the use of the assets and their possible disposition. If the sum of expected<br />
future cash flows is less than the carrying amount of these assets, an impairment loss is recognized, based on<br />
the fair value of these assets, derived from the present value of expected future cash flows.<br />
(l) Inventories<br />
Inventories are stated at the lower of cost or market. Cost is determined using the weighted-average<br />
method.<br />
(m) Cash and cash equivalents<br />
Cash and cash equivalents consist of cash and highly liquid investments with an original maturity date of<br />
generally less than three months from the time of purchase.<br />
Starting January 1, 2003, cash equivalents include treasury shares owned to cover employee stock<br />
purchase option plan. They are accounted for at their historical cost and impaired when the market value is<br />
less than the carrying amount of these stocks.<br />
(n) Financial instruments<br />
The Company enters into financial derivative contracts for hedging purposes only. These transactions are<br />
executed in order to reduce its exposure to changes in interest rates and foreign currency exchange rates on<br />
firm or highly probable commitments.<br />
Forward exchange contracts and foreign currency swaps are used to hedge foreign currency exchange<br />
rate exposures. Unrealized gains and losses on these investments are recorded in the carrying amount of the<br />
hedged asset or liability on firm commitments. Contract premiums are amortized rate ably over the term of<br />
the hedge arrangement.<br />
The Company enters into various interest rate swaps to manage its interest rate exposure. The objective<br />
of the swaps is, depending on the circumstances, to modify instruments from fixed rate to floating and<br />
floating rate to fixed. The difference between interest payable and receivable is recognized as interest expense<br />
or interest income.<br />
F-13
LAFARGE<br />
NOTES TO THE CONSOLIDATED FINANCIAL STATEMENTS — (Continued)<br />
(o) Pensions, end of service benefits and other post retirement benefits<br />
Defined contribution plans<br />
The Company accounts for pension costs related to defined contribution pension plans as they are<br />
incurred.<br />
Defined benefit plans<br />
Estimates of the Company’s pension and end of service benefit obligations are calculated annually with<br />
the assistance of independent actuaries, using the projected unit credit method. This method considers best<br />
estimate actuarial assumptions including, the probable future length of the employees’ service, the employees’<br />
final pay and the expected average life span of the employees.<br />
The Company’s obligations are discounted by country based upon discount rates appropriate in the<br />
circumstances. The obligations are recognized based upon the proportion of benefits earned by employees as<br />
services are rendered.<br />
Fair values are used to determine the market value of fund assets.<br />
For most defined benefit plans, changes in actuarial assumptions which affect the value of the obligations<br />
and the differences between expected and actual long-term return on plan assets are accounted for as actuarial<br />
gains and losses.<br />
Current period pension expense is comprised of the increase in the obligation, which results from the<br />
additional benefit earned by employees in the period, and interest expense, which results from the outstanding<br />
pension obligation. The amounts described above are reduced by the expected return on plan assets. Actuarial<br />
gains and losses which exceed a corridor corresponding to 10% of the greater of the fair value of plans assets<br />
or plan obligations are amortized to income over future periods.<br />
Modifications of pension plans are, in general, amortized over the expected average remaining service<br />
lives of the related employees.<br />
Other post retirement benefits<br />
Certain of the Company’s subsidiaries offer to their employee’s supplementary post-retirement medical<br />
coverage. These costs are calculated based upon actuarial determinations and are recorded over the expected<br />
average remaining service lives of the employees.<br />
(p) Restructuring<br />
Reserves for restructuring costs are provided when the restructuring plans have been finalized and<br />
approved by the company’s management, have been announced before the balance sheet date and result in an<br />
obligation to third parties. Such costs may include estimated facility closing costs and employees’ severance<br />
and termination benefits.<br />
Where a business combination has occurred, restructuring costs related to capacity reductions of the<br />
acquirer which are a consequence of overcapacity and costs related to capacity reductions of the acquiree are<br />
included in the cost of the acquisition.<br />
(q) Site restoration<br />
Where the Company is legally or contractually required to restore a quarry site, the estimated costs of<br />
site restoration are accrued and amortized to cost of goods sold rate ably, on a unit-of-production basis, over<br />
F-14
LAFARGE<br />
NOTES TO THE CONSOLIDATED FINANCIAL STATEMENTS — (Continued)<br />
the operating life of the quarry. The estimated future costs for known restoration requirements are determined<br />
on a site by site basis and, are calculated based on the present value of estimated future costs.<br />
(r) Environmental costs<br />
Costs that result in future economic benefits such as extending useful lives, increased capacity, safety or,<br />
those costs incurred to mitigate or prevent future environmental contamination are capitalized. When the<br />
Company determines that it is probable that a liability for environmental costs exists, an undiscounted<br />
estimate of the future remediation is recorded as a provision without the offset of potential insurance<br />
recoveries. Environmental costs, which are not included above, are expensed as incurred.<br />
(s) Product warranties<br />
The Company’s warranty policy generally provides a 30-year coverage for roofing tile. The Company’s<br />
policy is to accrue the undiscounted estimated cost of warranty coverage at the time the sale is recorded.<br />
(t) Deferred income taxes<br />
Deferred income taxes are accounted for using the balance-sheet liability method on temporary<br />
differences between the tax basis of assets and liabilities and their carrying amounts in the balance sheet<br />
(including tax losses available for carry forward). Deferred taxes are measured by applying currently enacted<br />
tax laws. Deferred tax assets are recognized when it is reasonably certain that they will be recovered in future<br />
years.<br />
(u) Research and development<br />
The Company is committed to improving its manufacturing process, maintaining product quality and<br />
meeting existing and future customer needs. These objectives are pursued through various programs. Research<br />
and development costs which are expensed as incurred, were 56 million euros, 55 million euros and 53 million<br />
euros for 2003, 2002 and 2001, respectively.<br />
(v) Recently issued accounting pronouncement<br />
In December 2000, the ‘‘Comité de la Réglementation Comptable’’ issued the regulation (règlement)<br />
nº 2000-06 which requires French publicly-traded companies to adopt new accounting rules related to the<br />
recognition of liabilities for fiscal years beginning on or after January 1, 2002. The regulation defines a<br />
liability as future sacrifices of economic benefits and assets and requires that a liability be recognized when<br />
an enterprise has a present obligation (legal, regulatory, or contractual) with a third party as a result of a past<br />
event and it is probable or certain that an outflow of resources embodying economic benefits will be required<br />
to settle the obligation. The adoption of this regulation had no effect on the consolidated financial statements.<br />
(w) Transition to IFRS<br />
European Regulation nº 1606/2002 issued July 19, 2002, requires all European companies listed on a<br />
regulated market to use the International Accounting Standards endorsed at the European level (IAS or<br />
IFRS(1) standards) to prepare their consolidated financial statements, effective 2005.<br />
Accordingly, the 2005 consolidated financial statements of the Company will be prepared in accordance<br />
with this set of standards, which requires 2004 comparative data to be presented on the same basis.<br />
Given the potential consequences of the switch to these new principles, the Company set up a project<br />
structure during the fourth quarter of 2002 dedicated to the management of the transition process. This<br />
structure gathers:<br />
F-15
LAFARGE<br />
NOTES TO THE CONSOLIDATED FINANCIAL STATEMENTS — (Continued)<br />
s A project team assisted by specialized external consultants;<br />
s Working groups made up, depending on the topic examined, of operational and functional<br />
representatives of the Company and<br />
s A Steering Committee.<br />
Over 2003, the following stages have been reached:<br />
s Identification of differences between IFRS and French GAAP with a focus on the issues relevant to the<br />
different businesses of the Company;<br />
s Drafting of a Company Accounting Principles Handbook compliant with IFRS, including<br />
implementation guidance by Division, which considers the specificity’s of each business and<br />
s Analysis of the implied changes in information systems.<br />
Over 2004, the Company will:<br />
s Finalize the Company Accounting Principles Handbook based on standards published or revised and<br />
endorsed in 2004 (Business Combinations, Impairment of assets, Intangible assets, Share-based<br />
Payments);<br />
s Train the various teams involved in producing the consolidated financial statements.<br />
All stages are validated by the Statutory Auditors.<br />
At this time, the impact of the transition cannot be estimated precisely.<br />
The Company continues to examine the different treatments available in some of the standards<br />
(including, among others, those in IFRS1 — First-time Adoption of IFRS).<br />
Issues that may potentially impact the Company’s consolidated financial statements, as presented in<br />
accordance with IFRS are,:<br />
s Financial instruments<br />
s Post-employment benefits<br />
s Recognition and depreciation of intangible assets, goodwill and market shares<br />
s Share-based payments<br />
Moreover, uncertainties remain in relation to standards currently drafted or in revision and not yet<br />
published by the International Accounting Standards Board (‘‘IASB’’) concerning:<br />
s Business Combinations<br />
s Intangible assets and impairment of long-lived assets<br />
(x) Convenience translation<br />
The consolidated balance sheet and consolidated statements of income and cash flows include the<br />
presentations of amounts as of and for the year ended December 31, 2003 denominated in US dollars. These<br />
amounts are presented for the convenience of the reader and have been prepared using an exchange rate of<br />
1.00 Euro to 1.2597 USD which was the Noon Buying Rate on December 31, 2003. Such translation should<br />
not be construed as representation that the Euro amount has been, could have been, or could in the future be,<br />
converted into US dollar at that or any other exchange rate.<br />
(1) International Financial Reporting Standards (IFRS) is the new label of IAS effective May 2002.<br />
F-16
LAFARGE<br />
NOTES TO THE CONSOLIDATED FINANCIAL STATEMENTS — (Continued)<br />
Note 3 — Business Segment and Geographic Area Information<br />
Operating segments are defined as components of an enterprise for which separate financial information<br />
is available and is evaluated regularly by the Company’s chief operating decision makers in order to allocate<br />
resources and assess performance.<br />
Since January 1, 2001, the Company has operated in the following four business segments: Cement,<br />
Aggregates and Concrete, Roofing and Gypsum, each of which represent separately managed strategic<br />
business units that have different capital requirements and marketing strategies. Each of the business<br />
segments is managed separately because each business segment develops, manufactures and sells distinct<br />
products.<br />
Company management internally evaluates its performance based upon operating income on ordinary<br />
activities (defined as operating income before net gains on disposals and other expenses, net) and capital<br />
employed (defined as the total of goodwill, intangible and tangible assets, investments in equity affiliates and<br />
working capital) as disclosed in its business segment and geographic area information.<br />
s The Cement segment produces and sells a wide range of cement and hydraulic binders adapted to the<br />
needs of the construction industry.<br />
s The Aggregates and Concrete segment produces and sells construction aggregates, ready mix concrete<br />
and other concrete products.<br />
s The Roofing segment produces and sells roof tiles, roofing accessories and chimney systems.<br />
s The Gypsum segment mainly produces and sells drywall for the commercial and residential<br />
construction sectors.<br />
The accounting policies applied to the segment earnings are in agreement with those described in Note 2.<br />
F-17
(a) Business segment information<br />
LAFARGE<br />
NOTES TO THE CONSOLIDATED FINANCIAL STATEMENTS — (Continued)<br />
Cement<br />
Aggregates<br />
and Concrete Roofing Gypsum Other Total<br />
(in million euros)<br />
2003<br />
Gross sales ;;;;;;;;;;;;;;; 6,945 4,483 1,510 1,204 106 14,248<br />
Less: intersegment ;;;;;;;;;;;; (562) (18) — (10) — (590)<br />
Sales ;;;;;;;;;;;;;;;;; 6,383 4,465 1,510 1,194 106 13,658<br />
Depreciation ;;;;;;;;;;;;;; (491) (192) (116) (66) (21) (886)<br />
Operating income on ordinary activities ;;; 1,466 283 142 84 (41) 1,934<br />
Operating income ;;;;;;;;;;;; 1,431 309 88 74 154 2,056<br />
Share of net income of equity affiliates ;;; 42 5 8 12 (30) 37<br />
Investments in equity affiliates ;;;;;;; 218 15 75 42 33 383<br />
Goodwill, net ;;;;;;;;;;;;;; 2,400 715 798 188 48 4,149<br />
Capital employed ;;;;;;;;;;;; 12,324 3,080 2,180 1,123 284 18,991<br />
Total assets;;;;;;;;;;;;;;; 14,365 4,617 2,592 1,381 1,880 24,835<br />
Capital expenditures ;;;;;;;;;;; 502 172 88 58 44 864<br />
2002<br />
Gross sales ;;;;;;;;;;;;;;; 7,520 4,787 1,538 1,155 210 15,210<br />
Less: intersegment ;;;;;;;;;;;; (572) (19) — (9) — (600)<br />
Sales ;;;;;;;;;;;;;;;;; 6,948 4,768 1,538 1,146 210 14,610<br />
Depreciation ;;;;;;;;;;;;;; (545) (216) (116) (69) (23) (969)<br />
Operating income on ordinary activities ;;; 1,606 336 132 51 7 2,132<br />
Operating income ;;;;;;;;;;;; 1,694 349 72 8 (300) 1,823<br />
Share of net income of equity affiliates ;;; 49 3 10 8 (37) 33<br />
Investments in equity affiliates ;;;;;;; 248 15 72 33 284 652<br />
Goodwill, net ;;;;;;;;;;;;;; 2,704 796 888 183 62 4,633<br />
Capital employed ;;;;;;;;;;;; 13,584 3,220 2,415 1,177 610 21,006<br />
Total assets;;;;;;;;;;;;;;; 15,417 4,835 2,856 1,423 2,108 26,639<br />
Capital expenditures ;;;;;;;;;;; 707 212 90 83 57 1,149<br />
2001<br />
Gross sales ;;;;;;;;;;;;;;; 6,476 4,824 1,585 1,064 243 14,192<br />
Less: intersegment ;;;;;;;;;;;; (481) (18) — 8 (3) (494)<br />
Sales ;;;;;;;;;;;;;;;;; 5,995 4,806 1,585 1,072 240 13,698<br />
Depreciation ;;;;;;;;;;;;;; (511) (214) (118) (66) (19) (928)<br />
Operating income on ordinary activities (a);; 1,434 378 128 3 (9) 1,934<br />
Operating income (a);;;;;;;;;;; 1,397 415 75 (7) 176 2,056<br />
Share of net income of equity affiliates (a) ;; 45 3 10 3 (43) 18<br />
Investments in equity affiliates ;;;;;;; 250 20 51 50 68 439<br />
Goodwill, net ;;;;;;;;;;;;;; 2,598 884 1,072 186 234 4,974<br />
Capital employed ;;;;;;;;;;;; 14,825 4,058 2,677 1,279 514 23,353<br />
Total assets;;;;;;;;;;;;;;; 17,416 5,798 3,182 1,554 1,952 29,902<br />
Capital expenditures ;;;;;;;;;;; 894 288 131 117 25 1,455<br />
(a) Revised for the change in presentation of equity affiliates (Note 4).<br />
F-18
(b) Geographic area information<br />
Sales<br />
2003 2002 2001<br />
Property,<br />
plant and<br />
equipment,<br />
net<br />
LAFARGE<br />
NOTES TO THE CONSOLIDATED FINANCIAL STATEMENTS — (Continued)<br />
Capital<br />
employed Sales<br />
Property,<br />
plant and<br />
equipment,<br />
net<br />
Capital<br />
employed Sales<br />
Property,<br />
plant and<br />
equipment,<br />
net<br />
Capital<br />
employed<br />
(in million euros)<br />
Western Europe ; 5,776 4,309 8,532 6,005 4,455 9,113 5,490 4,814 9,945<br />
Of which:<br />
France ;;;; 2,036 1,074 1,611 2,007 1,052 1,587 1,945 1,113 1,399<br />
Germany ;;; 624 841 1,137 642 846 1,529 747 944 1,770<br />
Spain ;;;;; 464 270 938 616 271 1,074 592 355 833<br />
United Kingdom 1,376 1,039 2,460 1,483 1,166 2,513 1,140 1,229 3,265<br />
North America ;; 3,840 2,621 4,230 4,405 3,077 4,955 4,431 3,598 5,241<br />
Of which:<br />
United States;; 2,549 1,931 3,160 3,071 2,373 3,883 2,898 2,785 3,926<br />
Canada ;;;; 1,291 690 1,070 1,334 704 1,072 1,533 813 1,315<br />
Mediterranean Basin 530 501 861 562 628 1,031 637 850 1,310<br />
Central and Eastern<br />
Europe ;;;; 696 644 1,098 661 713 1,124 514 623 1,016<br />
Latin America ;; 613 384 861 720 416 892 760 650 1,292<br />
Africa ;;;;; 921 468 913 869 580 969 765 716 1,084<br />
Asia / Pacific;;; 1,282 1,475 2,496 1,388 1,798 2,922 1,101 2,102 3,465<br />
Total ;;;;;; 13,658 10,402 18,991 14,610 11,667 21,006 13,698 13,353 23,353<br />
F-19
LAFARGE<br />
NOTES TO THE CONSOLIDATED FINANCIAL STATEMENTS — (Continued)<br />
Note 4 — Share of Net Income of Equity Affiliates<br />
PRESENTATION OF SHARE OF NET INCOME OF EQUITY AFFILIATES<br />
As of January 1, 2002, the share of net income of equity affiliates determined in accordance with equity<br />
method consolidation principles is shown in the Company’s consolidated statement of income on a specific<br />
line ‘‘share of net income of equity affiliates’’.<br />
Prior to the adoption of this presentation, the Company’s share of net income of equity affiliates was<br />
presented in the following line-items: ‘‘Operating income on ordinary activities’’, ‘‘Gains on disposals, net’’,<br />
‘‘Other income (expenses), net’’, ‘‘Financial expenses, net’’ and ‘‘Income tax’’.<br />
The presentation of the consolidated statements of income for 2001 have been revised for comparative<br />
purposes with 2002 and 2003 in the schedule below:<br />
Year ended December 31, 2001<br />
Reclassifi-<br />
Published cations<br />
(in million euros)<br />
Revised<br />
Sales ;;;;;;;;;;;;;;;;;;;;;;;;;; 13,698 — 13,698<br />
Cost of goods sold;;;;;;;;;;;;;;;;;;;;; (9,258) — (9,258)<br />
Selling and administrative expenses;;;;;;;;;;;;;; (1,578) — (1,578)<br />
Gross operating income ;;;;;;;;;;;;;;;;;; 2,862 — 2,862<br />
Depreciation ;;;;;;;;;;;;;;;;;;;;;;; (928) — (928)<br />
Share of operating income on ordinary activities of equity affiliates; 131 (131) —<br />
Operating income on ordinary activities ;;;;;;;;;;; 2,065 (131) 1,934<br />
Gains on disposals, net ;;;;;;;;;;;;;;;;;;; 275 (1) 274<br />
Other income (expenses), net ;;;;;;;;;;;;;;;; (169) 17 (152)<br />
Operating income ;;;;;;;;;;;;;;;;;;;; 2,171 (115) 2,056<br />
Financial expenses, net ;;;;;;;;;;;;;;;;;;; (595) 51 (544)<br />
Income before income tax, share of net income of equity<br />
affiliates, amortization of goodwill and minority interests;;; 1,576 (64) 1,512<br />
Income tax ;;;;;;;;;;;;;;;;;;;;;;;; (414) 46 (368)<br />
Income before share of net income of equity affiliates,<br />
amortization of goodwill and minority interests ;;;;;;; 1,162 (18) 1,144<br />
Share of net income of equity affiliates ;;;;;;;;;;;; — 18 18<br />
Amortization of goodwill ;;;;;;;;;;;;;;;;;; (142) — (142)<br />
Minority interests ;;;;;;;;;;;;;;;;;;;;; (270) — (270)<br />
Net income ;;;;;;;;;;;;;;;;;;;;;;; 750 — 750<br />
F-20
LAFARGE<br />
NOTES TO THE CONSOLIDATED FINANCIAL STATEMENTS — (Continued)<br />
The following details the Company’s share of the operations of equity affiliates:<br />
Years ended December 31,<br />
2003 2002 2001<br />
(in million euros)<br />
Operating income on ordinary activities ;;;;;;;;;;;;;;;;; 164 146 131<br />
Gain on disposals, net ;;;;;;;;;;;;;;;;;;;;;;;; — — 1<br />
Other expenses, net ;;;;;;;;;;;;;;;;;;;;;;;;; (46) (21) (17)<br />
Financial expenses, net;;;;;;;;;;;;;;;;;;;;;;;; (34) (41) (51)<br />
Income tax ;;;;;;;;;;;;;;;;;;;;;;;;;;;; (47) (51) (46)<br />
Share of net income of equity affiliates ;;;;;;;;;;;;;;;; 37 33 18<br />
Note 5 — Pro Forma Financial Information<br />
The following pro forma condensed consolidated statements of income present the results of operations<br />
for the years ended December 31, 2001 assuming the acquisition of the retained businesses of Blue Circle<br />
Industries Plc (‘‘Blue Circle’’) (Note 11 (c)) had taken place at the beginning of fiscal 2001.<br />
This pro forma information does not purport to be indicative of the historical performance that would<br />
have resulted had the acquisition actually occurred at such date, nor is it necessarily indicative of future<br />
operating results. The other purchase and sale transactions that occurred during 2001, 2002 and 2003 have no<br />
significant effects on these pro forma results.<br />
These pro forma results, which have been submitted to a limited review by the Auditors, have been<br />
prepared based upon the historical consolidated financial statements of the Company and Blue Circle<br />
Industries Plc. The historical consolidated financial statements have been adjusted (see the « pro forma<br />
adjustments » columns) in order to reflect increases or decreases in financing costs and other adjustments<br />
related to the acquisitions and dispositions of Blue Circle. The pro-forma adjustments reflect the effects of the<br />
minority interests acquisition in Republic Cement Company in the Philippines in September 2001.<br />
The pro-forma adjustments also include the effects of the following disposals:<br />
— North American assets subject to regulatory rulings, which were disposed of during the second half<br />
of 2001,<br />
— and the real estate properties disposed of in the UK in 2001.<br />
The pro-forma disclosures also reflect the amortization of acquisition goodwill and the effects of other<br />
adjustments and reclassifications necessary to present the historical accounts of Blue Circle on a basis<br />
consistent with the Company’s accounting policies.<br />
F-21
Condensed consolidated statements of income for the years ended December 31, 2003 and December 31,<br />
2002 and pro forma condensed consolidated statement of income for the year ended December 31, 2001<br />
2003 2002<br />
Pro forma<br />
2001 (1)<br />
(in million euros, except per share data)<br />
Sales;;;;;;;;;;;;;;;;;;;;;;;;;;; 13,658 14,610 15,436<br />
Depreciation;;;;;;;;;;;;;;;;;;;;;;;; (886) (969) (1,074)<br />
Operating income on ordinary activities ;;;;;;;;;;; 1,934 2,132 2,156<br />
Gains on disposals, net/other income (expenses), net ;;;;;;; 122 (309) 114<br />
Financial expenses, net ;;;;;;;;;;;;;;;;;;; (568) (521) (752)<br />
Income tax ;;;;;;;;;;;;;;;;;;;;;;;; (425) (448) (388)<br />
Income before share of net income of equity affiliates,<br />
amortization of goodwill and minority interests ;;;;;;; 1,063 854 1,130<br />
Share of net income of equity affiliates;;;;;;;;;;;;; 37 33 8<br />
Amortization of goodwill ;;;;;;;;;;;;;;;;;; (135) (158) (172)<br />
Minority interests ;;;;;;;;;;;;;;;;;;;;; (237) (273) (277)<br />
Net income ;;;;;;;;;;;;;;;;;;;;;;;; 728 456 689<br />
Earnings per share (Euros) ;;;;;;;;;;;;;;;;; 4.92 3.52 5.40<br />
Diluted earnings per share (Euros);;;;;;;;;;;;;; 4.77 3.49 5.28<br />
(1) Limited review by auditors<br />
LAFARGE<br />
NOTES TO THE CONSOLIDATED FINANCIAL STATEMENTS — (Continued)<br />
Additional information on the pro forma consolidated statement of income for the year ended<br />
December 31, 2001<br />
Blue Circle<br />
historical<br />
(6 months<br />
<strong>Lafarge</strong> period ended Pro forma Total<br />
historical June 30, 2001) adjustments Pro forma<br />
2001 (a) (1)<br />
(1) 2001 (1)<br />
(in million euros)<br />
Sales ;;;;;;;;;;;;;;;;;;;;; 13,698 1,929 (191) 15,436<br />
Depreciation ;;;;;;;;;;;;;;;;;;<br />
Share of operating income on ordinary activities of<br />
(928) (134) (12) (1,074)<br />
equity affiliates ;;;;;;;;;;;;;;;; — 8 (8) —<br />
Operating income on ordinary activities ;;;;;; 1,934 291 (69) 2,156<br />
Gains on disposals, net/other income (expenses), net;; 122 — (8) 114<br />
Financial expenses, net;;;;;;;;;;;;;; (544) (119) (89) (752)<br />
Income tax;;;;;;;;;;;;;;;;;;; (368) (50) 30 (388)<br />
Income before share of net income of equity affiliates,<br />
amortization of goodwill and minority interests;; 1,144 122 (136) 1,130<br />
Share of net income of equity affiliates ;;;;;;; 18 — (10) 8<br />
Amortization of goodwill ;;;;;;;;;;;;; (142) — (30) (172)<br />
Minority interests ;;;;;;;;;;;;;;;; (270) (11) 4 (277)<br />
Net income ;;;;;;;;;;;;;;;;;; 750 111 (172) 689<br />
(a) Revised for the change in presentation of equity affiliates (Note 4)<br />
(1) Limited review by auditors<br />
F-22
LAFARGE<br />
NOTES TO THE CONSOLIDATED FINANCIAL STATEMENTS — (Continued)<br />
Note 6 — Gains on Disposals, Net<br />
Components of gains on disposals, net are as follows:<br />
Years ended December 31,<br />
2003 2002 2001 (a)<br />
Gain on disposals of consolidated subsidiaries, net ;;;;;;;;;;; 139<br />
(in million euros)<br />
24 44<br />
Gain on sale of shares in listed companies, net ;;;;;;;;;;;;; — — 205<br />
Gain on sale of other long-term assets, net ;;;;;;;;;;;;;; 160 192 25<br />
Gains on disposals, net ;;;;;;;;;;;;;;;;;;;;;; 299 216 274<br />
(a) Revised for the change in presentation of equity affiliates (Note 4)<br />
Note 7 — Other Income (Expenses), Net<br />
Components of other income (expenses) are as follows:<br />
Years ended December 31,<br />
2003 2002 2001 (a)<br />
Restructuring costs;;;;;;;;;;;;;;;;;;;;;;;; (65)<br />
(in million euros)<br />
(89) (69)<br />
Depreciation ;;;;;;;;;;;;;;;;;;;;;;;;;; (35) (47) (33)<br />
Other expenses, net ;;;;;;;;;;;;;;;;;;;;;;; (77) (389) (50)<br />
Other income (expenses), net ;;;;;;;;;;;;;;;;;;; (177) (525) (152)<br />
(a) Revised for the change in presentation of equity affiliates (Note 4)<br />
Depreciation consists principally of increases to depreciation expense resulting from revisions in<br />
depreciable lives to reflect changes in operating lives of assets including changes due to planned replacements<br />
of assets.<br />
In 2002, ‘‘Other expenses, net’’ includes a provision of 300 million euros related to the risk arising from<br />
the ‘‘competition’’ litigation risk (Note 28 — Litigations).<br />
Note 8 — Financial Expenses, Net<br />
Components of financial expenses are as follows:<br />
Years ended December 31,<br />
2003 2002 2001 (a)<br />
Interest income ;;;;;;;;;;;;;;;;;;;;;;;;; 78<br />
(in million euros)<br />
103 116<br />
Interest expense ;;;;;;;;;;;;;;;;;;;;;;;;; (518) (571) (647)<br />
Net interest income (expenses) ;;;;;;;;;;;;;;;;;; (440) (468) (531)<br />
Other financial expenses, net;;;;;;;;;;;;;;;;;;;; (128) (53) (13)<br />
Financial expenses, net ;;;;;;;;;;;;;;;;;;;;; (568) (521) (544)<br />
(a) Revised for the change in presentation of equity affiliates (Note 4)<br />
Interest expense is reported net of capitalized interest costs for construction projects of 7 million euros in<br />
2003 (40 million euros in 2002 and 16 million euros in 2001).<br />
Exchange losses disclosed in ‘‘Other financial expenses, net’’ amount to 75 million euros in 2003<br />
(exchange gains amounted to 66 million euros in 2002 and 49 million euros in 2001).<br />
F-23
Note 9 — Income Tax and Deferred Income Taxes<br />
The income tax expense for the year is equal to the amount paid or payable in the short term to the tax<br />
authorities in respect of the financial year, in accordance with currently applicable tax rules and rates in the<br />
various countries, taking into account the taxation regime described below.<br />
Pursuant to the provisions of the French Tax Code (Article 209 quinquies), and in accordance with a tax<br />
agreement from the French Tax Authorities, the parent company files a world-wide consolidated tax return.<br />
This regime provides that the basis for income tax computation of the parent company is not limited to<br />
French consolidated subsidiaries but also applies to foreign entities in which <strong>Lafarge</strong> owns more than 50%.<br />
Under this provision, the parent company’s consolidated taxable income is calculated based upon the rules of<br />
French Tax Law for its operations in France as well as those of its greater than 50% owned foreign<br />
subsidiaries.<br />
Within certain limits, the French Tax Code allows for the reduction of the taxable income of profitable<br />
companies by the offsetting of taxable losses of other entities. French income tax payable, as determined by<br />
the method described above, allows for the application of foreign taxes, due in local jurisdictions and related<br />
to greater than 50% owned foreign entities, to be applied as a credit to income taxes due in France. This tax<br />
agreement covers the years presented and expired on December 31, 2003. The Company decided not to renew<br />
the agreement beyond December 31, 2003.<br />
(a) Income tax<br />
Components of the income tax are as follows:<br />
LAFARGE<br />
NOTES TO THE CONSOLIDATED FINANCIAL STATEMENTS — (Continued)<br />
Years ended December 31,<br />
2003 2002 2001 (a)<br />
(in million euros)<br />
Current income tax ;;;;;;;;;;;;;;;;;;;;;;;; 432 346 367<br />
French companies ;;;;;;;;;;;;;;;;;;;;;; 7 34 12<br />
Foreign companies ;;;;;;;;;;;;;;;;;;;;;; 425 312 355<br />
Deferred income tax ;;;;;;;;;;;;;;;;;;;;;;; (7) 102 1<br />
French companies ;;;;;;;;;;;;;;;;;;;;;; (9) 15 58<br />
Foreign companies ;;;;;;;;;;;;;;;;;;;;;; 2 87 (57)<br />
Income tax ;;;;;;;;;;;;;;;;;;;;;;;;;;; 425 448 368<br />
(a) Revised for the change in presentation of equity affiliates (Note 4)<br />
F-24
LAFARGE<br />
NOTES TO THE CONSOLIDATED FINANCIAL STATEMENTS — (Continued)<br />
(b) Effective tax rate<br />
A reconciliation of the world-wide tax consolidation rate to the Company’s effective tax rate is as<br />
follows:<br />
Years ended December 31,<br />
2003 2002 2001 (a)<br />
% % %<br />
World-wide tax consolidation rate;;;;;;;;;;;;;;;;;; 33.3 33.3 33.3<br />
Capital gains taxed at a reduced rate ;;;;;;;;;;;;;;;; (2.4) (1.3) (4.9)<br />
Provision for ‘‘Competition’’ litigation risk ;;;;;;;;;;;;;; — 7.6 —<br />
Effect of foreign tax rate differentials ;;;;;;;;;;;;;;;; — — 0.8<br />
Changes in enacted tax rates in Canada (2001/2003) ;;;;;;;;;; 0.3 — (1.0)<br />
Change in valuation allowance on deferred tax assets ;;;;;;;;;; 0.3 (1.8) —<br />
Other ;;;;;;;;;;;;;;;;;;;;;;;;;;;;; (2.9) (3.4) (3.9)<br />
Effective tax rate ;;;;;;;;;;;;;;;;;;;;;;;; 28.6 34.4 24.3<br />
(a) Revised for the change in presentation of equity affiliates (Note 4)<br />
(c) Deferred tax assets and liabilities<br />
Components of the deferred tax balances are as follows:<br />
At December 31,<br />
2003 2002 2001<br />
(in million euros)<br />
Pensions and other post-retirement benefits ;;;;;;;;;;;;; 186 177 99<br />
Property, plant and equipment ;;;;;;;;;;;;;;;;;; 210 361 409<br />
Provisions and other current liabilities ;;;;;;;;;;;;;;; 180 195 171<br />
Restructuring provisions ;;;;;;;;;;;;;;;;;;;;; 17 61 23<br />
Net operating loss and tax credit carry forwards ;;;;;;;;;;; 947 553 234<br />
Net capital loss carry forwards ;;;;;;;;;;;;;;;;;; 569 225 257<br />
Deferred tax assets ;;;;;;;;;;;;;;;;;;;;;; 2,109 1,572 1,193<br />
Valuation allowance ;;;;;;;;;;;;;;;;;;;;;; (1,192) (582) (315)<br />
Net deferred tax assets ;;;;;;;;;;;;;;;;;;;;; 917 990 878<br />
Property, plant and equipment ;;;;;;;;;;;;;;;;;; 1,504 1,522 1,509<br />
Prepaid pension assets;;;;;;;;;;;;;;;;;;;;;; 169 205 169<br />
Other, net ;;;;;;;;;;;;;;;;;;;;;;;;;;; 114 242 137<br />
Deferred tax liabilities ;;;;;;;;;;;;;;;;;;;;; 1,787 1,969 1,815<br />
Net deferred tax liabilities ;;;;;;;;;;;;;;;;;;; 870 979 937<br />
F-25
LAFARGE<br />
NOTES TO THE CONSOLIDATED FINANCIAL STATEMENTS — (Continued)<br />
(d) Tax credit and capital loss carry forwards<br />
At December 31, 2003, the Company has net operating loss and tax credit carry forwards and capital<br />
loss carry forwards of approximately 2,836 million euros and 1,999 million euros respectively, which will<br />
expire as follows:<br />
NOL’s and tax credits<br />
carry forwards<br />
Capital loss carry<br />
forwards Total<br />
(in million euros)<br />
2004 ;;;;;;;;;;;;;;;;;;;; 679 13 692<br />
2005 ;;;;;;;;;;;;;;;;;;;; 366 — 366<br />
2006 ;;;;;;;;;;;;;;;;;;;; 269 1 270<br />
2007 ;;;;;;;;;;;;;;;;;;;; 233 127 360<br />
2008 ;;;;;;;;;;;;;;;;;;;; 357 28 385<br />
2009 and thereafter ;;;;;;;;;;;;;; 932 1,830 2,762<br />
Total ;;;;;;;;;;;;;;;;;;; 2,836 1,999 4,835<br />
Note 10 — Earnings Per Share<br />
Basic earnings per share is computed by dividing income available to common shareholders by the<br />
weighted average number of common shares outstanding during the year.<br />
Diluted earnings per share is computed by dividing income available to common shareholders by the<br />
weighted average number of common shares outstanding during the year adjusted to include any dilutive<br />
potential common shares.<br />
Potential common shares include share options, warrants, and convertible securities issued by the<br />
Company on its own common shares.<br />
F-26
The computation and reconciliation of basic and diluted earnings per share for the years ended<br />
December 31, 2003, 2002 and 2001 are as follows:<br />
2003<br />
Years ended December 31,<br />
2002 2001<br />
Numerator (in million euros)<br />
Net income ;;;;;;;;;;;;;;;;;;;;;;; 728 456 750<br />
Interest expense on convertible debt (OCEANE) ;;;;;;;; 30 — 23<br />
Adjusted net income ;;;;;;;;;;;;;;;;;;; 758 456 773<br />
Denominator (in thousands of shares)<br />
Weighted average number of shares outstanding ;;;;;;;; 147,949 129,629 125,616<br />
Effect of dilutive securities — stock options ;;;;;;;;;; 310 918 1,241<br />
Effect of dilutive securities — stock subscription warrants ;;;; — — 100<br />
Effect of dilutive securities — convertible debt (OCEANE);;;; 10,769 — 5,118<br />
Total potential dilutive shares ;;;;;;;;;;;;;;;; 11,079 918 6,459<br />
Weighted average number of shares outstanding — fully diluted ;; 159,028 130,547 132,075<br />
Basic earnings per share (euros) ;;;;;;;;;;;;;; 4.92 3.52 5.97<br />
Diluted earnings per share (euros) ;;;;;;;;;;;;; 4.77 3.49 5.85<br />
Note 11 — Goodwill and Intangible Assets, Net<br />
(a) Changes in goodwill, net<br />
LAFARGE<br />
NOTES TO THE CONSOLIDATED FINANCIAL STATEMENTS — (Continued)<br />
2003 2002 2001<br />
(in million euros)<br />
Goodwill, net, at January 1 ;;;;;;;;;;;;;;;;;;; 4,633 4,974 2,820<br />
Amortization ;;;;;;;;;;;;;;;;;;;;;;;;;; (135) (158) (142)<br />
Additions ;;;;;;;;;;;;;;;;;;;;;;;;;;; 135 145 2,284<br />
Disposals ;;;;;;;;;;;;;;;;;;;;;;;;;;; (19) (35) (6)<br />
Acquisition adjustments ;;;;;;;;;;;;;;;;;;;;; (125) 134 (14)<br />
Translation adjustments ;;;;;;;;;;;;;;;;;;;;; (340) (427) 32<br />
Goodwill, net, at December 31 ;;;;;;;;;;;;;;;;;; 4,149 4,633 4,974<br />
The acquisition adjustments include the adjustments, which arise from the finalization of the purchase<br />
price allocation to the fair value of acquired assets and liabilities assumed on business combinations.<br />
F-27
Goodwill recognized before January 1, 1989 was written off against retained earnings. The analysis of<br />
the residual net amount of this goodwill had it been recorded in the balance sheet and subsequently<br />
amortized, is as follows:<br />
2003 2002 2001<br />
(in million euros)<br />
Goodwill, net, at January 1 ;;;;;;;;;;;;;;;;;;;;; 60 63 66<br />
Amortization ;;;;;;;;;;;;;;;;;;;;;;;;;;;; (3) (3) (3)<br />
Disposals ;;;;;;;;;;;;;;;;;;;;;;;;;;;;; — — —<br />
Goodwill, net, at December 31 ;;;;;;;;;;;;;;;;;;;; 57 60 63<br />
(b) Changes in intangible assets, net<br />
LAFARGE<br />
NOTES TO THE CONSOLIDATED FINANCIAL STATEMENTS — (Continued)<br />
Market share and<br />
trademarks Other Total<br />
(in million euros)<br />
At January 1, 2001 ;;;;;;;;;;;;;;;;;;; 903 374 1,277<br />
Additions ;;;;;;;;;;;;;;;;;;;;;;; 2,070 100 2,170<br />
Disposals ;;;;;;;;;;;;;;;;;;;;;;; (1) (24) (25)<br />
Other changes ;;;;;;;;;;;;;;;;;;;;; (13) 32 19<br />
Translation adjustments;;;;;;;;;;;;;;;;;; (10) 4 (6)<br />
At December 31, 2001 ;;;;;;;;;;;;;;;;;; 2,949 486 3,435<br />
Accumulated depreciation ;;;;;;;;;;;;;;;;; — (210) (210)<br />
Net book value at December 31, 2001 ;;;;;;;;;;; 2,949 276 3,225<br />
At January 1, 2002 ;;;;;;;;;;;;;;;;;;; 2,949 486 3,435<br />
Additions ;;;;;;;;;;;;;;;;;;;;;;; 6 52 58<br />
Disposals ;;;;;;;;;;;;;;;;;;;;;;; (58) (56) (114)<br />
Other changes ;;;;;;;;;;;;;;;;;;;;; (42) 6 (36)<br />
Translation adjustments;;;;;;;;;;;;;;;;;; (252) (33) (285)<br />
At December 31, 2002 ;;;;;;;;;;;;;;;;;; 2,603 455 3,058<br />
Accumulated depreciation ;;;;;;;;;;;;;;;;; — (223) (223)<br />
Net book value at December 31, 2002 ;;;;;;;;;;; 2,603 232 2,835<br />
At January 1, 2003 ;;;;;;;;;;;;;;;;;;; 2,603 455 3,058<br />
Additions ;;;;;;;;;;;;;;;;;;;;;;; 4 66 70<br />
Disposals ;;;;;;;;;;;;;;;;;;;;;;; — (34) (34)<br />
Other changes ;;;;;;;;;;;;;;;;;;;;; (4) 191 187<br />
Translation adjustments;;;;;;;;;;;;;;;;;; (182) (44) (226)<br />
At December 31, 2003 ;;;;;;;;;;;;;;;;;; 2,421 634 3,055<br />
Accumulated depreciation ;;;;;;;;;;;;;;;;; — (232) (232)<br />
Net book value at December 31, 2003 ;;;;;;;;;;; 2,421 402 2,823<br />
F-28
LAFARGE<br />
NOTES TO THE CONSOLIDATED FINANCIAL STATEMENTS — (Continued)<br />
The following table presents details of other intangible assets:<br />
Gross carrying<br />
amount<br />
At December 31, 2003<br />
Accumulated<br />
amortization Net<br />
(in million euros)<br />
Software ;;;;;;;;;;;;;;;;;;;;;;; 202 135 67<br />
Real estate development rights ;;;;;;;;;;;;;; 103 10 93<br />
Mineral rights ;;;;;;;;;;;;;;;;;;;;; 91 9 82<br />
Other intangible assets ;;;;;;;;;;;;;;;;; 238 78 160<br />
Other intangible assets ;;;;;;;;;;;;;;;;; 634 232 402<br />
(c) Acquisitions<br />
s Acquisition <strong>Lafarge</strong> Polska<br />
In November 2003, Sodil (Société de Développement Industriel <strong>Lafarge</strong>) acquired the residual 23%<br />
interest in the shares of its subsidiary <strong>Lafarge</strong> Polska for approximately 84 million euros. <strong>Lafarge</strong> Polska is a<br />
cement company located in Poland already fully consolidated in <strong>Lafarge</strong> Group.<br />
This transaction has been accounted for using the purchase method of accounting. The resulting goodwill<br />
arising from this transaction was 38 million euros.<br />
s Acquisition of Ural Cement<br />
In October 2003, <strong>Lafarge</strong> acquired a 75% interest in the shares of Ural Cement for approximately<br />
14 million euros. Ural cement is a cement company located in Russia.<br />
This transaction has been accounted for using the purchase method of accounting. The resulting goodwill<br />
arising from this transaction was 14 million euros.<br />
s Acquisition of Gyproc<br />
In February 2003, the Company acquired the gypsum boards operations of Gyproc Group for<br />
approximately 63 million euros. Gyproc has a business of Gypsum in Germany, Poland and Central Europe.<br />
Moreover cash acquired amounts to 21 million euros, which means the net investment amounts to<br />
42 million euros.<br />
This transaction has been accounted for using the purchase method of accounting. The purchase price, at<br />
December 31, 2003, has been allocated as follows (in million euros):<br />
Purchase price ;;;;;;;;;;;;;;;;;;;;;;;; 63<br />
Fair value of the net assets acquired ;;;;;;;;;;;;;;; 41<br />
Goodwill, net ;;;;;;;;;;;;;;;;;;;;;;;; 22<br />
s Acquisition of Limay Grinding Mill Corporation<br />
In August 2003, <strong>Lafarge</strong> acquired a 100% interest in the shares of Limay Grinding Mill Corporation in<br />
the Philippines for 22 million euros. This transaction has been accounted for using the purchase method of<br />
accounting. The resulting goodwill arising from this transaction was 18 million euros.<br />
F-29
LAFARGE<br />
NOTES TO THE CONSOLIDATED FINANCIAL STATEMENTS — (Continued)<br />
s Acquisition of Kedah Cement Group<br />
In December 2002, the Company through its 60.83%-owned subsidiary Malayan Cement Berhad (MCB),<br />
acquired the remaining 22.59% equity interest in the Kedah Cement Group not already owned by MCB, for<br />
approximately 57 million euros. Kedah Cement is a group based in Malaysia and engaged in the production<br />
of cement.<br />
This transaction has been accounted for using the purchase method of accounting. The resulting goodwill<br />
arising from this transaction was 37 million euros.<br />
s Acquisition of Cementia Holding AG minorities<br />
In May 2002, <strong>Lafarge</strong> proposed to acquire the residual 2.95% interest in the shares of its subsidiary<br />
Cementia Holding AG, a Swiss publicly-traded company, pursuant to an offer to exchange shares and a<br />
minority interest buy-out as required by Swiss law. The Company issued 453,838 new shares, with a fair<br />
value of 49 million euros for all the outstanding shares. As a consequence, the Company owns 100% of<br />
Cementia Holding AG’ shares as of December, 31 2002.<br />
This transaction has been accounted for using the purchase method of accounting. The resulting goodwill<br />
arising from this transaction was 19 million euros.<br />
s Acquisition of Cementarna Trbovlje<br />
In April and November 2002, our wholly-owned Austrian subsidiary, <strong>Lafarge</strong> Perlmooser acquired an<br />
additional 76.9% of Cementarna Trbovlje, increasing its interest to 99.8%. The purchase price totaled<br />
40 million euros.<br />
This transaction has been accounted for using the purchase method of accounting. The purchase price, at<br />
December 31, 2002, has been allocated as follows (in million euros):<br />
Purchase price ;;;;;;;;;;;;;;;;;;;;;;;; 40<br />
Fair value of the net assets acquired ;;;;;;;;;;;;;;; 39<br />
Goodwill, net ;;;;;;;;;;;;;;;;;;;;;;;; 1<br />
s Acquisition of Beocinska Fabrika Cementa<br />
In April 2002, in connection with the Serbian government’s privatization policy, the Company acquired a<br />
69.4% interest in the Beocinska Fabrika Cementa company for 60 million euros.<br />
This transaction has been accounted for using the purchase method of accounting. The purchase price, at<br />
December 31, 2002, has been allocated as follows (in million euros):<br />
Purchase price ;;;;;;;;;;;;;;;;;;;;;;;; 60<br />
Fair value of the net assets acquired ;;;;;;;;;;;;;;; 12<br />
Goodwill, net ;;;;;;;;;;;;;;;;;;;;;;;; 48<br />
Subsequent to the acquisition, the Company sold 49.98% of its interest in 2002. The Company’s indirect<br />
ownership interest at December 31, 2002 is 34.72%.<br />
s Acquisition of PT Semen Andalas Indonesia<br />
In January 2002, the Company acquired for approximately 11 million euros, an additional 12.33%<br />
interest in PT Semen Andalas Indonesia, a company based in Indonesia and engaged in the production of<br />
F-30
LAFARGE<br />
NOTES TO THE CONSOLIDATED FINANCIAL STATEMENTS — (Continued)<br />
cement. Previously, the Company held an 87.66% interest in PT Semen Andalas Indonesia. Following the<br />
transaction, the Company’s interest increased to 99.99%.<br />
This transaction has been accounted for using the purchase method of accounting. The resulting goodwill<br />
arising from this transaction was 7 million euros.<br />
s Acquisition of Continental Gypsum<br />
In January 2002, <strong>Lafarge</strong> North America acquired Continental Gypsum. Continental Gypsum is an<br />
independent drywall manufacturer, based in Newark, New Jersey with a annual production capacity of<br />
28 million meter square. The purchase price for the Continental Gypsum plant and other assets was<br />
approximately 32 million euros.<br />
This transaction has been accounted for using the purchase method of accounting. The purchase price, at<br />
December 31, 2002, has been allocated as follows (in million euros):<br />
Purchase price ;;;;;;;;;;;;;;;;;;;;;;;; 32<br />
Fair value of the net assets acquired ;;;;;;;;;;;;;;; 20<br />
Goodwill, net ;;;;;;;;;;;;;;;;;;;;;;;; 12<br />
s Acquisition of Blue Circle Industries Plc<br />
On July 11, 2001, pursuant to a merger agreement between the Company and the Board of Directors of<br />
Blue Circle Plc (BCI) dated January 8, 2001, which was approved by the shareholders of Blue Circle on<br />
February 19, 2001, and after the completion of regulatory approvals in Europe and North America, the<br />
Company consummated the acquisition of Blue Circle, an international producer of cement and related<br />
construction materials headquartered and publicly listed in the United Kingdom.<br />
The Company initiated this acquisition when it acquired approximately 20% of the common stock of<br />
Blue Circle, in April 2000, through an unsolicited tender offer, which was subsequently rejected by the<br />
shareholders of Blue Circle. In conjunction with that offer, Dresdner Bank (‘‘Dresdner’’) acquired, for its own<br />
account, approximately 10% of BCI’s outstanding common stock. Based upon a contractual agreement<br />
between the Company and Dresdner, any profits resulting from Dresdner’s disposal of its holding in BCI’s<br />
common stock were to be shared between Dresdner and the Company.<br />
Total consideration for the acquisition of Blue Circle amounted to 5,322 million euros at December 31,<br />
2002 (5,280 million euros at December 31, 2001). It mainly includes:<br />
— the shares acquired in 2000 for 1,022 million euros,<br />
— the shares acquired in 2001 for 3,804 million euros (net of cash acquired),<br />
— the cash acquired for 248 million euros,<br />
— additional minority interests acquisition for 147 million euros<br />
It was substantially financed from the proceeds of the February 9, 2001 rights offering (Note 20), the<br />
issuance of a convertible note (Note 24), the Company’s short-term credit facilities and short-term<br />
borrowings.<br />
The acquisition was accounted for using the purchase method of accounting with the results of<br />
operations of BCI, other than those entities referred to below, included in the Company’s consolidated<br />
statements of income from the date of acquisition.<br />
F-31
LAFARGE<br />
NOTES TO THE CONSOLIDATED FINANCIAL STATEMENTS — (Continued)<br />
As a consequence of the regulatory approval process in North America, the Company was required by<br />
the Canadian Competition Bureau and by the U.S. Federal Trade Commission to dispose of certain Blue<br />
Circle operations in Canada and in the United States, primarily in the Great Lakes region. The Company, for<br />
accounting purposes, has treated these assets as held for sale from the date of acquisition. The results of<br />
operations associated with these entities, for the period from acquisition to disposal, are not reflected in the<br />
Company’s consolidated income statement.<br />
The carrying value of these assets on acquisition was recorded at an amount which reflected the expected<br />
proceeds of disposition after taking into consideration the net effect of operations during the hold period and<br />
interest costs associated with the incremental borrowings related to the acquisition of these entities. As a<br />
consequence of the above accounting, no gain or loss was recorded on the disposal of these operations<br />
subsequent to the acquisition date. These dispositions have resulted in net proceeds to the Company of<br />
882 million euros, which was used to reduce the Company debt at December 31, 2001.<br />
All required dispositions resulting from the rulings of the Canadian and American regulatory authorities<br />
were completed as of December 31, 2001.<br />
Restructuring provision<br />
Management has adopted formal plans to reduce the capacity of specific operations acquired as well as<br />
its own operations. These costs most significantly relate to impairment charges, employee relocation and<br />
severance, facility closure costs, and contract terminations. In some regions, the acquisition resulted in<br />
overcapacity for the combined entities. In order to reduce overcapacity, some plants owned by the Company<br />
before the acquisition were closed. Future costs associated with the cessation of these activities are recorded<br />
as obligations related to the acquisition and included in the cost of acquisition.<br />
Purchase price allocation<br />
In 2002, the Company finalized the allocation of the purchase price. The purchase price has been<br />
allocated as follows (in million euros):<br />
2001<br />
At December 31,<br />
Variation 2002<br />
Purchase price ;;;;;;;;;;;;;;;;;;;;;;; 5,280 42 5,322<br />
Intangible assets (Market Share) ;;;;;;;;;;;;;;;; (1,995) — (1,995)<br />
Property, plant and equipment ;;;;;;;;;;;;;;;;; (5,445) (189) (5,634)<br />
Inventories, net ;;;;;;;;;;;;;;;;;;;;;;; (464) 18 (446)<br />
Accounts receivable-trade, net ;;;;;;;;;;;;;;;;; (738) 22 (716)<br />
Other receivables ;;;;;;;;;;;;;;;;;;;;;; (201) 7 (194)<br />
Cash and cash equivalents;;;;;;;;;;;;;;;;;;; (248) — (248)<br />
Minority Interests ;;;;;;;;;;;;;;;;;;;;;; 635 (80) 555<br />
Provisions ;;;;;;;;;;;;;;;;;;;;;;;;; 761 224 985<br />
Long term debt ;;;;;;;;;;;;;;;;;;;;;;; 746 — 746<br />
Accounts payable, trade;;;;;;;;;;;;;;;;;;;; 381 8 389<br />
Other payables ;;;;;;;;;;;;;;;;;;;;;;; 627 76 703<br />
Current liabilities ;;;;;;;;;;;;;;;;;;;;;; 2,737 — 2,737<br />
Fair value of the net assets acquired;;;;;;;;;;;;;; (3,204) 86 (3,118)<br />
Goodwill, net;;;;;;;;;;;;;;;;;;;;;;;; 2,076 128 2,204<br />
F-32
LAFARGE<br />
NOTES TO THE CONSOLIDATED FINANCIAL STATEMENTS — (Continued)<br />
s Acquisition of Cementos El Monte<br />
On September 8, 2001, the Company acquired 100% of Cementos El Monte for a total consideration of<br />
43 million euros. The company owns grinding plants in the South of Spain. Cementos El Monte is fully<br />
consolidated since September 8, 2001.<br />
Cementos El Monte has been accounted for using the purchase method of accounting. The purchase<br />
price, at December 31, 2001, has been allocated as follows (in million euros):<br />
Purchase price ;;;;;;;;;;;;;;;;;;;;;;; 43<br />
Fair value of the net assets acquired ;;;;;;;;;;;;;;; (15)<br />
Goodwill ;;;;;;;;;;;;;;;;;;;;;;;;;; 28<br />
In conjunction with a disposal plan, the Company sold its entire interest in Cementos El Monte in<br />
December 2002.<br />
s Acquisition of Kloeber<br />
On September 4, 2001, the Company announced the acquisition of the Kloeber Group, a German<br />
manufacturer of roofing components. Kloeber owns two plants in Germany, a joint venture in South Africa<br />
and distribution channels in various European countries. The purchase price totaled 16 million euros.<br />
This transaction has been accounted for using the purchase method of accounting. The purchase price, at<br />
December 31, 2001, has been allocated as follows (in million euros):<br />
Purchase price ;;;;;;;;;;;;;;;;;;;;;;;; 16<br />
Fair value of the net assets acquired ;;;;;;;;;;;;;;; (6)<br />
Goodwill ;;;;;;;;;;;;;;;;;;;;;;;;;; 10<br />
s Acquisition of Pan African Cement Limited<br />
At the end of April 2001, the Company acquired, jointly with Blue Circle Industries, 100% of Pan<br />
African Cement Ltd (PAC). PAC owns 84% of Chilanga Cement in Zambia, 75,2% of Portland Cement in<br />
Malawi and 63% of Mbeya Cement in Tanzania. These three companies are fully consolidated since April<br />
2001 and have been accounted for using the purchase method of accounting.<br />
The purchase price, at December 31, 2001, has been allocated as follows (in million euros):<br />
Purchase price ;;;;;;;;;;;;;;;;;;;;;;; 52<br />
Fair value of the net assets acquired ;;;;;;;;;;;;;;; (23)<br />
Market share;;;;;;;;;;;;;;;;;;;;;;;;; (23)<br />
Goodwill ;;;;;;;;;;;;;;;;;;;;;;;;;; 6<br />
s Acquisition of the Cement Division of Raymond Limited<br />
On August 26, 2000, the Company signed an agreement with Raymond Ltd, to acquire a cement plant<br />
located in the East of India. The acquisition of 65,26% became effective on January 22, 2001 for a total<br />
consideration of 112 million euros.<br />
F-33
LAFARGE<br />
NOTES TO THE CONSOLIDATED FINANCIAL STATEMENTS — (Continued)<br />
Raymond is fully consolidated since January 2001. This transaction has been accounted for using the<br />
purchase method of accounting. The purchase price, at December 31, 2001, has been allocated as follows<br />
(in million euros):<br />
Purchase price ;;;;;;;;;;;;;;;;;;;;;;; 112<br />
Fair value of the net assets acquired ;;;;;;;;;;;;;;; (72)<br />
Market share ;;;;;;;;;;;;;;;;;;;;;;;; (37)<br />
Goodwill ;;;;;;;;;;;;;;;;;;;;;;;;;; 3<br />
On December 31, 2001, the Company has increased its interests in Raymond assets (merged with Tisco<br />
assets) to 73,13%. This additional acquisition has resulted in a goodwill of 12 million euros.<br />
s Other acquisitions<br />
In addition to the acquisitions described separately in this note, several other relatively minor<br />
acquisitions in all of the Company’s segments were consummated in 2003, 2002 and 2001. All such<br />
acquisitions were accounted for using the purchase method of accounting. The aggregate cost of these<br />
acquisitions was 60 million euros, 88 million euros and 377 million euros in 2003, 2002 and 2001,<br />
respectively.<br />
(d) Pro forma information<br />
The table below reflects unaudited pro forma combined results of the Company as if acquisitions had<br />
taken place at the beginning of each period presented:<br />
2003 2002 2001<br />
Sales ;;;;;;;;;;;;;;;;;;;;;;;;;;; 13,668 14,617 15,520<br />
Net income ;;;;;;;;;;;;;;;;;;;;;;;;; 726 455 687<br />
Earnings per share ;;;;;;;;;;;;;;;;;;;;;; 4.91 3.51 5.47<br />
Diluted earning per share ;;;;;;;;;;;;;;;;;;; 4.75 3.49 5.20<br />
The pro-forma results are for illustrative purposes only and are not necessarily indicative of the operating<br />
results that would have occurred had the business acquisitions been consummated at that date, nor are they<br />
necessarily indicative of future operating results.<br />
A detailed presentation of Blue Circle pro forma information is included in Note 5.<br />
F-34
Note 12 — Property, Plant and Equipment, Net<br />
(a) Changes in property, plant and equipment<br />
LAFARGE<br />
NOTES TO THE CONSOLIDATED FINANCIAL STATEMENTS — (Continued)<br />
Mineral<br />
reserves and<br />
land Buildings<br />
Machinery,<br />
equipment,<br />
fixtures and<br />
fittings<br />
Construction<br />
in progress Total<br />
(in million euros)<br />
At January 1, 2001 ;;;;;;;; 1,826 2,643 10,017 803 15,289<br />
Additions ;;;;;;;;;;;; 55 62 561 845 1,523<br />
Disposals ;;;;;;;;;;;; (72) (68) (474) (20) (634)<br />
Change in scope of consolidation ;; 369 699 4,252 684 6,004<br />
Other changes ;;;;;;;;;; 46 (99) 678 (652) (27)<br />
Translation adjustments ;;;;;; 20 18 (1) (5) 32<br />
At December 31, 2001 ;;;;;; 2,244 3,255 15,033 1,655 22,187<br />
Accumulated depreciation ;;;;; (269) (1,503) (7,058) (4) (8,834)<br />
Net book value at December 31, 2001 1,975 1,752 7,975 1,651 13,353<br />
At January 1, 2002 ;;;;;;;; 2,244 3,255 15,033 1,655 22,187<br />
Additions ;;;;;;;;;;;; 17 39 240 801 1,097<br />
Disposals ;;;;;;;;;;;; (90) (133) (496) (3) (722)<br />
Change in scope of consolidation ;; (9) 10 (148) (1) (148)<br />
Other changes ;;;;;;;;;; 84 206 1,089 (1,263) 116<br />
Translation adjustments ;;;;;; (276) (311) (1,504) (211) (2,302)<br />
At December 31, 2002 ;;;;;; 1,970 3,066 14,214 978 20,228<br />
Accumulated depreciation ;;;;; (280) (1,486) (6,776) (19) (8,561)<br />
Net book value at December 31, 2002 1,690 1,580 7,438 959 11,667<br />
At January 1, 2003 ;;;;;;;; 1,970 3,066 14,214 978 20,228<br />
Additions ;;;;;;;;;;;; 12 23 183 580 798<br />
Disposals ;;;;;;;;;;;; (35) (62) (449) (4) (550)<br />
Change in scope of consolidation ;; 8 29 4 (6) 35<br />
Other changes ;;;;;;;;;; 26 136 517 (792) (113)<br />
Translation adjustments ;;;;;; (151) (231) (1,129) (115) (1,626)<br />
At December 31, 2003 ;;;;;; 1,830 2,961 13,340 641 18,772<br />
Accumulated depreciation ;;;;; (289) (1,511) (6,556) (14) (8,370)<br />
Net book value at December 31, 2003 1,541 1,450 6,784 627 10,402<br />
(b) Depreciation of property, plant and equipment<br />
Depreciation on property plant and equipment is as follows:<br />
Years ended December 31,<br />
2003 2002 2001<br />
(in million euros)<br />
Depreciation ;;;;;;;;;;;;;;;;;;;;;;;;;;;; 823 897 857<br />
Impairment charges ;;;;;;;;;;;;;;;;;;;;;;;;; 35 48 26<br />
Total ;;;;;;;;;;;;;;;;;;;;;;;;;;;;;;; 858 945 883<br />
F-35
(c) Capital leases<br />
The gross value of property, plant and equipment includes 54 million euros, 21 million euros and<br />
37 million euros of assets under capital leases for the years ended December 31, 2003, 2002 and 2001,<br />
respectively. The remaining obligations on such assets total 32 million euros, 14 million euros and 20 million<br />
euros for the years ended December 31, 2003, 2002 and 2001, respectively.<br />
Note 13 — Investments in Equity Affiliates<br />
(a) Changes in the balance of equity affiliates<br />
2003 2002 2001<br />
(in million euros)<br />
Balance of equity affiliates at January 1 ;;;;;;;;;;;;;;; 652 439 420<br />
Share in net income of affiliates;;;;;;;;;;;;;;;;;;;; 37 33 18<br />
Dividends received from equity affiliates ;;;;;;;;;;;;;;;; (26) (16) (20)<br />
New investments or share capital increases ;;;;;;;;;;;;;;; 69 88 42<br />
Disposals and reduction in ownership percentage ;;;;;;;;;;;;; (100) (22) 1<br />
Change from equity method to consolidation ;;;;;;;;;;;;;; — (20) —<br />
Change from equity method to proportionate consolidation method (240) — —<br />
Other changes(*) (including translation adjustments) ;;;;;;;;;;; (9) 150 (22)<br />
Balance of equity affiliates at December 31 ;;;;;;;;;;;;;; 383 652 439<br />
(*) Includes 240 million euros generated by Blue Circle Industries opening balance sheet finalization in 2002.<br />
(b) Summarized combined balance sheet and income statement information of equity affiliates<br />
Combined balance sheet information<br />
2003<br />
Of which<br />
Molins 2002<br />
LAFARGE<br />
NOTES TO THE CONSOLIDATED FINANCIAL STATEMENTS — (Continued)<br />
Of which<br />
Molins<br />
At December 31,<br />
Of which<br />
Materis<br />
Of which<br />
Tong<br />
Yang 2001<br />
Of which<br />
Molins<br />
Of which<br />
Materis<br />
(in million euros)<br />
Long-term assets ; 1,441 316 3,802 318 565 1,159 2,341 348 606<br />
Current assets ;;; 1,051 396 1,656 367 477 189 1,691 322 598<br />
Total assets ;;; 2,492 712 5,458 685 1,042 1,348 4,032 670 1,204<br />
Total equity ;;; 1,158 376 2,182 338 173 488 1,323 384 181<br />
Long-term liabilities 510 102 2,061 164 614 765 1,539 81 719<br />
Current liabilities ; 824 234 1,215 183 255 95 1,170 205 304<br />
Total shareholders’<br />
equity and<br />
liabilities ;;; 2,492 712 5,458 685 1,042 1,348 4,032 670 1,204<br />
F-36
Combined income statement information<br />
Years ended December 31,<br />
2003 2002<br />
(in million euros)<br />
2001<br />
Sales ;;;;;;;;;;;;;;;;;;;;;;;;;;;;; 2,858 3,504 3,030<br />
Operating income on ordinary activities ;;;;;;;;;;;;;;; 564 452 372<br />
Operating income ;;;;;;;;;;;;;;;;;;;;;;;; 449 405 324<br />
Net income ;;;;;;;;;;;;;;;;;;;;;;;;;; 172 86 54<br />
(c) Information on main equity affiliates<br />
Share of<br />
Equity<br />
LAFARGE<br />
NOTES TO THE CONSOLIDATED FINANCIAL STATEMENTS — (Continued)<br />
At December 31,<br />
2003 2002 2001<br />
Share of<br />
Net income<br />
Share of<br />
Equity<br />
Share of<br />
Net income<br />
Share of<br />
Equity<br />
Share of<br />
Net income<br />
(in million euros)<br />
Molins ;;;;;;;;;;; 154 27 147 37 155 29<br />
Tong Yang(1) ;;;;;;;; — 5 48 5 — —<br />
Carmeuse North America ;;; 44 (33) 31 (28) 51 (39)<br />
Materis Participations(2) ;;;; — 12 58 1 60 (4)<br />
BC Ebbsfleet Ltd(3) ;;;;; — — 240 (10) — —<br />
Other ;;;;;;;;;;; 185 26 128 28 173 32<br />
Total ;;;;;;;;;;; 383 37 652 33 439 18<br />
(1) Tong Yang shares were fully disposed of in 2003.<br />
(2) In 2003, <strong>Lafarge</strong> disposed of its investment in Materis Participations and acquired a 7.27% interest in the<br />
new company Matéris Holding Luxembourg (see Note 14 below)<br />
(3) BC Ebbsfleet Ltd has been accounted for using the proportionate consolidation method since 2003<br />
Note 14 — Other Investments<br />
Components of other investments are as follows:<br />
2003<br />
At December 31,<br />
2002<br />
(in million euros)<br />
2001<br />
Cimpor ;;;;;;;;;;;;;;;;;;;;;;;;;;;;;; 392 319 317<br />
Matéris Holding Luxembourg ;;;;;;;;;;;;;;;;;;;;; 11 — —<br />
Other investments in non-consolidated companies* ;;;;;;;;;;;; 78 143 354<br />
Total ;;;;;;;;;;;;;;;;;;;;;;;;;;;;;;; 481 462 671<br />
* Some investments, which were not consolidated in past years, have been consolidated in 2003. The<br />
consolidation of these investments has no significant impact on the Company’s financial statements.<br />
(a) Cimpor<br />
At December 31, 2003 and 2002 <strong>Lafarge</strong> owns a 12.64% and a 9.99% interest respectively in the shares<br />
of the Portuguese cement producer Cimpor for a net value of 392 million euros and 319 million euros<br />
respectively. At December 31, 2003 and 2002, the market value of these shares amounted to 348 million<br />
euros and 215 million euros respectively, based upon the stock market price at December 31.<br />
The Company considers that Cimpor market price does not represent the fair value of this investment,<br />
regarding its strategic importance and did not book any depreciation.<br />
F-37
LAFARGE<br />
NOTES TO THE CONSOLIDATED FINANCIAL STATEMENTS — (Continued)<br />
(b) Matéris Holding Luxembourg<br />
At December 31, 2003 the Company owns a 7.27% interest in Matéris Holding Luxembourg.<br />
Note 15 — Other long-term assets<br />
Components of other long-term assets are as follows:<br />
2003<br />
At December 31,<br />
2002<br />
(in million euros)<br />
2001<br />
Prepaid pension expenses ;;;;;;;;;;;;;;;;;;;;; 561 617 653<br />
Other ;;;;;;;;;;;;;;;;;;;;;;;;;;;;; 249 302 247<br />
Other long-term assets ;;;;;;;;;;;;;;;;;;;;; 810 919 900<br />
Note 16 — Inventories<br />
Components of inventories are as follows:<br />
2003<br />
At December 31,<br />
2002<br />
(in million euros)<br />
2001<br />
Raw materials ;;;;;;;;;;;;;;;;;;;;;;;;; 280 327 473<br />
Work-in-progress ;;;;;;;;;;;;;;;;;;;;;;;; 139 178 303<br />
Finished and semi-finished goods ;;;;;;;;;;;;;;;;; 579 632 556<br />
Maintenance and operating supplies ;;;;;;;;;;;;;;;; 567 611 609<br />
Inventories, gross ;;;;;;;;;;;;;;;;;;;;;;; 1,565 1,748 1,941<br />
Valuation allowance ;;;;;;;;;;;;;;;;;;;;;;; (143) (157) (165)<br />
Inventories, net ;;;;;;;;;;;;;;;;;;;;;;;; 1,422 1,591 1,776<br />
Note 17 — Accounts Receivable-Trade, Net<br />
Components of accounts receivable-trade are as follows:<br />
2003<br />
At December 31,<br />
2002<br />
(in million euros)<br />
2001<br />
Accounts receivable-trade ;;;;;;;;;;;;;;;;;;;; 1,950 2,019 2,451<br />
Valuation allowance ;;;;;;;;;;;;;;;;;;;;;;; (196) (203) (221)<br />
Accounts receivable-trade, net ;;;;;;;;;;;;;;;;;; 1,754 1,816 2,230<br />
The change in the valuation allowance for doubtful receivables is as follows:<br />
2003 2002 2001<br />
(in million euros)<br />
At January 1 ;;;;;;;;;;;;;;;;;;;;;;;;; (203) (221) (133)<br />
Current year addition ;;;;;;;;;;;;;;;;;;;;;; (73) (105) (90)<br />
Current year release ;;;;;;;;;;;;;;;;;;;;;;; 55 77 56<br />
Cancellation ;;;;;;;;;;;;;;;;;;;;;;;;;; 15 22 12<br />
Other changes ;;;;;;;;;;;;;;;;;;;;;;;;; (6) — (65)<br />
Translation adjustments ;;;;;;;;;;;;;;;;;;;;; 16 24 (1)<br />
At December 31 ;;;;;;;;;;;;;;;;;;;;;;;; (196) (203) (221)<br />
F-38
LAFARGE<br />
NOTES TO THE CONSOLIDATED FINANCIAL STATEMENTS — (Continued)<br />
In January 2000, the Company entered into multi-year securitization agreements with respect to trade<br />
receivables, without recourse. Accounts receivable is presented net of securitized receivables of 352 million<br />
euros, 399 million euros and 438 million euros at December 31, 2003, 2002 and 2001, respectively.<br />
The agreements are guaranteed by subordinated deposits classified in long-term deposits of 103 million<br />
euros, 85 million euros and 125 million euros at December 31, 2003, 2002 and 2001, respectively. The<br />
Company owns no equity share in the special purpose entities.<br />
Note 18 — Other Receivables<br />
Components of other receivables are as follows:<br />
2003<br />
At December 31,<br />
2002<br />
(in million euros)<br />
2001<br />
Other taxes ;;;;;;;;;;;;;;;;;;;;;;;;;;;; 119 202 216<br />
Prepaid expenses ;;;;;;;;;;;;;;;;;;;;;;;;; 90 93 92<br />
Interest receivables;;;;;;;;;;;;;;;;;;;;;;;;; 13 10 37<br />
Other current receivables ;;;;;;;;;;;;;;;;;;;;;; 755 650 788<br />
Other receivables ;;;;;;;;;;;;;;;;;;;;;;;;; 977 955 1,133<br />
Note 19 — Cash and Cash Equivalents<br />
Cash and cash equivalents, amounting to 1,634 million euros at December 31, 2003, include short-term<br />
investments of 621 million euros.<br />
At December 31, 2003 short-term investments include treasury shares which are intended to cover<br />
employee stock purchase option plans, of 71 million euros. Treasury shares recorded as a deduction of<br />
shareholder’s equity at December 31, 2003 is 33 million euros.<br />
Number of shares as well as value and movements of treasury shares are as follows:<br />
2003 2002* 2001*<br />
(in million euros except per share data)<br />
At January 1 ;;;;;;;;;;;;;;;;;;;; 113 109 109<br />
Changes of the period ;;;;;;;;;;;;;;;;; (9) 4 —<br />
At December 31 ;;;;;;;;;;;;;;;;;;; 104 113 109<br />
Number of shares;;;;;;;;;;;;;;;;;;; 1,856,266 1,920,959 1,864,372<br />
* The treasury shares, which are intended to cover employee stock purchase option plans, were recorded as<br />
a deduction of shareholder’s equity until December 31, 2002. The reclassification to cash and cash<br />
equivalents in 2003 did not have a significant impact on the Company’s financial statements.<br />
Note 20 — Shareholders’ Equity<br />
(a) Common stock<br />
At December 31, 2003, <strong>Lafarge</strong> common stock consisted of 167,217,813 shares with a stated value of 4<br />
euros per share. At December 31, 2003, voting rights attributable to the outstanding shares totaled 176 156<br />
844, after inclusion of the double voting rights attached to registered shares held at least two years and<br />
cancellation of the voting rights associated with treasury shares.<br />
F-39
(b) Stock rights issue<br />
On July 15, 2003, the Company issued stock rights to shareholders. These rights were subsequently<br />
exercised and the Company issued 31,831,528 shares of common stock. The total proceeds from this offering,<br />
net of issuance costs, were approximately 1,262 million euros.<br />
On June 11, 2002, the Company issued 708,718 shares pursuant to its employee stock purchase plan.<br />
Proceeds totaled approximately 45 million euros, net of issuance costs.<br />
On February 9, 2001, the Company issued stock rights in a 1 for 8 underwritten rights offering to<br />
shareholders. These rights were subsequently converted into 14,110,592 shares of common stocks at a price<br />
of 80 euros per share. The total proceeds from this offering, net of issuance costs, were approximately<br />
1,113 million euros.<br />
(c) Warrants<br />
At December 31, 2000, the Company had 8,279,784 warrants outstanding. These warrants resulted from<br />
the issuance, on March, 20, 2000, of debt redeemable in shares. The warrants were convertible into common<br />
stock of the Company at a conversion ratio of 4 warrants per common share and expired on March 20, 2001.<br />
The warrants were converted into approximately 2,098,811 common shares.<br />
(d) Public exchange offer Cementia<br />
On May 14, 2002 , the Company tendered a public exchange offer for all of the outstanding shares of its<br />
Swiss publicly-traded subsidiary, Cementia Holding AG. The offer consisted of exchange of 1 share or<br />
1 warrant for 11 shares of the Company with a stated value of 4 euros per share.<br />
The offer resulted in the issuance of 401,775 <strong>Lafarge</strong> shares at 104.94 euros each, approximated<br />
42.2 million euros. Following the public exchange offer and in accordance with the Swiss law, the company<br />
initiated a minority interest buyout to acquire the remaining outstanding shares. As a result, 52,063 additional<br />
shares were issued with a total market value of approximately 5.5 million euros.<br />
Note 21 — Minority Interests<br />
2003 2002 2001<br />
(in million euros)<br />
At January 1 ;;;;;;;;;;;;;;;;;;;;;;;;; 2,155 2,551 1,707<br />
Share of net income ;;;;;;;;;;;;;;;;;;;;;;; 237 273 270<br />
Translation adjustments ;;;;;;;;;;;;;;;;;;;;; (126) (368) 16<br />
Dividends paid ;;;;;;;;;;;;;;;;;;;;;;;;; (92) (91) (65)<br />
Other changes ;;;;;;;;;;;;;;;;;;;;;;;;; 17 (210) 623<br />
At December 31 ;;;;;;;;;;;;;;;;;;;;;;;; 2,191 2,155 2,551<br />
The Company’s significant minority interests are <strong>Lafarge</strong> North America, Heracles General Cement,<br />
Associated Pan Malaysia Cement Sdn Bhd and Jordan Cement.<br />
Note 22 — Other Equity<br />
Other equity includes investment subsidies.<br />
LAFARGE<br />
NOTES TO THE CONSOLIDATED FINANCIAL STATEMENTS — (Continued)<br />
F-40
Note 23 — Provisions<br />
(a) Changes in the balance of provisions<br />
LAFARGE<br />
NOTES TO THE CONSOLIDATED FINANCIAL STATEMENTS — (Continued)<br />
Pensions and<br />
other postretirement<br />
benefits<br />
Restructuring<br />
provisions<br />
Site restoration<br />
and environmental<br />
provisions<br />
Other<br />
provisions* Total<br />
(in million euros)<br />
At January 1, 2001 ;;;;;;;;;; 599 101 190 338 1,228<br />
Current year addition, net ;;;;;;;; 88 39 42 136 305<br />
Current year release ;;;;;;;;;; (80) (148) (42) (217) (487)<br />
Other changes ;;;;;;;;;;;;; 164 219 (8) 259 634<br />
Translation adjustments ;;;;;;;;; 7 — 2 (1) 8<br />
At December 31, 2001 ;;;;;;;;; 778 211 184 515 1,688<br />
Current year addition, net ;;;;;;;; 105 45 46 395 591<br />
Current year release ;;;;;;;;;; (95) (179) (37) (86) (397)<br />
Other changes ;;;;;;;;;;;;; 8 94 28 61 191<br />
Translation adjustments ;;;;;;;;; (74) (17) (16) (44) (151)<br />
At December 31, 2002 ;;;;;;;;; 722 154 205 841 1,922<br />
Current year addition, net ;;;;;;;; 151 21 35 85 292<br />
Current year release ;;;;;;;;;; (98) (66) (32) (71) (267)<br />
Other changes ;;;;;;;;;;;;; (4) (36) 24 26 10<br />
Translation adjustments ;;;;;;;;; (32) (10) (14) (44) (100)<br />
At December 31, 2003 ;;;;;;;;; 739 63 218 837 1,857<br />
* As of December, 31 2003, other provisions includes a provision of 309 million euros (including 9 million<br />
euros of interest incurred in 2003) related to the risk arising from the ‘‘competition’’ litigation risk.<br />
(b) Pension plans, end of service benefits and other post retirement benefits<br />
The Company sponsors both defined benefit and defined contribution plans, in accordance with local<br />
legal requirements and each specific subsidiaries benefit policies.<br />
For defined contribution plans, the Company’s obligations are limited to periodic payments to third party<br />
organizations, which are responsible for the financial and administrative management of the funds.<br />
Only defined benefit plans create future obligations for the Company. Defined benefit pension plans and<br />
end of service benefits constitute 93% of the Company’s post-retirement obligations the remaining 7% relates<br />
to other post retirement benefits mainly post employment medical plans. For these plans, the Company’s<br />
obligations are estimated with the assistance of independent actuaries using assumptions, which may vary<br />
overtime. The obligations related to these plans are often funded through Company and employee<br />
contributions to third party legal entities and are then invested in equity and bond portfolios, which are<br />
subject to fluctuations in the financial markets.<br />
The following schedule shows the accounting treatment for defined benefit pension plans and end of<br />
service benefits under the column ‘‘pension benefits’’ and the accounting treatment for other post retirement<br />
benefits under the column ‘‘other benefits’’.<br />
F-41
LAFARGE<br />
NOTES TO THE CONSOLIDATED FINANCIAL STATEMENTS — (Continued)<br />
Pension benefits<br />
At December 31,<br />
Other Benefits Total<br />
2003 2002 2001 2003 2002 2001 2003 2002 2001<br />
(in million euros)<br />
AMOUNTS RECOGNIZED IN THE STATEMENT OF<br />
FINANCIAL POSITION CONSIST OF<br />
Prepaid pension asset ;;;;;;;;;;;;;;;;;; 561 617 653 — — — 561 617 653<br />
Accrued pension liability ;;;;;;;;;;;;;;;;; (517) (478) (511) (222) (244) (267) (739) (722) (778)<br />
Net amount recognized at end period ;;;;;;;;;;; 44 139 142 (222) (244) (267) (178) (105) (125)<br />
COMPONENTS OF NET PERIODIC PENSION COST<br />
Prior service cost ;;;;;;;;;;;;;;;;;;;; 86 98 92 9 8 6 95 106 98<br />
Interest cost ;;;;;;;;;;;;;;;;;;;;;; 215 226 186 18 19 16 233 245 202<br />
Expected return on plan assets;;;;;;;;;;;;;;; (212) (281) (247) — — — (212) (281) (247)<br />
Amortization of prior service cost ;;;;;;;;;;;;; 3 3 2 1 (1) — 4 2 2<br />
Amortization of transition asset obligation ;;;;;;;;;; 1 1 1 — — — 1 1 1<br />
Amortization of actuarial (gain) loss ;;;;;;;;;;;; 52 7 (4) 2 1 — 54 8 (4)<br />
Actuarial (gain) loss ;;;;;;;;;;;;;;;;;;; 4 10 (2) 1 1 6 5 11 4<br />
Special termination benefits ;;;;;;;;;;;;;;;; 1 1 5 1 — — 2 1 5<br />
Settlement (gain) loss ;;;;;;;;;;;;;;;;;; — (5) — — — — — (5) —<br />
Curtailment gain ;;;;;;;;;;;;;;;;;;;; — — — — — — — — —<br />
Divestitures ;;;;;;;;;;;;;;;;;;;;;; — — (2) — (1) — — (1) (2)<br />
Net periodic pension cost ;;;;;;;;;;;;;;;; 150 60 31 32 27 28 182 87 59<br />
CHANGE IN PROJECTED BENEFIT OBLIGATION<br />
Projected benefit obligation at January 1 ;;;;;;;;; 3,892 4,206 2,015 297 291 226 4,189 4,497 2,241<br />
Foreign currency translations ;;;;;;;;;;;;;;; (290) (324) 83 (41) (43) 10 (331) (367) 93<br />
Service cost ;;;;;;;;;;;;;;;;;;;;;; 86 98 92 9 8 6 95 106 98<br />
Interest cost ;;;;;;;;;;;;;;;;;;;;;; 215 226 186 18 19 16 233 245 202<br />
Employee contributions ;;;;;;;;;;;;;;;;; 12 11 10 — — — 12 11 10<br />
Plan amendments ;;;;;;;;;;;;;;;;;;;; 10 15 — 12 (1) 1 22 14 1<br />
Curtailments ;;;;;;;;;;;;;;;;;;;;;; — — 1 — — — — — 1<br />
Settlements ;;;;;;;;;;;;;;;;;;;;;; (3) (21) — — — — (3) (21) —<br />
Business combinations ;;;;;;;;;;;;;;;;;; 1 3 2,024 — 5 23 1 8 2,047<br />
Divestitures ;;;;;;;;;;;;;;;;;;;;;; (2) — (16) — — — (2) — (16)<br />
Special termination benefits ;;;;;;;;;;;;;;;; — 1 5 1 — 2 1 1 7<br />
Benefits paid ;;;;;;;;;;;;;;;;;;;;;; (212) (236) (182) (22) (19) (20) (234) (255) (202)<br />
Actuarial (gain) loss ;;;;;;;;;;;;;;;;;;; 283 (87) (12) 38 37 27 321 (50) 15<br />
Projected benefit obligation at December 31 ;;;;;;;; 3,992 3,892 4,206 312 297 291 4,304 4,189 4,497<br />
CHANGE IN PLAN ASSETS<br />
Fair value of plan assets at January 1 ;;;;;;;;;;; 2,991 3,842 2,008 2 2 2 2,993 3,844 2,010<br />
Foreign currency translations ;;;;;;;;;;;;;;; (243) (309) 90 — — — (243) (309) 90<br />
Actual return on plan assets ;;;;;;;;;;;;;;;; 277 (396) (274) — — — 277 (396) (274)<br />
Employer contributions;;;;;;;;;;;;;;;;;; 95 105(a) 54 22 19 20 117 124 74<br />
Employee contributions ;;;;;;;;;;;;;;;;; 12 11 10 — — — 12 11 10<br />
Benefits paid ;;;;;;;;;;;;;;;;;;;;;; (212) (236) (175) (22) (19) (20) (234) (255) (195)<br />
Settlements ;;;;;;;;;;;;;;;;;;;;;; (3) (21) — — — — (3) (21) —<br />
Business combinations ;;;;;;;;;;;;;;;;;; — — 2,142 — — — — — 2,142<br />
Divestitures ;;;;;;;;;;;;;;;;;;;;;; (2) — (9) — — — (2) — (9)<br />
Administrative expenses ;;;;;;;;;;;;;;;;; (8) (5) (4) — — — (8) (5) (4)<br />
Fair value of plan assets at December 31 ;;;;;;;;; 2,907 2,991 3,842 2 2 2 2,909 2,993 3,844<br />
RECONCILIATION OF PREPAID (ACCRUED) BENEFIT<br />
COST<br />
Funded status of the plan ;;;;;;;;;;;;;;;; (1,085) (901) (364) (310) (295) (289) (1,395) (1,196) (653)<br />
Unrecognized actuarial (gain) loss ;;;;;;;;;;;;; 1,103 1,019 493 80 52 23 1,183 1,071 516<br />
Unrecognized actuarial transition (asset) obligation ;;;;;; — 1 3 — — (1) — 1 2<br />
Unrecognized actuarial prior service cost ;;;;;;;;;; 26 20 10 8 (1) — 34 19 10<br />
Prepaid (accrued) pension cost at December 31;;;;;;; 44 139 142 (222) (244) (267) (178) (105) (125)<br />
(a) including contributions paid in 2002 for the establishment of a separate legal entity pension fund and<br />
annuity contracts in Spain for 39 million euros.<br />
F-42
LAFARGE<br />
NOTES TO THE CONSOLIDATED FINANCIAL STATEMENTS — (Continued)<br />
The primary assumptions made to account for pensions and end of service benefits are as follows:<br />
USA Canada UK France Spain Greece<br />
Euro zone<br />
(others)<br />
2003 2002 2001 2003 2002 2001 2003 2002 2001 2003 2002 2001 2003 2002 2001 2003 2002 2001 2003 2002 2001<br />
% % % % % % %<br />
Discount rate ;;;;;;; 6.00 6.80 7.75 6.00 6.35 6.50 5.60 5.75 5.50 5.50 5.50 5.75 5.50 5.50 5.75 5.75 5.75 6.25 5.50 5.50 5.75<br />
Expected return rate on assets 8.50 9.00 9.00 8.50 9.00 9.00 7.00 7.50 7.50 5.82 5.82 5.82 4.85 4.85 5.75 * * * 7.00 7.00 8.00<br />
2.00 2.00 2.00 2.00 2.00 2.00<br />
Salary increase ;;;;;; 4.00 4.00 4.50 3.50 3.50 3.50 4.75 4.25 4.50 to to to 2.40 2.40 2.40 4.00 4.25 4.75 to to to<br />
3.50 3.50 3.50 3.50 3.50 3.50<br />
* not applicable<br />
For fiscal 2004, the expected return rates on assets are as follows:<br />
USA ;;;;;;;;; 8.50%<br />
Canada ;;;;;;;; 8.50%<br />
UK ;;;;;;;;; 7.30%<br />
Euro zone ;;;;;;; 7.00%<br />
France ;;;;;;;; 5.82%<br />
Spain ;;;;;;;;; 4.85%<br />
The expected rates of investment return on pension assets and the discount rates used to calculate the<br />
Company’s pension related obligations are established in close consultation with independent advisors.<br />
s Pension Plans<br />
The main defined benefit pension plans provided to employees by the Company are in the United<br />
Kingdom, North America (The United States of America and Canada) and Germany. The related pension<br />
obligations represent 65%, 20% and 5%, respectively, of the Company’s total defined benefit plan obligations.<br />
In the United Kingdom, pension related obligations result primarily from three pension plans. Two of<br />
these plans result from the acquisition of Blue Circle Industries in 2001. These plans were merged at the end<br />
of September 2003. Pension benefits generally incorporate linear formulas and are based upon employee’s<br />
final career pay and the length of employment with the Company. The resulting pension obligations are<br />
funded through employee and employer contributions to legally separate entities managed by representatives<br />
of both management of the Company and its employees. The contribution rate of both the Company and its<br />
employees are revised every three years by independent actuarial consultants. Funding of the obligation is<br />
based upon both local minimum funding requirements as well as long term funding objectives to settle the<br />
future statutory pension obligations. The last actuarial valuation was performed at the end of September 2003<br />
and it was concluded that no significant increase in employer’s contributions is necessary for 2004. At the<br />
end of 2003, approximately 65% of the pension fund assets are invested in equity instruments, which is<br />
consistent with the long-term nature of the pension obligations, approximately 31% are invested in bond<br />
portfolios and 4% in real estate.<br />
In the United States and Canada, defined pension benefits are granted through various plans.<br />
Contributions are based upon required amounts to fund the various plans as well as tax-deductible minimum<br />
and maximum amounts. At the end of 2003, 69% of the pension fund assets were invested in equity<br />
instruments, 30% in bond portfolios and 1% in other investment instruments. Required employer’s<br />
contributions in 2004 are expected to increase slightly to 56 million US dollars. The company chose for tax<br />
and financial purposes to make a discretionary specific contribution of 43 million US dollars in the beginning<br />
of 2004 to Canadian pension fund.<br />
In Germany, defined benefit pension plans are based upon the employees’ final career pay and the length<br />
of employment with the Company. German law does not require that pension obligations be funded through<br />
F-43
employer contributions to external third party funds. In case of corporate insolvency by an employer the<br />
employees’ vested benefits are guaranteed by an insurance fund sponsored by German companies with<br />
defined benefit pension plans. These defined benefit plans in Germany have been closed to new entrants since<br />
2001. The Company now provides defined contribution pension arrangements to new employees who will be<br />
entitled to future pension benefits. Accordingly, the Company believes that the future amount of pension<br />
expense in Germany will progressively decline.<br />
In conformity with the Company’s accounting policies, (Note 2 (o)) the difference between actual and<br />
expected returns on fund assets is treated as actuarial losses. At the end of 2003, unrecognized actuarial<br />
losses have increased slightly due to changes in assumptions related to long-term interest rates. Actuarial<br />
losses generated during the year were compensated by actuarial gains generated on plans assets (actual return<br />
higher than assumed) and by exchange rates evolutions.<br />
The losses in excess of the ‘‘10% corridor’’ will be amortized and reflected in the 2004 pension expense.<br />
According to the information available, no significant increase of pension expense is expected in 2004,<br />
except for North American plans for which pension expense will increase by approximately 21 million US<br />
dollars.<br />
s End of service benefits<br />
End of service benefits are generally lump sum payments based upon an individual’s years of credited<br />
service and annual salary at retirement or termination of employment. The primary obligations for end of<br />
service benefits are in France, Italy, Greece and Chile.<br />
In France, the new pension regulation of the ‘‘loi Fillon’’, implemented in August 2003 caused French<br />
companies to modify certain actuarial assumptions for instance, retirement age and modality. These changes<br />
will not have a significant impact on the Company as the total pension obligation for French plans represents<br />
less than 4% of the Company’s total pension obligation.<br />
s Other post retirement benefits<br />
In the United States and to some extent in France, certain subsidiaries provide healthcare and insurance<br />
benefits to retired employees. These obligations are not funded.<br />
Note 24 — Debt<br />
(a) Analysis of debt by type<br />
LAFARGE<br />
NOTES TO THE CONSOLIDATED FINANCIAL STATEMENTS — (Continued)<br />
At December 31,<br />
2003 2002 2001<br />
(in million euros)<br />
Debenture loans ;;;;;;;;;;;;;;;;;;;;;;; 6,480 6,640 6,633<br />
Bank loans and credit lines ;;;;;;;;;;;;;;;;;;; 1,263 1,929 3,284<br />
Commercial paper;;;;;;;;;;;;;;;;;;;;;;; 114 1,681 1,590<br />
Other notes ;;;;;;;;;;;;;;;;;;;;;;;;; 372 483 798<br />
Other ;;;;;;;;;;;;;;;;;;;;;;;;;;;; 466 592 599<br />
Total debt;;;;;;;;;;;;;;;;;;;;;;;;;; 8,695 11,325 12,904<br />
Current portion of long-term debt ;;;;;;;;;;;;;;;; (985) (524) (1,350)<br />
Short-term borrowings ;;;;;;;;;;;;;;;;;;;;; (340) (530) (513)<br />
Total long-term debt ;;;;;;;;;;;;;;;;;;;;; 7,370 10,271 11,041<br />
F-44
LAFARGE<br />
NOTES TO THE CONSOLIDATED FINANCIAL STATEMENTS — (Continued)<br />
s Debenture loans<br />
At December 31, 2003, debenture loans consist of fixed rate bonds with a weighted average interest rate<br />
of 5.5%. Their maturities range from 2004 to 2017, with the average maturity being 2008. In December 2003<br />
the Company issued a debenture loan of 0.5 billion euros by exchanging a portion of 5 existing debenture<br />
loans with maturities ranging from 2005 to 2007. The new debenture loan bears interest at a rate of 5.448%<br />
and has a 10-year maturity.<br />
The Company has a Euro Medium-Term Note program (EMTN), which allows for a maximum issuable<br />
amount of 7 billion euros in 2003. As of December 31, 2003, 3.238 billion euros had been issued under the<br />
EMTN program, including 3.118 billion euros of debenture loans and 120 million of private placements<br />
included under ‘‘Other Notes’’.<br />
s Bank loans and medium and long-term committed credit lines<br />
At December 31, 2003, bank loans total 1.2 billion euros and are primarily comprised of amounts in<br />
local currencies by Company subsidiaries. Drawdowns on long and medium term committed credit facilities<br />
amount to 20 million euros out of a maximum amount available of 3.4 billion euros. The credit facilities are<br />
used primarily as a back-up for the short-term financing of the Company and contribute to the Company’s<br />
liquidity.<br />
The weighted average interest rate on these credit lines and bank loans is approximately 7.5%. This<br />
interest rate results from the weight of the debt in local currencies used by the Company’s subsidiaries.<br />
s Commercial paper<br />
The Company’s euro denominated commercial paper program at December 31, 2003 allows for a<br />
maximum issuable amount of 4.0 billion euros. Commercial paper can be issued in euros, US dollars,<br />
Canadian dollars, Swiss francs and British pounds. At December 31, 2003, the commercial paper issued under<br />
this program totaled 86 million euros (out of which 46 million euros were issued in US dollars). This<br />
commercial paper bears an average interest rate based mainly upon the European inter-bank offer rate<br />
(‘‘Euribor’’) plus an average margin of about 3 basis points, and has maturities ranging from 2 to 6 months.<br />
As of December 31, 2003, the weighted average interest rate of the euro denominated commercial paper is<br />
1.7%.<br />
The Company also has a US dollars commercial paper program under its subsidiary, <strong>Lafarge</strong> North<br />
America. This program allows for a maximum issuable amount of 300 million US dollars (238 million euros).<br />
At December 31, 2003, there is no outstanding commercial paper under this program.<br />
s Other notes<br />
Other notes principally consist of Euro notes with a weighted average interest rate of 5.2% and an<br />
average maturity in 2009.<br />
F-45
(b) Analysis of debt by maturity<br />
At<br />
December 31,<br />
2003<br />
(in million euros)<br />
2004 ;;;;;;;;;;;;;;;;;;;;;;;;;;;;;;;;;;; 1,325<br />
2005 ;;;;;;;;;;;;;;;;;;;;;;;;;;;;;;;;;;; 1,033<br />
2006 ;;;;;;;;;;;;;;;;;;;;;;;;;;;;;;;;;;; 2,005<br />
2007 ;;;;;;;;;;;;;;;;;;;;;;;;;;;;;;;;;;; 975<br />
2008 ;;;;;;;;;;;;;;;;;;;;;;;;;;;;;;;;;;; 1,407<br />
Beyond 5 years ;;;;;;;;;;;;;;;;;;;;;;;;;;;;;; 1,950<br />
At December 31, 2003, 89 million euros of short-term debt (mainly commercial paper) have been<br />
classified as long-term based upon the Company’s ability to refinance these obligations on a long-term basis<br />
through its committed credit facilities.<br />
(c) Analysis of debt by currency<br />
Before<br />
swaps<br />
8,695<br />
At December 31,<br />
2003 2002 2001<br />
After<br />
swaps<br />
Before<br />
swaps<br />
After<br />
swaps<br />
Before<br />
swaps<br />
After<br />
swaps<br />
(in million euros)<br />
Euro (EUR) ;;;;;;;;;; 5,872 3,621 7,714 5,275 8,498 5,850<br />
US dollar (USD) ;;;;;;;; 805 2,278 1,048 3,062 1,872 3,647<br />
British pound sterling (GBP) ;;; 1,111 1,803 1,391 1,670 1,221 2,064<br />
Malaysian ringgit (MYR) ;;;;; 168 168 259 259 282 282<br />
Japanese yen (JPY) ;;;;;;; 77 84 94 111 122 118<br />
Other ;;;;;;;;;;;;; 662 741 819 948 909 943<br />
Total ;;;;;;;;;;;;; 8,695 8,695 11,325 11,325 12,904 12,904<br />
(d) Analysis of debt by category<br />
Before<br />
swaps<br />
LAFARGE<br />
NOTES TO THE CONSOLIDATED FINANCIAL STATEMENTS — (Continued)<br />
At December 31,<br />
2003 2002 2001<br />
After<br />
swaps<br />
Before<br />
swaps<br />
After<br />
swaps<br />
Before<br />
swaps<br />
After<br />
swaps<br />
(in million euros)<br />
Floating rate ;;;;;;;;;; 1,296 793 3,523 2,891 5,170 4,128<br />
Fixed rate below 6%;;;;;;; 5,028 5,127 4,726 4,917 4,531 5,015<br />
Fixed rate between 6% and 10% ;; 2,085 2,459 2,641 3,054 2,707 3,231<br />
Fixed rate 10% and over ;;;;; 286 316 435 463 496 530<br />
Total ;;;;;;;;;;;;; 8,695 8,695 11,325 11,325 12,904 12,904<br />
The average spot interest rate of the debt, as at December 31, 2003, is 5.8% (5.2% as at December 31,<br />
2002 and 5.4% as at December 31, 2001).<br />
F-46
LAFARGE<br />
NOTES TO THE CONSOLIDATED FINANCIAL STATEMENTS — (Continued)<br />
(e) Particular clauses in financing contracts<br />
Financial covenants<br />
Some of the Company’s loan contracts include provisions, which require compliance with certain<br />
financial covenants. These covenants are associated with subsidiaries in the following countries: Great Britain,<br />
India, Malaysia, Philippines, Poland, South Africa and United States. Debt with such financial covenants<br />
represents approximately 6% of the total Company debt.<br />
The defaults concerned by the above financial covenants have a low probability to occur. Given the split<br />
of these contracts on various subsidiaries and the quality of the Group liquidity protection through its access<br />
to committed credit facilities, the existence of such clauses cannot materially affect the Group financial<br />
situation.<br />
Change of control clauses<br />
Change of control clauses are included in several of the Company’s committed credit facilities contracts,<br />
which amount to 56% of the total outstanding committed credit facilities (i.e. 1.9 billion euros). As a<br />
consequence, in case of change of control, these committed credit facilities will be automatically cancelled if<br />
undrawn or, in case of drawing, will have to be repaid.<br />
Note 25 — Financial Instruments<br />
The Company uses derivative financial instruments with off-balance sheet risk to manage market risk<br />
exposures. Financial instruments are entered into by the Company solely to hedge such exposures on<br />
anticipated transactions or firm commitments. The Company does not enter into derivative contracts for<br />
speculative purposes.<br />
(a) Foreign currency risk<br />
In the course of its operations, the Company’s policy is to hedge all material foreign currency exposures<br />
arising from its transactions using derivative instruments as soon as a firm or highly probable commitment is<br />
entered into or known. These derivative instruments are limited to forward contracts and foreign currency<br />
options, with a term generally less than one year.<br />
This policy is implemented in all of the Company’s subsidiaries, which are required to, when allowed by<br />
local regulations and when necessary, hedge their exposures with the Company central treasury.<br />
The Company’s operating policies reduce potential foreign currency exposures by requiring all liabilities<br />
and assets of controlled companies to be denominated in the same currency as the cash flows generated from<br />
operating activities, the functional currency. The Company may amend this general rule under special<br />
circumstances in order to take into account specific economic conditions in a specific country such as,<br />
inflation rates, interest rates, and currency related issues such as convertibility and liquidity. When needed,<br />
currency swaps are used to convert debts most often raised in euros, into foreign currencies.<br />
F-47
Foreign currency hedging activity<br />
At December 31, 2003, most forward contracts have a maturity date of less than one year. The nominal<br />
value of hedging instruments outstanding at year-end is as follows:<br />
2003<br />
At December 31,<br />
2002<br />
(in million euros)<br />
2001<br />
Forward contract purchases<br />
US dollar (USD) ;;;;;;;;;;;;;;;;;;;;;;;; 125 47 37<br />
British pound sterling (GBP) ;;;;;;;;;;;;;;;;;;; 9 74 264<br />
Other currencies ;;;;;;;;;;;;;;;;;;;;;;;; 93 13 49<br />
Total ;;;;;;;;;;;;;;;;;;;;;;;;;;;;; 227 134 350<br />
2003<br />
At December 31,<br />
2002<br />
(in million euros)<br />
2001<br />
Forward contract sales<br />
US dollar (USD) ;;;;;;;;;;;;;;;;;;;;;;;; 1,420 2,040 1,794<br />
British pound sterling (GBP) ;;;;;;;;;;;;;;;;;;; 803 443 1,189<br />
Other currencies ;;;;;;;;;;;;;;;;;;;;;;;; 184 172 72<br />
Total ;;;;;;;;;;;;;;;;;;;;;;;;;;;;; 2,407 2,655 3,055<br />
(b) Interest rate risk<br />
The Company is primarily exposed to fluctuations in interest rates based upon the following:<br />
— Price risk with respect to fixed-rate financial assets and liabilities. Interest rate fluctuations impact<br />
the market value of fixed-rate assets and liabilities.<br />
— Cash flow risk for floating rate assets and liabilities. Interest rate fluctuations have a direct effect on<br />
the financial income or expense of the Company.<br />
In accordance with established policies, the Company seeks to mitigate these risks, using to a certain<br />
extent interest rate swaps, when necessary.<br />
Interest rate hedging activity<br />
At December 31, 2003<br />
Less than one year One to 5 years More than 5 years Total<br />
Fixed<br />
rate<br />
Floating<br />
rate<br />
Fixed<br />
rate<br />
LAFARGE<br />
NOTES TO THE CONSOLIDATED FINANCIAL STATEMENTS — (Continued)<br />
Floating<br />
rate<br />
Fixed<br />
rate<br />
Floating<br />
rate<br />
Fixed<br />
rate<br />
Floating<br />
rate<br />
Debt ;;;;; 836 489 4,733 687 1,830 120 7,399 1,296<br />
Cash and cash<br />
equivalent ;; — (1,634) — — — — — (1,634)<br />
Net position<br />
before hedging 836 (1,145) 4,733 687 1,830 120 7,399 (338)<br />
Hedging<br />
instruments;; 79 (79) 419 (419) 5 (5) 503 (503)<br />
Net position after<br />
hedging ;;; 915 (1,224) 5,152 268 1,835 115 7,902 (841)<br />
F-48
LAFARGE<br />
NOTES TO THE CONSOLIDATED FINANCIAL STATEMENTS — (Continued)<br />
The notional value of rate financial instruments at year-end is as follows:<br />
At December 31, 2003<br />
Maturities of notional contract values(a)<br />
2004 2005 2006 2007 2008 4 5 years Total<br />
(in million euros)<br />
Pay fixed; euro (EUR);; 8.4% — 865 117 151 70 — 1,203<br />
Other interest rate swaps ; — 7 51 19 16 — 4 97<br />
Total;;;;;;;;; 7 916 136 167 70 4 1,300<br />
At December 31, 2002<br />
Maturities of notional contract values(a)<br />
2003 2004 2005 2006 2007 4 5 years Total<br />
(in million euros)<br />
Pay fixed; euro (EUR);; 8.1% 77 — 865 119 151 70 1,282<br />
Other interest rate swaps ; — 77 5 54 12 11 — 159<br />
Total;;;;;;;;; 154 5 919 131 162 70 1,441<br />
At December 31, 2001<br />
Maturities of notional contract values(a)<br />
2002 2003 2004 2005 2006 4 5 years Total<br />
(in million euros)<br />
Pay fixed; euro (EUR);; 7.7% 234 77 — 865 119 221 1,516<br />
Other interest rate swaps ; — 286 52 2 53 14 13 420<br />
Total;;;;;;;;; 520 129 2 918 133 234 1,936<br />
(a) The notional amounts of derivatives represent the face value of financial instruments negotiated with<br />
counter parties. Notional amounts in foreign currency are expressed in euros at the year-end exchange<br />
rate.<br />
Part of the Company’s financial assets corresponding to liquidities is comprised of short-term<br />
investments managed on a short-term basis, either through bank deposits or negotiable instruments.<br />
A 1% change in short-term interest rates calculated on the net indebtedness, and taking into account<br />
derivative instruments, would have a maximum impact on the pre-tax consolidated income of 13 million<br />
euros.<br />
A 1% change in the rate curves related to the currencies in which the Group has significant fixed rate<br />
debts would have an estimated maximum impact on the fixed rate debt fair value (calculated after swaps<br />
impact) of 291 million euros.<br />
(c) Commodity risk<br />
The Company is subject to risk of price changes in certain commodities, principally in the coal, pet<br />
coke, gas and electricity markets. The Company may, from time to time, use derivatives to manage its<br />
exposure to commodity risk. At December 31, 2003, such commitments were limited to forward purchase<br />
contracts for electricity and were not significant.<br />
(d) Counterparty risk<br />
The Company is exposed to credit risk in the event of a counterparty’s default. The Company limits its<br />
exposure to counterparty risk by rigorously selecting the counterparties with which it executes agreements.<br />
F-49
Counterparty risk is monitored by using exposure limits calculated according to several criteria (rating<br />
assigned by rating agencies, assets and equity), as well as the nature and maturity of operations. The<br />
Company’s exposure to credit risk is limited and the Company believes that there is no material concentration<br />
of risk with any single counterparty. The Company does not anticipate any third party default that might have<br />
a significant impact on the Company’s financial statements.<br />
(e) Share risk<br />
The Company owns an equity swap contract, which relates to common shares of an unrelated entity held<br />
by an independent third party for development strategy purposes. At December 31, 2003, this equity swap<br />
was for 155 million euros with a fair value of (14) million euros, which is fully provided for.<br />
(f) Fair values<br />
The following details the cost and fair values of recorded and unrecorded financial instruments:<br />
Carrying<br />
Amount<br />
LAFARGE<br />
NOTES TO THE CONSOLIDATED FINANCIAL STATEMENTS — (Continued)<br />
At December 31,<br />
2003 2002 2001<br />
Net Fair<br />
Value<br />
Carrying<br />
Amount<br />
Net Fair<br />
Value<br />
Carrying<br />
Amount<br />
Net Fair<br />
Value<br />
(in million euros)<br />
Balance sheet financial instruments<br />
Assets<br />
Cash and cash equivalents ;;;;; 1,634 1,634 1,109 1,109 1,201 1,201<br />
Accounts receivable-trade, net;;;; 1,754 1,754 1,816 1,816 2,230 2,230<br />
Other investments;;;;;;;;;<br />
Liabilities<br />
481 437 462 359 671 621<br />
Short-term bank borrowings;;;;; 340 340 530 530 513 513<br />
Accounts payable, trade ;;;;;; 1,234 1,234 1,205 1,205 1,467 1,467<br />
Debenture loans ;;;;;;;;; 6,480 6,807 6,640 6,908 6,633 6,679<br />
Other long-term debt ;;;;;;; 1,875 1,898 4,155 4,189 5,758 5,771<br />
Derivative instruments<br />
Interest rate swaps and forward rate<br />
agreements ;;;;;;;;;; — (90) — (200) — (211)<br />
Forward exchange contracts;;;;; — 133 — 91 — (37)<br />
The fair values of financial instruments have been estimated on the basis of available market quotation,<br />
or the use of various valuation techniques, such as present value of future cash flows. However, the methods<br />
and assumptions followed to disclose fair values are inherently judgmental. Thus, estimated fair values do not<br />
necessarily reflect amounts that would be received or paid in case of immediate settlement of these<br />
instruments. The use of different estimations, methodologies and assumptions could have a material effect on<br />
the estimated fair value amounts. The methodologies used are as follows:<br />
Cash and cash equivalents, accounts receivables, accounts payable, short-term bank borrowings:<br />
due to the short-term nature of these balances, the recorded amounts approximate fair value.<br />
Other investments (Marketable securities and investment securities): estimated fair value of publicly<br />
traded securities are based on quoted market prices at December 31, 2003, 2002 and 2001. For other<br />
investments for which there is no quoted price, a reasonable estimate of fair value could not be made without<br />
incurring excessive costs.<br />
F-50
Debenture loans: the fair values of the debenture loans were estimated at the quoted value for<br />
borrowings listed on a sufficiently liquid market.<br />
Other long-term debt: the fair values of long-term debt were determined by estimating future cash flow<br />
on a borrowing-by-borrowing basis, and discounting these future cash flows using an interest rate which takes<br />
into consideration the Group’s incremental borrowing rate at year end for similar types of debt arrangements.<br />
Derivative instruments: the fair values of forward exchange contracts and interest and currency swaps<br />
were calculated using market prices that the Group would pay or receive to settle the related agreements.<br />
Primarily, dealer quotes have been used to estimate the fair values of these instruments at the reporting dates.<br />
Note 26 — Other Payables<br />
Components of other payables are as follows:<br />
LAFARGE<br />
NOTES TO THE CONSOLIDATED FINANCIAL STATEMENTS — (Continued)<br />
At December 31,<br />
2003 2002 2001<br />
(in million euros)<br />
Accrued payroll expenses ;;;;;;;;;;;;;;;;;;;;;; 356 365 343<br />
Accrued interest ;;;;;;;;;;;;;;;;;;;;;;;;;; 202 223 263<br />
Corporate income tax ;;;;;;;;;;;;;;;;;;;;;;;; 125 332 453<br />
Other taxes ;;;;;;;;;;;;;;;;;;;;;;;;;;;; 146 230 138<br />
Customer rebates and discounts ;;;;;;;;;;;;;;;;;;;; 31 61 37<br />
Payables to suppliers of property, plant and equipment ;;;;;;;;;; 127 39 30<br />
Other accrued liabilities ;;;;;;;;;;;;;;;;;;;;;;; 698 688 1,046<br />
Other payables ;;;;;;;;;;;;;;;;;;;;;;;;;; 1,685 1,938 2,310<br />
Note 27 — Commitments and Contingencies<br />
(a) Collateral guarantees and other guarantees<br />
The following details collateral guarantees and other guarantees provided by the Company.<br />
At December 31,<br />
2003 2002 2001<br />
(in million euros)<br />
Securities and assets pledged ;;;;;;;;;;;;;;;;;;;; 18 77 161<br />
Property collateralizing debt ;;;;;;;;;;;;;;;;;;;; 603 766 566<br />
Guarantees given ;;;;;;;;;;;;;;;;;;;;;;;;; 191 166 404<br />
TOTAL ;;;;;;;;;;;;;;;;;;;;;;;;;;;; 812 1,009 1,131<br />
F-51
The principal collateral guarantees and other assets pledged by the Company at December 2003 are as<br />
follows.<br />
Amount of<br />
assets pledged<br />
Total<br />
balance sheet % pledged<br />
(in million euros)<br />
Intangible assets ;;;;;;;;;;;;;;;;;; — 2,823 —<br />
Tangible assets ;;;;;;;;;;;;;;;;;; 616 10,402 6%<br />
Less than one year ;;;;;;;;;;;;;;;; 22 — —<br />
Between one and five years ;;;;;;;;;;;; 392 — —<br />
More than 5 years ;;;;;;;;;;;;;;;; 202 — —<br />
Financial assets ;;;;;;;;;;;;;;;;;; 5 1,674 0%<br />
Less than one year ;;;;;;;;;;;;;;;; — — —<br />
Between one and five years ;;;;;;;;;;;; 5 — —<br />
More than 5 years ;;;;;;;;;;;;;;;; — — —<br />
TOTAL ;;;;;;;;;;;;;;;;;;;;; 621 14,899 4%<br />
(b) Commitments<br />
The following details the Company’s significant commitments.<br />
Less than<br />
one year<br />
LAFARGE<br />
NOTES TO THE CONSOLIDATED FINANCIAL STATEMENTS — (Continued)<br />
Payments due per period At December 31,<br />
One to 5<br />
years<br />
More than<br />
5 years 2003 2002 2001<br />
(in million euros) (in million euros)<br />
Debt* ;;;;;;;;;; 1,325 5,420 1,950 8,695 11,325 12,904<br />
Capital lease obligations ;; 3 5 24 32 14 20<br />
Operating leases ;;;;;; 142 318 263 723 735 400<br />
Capital expenditures and other<br />
purchase obligations ;;; 332 259 191 782 613 337<br />
Other commitments ;;;; 20 27 45 92 138 49<br />
TOTAL ;;;;;;;;; 1,822 6,029 2,473 10,324 12,825 13,710<br />
* see Note 24 (a)<br />
The Company leases certain land, quarries, building and equipment. Total rental expense under operating<br />
leases was 133 million euros, 84 million euros and 41 million euros for each of the three years ended<br />
December 31, 2003, 2002 and 2001, respectively.<br />
(c) Other contractual obligations<br />
The following details the other contractual obligations of the Company.<br />
At December 31,<br />
2003 2002 2001<br />
(in million euros)<br />
Unused confirmed credit lines ;;;;;;;;;;;;;;;;;;; 3,381 3,843 2,954<br />
Put option to purchase shares ;;;;;;;;;;;;;;;;;;; 448 745 742<br />
TOTAL;;;;;;;;;;;;;;;;;;;;;;;;;;;; 3,829 4,588 3,696<br />
F-52
LAFARGE<br />
NOTES TO THE CONSOLIDATED FINANCIAL STATEMENTS — (Continued)<br />
As part of the acquisition process of certain entities, we have granted third party shareholders the option<br />
to require us to purchase their shares at a predetermined price, according to fair market value. These<br />
shareholders are either international institutions, such as the European Bank for Reconstruction and<br />
Development, or private investors which are essentially financial or industrial investors or the former<br />
shareholders of the relevant companies. In the event these shareholders exercise these options, our percentage<br />
ownership interest in the relevant company would increase. Assuming that all of these options were exercised,<br />
the purchase price to be paid by the Company, including net debt acquired, would amount to 448 million<br />
euros as of December 31, 2003. Based upon the terms of these agreements, a portion of the total amount<br />
could be exercised in 2004 and 2005 for 197 million euros and 112 million euros, respectively. The residual<br />
139 million euros can be exercised commencing in 2006.<br />
Subsequent to the closing, we purchased an additional 10.2% equity interest in our South Korean<br />
subsidiary <strong>Lafarge</strong> Halla Cement for 71 million US dollars (56 million euros) from the State of Wisconsin<br />
Investment Board (‘‘SWIB’’). <strong>Lafarge</strong> Halla Cement will be fully consolidated starting in 2004 as opposed to<br />
proportionately consolidated in previous years, which will result in an increase in the consolidated net debt by<br />
15 million euros. As a consequence of this transaction, a put option previously granted to SWIB by the<br />
Company has been cancelled.<br />
After taking this acquisition into consideration and assuming that all of the options were exercised, the<br />
purchase price to be paid by the Company, including net debt acquired, would amount to 377 million euros<br />
of which 126 million euros would be payable pursuant to options exercisable in 2004.<br />
With respect to the acquisition of Blue Circle on July 11, 2001, <strong>Lafarge</strong> S.A. granted <strong>Lafarge</strong> North<br />
America (formerly <strong>Lafarge</strong> Corporation) the right to buy certain cement and construction material activities in<br />
North America formerly owned by Blue Circle. The option to purchase these assets can be exercised between<br />
July 1, 2002 and December 31, 2004 at a purchase price of 1,400 million US dollars, subject to certain<br />
adjustments as of the date of acquisition. If the option to purchase these assets were exercised by <strong>Lafarge</strong><br />
North America, it would have no impact on the Company’s consolidated statements.<br />
Note 28 — Litigation<br />
On December 3, 2002, the European Commission imposed a fine on the Company in the amount of<br />
250 million euros on the grounds that some of our subsidiaries had allegedly colluded on market shares and<br />
prices with their competitors between 1992 and 1998 for wallboard, essentially in the United Kingdom and<br />
Germany. <strong>Lafarge</strong> vigorously challenges this decision and has brought the case before the Court of First<br />
Instance (CFI) in Luxembourg, which has jurisdiction over such matters on February 14, 2003. The<br />
proceedings are currently taking place before the court. The resolution procedure usually takes several years<br />
based on comparable cases. As a bank guarantee was given on our behalf, no payment will have to be made<br />
before the decision of the court.<br />
Following investigations on the German cement market, the German competition authority, the<br />
Bundeskartellamt, announced on April 14, 2003, that it was imposing fines on German cement companies,<br />
including one in the amount of 86 million euros on <strong>Lafarge</strong> Zement, our German cement subsidiary for its<br />
alleged anti-competitive practices in Germany. <strong>Lafarge</strong> Zement believes that the amount of the fine is<br />
disproportionate in light of the actual facts and has brought the case before the Higher Regional Court, the<br />
Oberlandesgericht, in Düsseldorf. The court’s decision is not expected before several years. Neither payment<br />
nor any guarantee is required to be made or given prior to the court’s decision.<br />
A provision of 300 million euros was recorded in our financial statements for the year ended<br />
December 31, 2002 in connection with the two matters above, and we recorded an additional provision of<br />
9 million euros in 2003 in relation to interests on the amount of the fines.<br />
F-53
LAFARGE<br />
NOTES TO THE CONSOLIDATED FINANCIAL STATEMENTS — (Continued)<br />
On March 28, 2001, Dunn Industrial Group, Inc. (‘‘Dunn Industrial’’) filed a lawsuit against our<br />
subsidiary <strong>Lafarge</strong> North America and the City of Sugar Creek, Missouri in the Circuit Court of Jackson<br />
County, Missouri. In the suit, Dunn Industrial, the general contractor for the construction of our new cement<br />
plant in Sugar Creek, Missouri, alleges that we expanded the scope of work expected of Dunn Industrial in<br />
the construction of the plant without commensurate increases in time required for performance and amounts<br />
to be paid to Dunn Industrial. In connection therewith, the suit alleges breach of contract, quantum meruit,<br />
breach of warranty and negligent misrepresentation and seeks foreclosure of mechanic’s liens against <strong>Lafarge</strong><br />
North America and the City of Sugar Creek, Missouri, as well as damages. The amount of the liability of<br />
<strong>Lafarge</strong> North America in connection with this suit remains uncertain. The trial court ruled that the issues<br />
raised by Dunn Industrial need not be arbitrated but rather should be litigated. In December 2002, the<br />
Missouri appellate court reversed the trial court’s ruling and agreed with <strong>Lafarge</strong> North America that Dunn<br />
Industrial must arbitrate its claims. Upon further appeal by Dunn Industrial, the Missouri Supreme Court<br />
upheld the lower appellate court’s ruling and agreed that Dunn Industrial must arbitrate its claims. In its<br />
demand for relief in the arbitration, Dunn Industrial’s claims damages in excess of 120.5 million US dollars.<br />
<strong>Lafarge</strong> North America has filed certain counter claims, and believes that Dunn Industrial’s claims are<br />
without merit and is vigorously defending its position in the arbitration.<br />
In The Netherlands, a former subsidiary of the Company, Tollens Coatings B.V., is one of the<br />
defendants in an action brought in 1990 by the government in connection with the discharge of certain waste<br />
in the Lekkerker canal between 1968 and 1971. At that time, Tollens Coatings B.V. operated a paint<br />
manufacturing plant and had hired another company to carry and dispose of waste produced by the plant. The<br />
government is seeking Dutch guilders 160,000,000 (approximately 72.6 million euros) in damages, plus<br />
interest. Tollens Coatings B.V. contends that it did not instruct the disposal company to dump the waste in<br />
the Lekkerker canal and that it had no knowledge of the disposal company’s conduct. With the consent of the<br />
parties, the proceedings, which are still at the level of first instance, have been postponed several times by the<br />
court and since late 1993 no proceedings on the merits have taken place. In July 2001, the Dutch government<br />
took sufficient action to delay the running of the statute of limitations, without any other consequence. As a<br />
result, the case is still pending. Tollens Coating B.V. was disposed of with the Specialty Products division.<br />
However, pursuant to the disposition arrangements including the subsequent resale of Materis Participations<br />
to LBO France, the Company has agreed to indemnify the acquirer for any damages incurred in connection<br />
with this litigation.<br />
Finally, certain of our subsidiaries have litigation and claims pending in the normal course of business.<br />
Management is of the opinion that these matters will be settled without any material adverse effect on the<br />
Company’s financial statements.<br />
Note 29 — Related Party Transactions<br />
Transactions with equity affiliates were not material in 2003. The transactions entered into with other<br />
related parties were made under normal terms and conditions, similar to those normally granted to<br />
comparable groups.<br />
Pursuant to an agreement signed between <strong>Lafarge</strong> North America and Blue Circle North America,<br />
<strong>Lafarge</strong> North America manages in exchange for a management fee, the aforementioned assets from July 11,<br />
2001 to December 31, 2002. Subsequent to December 31, 2002, the agreement is subject to tacite annual<br />
renewal<br />
F-54
Note 30 — Employees Costs and Directors’ and Executive Officers’ Compensation for Services<br />
(a) Employees and employees costs<br />
2003 2002 2001<br />
Management staff ;;;;;;;;;;;;;;;;;;;;;; 10,976 11,647 10,811<br />
Non-management staff ;;;;;;;;;;;;;;;;;;;; 64,362 65,900 72,081<br />
Total number of employees ;;;;;;;;;;;;;;;;;; 75,338 77,547 82,892<br />
Years ended December 31,<br />
2003 2002 2001<br />
(in million euros)<br />
Employees costs;;;;;;;;;;;;;;;;;;;;;;; 2,380 2,749 2,550<br />
(b) Directors’ and executive officers’ compensation for services<br />
Years ended December 31,<br />
2003 2002 2001<br />
(in million euros)<br />
Board of Directors* ;;;;;;;;;;;;;;;;;;;;; 0.5 0.5 0.6<br />
Senior Executives ;;;;;;;;;;;;;;;;;;;;;; 9.1 7.4 8.6<br />
Total ;;;;;;;;;;;;;;;;;;;;;;;;;;; 9.6 7.9 9.2<br />
* Directors’ fees<br />
LAFARGE<br />
NOTES TO THE CONSOLIDATED FINANCIAL STATEMENTS — (Continued)<br />
Note 31 — Summary of Differences Between Accounting Principles Followed by the Company and US<br />
GAAP<br />
The accompanying consolidated financial statements of the Company have been prepared in accordance<br />
with the accounting principles described in Note 2 above (‘‘French GAAP’’) which differ in certain significant<br />
respects from those applicable in the United States of America (‘‘US GAAP’’). These differences relate<br />
mainly to the items which are described below and which are summarized in the following tables.<br />
1. Differences in accounting for business combinations under French GAAP and US GAAP<br />
(a) Goodwill recorded as a reduction of shareholders’ equity before January 1, 1989<br />
Before January 1, 1989, as described in Note 2 (e), under French GAAP, the excess of the purchase<br />
price over the fair value of the net assets acquired was written off directly to shareholders’ equity upon<br />
acquisition. This goodwill is tracked from that date through memo accounts as disclosed in Note 11 (a) where<br />
it is amortized over the estimated period of benefit. The net amortized value of such goodwill is subsequently<br />
deducted when and if the related underlying business is sold, for purposes of calculating the gain (loss) on the<br />
disposal. Under US GAAP, these goodwill amounts have been recognized as an asset, and as of January 1,<br />
2002 are no longer amortized based upon the provisions of SFAS 142, Goodwill and other Intangible Assets<br />
(‘‘SFAS 142’’) (Note 31-18 (a)).<br />
(b) Determination of the purchase price in case of share consideration<br />
Under French GAAP and US GAAP, the purchase price of a transaction accounted for as an acquisition<br />
is based on the fair value of the consideration exchanged. In the case of acquisitions involving the issuance of<br />
the Company’s shares, under French GAAP the fair value of such consideration is based on the agreed-upon<br />
share price at completion of the acquisition or at the date when the transaction becomes unconditional. Under<br />
F-55
LAFARGE<br />
NOTES TO THE CONSOLIDATED FINANCIAL STATEMENTS — (Continued)<br />
US GAAP, the fair value of the share consideration is based on the average share price on the two trading<br />
days prior to and subsequent to the announcement of the proposed acquisition. This difference in valuation of<br />
the shares results in a difference in the fair value of consideration and consequently in the amount of<br />
goodwill capitalized and amortized. As described above, as of January 1, 2002, goodwill is no longer<br />
amortized under US GAAP.<br />
(c) Negative goodwill arising on acquisitions<br />
As described in Note 2 (e), negative goodwill is amortized into income on a rational systematic basis<br />
based upon estimates of future operating results of the acquiree. Negative goodwill is presented as a liability<br />
on the balance sheet. Under US GAAP, negative goodwill has been recorded as a reduction in the fair value<br />
of long-lived assets acquired and the related depreciation expense is adjusted accordingly.<br />
(d) Fair value adjustments related to minority interests<br />
Under French GAAP, when the Company initially acquires a controlling interest in a business, any<br />
portion of the assets and liabilities considered retained by minority shareholders is recorded at their fair value.<br />
Under US GAAP, only the portion of the assets and liabilities acquired by the Company is recorded at its fair<br />
value. This gives rise to two differences:<br />
(i) Operating income is different under French GAAP than it would be under US GAAP, because of the<br />
difference in basis of assets that are amortized. This difference is offset entirely by a difference in the<br />
minority interest’s participation in the income of the subsidiary.<br />
(ii) After an initial acquisition of a subsidiary, if an additional portion of that subsidiary is subsequently<br />
acquired, under French GAAP, the purchase consideration in excess of the net assets acquired is<br />
recorded as goodwill. Under US GAAP, the incremental portion of the assets and liabilities is recorded<br />
at fair value, with any excess being allocated to goodwill.<br />
(e) Goodwill and market share amortization<br />
s Goodwill amortization<br />
Under French GAAP, acquired goodwill is amortized over the expected period of benefit, which does not<br />
exceed forty years. SFAS 142 requires that goodwill acquired in a purchase business combination completed<br />
after June 30, 2001 is not to be amortized. Subsequent to January 1, 2002, all previously recorded goodwill is<br />
no longer amortized but is tested for impairment at least annually. The French GAAP amortization of<br />
goodwill for the year ended December 31, 2001 is reduced by 24 million euros to reflect the non-amortization<br />
of goodwill resulting from business combinations subsequent to June 30, 2001, by 158 million euros for the<br />
year ended December 31, 2002 and by 117 million euros for the year ended December 31, 2003 (Note 31-18<br />
(a)).<br />
s Market share amortization<br />
Under French GAAP as described in Note 2 (e), market share, which have been separately identified on<br />
the acquisition of subsidiaries, are not amortized. Under US GAAP, market share would not be considered as<br />
a separately identifiable intangible asset, but as a component of goodwill and is accounted for based upon the<br />
provisions of SFAS 142, as described above.<br />
(f) Restructuring costs related to business combinations<br />
French GAAP provides that where a business combination results in regional over capacity, costs<br />
associated with restructuring the acquirer’s operations should be included as a cost of the acquisition. As a<br />
F-56
LAFARGE<br />
NOTES TO THE CONSOLIDATED FINANCIAL STATEMENTS — (Continued)<br />
result of certain acquisitions, the Company has closed certain of its own operations in regions where it has<br />
determined that over capacity will result from the duplication of its operations with those of the acquired<br />
operations. US GAAP specifically excludes from costs of an acquisition those costs associated with closing<br />
duplicate facilities and restructuring operations of the acquirer, such costs are charged to income as a period<br />
cost under US GAAP.<br />
(g) Goodwill relating to the acquisition of foreign subsidiaries<br />
Prior to January 1, 2001, the Company recorded goodwill relating to the acquisition of foreign<br />
subsidiaries, joint ventures and equity investments in the currency of the acquirer. Under US GAAP, such<br />
goodwill is recorded in the currency of the acquiree.<br />
(h) Depreciation period for goodwill related to the aggregates businesses prior to January 1, 2002<br />
The difference between the purchase price of the aggregates businesses and the underlying fair value of<br />
net assets is mainly allocated to mineral reserves acquired based on their fair values at the time of<br />
acquisition. Under French GAAP, the remaining goodwill is generally amortized over 40 years whereas under<br />
US GAAP, this goodwill is accounted for based upon the provisions of SFAS 142, as described above. Prior<br />
to January 1, 2002, under US GAAP, this goodwill was amortized over the residual lives of the quarries<br />
acquired, which approximated the expected future benefit of the goodwill.<br />
2. Deferred income taxes<br />
(a) Accounting for deferred income taxes before January 1, 2000<br />
As described in Note 2 (t), before January 1, 2000, the Company’s deferred tax provision was calculated<br />
using the partial allocation method. Effective January 1, 2000, as required under French GAAP, the Company<br />
adopted the balance sheet liability method, which among other changes, requires that deferred taxes be<br />
recorded on all temporary differences between the tax basis of assets and liabilities and their carrying amount<br />
in the balance sheet. The adoption of this methodology required that all deferred tax assets or liabilities be<br />
accounted for with the off setting amount recorded as an adjustment to equity. Under US GAAP, which also<br />
applies the balance sheet liability method, temporary differences arising in connection with fair value<br />
adjustments on business combinations typically result in deferred taxes and a corresponding adjustment to<br />
goodwill. Consequently, an adjustment is required in the reconciliation to US GAAP to record goodwill<br />
arising from deferred tax liabilities related to past business combinations and charged to equity under French<br />
GAAP on adoption of the balance sheet liability method.<br />
(b) Accounting for deferred tax assets<br />
The Company recognizes deferred tax on tax loss carry-forwards and on temporary differences when it is<br />
reasonably certain that the assets will be recovered in future years. Realization is dependent on generating<br />
sufficient taxable income in order to recover the deferred tax balances. The amount of the net deferred tax<br />
assets considered realizable could be reduced in the near term if estimates of future taxable income in the<br />
related taxing jurisdiction are reduced. Under US GAAP, such deferred tax assets are recognized when it is<br />
‘‘more likely than not’’ that the related tax assets will be recovered, a lower threshold than under French<br />
GAAP. This conceptual difference between French and US GAAP did not give rise to a significant<br />
reconciling difference in either 2003, 2002 or 2001.<br />
Up to December 31, 2002, under French GAAP, some deferred tax assets are disclosed based on the net<br />
estimated recoverable amount . Pursuant to Statement of Financial Accounting Standards 109, Accounting for<br />
Income Taxes (‘‘SFAS 109’’), US GAAP requires all deferred tax assets to be disclosed at the gross amount<br />
and reduced by the appropriate valuation allowance. Disclosures of the gross deferred tax assets and related<br />
F-57
LAFARGE<br />
NOTES TO THE CONSOLIDATED FINANCIAL STATEMENTS — (Continued)<br />
valuation allowance based on US GAAP amounts are presented in Note 33-3 (a). At December 31, 2003,<br />
under French GAAP, all deferred tax assets are disclosed at the gross amount and reduced by the appropriate<br />
valuation allowance.<br />
(c) Accounting for business combinations in highly inflationary economies<br />
Pursuant to SFAS 109, US GAAP prohibits recognition of a deferred tax liability or asset for differences<br />
related to assets and liabilities that under Statement of Financial Accounting Standards 52, Foreign Currency<br />
Translation (‘‘SFAS 52’’), are remeasured from the local currency into the functional currency using historical<br />
rates and that result from changes in exchange rates or indexing for tax purposes.<br />
Under French GAAP, the Company recorded a deferred tax liability on the basis differences created as a<br />
result of allocating the excess of the purchase price over the carrying value of non monetary assets acquired<br />
in highly inflationary economies (essentially fixed assets).<br />
(d) Accounting for deferred tax on tax-free reserves<br />
Under French GAAP, the Greek subsidiaries of the Group have a potential tax liability relating to the<br />
tax-free reserve component of their equity.<br />
Under Greek tax legislation, non-taxed or specially-taxed income may be transferred to special reserves<br />
under various tax incentive laws. The amounts transferred to these reserves are taxable upon their distribution,<br />
capitalization, offsetting of losses carried forward or ultimately upon the dissolution of the Company. Under<br />
US GAAP, a deferred tax liability should be recognized for the entire balance of the above reserves at the<br />
current prevailing tax rate, in the case of tax free income, or at the difference between the general tax rate<br />
and privileged tax rates in each case for the specially-taxed income, which in the case of the Greek entity is<br />
immaterial.<br />
3. Pension obligations<br />
Under US GAAP, pension costs are accounted for in accordance with Statement of Financial Accounting<br />
Standards 87, Employers’ Accounting for Pensions (‘‘SFAS 87’’). SFAS 87 requires that companies located<br />
outside the United States adopt the provisions of SFAS 87 for fiscal years beginning after December 15,<br />
1988. Due to the significant period of time that has elapsed from the date when SFAS 87 would have been<br />
required to be adopted, the Company, as permitted, has adopted SFAS 87 on January 1, 1999. At the date of<br />
adoption, the Company’s net transition obligation was 15.5 million euros. Such transition obligation is being<br />
amortized over a five-year period, which represents the remaining amortization period between the required<br />
adoption date of January 1, 1989 and January 1, 1999. Accordingly, approximately 11 million euros of the<br />
transition obligation was recorded as an adjustment to shareholders’ equity at January 1, 1999 as this amount<br />
would be recognized under SFAS 87. The residual amount of the transition obligation is being amortized<br />
systematically over the period to January 1, 2004.<br />
The Company applies the second approach of Emerging Issues Task Force Abstract 88-1, Determination<br />
of Vested Benefit Obligation to a Defined Benefit Pension Plan (‘‘EITF 88-1’’) for those pension arrangements<br />
in countries where the statutes require severance payments on accrued service benefits immediately upon<br />
separation. Under this methodology, the vested benefit obligation is determined based upon the expected date<br />
of separation or retirement rather than the measurement date.<br />
4. Restructuring provisions<br />
Restructuring plans are subject to social and legal obligations in addition to administrative authorizations<br />
in certain circumstances. Consequently, the implementation of restructuring plans is typically spread over<br />
several months. In this environment all the US GAAP criteria for recognizing restructuring liabilities may not<br />
F-58
LAFARGE<br />
NOTES TO THE CONSOLIDATED FINANCIAL STATEMENTS — (Continued)<br />
be fulfilled in the same period as required under French GAAP. The table below reconciles the income<br />
statement expense for restructuring costs as determined under French GAAP and US GAAP, prior to the<br />
effects of income taxes and minority interests.<br />
Years ended December 31,<br />
2003 2002 2001<br />
(in million euros)<br />
French GAAP restructuring expense (Note 7) ;;;;;;;;;;;;; 65 89 69<br />
Adjustments required for US GAAP purposes:<br />
— New plan provision and adjustments to prior year estimates(1) ;;;;;; 1 5 11<br />
— Costs charged against goodwill under French GAAP(2) ;;;;;;;;; 6 82 60<br />
US GAAP restructuring expense ;;;;;;;;;;;;;;;;;;; 72 176 140<br />
— Reclassifications ;;;;;;;;;;;;;;;;;;;;;;;;; (6) (20) (33)<br />
US GAAP restructuring expense after reclassifications ;;;;;;;;; 66 156 107<br />
— Impact on amortization of goodwill(2) ;;;;;;;;;;;;;;;; — — (4)<br />
Total effect on US GAAP income statement ;;;;;;;;;;;;;; 66 156 103<br />
(1) Under French GAAP, prior to January 1, 2002, the Company recorded restructuring liabilities during the<br />
period when the appropriate level of management has approved decisions. Commencing January 1, 2002,<br />
except for the recognition of restructuring charges related to business combination, there is no longer a<br />
difference in the recognition of restructuring liabilities between French and US GAAP (Note 2(p)). Under<br />
US GAAP, the Company has applied the provisions of Statement of Financial Accounting Standards 112,<br />
Employer’s Accounting for Postemployment Benefits (‘‘SFAS 112’’) and Emerging Issues Task Force 94-3,<br />
Liability Recognition for Certain Employee Termination Benefits and Other Costs to Exit an Activity<br />
(‘‘EITF 94-3’’), in accounting for its employee layoffs and restructuring costs. Under EITF 94-3, a<br />
provision for restructuring can only be recorded during the period when certain conditions are satisfied,<br />
including the specific identification and approval by the appropriate level of management of the<br />
operations and activities to be restructured, and notification to the employees of the benefit arrangement.<br />
In addition, costs associated with an exit plan are recognized as restructuring provisions only if the related<br />
costs are not associated with or do not benefit continuing activities of the Company. The foregoing<br />
creates a timing difference between (i) the recording of provisions of new French GAAP charges to the<br />
extent that such provisions are not accrued for US GAAP purposes, (ii) restructuring charges accrued<br />
under US GAAP that were expensed for French GAAP purposes in a prior period, and (iii) changes in<br />
estimates on prior year French GAAP provisions that did not qualify for accrual under US GAAP.<br />
Starting January 1, 2003, the Company applied prospectively and for all new plans initiated after this date<br />
SFAS 146, Accounting for Costs Associated with Exit or Disposal Activities. This statement requires that<br />
a liability for costs associated with exit or disposal activities to be recognized at fair value when the<br />
liability is incurred rather than at the date an entity commits to a plan of restructuring. Adoption of these<br />
provisions did not have a material impact on our financial positions or results of operations.<br />
(2) For the purpose of the US GAAP reconciliation, the Company has applied Emerging Issues Task Force<br />
95-3, Recognition of Liabilities in Connection with a Purchase Business Combination (‘‘EITF 95-3’’), in<br />
accounting for restructuring costs associated with businesses it has acquired. As discussed in (1) above,<br />
the requirements for recording restructuring costs and liabilities are more specific under US GAAP.<br />
Therefore, certain restructuring provisions included in the fair value of businesses acquired under French<br />
GAAP are not accruable under US GAAP, generating a difference in goodwill, and liabilities acquired for<br />
restructuring costs charged against goodwill under French GAAP. Those restructuring charges originally<br />
charged to goodwill under French GAAP are subsequently expensed under US GAAP once the US GAAP<br />
criteria have been satisfied for recording the costs. For years prior to January 1, 2002 reduction in<br />
amortization of goodwill is created between the French and US GAAP treatment (Note 31-18 (a)).<br />
F-59
LAFARGE<br />
NOTES TO THE CONSOLIDATED FINANCIAL STATEMENTS — (Continued)<br />
Under the French GAAP presentation, all costs classified as restructuring are presented under the caption<br />
other income (expenses) net. For US GAAP purposes, those costs that qualify for expense treatment under US<br />
GAAP are presented as operating costs (cost of goods sold or selling and administrative expenses).<br />
The table below details the impact of restructuring adjustments on shareholders’ equity pursuant to US<br />
GAAP, prior to the effects of income taxes and minority interests.<br />
At December 31,<br />
2003 2002 2001<br />
(in million euros)<br />
Provision per French GAAP (Note 23 (a)) ;;;;;;;;;;;;;; 63 154 211<br />
Provision per US GAAP ;;;;;;;;;;;;;;;;;;;;;; (50) (95) (158)<br />
Impact of reclassifications ;;;;;;;;;;;;;;;;;;;;; (6) (26) (4)<br />
Impact of change in consolidation method between French and US GAAP ; — — —<br />
Difference between US and French GAAP provisions ;;;;;;;;;; 7 33 49<br />
Restructuring costs charged against goodwill under French GAAP and which<br />
do not qualify under EITF 95-3 (2) ;;;;;;;;;;;;;;;; (8) (31) (41)<br />
Cumulative adjustment on new plan provisions and adjustment on prior<br />
estimates (1) ;;;;;;;;;;;;;;;;;;;;;;;;;; (1) 2 8<br />
Cumulative costs originally charged against goodwill (French GAAP) and<br />
subsequently expensed under US GAAP (2) ;;;;;;;;;;;;; (219) (235) (153)<br />
Cumulative amortization of goodwill (2) ;;;;;;;;;;;;;;; 13 13 13<br />
Cumulative translation adjustments;;;;;;;;;;;;;;;;;; — — —<br />
Impact on shareholders’ equity of US GAAP restructuring restatement ; (207) (220) (132)<br />
(1) Under French GAAP, prior to January 1, 2002, the Company recorded restructuring liabilities during the<br />
period when the appropriate level of management has approved decisions. Commencing January 1, 2002,<br />
except for the recognition of restructuring charges related to business combination, there is no longer a<br />
difference in the recognition of restructuring liabilities between French and US GAAP (Note 2(p)). Under<br />
US GAAP, the Company has applied the provisions of Statement of Financial Accounting Standards 112,<br />
Employer’s Accounting for Postemployment Benefits (‘‘SFAS 112’’) and Emerging Issues Task Force 94-3,<br />
Liability Recognition for Certain Employee Termination Benefits and Other Costs to Exit an Activity<br />
(‘‘EITF 94-3’’), in accounting for its employee layoffs and restructuring costs. Under EITF 94-3, a<br />
provision for restructuring can only be recorded during the period when certain conditions are satisfied,<br />
including the specific identification and approval by the appropriate level of management of the<br />
operations and activities to be restructured, and notification to the employees of the benefit arrangement.<br />
In addition, costs associated with an exit plan are recognized as restructuring provisions only if the related<br />
costs are not associated with or do not benefit continuing activities of the Company. The foregoing<br />
creates a timing difference between (i) the recording of provisions of new French GAAP charges to the<br />
extent that such provisions are not accrued for US GAAP purposes, (ii) restructuring charges accrued<br />
under US GAAP that were expensed for French GAAP purposes in a prior period, and (iii) changes in<br />
estimates on prior year French GAAP provisions that did not qualify for accrual under US GAAP.<br />
Starting January 1, 2003, the Company applied prospectively and for all new plans initiated after this date<br />
SFAS 146, Accounting for Costs Associated with Exit or Disposal Activities. This statement requires that<br />
a liability for costs associated with exit or disposal activities to be recognized at fair value when the<br />
liability is incurred rather than at the date an entity commits to a plan of restructuring. Adoption of these<br />
provisions did not have a material impact on our financial positions or results of operations.<br />
F-60
LAFARGE<br />
NOTES TO THE CONSOLIDATED FINANCIAL STATEMENTS — (Continued)<br />
(2) For the purpose of the US GAAP reconciliation, the Company has applied Emerging Issues Task Force<br />
95-3, Recognition of Liabilities in Connection with a Purchase Business Combination (‘‘EITF 95-3’’), in<br />
accounting for restructuring costs associated with businesses it has acquired. As discussed in (1) above,<br />
the requirements for recording restructuring costs and liabilities are more specific under US GAAP.<br />
Therefore, certain restructuring provisions included in the fair value of businesses acquired under French<br />
GAAP are not accruable under US GAAP, generating a difference in goodwill, and liabilities acquired for<br />
restructuring costs charged against goodwill under French GAAP. Those restructuring charges originally<br />
charged to goodwill under French GAAP are subsequently expensed under US GAAP once the US GAAP<br />
criteria have been satisfied for recording the costs. For years prior to January 1, 2002 reduction in<br />
amortization of goodwill is created between the French and US GAAP treatment (Note 31-18 (a)).<br />
F-61
The table below reconciles the balance sheet movements in the restructuring provision as determined<br />
under US GAAP for the year ended December 31, 2003. The column entitled ‘‘Currency translation<br />
adjustments and others’’ includes translation adjustments generated by foreign subsidiaries on the variation of<br />
the provisions and reclassification of provisions. All amounts indicated in the table below are expressed<br />
in million euros, unless otherwise stated:<br />
January 1,<br />
2003<br />
Current year<br />
expense, net<br />
Cash<br />
payments<br />
Recognition<br />
upon business<br />
combination<br />
Removal<br />
upon<br />
business<br />
disposals<br />
Currency<br />
translation<br />
adjustments<br />
and others<br />
December 31,<br />
2003<br />
– Restructuring provisions ;;;;;;; 154 21 (66) (14) — (32) 63<br />
– Costs incurred under both French and US<br />
GAAP, and paid in the same year ;;; — 44 (44) — — — —<br />
Total French GAAP ;;;;;;;;; 154 65 (110) (14) — (32) 63<br />
– Voluntary termination offer not accepted<br />
at balance sheet date;;;;;;;;; (8) 2 — 2 — 2 (2)<br />
– Plans not announced at balance sheet date (21) 4 — 14 — 2 (1)<br />
– Cost to train or relocate employees to<br />
another site ;;;;;;;;;;;; — — — — — — —<br />
– Cost to move inventory or tangible assets<br />
to another location ;;;;;;;;; — — — — — — —<br />
– Reengineering and consulting costs;;; — — — — — —<br />
– Other exit costs that do not qualify for<br />
accrual ;;;;;;;;;;;;;; (4) 1 — — — (1) (4)<br />
US GAAP adjustments ;;;;;;;; (33) 7 — 16 — 3 (7)<br />
US GAAP reclassification ;;;;;;; (26) (6) 8 — — 18 (6)<br />
US GAAP provisions ;;;;;;;;; 95 66 (102) 2 — (11) 50<br />
– Employee termination benefits;;;;; 9 19 (23) 4 — (6) 3<br />
– Other costs ;;;;;;;;;;;; 37 6 (20) (1) — (3) 19<br />
Total Cement ;;;;;;;;;;;; 46 25 (43) 3 — (9) 22<br />
– Employee termination benefits;;;;; 7 6 (7) — — (4) 2<br />
– Other costs ;;;;;;;;;;;; 5 4 (4) — — (2) 3<br />
Total Aggregates & Concrete ;;;;; 12 10 (11) — — (6) 5<br />
– Employee termination benefits;;;;; 23 25 (36) — — 6 18<br />
– Other costs ;;;;;;;;;;;; 10 3 (9) — — (2) 2<br />
Total Roofing ;;;;;;;;;;;; 33 28 (45) — — 4 20<br />
– Employee termination benefits;;;;; 4 3 (3) (2) — — 2<br />
– Other costs ;;;;;;;;;;;; — — — 1 — — 1<br />
Total Gypsum ;;;;;;;;;;;; 4 3 (3) (1) — — 3<br />
US GAAP provisions ;;;;;;;;; 95 66 (102) 2 — (11) 50<br />
Restructuring provisions under US GAAP consist of the following at December 31, 2003: long-term<br />
portion for 4 million euros, and current portion for 46 million euros. Cash payments for the long-term portion<br />
of restructuring costs, at December 31, 2003, under US GAAP are expected to be mostly incurred in 2005.<br />
The 50 million euros restructuring provisions determined in accordance with US GAAP at December 31,<br />
2003, includes 25 million euros for employee termination benefits, which can be analyzed, as follows:<br />
Number of<br />
employees<br />
German plans ;;;;;;;;;;;; 267<br />
UK plans ;;;;;;;;;;;;;; 39<br />
Polish plans ;;;;;;;;;;;;; 32<br />
Other plans ;;;;;;;;;;;;; 28<br />
Total ;;;;;;;;;;;;;;;; 366<br />
LAFARGE<br />
NOTES TO THE CONSOLIDATED FINANCIAL STATEMENTS — (Continued)<br />
F-62
LAFARGE<br />
NOTES TO THE CONSOLIDATED FINANCIAL STATEMENTS — (Continued)<br />
During the year ended December 31, 2003, the US GAAP restructuring expense was approximately<br />
66 million euros. Such restructuring expense included the following major actions:<br />
Year ended<br />
December 31,<br />
2003<br />
(in million euros)<br />
CEMENT<br />
UK<br />
— Involuntary termination benefits for 38 employees at <strong>Lafarge</strong> UK Cement ;;;;; 3<br />
France<br />
— Involuntary termination benefits for 40 employees and exit costs related to commercial<br />
agencies reorganization ;;;;;;;;;;;;;;;;;;;;;;;;;; 3<br />
North America<br />
— Sugar Creek plant closure and Roberta plant restructuring plan ;;;;;;;;;; 2<br />
Kenya<br />
— Involuntary termination benefits for 35 employees at Mombasa plant, Nairobi and<br />
headquarters;;;;;;;;;;;;;;;;;;;;;;;;;;;;;;; 2<br />
Honduras<br />
— Involuntary termination benefits for 80 employees at headquarters of Industria<br />
Cementerna Hondurena ;;;;;;;;;;;;;;;;;;;;;;;;;; 2<br />
Romania<br />
— Termination benefits and other exit costs related to downsizing <strong>Lafarge</strong> Romcim. ;; 2<br />
Poland<br />
— Wierzbica plant liquidation costs — Involuntary termination benefits for 171<br />
employees ;;;;;;;;;;;;;;;;;;;;;;;;;;;;;;; 1<br />
Greece<br />
— Involuntary termination benefits for 20 employees at Blue Circle Greece headquarters 1<br />
AGGREGATES & CONCRETE<br />
UK<br />
— Termination benefits and other exit costs related to Watermead Park reorganization ; 7<br />
France<br />
— Mainly involuntary termination benefits for 17 employees at Vallée de la Seine ;;; 3<br />
ROOFING<br />
Germany<br />
— Involuntary termination benefits for 291 employees with respect to <strong>Lafarge</strong><br />
Dachsysteme GmbH downsizing plans ;;;;;;;;;;;;;;;;;;;; 14<br />
— Exit costs related to downsizing plans at <strong>Lafarge</strong> Roofing Components GmbH;;;; 3<br />
— Involuntary termination benefits for 20 people and other exit costs at <strong>Lafarge</strong> Technical<br />
Centers GmbH;;;;;;;;;;;;;;;;;;;;;;;;;;;;;; 3<br />
— Atectia closure — Involuntary termination benefits and consulting costs ;;;;;; 2<br />
— Involuntary termination benefits at Schiedel GmbH and Co with respect to the<br />
downsizing program implemented in these companies ;;;;;;;;;;;;;; 2<br />
France<br />
— Involuntary termination benefits for employees related to industrial and administrative<br />
reorganization at <strong>Lafarge</strong> Couverture SA ;;;;;;;;;;;;;;;;;;; 1<br />
GYPSUM<br />
France<br />
— Santes plant closure — Involuntary termination benefits for 6 people and exit costs ; 1<br />
Germany<br />
— Gyproc integration — Voluntary termination benefits for 46 employees and other costs 2<br />
Other plans less than 1 million euros ;;;;;;;;;;;;;;;;;;;;;;; 12<br />
Current year restructuring expense;;;;;;;;;;;;;;;;;;;;;;; 66<br />
F-63
The table below reconciles the balance sheet movements in the restructuring provision as determined<br />
under US GAAP for the year ended December 31, 2002. The column entitled ‘‘Currency translation<br />
adjustments and others’’ includes translation adjustments generated by foreign subsidiaries on the variation of<br />
the provisions and reclassification of provisions. All amounts indicated in the table below are expressed<br />
in million euros, unless otherwise stated:<br />
January 1,<br />
2002<br />
Current year<br />
expense, net<br />
Cash<br />
payments<br />
Recognition<br />
upon business<br />
combination<br />
Removal<br />
upon<br />
business<br />
disposals<br />
Currency<br />
translation<br />
adjustments<br />
and others<br />
December 31,<br />
2002<br />
– Restructuring provisions ;;;;;;; 211 45 (179) 94 — (17) 154<br />
– Costs incurred under both French and US<br />
GAAP, and paid in the same year ;;; — 44 (44) — — — —<br />
Total French GAAP ;;;;;;;;; 211 89 (223) 94 — (17) 154<br />
– Voluntary termination offer not accepted<br />
at balance sheet date;;;;;;;;; (36) 66 — (41) — 3 (8)<br />
– Plans not announced at balance sheet date (8) 17 — (31) — 1 (21)<br />
– Cost to train or relocate employees to<br />
another site ;;;;;;;;;;;; (1) 1 — — — — —<br />
– Cost to move inventory or tangible assets<br />
to another location ;;;;;;;;; — — — — — — —<br />
– Reengineering and consulting costs (2) 2 — — — — —<br />
– Other exit costs that do not qualify for<br />
accrual ;;;;;;;;;;;;;; (2) 1 — (4) — 1 (4)<br />
US GAAP adjustments ;;;;;;;; (49) 87 — (76) — 5 (33)<br />
US GAAP reclassifications ;;;;;; (4) (20) (8) 4 — 2 (26)<br />
US GAAP provisions ;;;;;;;;; 158 156 (231) 22 — (10) 95<br />
– Employee termination benefits;;;;; 87 78 (146) (6) — (4) 9<br />
– Other costs ;;;;;;;;;;;; 24 4 (28) 39 — (2) 37<br />
Total Cement ;;;;;;;;;;;; 111 82 (174) 33 — (6) 46<br />
– Employee termination benefits;;;;; 10 5 (5) (1) — (2) 7<br />
– Other costs ;;;;;;;;;;;; 7 6 (7) — — (1) 5<br />
Total Aggregates & Concrete ;;;;; 17 11 (12) (1) — (3) 12<br />
– Employee termination benefits;;;;; 16 35 (21) (7) — — 23<br />
– Other costs ;;;;;;;;;;;; 13 17 (16) (3) — (1) 10<br />
Total Roofing ;;;;;;;;;;;; 29 52 (37) (10) — (1) 33<br />
– Employee termination benefits;;;;; — 12 (8) — — — 4<br />
– Other costs ;;;;;;;;;;;; — — — — — — —<br />
Total Gypsum ;;;;;;;;;;;; — 12 (8) — — — 4<br />
– Employee termination benefits;;;;; — — — — — — —<br />
– Other costs ;;;;;;;;;;;; 1 (1) — — — — —<br />
Total Specialty Products ;;;;;;; 1 (1) — — — — —<br />
US GAAP provisions ;;;;;;;;; 158 156 (231) 22 — (10) 95<br />
Restructuring provisions under US GAAP consist of the following at December 31, 2002: long-term<br />
portion for 23 million euros, and current portion for 72 million euros. Cash payments for the long-term<br />
portion of restructuring costs, at December 31, 2002, under US GAAP are expected to be incurred in 2004.<br />
The 95 million euros restructuring provisions determined in accordance with US GAAP at December 31,<br />
2002, includes 43 million euros for employee termination benefits, which can be analyzed, as follows:<br />
Number of<br />
employees<br />
German plans ;;;;;;;;;;;; 407<br />
US plans ;;;;;;;;;;;;;; 90<br />
UK plans ;;;;;;;;;;;;;; 40<br />
Other plans ;;;;;;;;;;;;; 4<br />
Total ;;;;;;;;;;;;;;; 541<br />
LAFARGE<br />
NOTES TO THE CONSOLIDATED FINANCIAL STATEMENTS — (Continued)<br />
F-64
LAFARGE<br />
NOTES TO THE CONSOLIDATED FINANCIAL STATEMENTS — (Continued)<br />
During the year ended December 31, 2002, the US GAAP restructuring expense was approximately<br />
156 million euros. Such restructuring expense included the following major actions:<br />
Year ended<br />
December 31,<br />
2002<br />
(in million euros)<br />
CEMENT<br />
Greece<br />
— Voluntary termination benefits for 174 employees at Blue Circle Greece cement<br />
companies ;;;;;;;;;;;;;;;;;;;;;;;;;;;;;;; 30<br />
Serbia<br />
— Voluntary termination benefits for 1009 employees ;;;;;;;;;;;;;;; 14<br />
Spain<br />
— Early retirement benefits in <strong>Lafarge</strong> Asland for 31 employees ;;;;;;;;;; 8<br />
Nigeria<br />
— Voluntary termination benefits for 790 employees in Ashaka and other redundancy<br />
costs in Ewekoro ;;;;;;;;;;;;;;;;;;;;;;;;;;;;; 6<br />
Romania<br />
— Termination benefits and other exit costs related to the downsizing of <strong>Lafarge</strong> Romcim 4<br />
AGGREGATES & CONCRETE<br />
UK<br />
— Involuntary termination benefits for 12 employees in Thirslington quarry and other<br />
costs related to Watermead Park restructuring ;;;;;;;;;;;;;;;;; 4<br />
Germany<br />
— Involuntary termination benefits for 33 employees and other plant closure costs ;;; 2<br />
Greece<br />
— Voluntary termination benefits for 11 employees at Blue Circle Greece concrete<br />
companies ;;;;;;;;;;;;;;;;;;;;;;;;;;;;;;; 1<br />
ROOFING<br />
Germany<br />
— Involuntary termination benefits for 175 employees with respect to <strong>Lafarge</strong><br />
Dachsysteme GmbH and Ruppkeramik GmbH downsizing plans ;;;;;;;;; 10<br />
— Involuntary termination benefits related to Kloeber acquisition ;;;;;;;;;; 8<br />
— Involuntary termination benefits at Schiedel GmbH & Co with respect to the<br />
downsizing program implemented in these companies ;;;;;;;;;;;;;; 4<br />
— Termination benefits for 48 employees with respect to the downsizing program<br />
implemented at <strong>Lafarge</strong> Roofing Technical Centers GmbH ;;;;;;;;;;;; 3<br />
Benelux<br />
— Termination benefits for 30 employees and other exit costs at <strong>Lafarge</strong> Roofing Benelux<br />
B.V. with respect to the closure of production sites ;;;;;;;;;;;;;;; 2<br />
France<br />
— Involuntary termination benefits at <strong>Lafarge</strong> Couverture SA with respect to the<br />
downsizing program implemented in these companies ;;;;;;;;;;;;;; 1<br />
GYPSUM<br />
Poland<br />
— Termination benefits in <strong>Lafarge</strong> Gyps Polska ;;;;;;;;;;;;;;;;; 4<br />
USA<br />
— Welmington plant closure — Involuntary termination benefits for 99 employees ;;; 4<br />
Other plans less than 1 million euros ;;;;;;;;;;;;;;;;;;;;;;; 51<br />
Current year restructuring expense;;;;;;;;;;;;;;;;;;;;;;; 156<br />
F-65
The table below reconciles the balance sheet movements in the restructuring provision as determined<br />
under US GAAP for the year ended December 31, 2001. The column entitled ‘‘Currency translation<br />
adjustments and others’’ includes translation adjustments generated by foreign subsidiaries on the variation of<br />
the provisions and reclassification of provisions. All amounts indicated in the table below are expressed<br />
in million euros, unless otherwise stated:<br />
January 1,<br />
2001<br />
LAFARGE<br />
NOTES TO THE CONSOLIDATED FINANCIAL STATEMENTS — (Continued)<br />
Current year<br />
expense, net<br />
Cash<br />
payments<br />
Recognition<br />
upon business<br />
combination<br />
Removal<br />
upon<br />
business<br />
disposals<br />
Currency<br />
translation<br />
adjustments<br />
and others<br />
December 31,<br />
2001<br />
– Restructuring provisions ;;;;;;; 101 41 (150) 226 — (7) 211<br />
– Costs incurred under both French and US<br />
GAAP, and paid in the same year ;;; — 28 (28) — — — —<br />
Total French GAAP ;;;;;;;;; 101 69 (178) 226 — (7) 211<br />
Change in consolidation method for US<br />
GAAP purposes (Note 31-11) ;;;;; 12 — — — (12) — —<br />
– Voluntary termination offer not accepted<br />
at balance sheet date;;;;;;;;; (9) 61 — (88) 1 (1) (36)<br />
– Plans not announced at balance sheet date (52) 4 — 38 2 — (8)<br />
– Cost to train or relocate employees to<br />
another site ;;;;;;;;;;;; (1) — — — — — (1)<br />
– Cost to move inventory or tangible assets<br />
to another location ;;;;;;;;; — — — — — — —<br />
– Reengineering and consulting costs — (2) — — — — (2)<br />
– Other exit costs that do not qualify for<br />
accrual ;;;;;;;;;;;;;; (10) 8 — (2) 2 — (2)<br />
US GAAP adjustments ;;;;;;;; (72) 71 — (52) 5 (1) (49)<br />
US GAAP reclassifications ;;;;;; (6) (33) 21 6 — 8 (4)<br />
US GAAP provisions ;;;;;;;;; 35 107 (157) 180 (7) — 158<br />
– Employee termination benefits;;;;; 2 46 (102) 142 — (1) 87<br />
– Other costs ;;;;;;;;;;;; 10 2 (3) 19 — (4) 24<br />
Total Cement ;;;;;;;;;;;; 12 48 (105) 161 — (5) 111<br />
– Employee termination benefits;;;;; 2 10 (7) 1 — 4 10<br />
– Other costs ;;;;;;;;;;;; 1 1 — 4 — 1 7<br />
Total Aggregates & Concrete ;;;;; 3 11 (7) 5 — 5 17<br />
– Employee termination benefits;;;;; 6 28 (29) 9 — 2 16<br />
– Other costs ;;;;;;;;;;;; 6 16 (12) 5 — (2) 13<br />
Total Roofing ;;;;;;;;;;;; 12 44 (41) 14 — — 29<br />
– Employee termination benefits;;;;; — 2 (2) — — — —<br />
– Other costs ;;;;;;;;;;;; — — — — — — —<br />
Total Gypsum ;;;;;;;;;;;; — 2 (2) — — — —<br />
– Employee termination benefits;;;;; 1 1 (1) — (1) — —<br />
– Other costs ;;;;;;;;;;;; 7 1 (1) — (6) — 1<br />
Total Specialty Products ;;;;;;; 8 2 (2) — (7) — 1<br />
US GAAP provisions ;;;;;;;;; 35 107 (157) 180 (7) — 158<br />
Cash payments for restructuring costs provided at December 31, 2001, under US GAAP are expected to<br />
be incurred in 2002.<br />
The 158 million euros restructuring provisions determined in accordance with US GAAP at December 31,<br />
2001, includes 113 million euros for employee termination benefits, which can be analyzed, as follows:<br />
Number of employees<br />
German plans ;;;;;;;;;;;; 513<br />
US plans ;;;;;;;;;;;;;; 273<br />
UK plans ;;;;;;;;;;;;;; 233<br />
Other plans ;;;;;;;;;;;;; 416<br />
Total ;;;;;;;;;;;;;;;; 1,435<br />
F-66
LAFARGE<br />
NOTES TO THE CONSOLIDATED FINANCIAL STATEMENTS — (Continued)<br />
During the year ended December 31, 2001, the US GAAP restructuring expense was approximately<br />
107 million euros. Such restructuring expense included the following major actions:<br />
Year ended<br />
December 31,<br />
2001<br />
(in million euros)<br />
CEMENT<br />
Philippines<br />
— Severance costs due to the closure of production lines in <strong>Lafarge</strong> Philippines<br />
companies with respect to the integration of Blue Circle Philippines ;;;;;;;; 1<br />
USA<br />
— Closing of Sugar Creek cement plant ;;;;;;;;;;;;;;;;;;;; 2<br />
Greece<br />
— Voluntary termination benefits for 313 employees at Blue Circle Greece cement<br />
companies ;;;;;;;;;;;;;;;;;;;;;;;;;;;;;;; 24<br />
AGGREGATES & CONCRETE<br />
USA<br />
— Elimination of positions upon the integration of BCI North America ;;;;;;;; 8<br />
Canada<br />
— Cost of change from a full production to a swing production of Kamloops plant in<br />
<strong>Lafarge</strong> North America ;;;;;;;;;;;;;;;;;;;;;;;;;; 1<br />
Greece<br />
— Voluntary termination benefits for 26 employees at Blue Circle Greece cement<br />
companies ;;;;;;;;;;;;;;;;;;;;;;;;;;;;;;; 2<br />
ROOFING<br />
Germany<br />
— Termination benefits for 186 employees with respect to Dachsysteme GmbH and<br />
RuppkeramikGmbH downsizing plans ;;;;;;;;;;;;;;;;;;;; 12<br />
— Involuntary termination benefits at <strong>Lafarge</strong> couverture, <strong>Lafarge</strong> Roofing Components<br />
GmbH & Co. KG and Schiedel GmbH & Co with respect to the downsizing program<br />
implemented in these companies ;;;;;;;;;;;;;;;;;;;;;; 4<br />
— Termination benefits for 24 employees with respect to the downsizing program<br />
implemented at <strong>Lafarge</strong> Roofing Technical Centers GmbH ;;;;;;;;;;;; 2<br />
Netherlands<br />
— Termination benefits for 32 employees and other exit costs at <strong>Lafarge</strong> Roofing Benelux<br />
BV with respect to the closure of production sites ;;;;;;;;;;;;;;; 5<br />
GYPSUM<br />
Poland<br />
— Termination benefits in <strong>Lafarge</strong> Gyps Polska ;;;;;;;;;;;;;;;;; 2<br />
Other plans less than 1 million euros ;;;;;;;;;;;;;;;;;;;;;;; 44<br />
Current year restructuring expense;;;;;;;;;;;;;;;;;;;;;;; 107<br />
F-67
LAFARGE<br />
NOTES TO THE CONSOLIDATED FINANCIAL STATEMENTS — (Continued)<br />
5. Other provisions<br />
(a) Accounting for provisions for unrealized foreign exchange losses<br />
French GAAP allows for the limitation of foreign currency exchange losses on debt negotiated in foreign<br />
currencies where the interest rate on the foreign debt is less than that available on the local currency. In such<br />
situations, the loss is limited to the difference between the actual interest expense recorded and the amount of<br />
interest expense that would have been recorded if the debt was originally negotiated in the local currency.<br />
US GAAP requires that the foreign currency translation gain or loss on the foreign denominated debt be<br />
included in income for the period.<br />
(b) Accounting for environmental liabilities and site restoration provisions<br />
French GAAP allows provisions for site restoration and environmental liabilities to be determined on a<br />
discounted basis if the effect of the time value of money is material. Under US GAAP, based on American<br />
Institute of Certified Public Accountants Statement of Position 96-1, Environmental Remediation Liabilities,<br />
(‘‘SOP 96-1’’), a company can elect to discount environmental liabilities only when the timing and amounts<br />
of payments are fixed and reliably determinable. Under US GAAP, the Company does not discount these<br />
liabilities. In June 2001, the Financial Accounting Standards Board (‘‘FASB’’) issued SFAS No. 143,<br />
‘‘Accounting for Asset Retirement Obligations.’’ This statement addresses financial accounting and reporting<br />
for obligations associated with the retirement of tangible long-lived assets and the associated asset retirement<br />
costs. The purpose of this statement is to develop consistent accounting for asset retirement obligations and<br />
related costs in financial statements and provide more information about future cash outflows, leverage and<br />
liquidity regarding retirement obligations and the gross investment in long-lived assets. The company<br />
implemented SFAS No. 143 on January 1, 2003. Prior to adoption, the Company provided for its estimated<br />
quarry reclamation obligation over the life of the quarry based on the units of production. Adoption of the<br />
provisions of SFAS No. 143 did not have a material impact on the Company’s financial positions or results of<br />
operations.<br />
(c) Other<br />
Prior to January 1, 2002, the Company recorded provisions based on management’s estimates of other<br />
possible risks, such as tax litigation, employee claims, indemnification for companies sold, possible exchange<br />
losses, and environmental risks. Under US GAAP, these provisions have been reversed to the extent that they<br />
do not meet specific criteria of Statement of Financial Accounting Standards 5, Accounting for Contingencies<br />
(‘‘SFAS 5’’) for accrual under US GAAP at the balance sheet date. When the risk of loss was and is<br />
considered reasonably possible of occurrence under US GAAP, pursuant to SFAS 5, only disclosure of the<br />
contingent liability is appropriate. As of January 1, 2002 the Company has adopted the new French<br />
accounting regulation Comité de la Réglementation Comptable 2000-06 (‘‘CRC 00-06’’). The new French<br />
standard defines loss contingencies substantially the same as SFAS 5.<br />
6. Stock based compensation and employee stock plans<br />
(a) Employee stock option plans<br />
Under French GAAP, compensation cost is not recorded for stock options and stock purchase plans.<br />
Under US GAAP, the Company accounts for stock based compensation awards pursuant to Accounting<br />
Principles Board Opinion 25, Accounting for Stock Issued to Employees (‘‘APB 25’’) which requires that<br />
compensation expense be recorded when the market price of the stock at the measurement date exceeds the<br />
amount the employee is required to pay upon exercise of the option. The stock options granted to employees<br />
have been repriced in situations where there would be a theoretical dilution of the option holder’s percentage<br />
interest in the Company. Typically, these repricing events arise from the Company’s issuance of common<br />
F-68
LAFARGE<br />
NOTES TO THE CONSOLIDATED FINANCIAL STATEMENTS — (Continued)<br />
stock or warrants. Under US GAAP, the repricing of the Company’s stock option plan causes the plan to be<br />
considered a variable plan under APB 25. As a result, the Company has recorded a compensation expense of<br />
2 million euros in the year ended December 31, 2003, recorded a recovery of previously recognized<br />
compensation expense of 60 million euros in the year ended December 31, 2002 and recorded a<br />
compensation expense of 50 million euros in the year ended December 31, 2001.<br />
Additional disclosures in accordance with APB 25 and Statement of Financial Accounting Standards 123,<br />
Accounting for Stock Issued to Employees (‘‘SFAS 123’’) are presented in Note 33-2.<br />
In accordance with SFAS 123, the Company discloses compensation cost based on the estimated fair<br />
value of the options on the grant dates. Compensation cost is estimated to be the fair value of all options<br />
granted based on the binomial option-pricing model for the <strong>Lafarge</strong> S.A. options and the Black Scholes<br />
model for the <strong>Lafarge</strong> North America options.<br />
As of December 31, 2002, the Company adopted the disclosure requirements of SFAS 148, Accounting<br />
for Stock-Based Compensation — Transition and Disclosure. The costs associated with options granted in<br />
each of the three years ended December 31, 2003, 2002 and 2001 are 47 million euros, 35.7 million euros<br />
and 34.8 million euros, respectively. The pro-forma amounts below reflect the fair value effect as if the<br />
options granted had been charged to income for the years presented.<br />
F-69
LAFARGE<br />
NOTES TO THE CONSOLIDATED FINANCIAL STATEMENTS — (Continued)<br />
2003<br />
Years ended December 31,<br />
2002 2001<br />
(in million euros except per share amounts)<br />
Numerator<br />
US GAAP (Note 32 (c))<br />
Net earnings for purposes of:<br />
— basic earnings per share ;;;;;;;;;;;;;; 831 436 702<br />
— diluted earnings per share;;;;;;;;;;;;;; 861 436 725<br />
Stock-based employee compensation (recovery) expense included<br />
in net earnings;;;;;;;;;;;;;;;;;;;; 2 (53) 45<br />
Total stock-based employee compensation expense determined<br />
under fair value based method for all awards ;;;;;;; (47) (36) (35)<br />
Net effect on basic and diluted earnings ;;;;;;;;;; (45) (89) 10<br />
Pro forma<br />
Net earnings for purposes of:<br />
— basic earnings per share ;;;;;;;;;;;;;; 786 347 712<br />
— diluted earnings per share;;;;;;;;;;;;;; 816 347 735<br />
Earnings per share<br />
US GAAP<br />
Basic ;;;;;;;;;;;;;;;;;;;;;;;; 5.66 3.36 5.57<br />
Diluted ;;;;;;;;;;;;;;;;;;;;;;; 5.45 3.34 5.47<br />
Pro forma<br />
Basic ;;;;;;;;;;;;;;;;;;;;;;;; 5.35 2.68 5.65<br />
Diluted ;;;;;;;;;;;;;;;;;;;;;;; 5.17 2.66 5.55<br />
Number of shares (thousands)<br />
US GAAP: basic ;;;;;;;;;;;;;;;;;;; 146,891 129,629 125,974<br />
US GAAP: diluted ;;;;;;;;;;;;;;;;;;; 157,970 130,547 132,433<br />
The SFAS No. 123 method of accounting does not apply to options granted before January 1, 1995. The<br />
pro forma compensation cost may not be representative of that to be expected in future years.<br />
(b) Employee stock plans<br />
The Company’s shares are offered to employees, as determined by management, at a maximum discount<br />
of 20% under the plan ‘‘<strong>Lafarge</strong> in Action’’. Under French GAAP, no compensation expense is recorded for<br />
the discount.<br />
Under US GAAP, such discount must be recorded as compensation expense pursuant to APB 25 with a<br />
corresponding increase in additional paid-in capital. An amount of 25 million euros has been charged to<br />
income for US GAAP purposes in 2002. There were no such shares issued to employees in 2003 and 2001.<br />
In conjunction with the Company’s stock purchase plan described above, the Company has granted loans<br />
to employees for the purpose of subscribing to the offered shares. Pursuant to APB 25, such loans are<br />
recorded as a reduction of shareholders’ equity. For the years ended December 31, 2003 and 2002, amounts<br />
of 7 million euros and 21 million euros, respectively, remain outstanding on these loans. No such loan existed<br />
at December 31, 2001.<br />
F-70
LAFARGE<br />
NOTES TO THE CONSOLIDATED FINANCIAL STATEMENTS — (Continued)<br />
7. Investments in marketable securities<br />
In accordance with French GAAP, as described in Note 2 (j), the Company’s policy is to value<br />
marketable securities and other equity securities at the lower of historical cost or net realizable value with<br />
any resulting unrealized losses recorded in the statement of income. French GAAP does not permit upward<br />
adjustments in the value of these securities to reflect their fair market value.<br />
Under US GAAP, Financial Statement of Accounting Standards 115, Accounting for Certain Investments<br />
in Debt and Equity Securities (‘‘SFAS 115’’), requires that investments in marketable securities be divided<br />
into three categories: trading (securities that are bought and held principally for the purpose of selling them in<br />
the near term), held to maturity (securities that the Company has a positive intent and ability to hold to<br />
maturity), and securities available for sale (all other securities). Most of the marketable debt and equity<br />
securities of the Company are classified as available for sale with unrealized gains and losses excluded from<br />
earnings and reported as a component of shareholders’ equity (other comprehensive income). Unrealized<br />
losses that are other than temporary are charged to income.<br />
Available-for-sale securities<br />
At December 31, 2003, 2002 and 2001, the Company’s cost, gross unrealized gains, gross unrealized<br />
losses and fair value of the available-for-sale investment securities by major security type are as follows:<br />
Gross<br />
Gross<br />
Cost unrealized gains unrealized losses Fair value<br />
2003 ;;;;;;;;;;;;;;;;; 392 —<br />
(in million euros)<br />
44 348<br />
2002 ;;;;;;;;;;;;;;;;; 319 — 105 214<br />
2001 ;;;;;;;;;;;;;;;;; 317 — 53 264<br />
The change in the net unrealized gains or losses on available for sale securities that have been included<br />
in a separate component of shareholders’ equity for 2003, 2002 and 2001 is an increase of 61 million euros, a<br />
decrease of 52 million euros and a decrease of 269 million euros, respectively.<br />
In 2000, the Company acquired 9.99% of the common shares of the Portuguese cement producer Cimpor<br />
for 319 millions Euros, which represented an average 4,75 euros per share. The market value of the shares<br />
then declined and, at December 31, 2002, was approximately 215 million euros. In December 2003, the<br />
Company purchased an additional 2.65% of the common shares of Cimpor common stock at 4.06 euro per<br />
share, increasing their ownership position to 12.64%. The market value of all shares at December 31, 2003<br />
was approximately 348 million euros, 44 million euros below the carrying value of the investment of<br />
392 million euros, as disclosed in Note 14.<br />
The Company has not recorded an other-than-temporary impairment on this investment as it has the<br />
intent and ability to retain its investment for a period of time sufficient for the recovery in market value. The<br />
Company has viewed, and continues to view, its investment in Cimpor as a strategic investment and, in line<br />
with this view, has recently acquired additional Cimpor shares, as discussed above. The Company also notes<br />
that Cimpor’s share price has experienced a steady increase since early 2003. The Company derives certain<br />
benefits from its investment that are not reflected in Cimpor’s share price. These benefits include an industrial<br />
and technical cooperation agreement with Cimpor that provides an annual revenue stream and opportunities<br />
for collaboration with Cimpor management to enhance the efficiency and create operating synergies for both<br />
operations, as evidenced, for example, by certain asset sales transactions. The Company will continue to<br />
monitor the value of its investment in Cimpor and evaluate it for possible impairment, as appropriate.<br />
F-71
LAFARGE<br />
NOTES TO THE CONSOLIDATED FINANCIAL STATEMENTS — (Continued)<br />
Gross realized gains and losses on marketable securities classified as available-for-sale are included in<br />
the Company’s consolidated statements of income. Realized gains and losses for securities held by the<br />
Company are determined using the average cost method. Gross realized gains and losses for the years ended<br />
December 31, 2003, 2002 and 2001 are as follows:<br />
Proceeds Book value<br />
Gross<br />
realized gains<br />
Gross<br />
realized losses<br />
(in million euros)<br />
2003 ;;;;;;;;;;;;;;;;; — — — —<br />
2002 ;;;;;;;;;;;;;;;;; — — — —<br />
2001 ;;;;;;;;;;;;;;;;; 314 109 205 —<br />
8. Equity method investments<br />
(a) US GAAP reconciliation<br />
Under French GAAP, the Company accounts for its investments on the equity method using the<br />
investees local GAAP adjusted as necessary to be in accordance with French GAAP. Under US GAAP, the<br />
results of operations and financial position of these investees must be accounted for in accordance with US<br />
GAAP prior to the Company’s recognition of its share in income of companies accounted for under equity<br />
method. The adjustments to present investees under US GAAP relate primarily to accounting for business<br />
combinations, deferred income taxes, marketable securities, derivative instruments, provisions for<br />
restructuring, pensions, general provisions, maintenance and other provisions, start-up costs and fixed asset<br />
revaluations.<br />
(b) Amortization of goodwill<br />
Under French GAAP, the excess of the purchase price of equity method investments over the historical<br />
net book value of the investment is generally considered as goodwill, and is amortized over 40 years. Under<br />
US GAAP, such excess purchase price is allocated to the corresponding underlying assets of the investee and<br />
amortized over their respective useful lives, ranging from 15 to 25 years. Any remaining difference is<br />
considered goodwill, which was amortized over 40 years through December 31, 2001. Effective on January 1,<br />
2002, this goodwill is no longer amortized in accordance with SFAS 142.<br />
(c) Acquisition of Blue Circle Industries, plc<br />
Prior to the date of acquisition, under French GAAP, the Company’s 22.58% investment in Blue Circle,<br />
was accounted for using the cost method. For purposes of US GAAP, prior to the date of acquisition this<br />
investment was accounted for using the equity method of accounting.<br />
9. Start-up costs<br />
Start-up costs capitalized by the Company under French GAAP have been expensed under US GAAP<br />
following the requirements of American Institute of Certified Public Accountants Statement of Position 98-5,<br />
Reporting of Costs of Start-Up Activities (‘‘SOP 98-5’’). As a result, there is a timing difference in the<br />
expense recognition between French and US GAAP. For the years ended December 31, 2003, 2002, and 2001<br />
start-up costs expensed under US GAAP were greater than (less than) the amortization of previously<br />
capitalized costs in French GAAP as follows; 2003, (1) million euros; 2002, (9) million euros; 2001,<br />
(3) million euros.<br />
F-72
LAFARGE<br />
NOTES TO THE CONSOLIDATED FINANCIAL STATEMENTS — (Continued)<br />
10. Disposal of the Specialty Products division<br />
On December 28, 2000, the Company entered into a legally binding agreement to dispose of 65.31% of<br />
the Specialty Products division, with the exception of the US Road Marking Business and the Lime Business.<br />
Under French GAAP, the gain on disposal of these businesses has been included in the statement of income<br />
for the year ended December 31, 2000, since the conditions outstanding at year-end, independent of the will<br />
of the parties, were fulfilled at the date the accounts were approved and finalized. Under US GAAP, this gain<br />
was not recognized in the year-ended December 31, 2000, but at the date of the formal closing and transfer<br />
of shares, which occurred upon cash settlement on January 22, 2001.<br />
Because under French GAAP the Company considered it has sold the majority of this division, all<br />
companies in the part of the division considered sold are presented as equity method investments under<br />
French GAAP at December 31, 2000. In US GAAP however, all companies included in the Specialty<br />
Products division remained fully consolidated at December 31, 2000 as the disposal is not considered<br />
effective until January 22, 2001.<br />
11. Derivative instruments<br />
(a) Accounting for derivative instruments<br />
Under French GAAP, the fair value of derivative instruments is recorded in the Company’s accounting<br />
records when the assets and liabilities of an acquiree are fair valued as the result of a business combination.<br />
In all other situations, French GAAP does not require the recognition of the fair value of derivative<br />
instruments. As of January 1, 2001 pursuant to the guidance in Statement of Financial Accounting Standards<br />
133 Accounting for Derivative Instruments and Hedging Activities (‘‘SFAS 133’’), as interpreted and<br />
amended, the Company records financial instruments, which meet the criteria for recognition as derivatives.<br />
Derivative instruments are marked to market and recorded on the balance sheet. The accounting for changes<br />
in fair value of a derivative depends on the intended use of the derivative and the resulting designation. The<br />
Company designates its derivatives based upon the criteria established by SFAS 133. For a derivative<br />
designated as a fair value hedge, the gain or loss is recognized in earnings in the period of change together<br />
with the offsetting loss or gain on the hedged item attributed to the risk being hedged. For a derivative<br />
designated as a cash flow hedge, the effective portion of the derivatives gain or loss is initially reported as a<br />
component of other comprehensive income (loss) and subsequently reclassified into earnings when the hedged<br />
exposure affects earnings. The ineffective portion of the gain or loss is reported in earnings immediately. For<br />
embedded derivatives, the gain or loss is recognized in earnings in the period of the change in fair value.<br />
As a result of the application of SFAS 133, for the year ended December 31, 2003, 2002 and 2001 the<br />
Company has recognized the net amount of 26 million euros recorded as an increase in income and 48 million<br />
euros recorded as an increase in other comprehensive income, a net amount of 5 million euros recorded as a<br />
decrease in income and 3 million euros recorded as an increase in other comprehensive income and 12 million<br />
euros as a decrease in income and 137 million euros as a decrease in other comprehensive income,<br />
respectively.<br />
(b) Blue Circle transaction<br />
In June 2000, the Company and Dresdner entered into an agreement whereby the Company agreed to<br />
compensate Dresdner for any loss on the sale of their Blue Circle shares and, any profit on the sale of the<br />
shares held by Dresdner will be shared between the Company and Dresdner. French GAAP does not require<br />
the valuation and recording of this agreement in the Company’s accounts. For the year ended December 31,<br />
2000, pursuant to US GAAP, specifically the 1986 AICPA issues paper, Accounting for Options (since<br />
superseded by SFAS 133, as interpreted and amended) this agreement was considered to be the equivalent of<br />
two derivative contracts: (i) a written put option and (ii) a call option, which must be recorded at market<br />
F-73
LAFARGE<br />
NOTES TO THE CONSOLIDATED FINANCIAL STATEMENTS — (Continued)<br />
value with the gain or loss recorded in income. The net market value of these options at December 31, 2000,<br />
using the Black Scholes option-pricing model was a loss of 12 million euros. Accordingly, the US GAAP<br />
reconciliation for the year ended December 31, 2000 includes this amount as a decrease in US GAAP net<br />
income. This contract was settled in 2001, under French GAAP the net proceeds received by the Company<br />
were treated as a reduction of the purchase price of Blue Circle. For purposes of US GAAP, there was an<br />
increase in US GAAP income of 49 million euros (before taxes) resulting from the net increase in the fair<br />
value of the two derivative contracts in 2001.<br />
(c) Options on shares of investees<br />
In connection with the Company’s acquisitions of shares in certain investees, the related shareholder<br />
agreements contain call options and written put options on shares owned by other co-investors. French GAAP<br />
does not require the valuation and recording of these options in the Company’s accounts. For the year ended<br />
December 31, 2000 under US GAAP, specifically the 1986 AICPA issues paper, Accounting for Options,<br />
(since superseded by SFAS 133 as interpreted and amended) upon acquisition of the shares in each of these<br />
investees, the written put options would be recorded at their fair market values and recorded as liabilities, and<br />
a portion of the acquisition price would be allocated to the related call options. Subsequent to acquisition, the<br />
options would be marked to market, with gains and losses recorded in net income. The application of SFAS<br />
133 did not change the method of accounting for these options. The market value of options are as follows:<br />
At December 31,<br />
2003 2002 2001<br />
(in million euros)<br />
Put options ;;;;;;;;;;;;;;;;;;;;;;;;;;;; — 3.1 14.1<br />
Call options ;;;;;;;;;;;;;;;;;;;;;;;;;;;; — — 17.4<br />
12. Investment subsidies<br />
Under French GAAP, certain government investment subsidies were recorded in income when received,<br />
or were deferred and amortized over the remaining service periods of the employees at the related facilities.<br />
Under US GAAP, investment subsidies are deferred and amortized over the useful lives of the property plant<br />
and equipment in which the funds were invested.<br />
13. Other items<br />
Other differences between accounting principles followed by the Company and US GAAP are not<br />
individually significant, and are presented in the aggregate in the reconciliation of net income and<br />
shareholders’ equity.<br />
14. Treasury shares<br />
Until December 31, 2002, in the French GAAP consolidated financial statements, treasury shares<br />
repurchases were accounted for by the Company as a reduction of the shareholders’ equity at acquisition cost<br />
and no further recognition was given for subsequent changes in fair value. Starting January 1, 2003, the cost<br />
of treasury shares repurchases that are intended for distribution to the employees is classified in investments<br />
in marketable securities, and accounted for as described in Note 2 (m). Remaining treasury shares that are<br />
purchased with no specific intent to be distributed to employees are recorded as a reduction of shareholders’<br />
equity at acquisition cost. All of these shares have been excluded in the earnings per share computation in<br />
accordance with French GAAP.<br />
For French GAAP purposes, a provision is recorded for unrealized losses on shares, which are classified<br />
as investments in marketable securities. Changes in the provision, including any subsequent recovery in value,<br />
if any, are recorded as financial income or expense. Increases or decreases in the fair value of shares, which<br />
F-74
LAFARGE<br />
NOTES TO THE CONSOLIDATED FINANCIAL STATEMENTS — (Continued)<br />
are classified as a reduction of shareholders’ equity, are recorded directly as a component of shareholders’<br />
equity.<br />
As of December 31, 2003, the Company was carrying 1,856,266 of its own shares of which (i) 1,058,296<br />
were classified as investments in marketable securities at a cost of 71 million euros and (ii) 797,970 were<br />
classified as a reduction of the Company shareholders’ equity for 33 million euros. A charge of 7 million<br />
euros was recognized in the Company’s French GAAP consolidated financial statements to account for<br />
unrealized losses on the Company’s own shares accounted for as investments in marketable securities.<br />
Under US GAAP, treasury shares are accounted for as a reduction of shareholders’ equity at acquisition<br />
cost, and no further recognition is given for subsequent changes in fair value. When treasury shares are<br />
resold, any differences between cost and fair value are generally recorded directly to shareholders’ equity.<br />
Accordingly, the 7 million euros expense recognized for the year ended December 31, 2003 under French<br />
GAAP has been reversed for purposes of determining the U.S GAAP net income. For the year ended<br />
December 31, 2003, the impact on shareholders’ equity would have been an increase of 7 million euros<br />
related to the cancellation of the provision and a decrease of 71 million euros related to the reclassification of<br />
treasury shares classified in investments in marketable securities under French GAAP. Those adjustments are<br />
presented in the line item ‘‘other’’ in the reconciliation of net income and shareholders’ equity from French<br />
GAAP to US GAAP.<br />
Furthermore, these shares are not considered as outstanding for purposes of the US GAAP earnings per<br />
share computation.<br />
15. <strong>Lafarge</strong> Roofing GmbH (formerly <strong>Lafarge</strong> Braas) minority interests acquisition in 1999 and 2000<br />
The acquisition by the Company of the 43.5% minority interests in <strong>Lafarge</strong> Braas through a share for<br />
share exchange was accounted for under French GAAP from the date of the contract signing which was<br />
December 22, 1999. Approximately 44% of the total share consideration for this transaction was issued in<br />
December 1999. The remainder, approximately 286 million euros, was issued on June 20, 2000 after an<br />
authorized increase in share capital. For purposes of US GAAP, the transaction is to be accounted for as a<br />
two-step acquisition based upon the dates the shares were exchanged with the minority shareholders.<br />
Consequently, an additional 82 million euros of goodwill was recorded under US GAAP based upon the<br />
different methodologies used to determine the purchase price under French and US GAAP (Note 31-1 (b)).<br />
In addition there is an effect on the Company’s net income under US GAAP because the investment in<br />
2000 was recorded without minority interests for purposes of French GAAP. Under US GAAP the effects of<br />
minority interests would be reflected until the final exchange of shares on June 20, 2000. Due to the above,<br />
the effect upon the Company’s French GAAP income for 2000 is a reduction of 11 million euros.<br />
16. Accounting for hyper-inflationary economies<br />
For the period from December 31, 1997 to January 1, 2001 for French GAAP, Indonesia was designated<br />
as hyper-inflationary by the Company and accounted for as described in Note 2 (d). The expectation, during<br />
that period, was that the worsening economic and political situation along with the strong devaluation of the<br />
Indonesian rupiah would lead to a hyper-inflationary economic environment.<br />
The US GAAP criteria used to determine hyperinflation is an inflation rate of 100% or greater for the<br />
three years prior to the year of conversion. Based upon various indices, the Indonesian economy did not<br />
exceed the 100% inflation threshold in the three years prior to 1997. Accordingly, for US GAAP purposes,<br />
Indonesia should not have been considered highly inflationary. Amounts related to the differences in<br />
accounting policies between French and US GAAP are included in the reconciliation line item ‘‘Other items’’.<br />
The effects on US GAAP net income for the years ended December 31, 2003, 2002 and 2001 are an increase<br />
of 4 million euros, an increase of 4 million euros and an increase of 4 million euros, respectively. The effects<br />
F-75
LAFARGE<br />
NOTES TO THE CONSOLIDATED FINANCIAL STATEMENTS — (Continued)<br />
on US GAAP equity at December 31, 2003, 2002 and 2001 are a decrease of 12 million euros, a decrease of<br />
22 million euros and a decrease of 26 million euros, respectively.<br />
17. Items affecting the presentation of consolidated financial statements<br />
(a) Consolidation of less than majority owned entities<br />
Under US GAAP, control is normally defined as voting control (over 50%) although there may be facts<br />
and circumstances that permit consolidation in other cases. In the case of the companies indicated by (1) in<br />
Note 34, full consolidation is considered appropriate under French GAAP while under US GAAP equity<br />
accounting is considered appropriate because the criteria in Statement of Financial Accounting Standards 94,<br />
Consolidation of all Majority Owned Subsidiaries, (‘‘SFAS 94’’) and Emerging Issues Task Force 97-2,<br />
Application of FASB Statement Nº94 and APB Opinion Nº16 to Physician Practice Management Entities and<br />
Certain Other Entities with Contractual Management Arrangements (‘‘EITF 97-2’’), are not satisfied to justify<br />
consolidation under US GAAP.<br />
This difference in accounting policy has no effect on net income or shareholders’ equity. However, this<br />
difference would reduce sales by 179 million euros, 253 million euros and 496 million euros for 2003, 2002<br />
and 2001, respectively and operating income by 51 million euros, 37 million euros and 98 million euros for<br />
2003, 2002 and 2001, respectively.<br />
(b) Accounting for joint-venture investments and use of proportionate consolidation method<br />
Companies indicated by (2) in Note 34, that are accounted for using the proportionate consolidation<br />
method under French GAAP are accounted for by the equity method for US GAAP purposes.<br />
This difference in accounting policy has no effect on net income or shareholders’ equity. However, this<br />
difference would reduce sales by 1,011 million euros, 950 million euros and 839 million euros for the years<br />
ended December 31, 2003, 2002 and 2001, respectively and reduce operating income by 170 million euros,<br />
166 million euros and 106 million euros for the same periods, respectively.<br />
(c) Reclassification to operating income under US GAAP<br />
Under US GAAP, certain items such as restructuring expenses, non recurring pension costs, net gains on<br />
disposals of fixed assets, other non recurring provisions and costs classified as other income (expense) would<br />
be classified as part of operating income. Additionally, prior to January 1, 2002, amortization of goodwill<br />
would be reclassified as operating expense under US GAAP. According to Securities and Exchange<br />
Commission (‘‘SEC’’) Staff Accounting Bulletin 101, Revenue Recognition in Financial Statements (‘‘SAB<br />
101’’), and SEC Regulation S-X, Article 5-03 (b), capital gains or losses on sales of consolidated entities or<br />
equity affiliates are also classified for US GAAP purposes as operating income (loss). Under French GAAP<br />
the items mentioned in this paragraph are not included in operating income on ordinary activities.<br />
(d) Reclassification to non operating income (loss) under US GAAP<br />
Under US GAAP, gains and losses from disposals of long-term equity investments are classified as gains<br />
on disposals under French GAAP, would be considered gains and losses from the sale of marketable<br />
securities and therefore classified as part of non operating income. Additionally, dividends received, classified<br />
as financial expenses, net under French GAAP would also be classified as part of non operating income under<br />
US GAAP.<br />
F-76
LAFARGE<br />
NOTES TO THE CONSOLIDATED FINANCIAL STATEMENTS — (Continued)<br />
(e) Impairment charges<br />
As described in Note 2 (k), under French GAAP, the Company evaluates the recoverability of long-lived<br />
assets, including goodwill and records a charge if the assets are considered impaired.<br />
In 2001 and 2002, under French GAAP, the Company did not record any significant impairment charge.<br />
In 2003, the Company recorded an impairment charge of 18 million euros related to its reporting unit <strong>Lafarge</strong><br />
Roofing Brasil Ltda. The impairment charge was based on a valuation resulting from analysis of discounted<br />
cash flows. Under French GAAP impairment charges are recorded in the line item ‘‘amortization of goodwill’’<br />
and included in other operating expenses for US GAAP purposes.<br />
(f) Reclassification of preferred shares issued by consolidated subsidiaries in the caption minority<br />
interests (US GAAP)<br />
French GAAP requires that preferred shares issued by consolidated subsidiaries be presented as debt on<br />
the parent company’s balance sheet where the shares are redeemable by the shareholder and where the related<br />
dividends are not based upon profits. Accordingly, the dividend applicable to the preferred shareholders is<br />
presented in interest expense on the statement of income. Pursuant to US GAAP, equity interests in<br />
consolidated subsidiaries owned by third parties are classified as minority interests on the balance sheet.<br />
Dividends applicable to such equity interests are presented within the caption minority interests on the<br />
consolidated statements of income. The Company has reclassified from long-term debt to minority interests<br />
103 million euros, 102 million euros and 119 million euros as at December 31, 2003, 2002 and 2001,<br />
respectively. The amount reclassified relates to preferred shares issued by a subsidiary of <strong>Lafarge</strong> North<br />
America Inc. on December 29, 2000, in conjunction with the Warren merger. Therefore, minority interests<br />
under US GAAP include 166.4 million shares of no par value preferred stock (the ‘‘Preferred Shares’’). The<br />
holder of the Preferred Shares is entitled to receive cumulative, preferential cash dividends at the annual rate<br />
of 6.0 percent of the issue price (of 113 million US dollars) from 2001 to 2003, 5.5 percent of the issue price<br />
from 2004 to 2005 and 5 percent of the issue price thereafter. The Preferred Shares are redeemable at the<br />
original issue price, in whole or in part, on or after December 29, 2005 at the option of the holder thereof.<br />
Further, at any time following December 29, 2015, <strong>Lafarge</strong> North America Inc. may redeem all or a portion<br />
of the then outstanding preferred shares at an amount equal to the issuance price. The preferred shares are<br />
entitled to a preference over the common stock and exchangeable shares of <strong>Lafarge</strong> North America Inc. with<br />
respect to the payment of dividends and to the distribution of assets of <strong>Lafarge</strong> North America Inc. in the<br />
event of <strong>Lafarge</strong> North America Inc.’s liquidation or dissolution.<br />
For the years ended December 31, 2003, 2002 and 2001, the Company recorded interest expenses of<br />
6 million euros, 9 million euros and 8 million euros, respectively associated with preferred shares. These<br />
amounts have been included in the line item ‘‘interest expense’’<br />
(g) Gross up of deferred tax assets and liabilities<br />
At December 31, 2002 and 2001, as discussed in Note 9, the parent company’s tax liability was<br />
determined on a world-wide basis in accordance with a tax agreement with the French Tax Authorities. The<br />
tax agreement covers the years presented and expired on December 31, 2003.<br />
As required per this agreement, the book and tax basis differences that exist in various foreign<br />
subsidiaries are in certain circumstances adjusted at the parent company level when preparing the world-wide<br />
tax return. Such basis adjustments create additional deferred tax assets and liabilities which under French<br />
GAAP were offset and reflected as a net amount in the caption other, net in Note 9 (c) for 2002 and 2001.<br />
Under US GAAP, those additional deferred tax assets and liabilities are disclosed separately at their gross<br />
amounts in Note 33-3 (a) for 2002 and 2001. The Company decided not to renew the agreement beyond<br />
F-77
LAFARGE<br />
NOTES TO THE CONSOLIDATED FINANCIAL STATEMENTS — (Continued)<br />
December 31, 2003. As a result, at December 31, 2003, there is no such difference between French and US<br />
GAAP disclosures.<br />
(h) Redemption premiums<br />
Under French GAAP, redemption premiums (representing the difference between the instruments’ issue<br />
price and future redemption amount) resulting from debenture loans (except OCEANE) are reported in the<br />
balance sheet as a direct addition to the face amount of the bonds and as an intangible asset amortized over<br />
the life of the bonds.<br />
Under US GAAP, the net amount of redemption premiums is recorded as a reduction of long-term debt<br />
in accordance with the provisions of APB 21 ‘‘Statement presentation of discount and premium.’’ At<br />
December 31, 2003, 2002 and 2001, the amount of redemption premiums recorded as a reduction of longterm<br />
debt was 34 million euros, 12 million euros and 13 million euros, respectively.<br />
Under French GAAP, the OCEANE redemption premiums are recorded as a component of the<br />
‘‘Provision’’ line item in the accompanying consolidated balance sheets. This classification is based upon the<br />
Company’s belief that it is unlikely the bonds will be converted into the Company’s shares at maturity.<br />
Under US GAAP, the redemption premiums have been reclassified to the line item ‘‘Long-term debt’’ in<br />
the amount of 69 million euros, 42 million euros and 14 million euros at December 31, 2003, 2002 and 2001,<br />
respectively.<br />
(i) Intangible assets<br />
Under French GAAP certain amounts are included in the balance sheet caption ‘‘Intangible assets’’<br />
which do not meet the definition of an intangible asset under SFAS 141 and SFAS 142. Accordingly, these<br />
amounts are reclassified for purposes of US GAAP (Note 31-18 (a)).<br />
18. Other items related to US GAAP accounting<br />
(a) Adoption of new US GAAP accounting pronouncements<br />
s Adoption of SFAS 141 and SFAS 142<br />
Under French GAAP, acquired goodwill is amortized over the expected period of benefit, which does not<br />
exceed forty years. In July 2001, The Financial Accounting Standards Board (‘‘FASB’’) issued SFAS No.<br />
141, ‘‘Business Combinations’’ and SFAS No. 142, ‘‘Goodwill and Other Intangible Assets.’’ These<br />
statements establish new accounting and reporting standards for business combinations and associated<br />
goodwill and intangible assets. They require, among other things, elimination of the pooling of interests<br />
method of accounting, no amortization of acquired goodwill, and a periodic assessment for impairment of all<br />
goodwill and intangible assets acquired in a business combination. SFAS 141 and SFAS 142 supersede APB<br />
Opinions No. 16 ‘‘Business Combinations’’ and No. 17 ‘‘Intangible Assets’’, respectively. As required by<br />
these new standards, the Company adopted SFAS 141 for all acquisitions subsequent to June 30, 2001, SFAS<br />
142 was adopted as of January 1, 2002.<br />
In the year of adoption, SFAS 142 required that the Company performs a transitional goodwill<br />
impairment evaluation. In its goodwill and market share impairment test, the Company uses a combination of<br />
a market approach and an income approach. In the market approach, we compare the carrying value of our<br />
reporting units with multiples of their Gross Operating Income. For reporting units presenting an impairment<br />
risk according to the market approach we then use the income approach. In the income approach, we estimate<br />
the discounted value of the sum of the expected future cash flows. If the carrying value of the reporting unit<br />
is higher than the measured fair value of the related assets and liabilities, the Company records extraordinary<br />
F-78
amortization of goodwill and market share to reduce the carrying value of the reporting unit to its determined<br />
fair value.<br />
Evaluations for impairment are significantly impacted by estimates of future prices for our products, the<br />
evolution of expenses, economic trends in the local and international construction sector, the expectations on<br />
long-term development of emerging markets and other factors. This also depends on the discount rates used.<br />
The Company has defined country specific discount rates for each of its reporting units based on their<br />
Weighted Average Cost of Capital. In some cases, the Company uses a third party valuation as part of its<br />
impairment test.<br />
Completion of the initial evaluation indicated that goodwill recorded on the Roofing reporting segment<br />
was impaired for purposes of US GAAP as of January 1, 2002. The circumstances leading to the goodwill<br />
impairments for reporting units of the Roofing segment, include in mature markets an overcapacity, and<br />
weaker demand for roofing products, due to worsening global economic trends. These circumstances caused<br />
lower than expected operating profits, cash flows, and are evidence that initial growth expectations assumed<br />
when the reporting units were acquired have changed.<br />
In 2002, as a consequence of the above, the Company has recognized a goodwill impairment charge of<br />
160 million euros as a cumulative effect of a change in accounting principle. For purposes of French GAAP,<br />
a goodwill impairment charge was not required based upon the fact that the carrying amount of Roofing<br />
segment goodwill is substantially less under French GAAP due to the US GAAP application of the balance<br />
sheet liability method of accounting for deferred taxes prior to January 1, 2000 (Notes 31-2 (a)), and the<br />
different methods used to determine the purchase price (Notes 31-1 (b), 31-15).<br />
In 2003, under French Gaap, the Company recorded an impairment charge of 18 million euros related to<br />
its reporting unit Brazil Roofing. As described above in our goodwill and market share impairment test<br />
methodology, the impairment charge was based on a valuation resulting from analysis of discounted cashflows.<br />
No additional impairment charge has been recorded under US GAAP (Note 17 (e)).<br />
The following table presents details of intangible assets:<br />
Gross<br />
carrying<br />
amount<br />
LAFARGE<br />
NOTES TO THE CONSOLIDATED FINANCIAL STATEMENTS — (Continued)<br />
At December 31, 2003 At December 31, 2002<br />
Accumulated<br />
amortization Net<br />
Gross<br />
carrying<br />
amount<br />
Accumulated<br />
amortization Net<br />
(in million euros)<br />
Mineral rights ;;;;;;; 90 (10) 80 44 (10) 34<br />
Customer lists ;;;;;;; 20 (9) 11 15 (5) 10<br />
Non-compete contracts ;;;; 14 (11) 3 13 (11) 2<br />
Other intangible assets ;;;; 66 (29) 37 59 (37) 22<br />
Intangible assets ;;;;;; 190 (59) 131 131 (63) 68<br />
F-79
The following table displays the changes in the carrying amount of goodwill by reportable segment.<br />
Certain reclassifications have been made to the prior periods to conform the 2003 presentation.<br />
Cement<br />
LAFARGE<br />
NOTES TO THE CONSOLIDATED FINANCIAL STATEMENTS — (Continued)<br />
Aggregates<br />
& Concrete Roofing Gypsum<br />
Specialty<br />
Products Unallocated Total<br />
(in million euros)<br />
At January 1, 2002;;;;; 4,796 851 1,099 107 4 761 7,618<br />
Reclassifications ;;;;;; — 110 (110) — — — —<br />
Additions ;;;;;;;;; 92 6 7 17 — — 122<br />
Disposals ;;;;;;;;; (111) — — — (1) — (112)<br />
Purchase accounting<br />
adjustments ;;;;;;; 686 31 (42) (5) 6 (737) (61)<br />
Impairment charges ;;;;; — — (160) — — — (160)<br />
Translation adjustments ;;; (604) (99) (34) (4) (4) (24) (769)<br />
At December 31, 2002 ;;; 4,859 899 760 115 5 — 6,638<br />
Additions ;;;;;;;;; 43 16 2 22 — — 83<br />
Disposals ;;;;;;;;; (11) (1) — (1) (5) — (18)<br />
Purchase accounting<br />
adjustments ;;;;;;; (53) — (34) — — — (87)<br />
Impairment charges ;;;;; — — (18) — — — (18)<br />
Translation adjustments ;;; (472) (82) 3 (6) — — (557)<br />
At December 31, 2003 ;;; 4,366 832 713 130 — — 6,041<br />
Goodwill is recorded as of the date of acquisition based upon a preliminary purchase price allocation.<br />
The Company typically makes adjustments to the preliminary purchase price allocation during the allocation<br />
period (generally not exceeding one year) as the Company finalizes the fair value of certain assets and<br />
liabilities such as property, plant and equipment, intangible assets, pension and other post-retirement benefit<br />
obligations, contingent liabilities, and deferred and current tax balances.<br />
The purchase accounting adjustments reflected in the carrying value of goodwill for the year ended<br />
December 31, 2003 include adjustments to the opening balance sheets of acquired entities made after twelve<br />
months of the respective acquisition. When we make acquisitions, certain tax contingencies and valuation<br />
allowances, may not have been finalized within the twelve-month period. We adjusted goodwill to reflect<br />
revisions in estimates and/or the ultimate disposition of these contingencies and valuation allowances in<br />
accordance with the provisions of SFAS No. 109 ‘‘Accounting for Income Taxes’’ and EITF 93-7,<br />
‘‘Uncertainties Related to Income Taxes in a Purchase Business Combination’’.<br />
F-80
LAFARGE<br />
NOTES TO THE CONSOLIDATED FINANCIAL STATEMENTS — (Continued)<br />
SFAS 142 requires disclosure of what reported income before extraordinary items and net income would<br />
have been in all periods presented including amortization expense (including any related tax effects)<br />
recognized in those periods related to goodwill, or intangible assets that are no longer being amortized.<br />
The effects of the above are presented in the table below.<br />
Years ended December 31,<br />
2003 2002 2001<br />
(in million euros)<br />
Reported income before cumulative effect of accounting change ;;;;;; 831 596 702<br />
Add back amortization of goodwill ;;;;;;;;;;;;;;;;;; — — 142<br />
Adjusted income before cumulative effect of accounting change ;;;;;; 831 596 844<br />
Cumulative effect of accounting change ;;;;;;;;;;;;;;;; — (160) —<br />
Adjusted net income ;;;;;;;;;;;;;;;;;;;;;;; 831 436 844<br />
Net income per share — basic:<br />
Reported income before cumulative effect of accounting change ;;;;; 5.66 4.59 5.57<br />
Add back amortization of goodwill ;;;;;;;;;;;;;;;;; — — 1.13<br />
Adjusted income before cumulative effect of accounting change ;;;;; 5.66 4.59 6.70<br />
Cumulative effect of accounting change ;;;;;;;;;;;;;;; — (1.23) —<br />
Adjusted net income per share — basic ;;;;;;;;;;;;;;; 5.66 3.36 6.70<br />
Net income per share — diluted:<br />
Reported income before cumulative effect of accounting change ;;;;; 5.45 4.56 5.47<br />
Add back amortization of goodwill ;;;;;;;;;;;;;;;;; — — 1.07<br />
Adjusted income before cumulative effect of accounting change ;;;;; 5.45 4.56 6.54<br />
Cumulative effect of accounting change ;;;;;;;;;;;;;;; — (1.22) —<br />
Adjusted net income per share — diluted ;;;;;;;;;;;;;; 5.45 3.34 6.54<br />
(b) Revenue recognition<br />
The following revenue recognition policy disclosure is provided to supplement the disclosure in the<br />
French GAAP footnotes, to comply with the requirements of Securities and Exchange Commission (‘‘SEC’’)<br />
Staff Accounting Bulletin 101, ‘‘Revenue Recognition in Financial Statements’’ (‘‘SAB 101’’).<br />
s Accounting for sales returns<br />
Under both US GAAP and French GAAP, provisions for returns are recorded in the same period as the<br />
related sales.<br />
s Accounting for rebates<br />
The Company offers certain rebates to its customers. Under US GAAP the Company applies the<br />
provisions of Emerging Issue Task Force 01-9 (‘‘EITF 01-9’’), ‘‘Accounting for Consideration Given by<br />
a Vendor to a Customer (Including a Reseller of the Vendor’s Products)’’, which requires the recognition<br />
of the cost of a sales incentive, such as a rebate, at the date at which the related revenue is recorded, or<br />
at the date at which the incentive is offered, if later. The Company also offers certain volume-based<br />
sales incentives to its customers. The value of such awards historically has been insignificant in relation<br />
to the value of the transactions necessary to earn the awards. The Company records a liability for the<br />
estimated cost of such awards when the incentive is offered. All sales incentives are classified as a<br />
reduction of revenue. There is no material difference in the Company’s accounting for sales incentives<br />
between French and US GAAP.<br />
F-81
LAFARGE<br />
NOTES TO THE CONSOLIDATED FINANCIAL STATEMENTS — (Continued)<br />
(c) Securitization arrangement<br />
<strong>Lafarge</strong> North America Inc. has a receivables securitization program to provide a cost-effective source of<br />
working capital and short-term financing. Under the program, the company agrees to sell, on a revolving<br />
basis, certain of its accounts receivable to a wholly-owned, special purpose subsidiary (the ‘‘SPS’’). The SPS<br />
in turn enters into an agreement to transfer, on a revolving basis, an undivided percentage ownership interest<br />
in a designated pool of accounts receivable to unrelated third-party purchasers, through the use of a qualified<br />
special purpose entity, up to a maximum of 200 million US dollars. Under the agreements, new receivables<br />
are added to the pool as collections reduce previously sold receivables. The company services, administers<br />
and collects the receivables sold.<br />
On April 1, 2001, the Company adopted the provisions of SFAS No. 140, ‘‘Accounting for Transfers and<br />
Servicing of Financial Assets and Extinguishments of Liabilities, a replacement of FASB Statement No. 125,’’<br />
which was effective for transfers and servicing of financial assets and extinguishments of liabilities occurring<br />
after March 31, 2001. Under the terms of <strong>Lafarge</strong> North America Inc.’s securitization arrangement, <strong>Lafarge</strong><br />
North America Inc. does not maintain control over the assets sold and there is no entitlement nor obligation<br />
to repurchase the sold receivables. In accordance with SFAS No. 140, the receivables securitization<br />
transactions have been accounted for as sales and, as a result, the related receivables and debt have been<br />
excluded from the accompanying Consolidated Balance Sheets.<br />
The Company has received proceeds from the sale of trade receivables of 1,545.0 million US dollars<br />
(1,223.2 million euros), 1,889.2 million US dollars (1,801.5 million euros) and 1,990.9 million US dollars<br />
(2,259.0 million euros) for the years ended December 31, 2003, 2002 and 2001, respectively. At December 31,<br />
2003, 2002 and 2001, the Company administered 82.0 million US dollars (64.9 million euros), 143.4 million<br />
US dollars (136.7 million euros) and 116.5 million US dollars (132.2 million euros), respectively, of<br />
outstanding receivables that were sold under this arrangement. As at December 31, 2003, 2002 and 2001, the<br />
related fees and discounting expense of 2.3 million US dollars (2.0 million euros), 3.4 million US dollars<br />
(3.6 million euros) and 7.1 million US dollars (7.9 million euros), respectively, have been recorded as ‘‘Other<br />
operating income (expenses), net’’ in the accompanying consolidated statements of income. The SPS holds a<br />
subordinated retained interest in the receivables not sold to third parties amounting to 96.3 million US dollars<br />
(76.2 million euros), 54.6 million US dollars (52.1 million euros) and 87.0 million US dollars (98.7 million<br />
euros), at December 31, 2003, 2002 and 2001, respectively. The subordinated interest in receivables is<br />
recorded at fair value, which is determined based on the present value of future expected cash flows<br />
estimated using management’s best estimates of credit losses and discount rates commensurate with the risks<br />
involved. Due to the short-term nature of those trade receivables, their carrying amount, less allowances,<br />
approximates fair value. Variations in the credit and discount assumptions would not significantly impact fair<br />
value.<br />
F-82
LAFARGE<br />
NOTES TO THE CONSOLIDATED FINANCIAL STATEMENTS — (Continued)<br />
(d) Related party transactions<br />
As disclosed in Note 29, transactions with companies accounted for under the equity method of<br />
accounting in French GAAP are not significant. Transactions in the ordinary course of business, with<br />
companies accounted for under the equity method of accounting in US GAAP are as follows:<br />
2003<br />
At December 31,<br />
2002<br />
(in million euros)<br />
2001<br />
Assets<br />
Accounts receivable-trade, net ;;;;;;;;;;;;;;;;;;;;; 34 47 30<br />
Other current receivables ;;;;;;;;;;;;;;;;;;;;;;; 35 37 17<br />
Long-term receivables ;;;;;;;;;;;;;;;;;;;;;;;; 52 114 54<br />
Total Assets ;;;;;;;;;;;;;;;;;;;;;;;;;;;; 121 198 101<br />
Liabilities<br />
Accounts payable, trade ;;;;;;;;;;;;;;;;;;;;;;; 8 8 1<br />
Other current payables ;;;;;;;;;;;;;;;;;;;;;;;; 15 2 1<br />
Long-term liabilities ;;;;;;;;;;;;;;;;;;;;;;;;; — — 25<br />
Total Liabilities ;;;;;;;;;;;;;;;;;;;;;;;;;; 23 10 27<br />
Years ended December 31,<br />
2003 2002 2001<br />
(in million euros)<br />
Sales ;;;;;;;;;;;;;;;;;;;;;;;;;;;;;;; 137 142 114<br />
Cost of goods sold ;;;;;;;;;;;;;;;;;;;;;;;;; 56 22 3<br />
Selling and administrative expenses ;;;;;;;;;;;;;;;;;; — — (1)<br />
F-83
Note 32 — Reconciliation of French GAAP to US GAAP and Presentation of Condensed Financial<br />
Statements<br />
The following is a summary reconciliation of net income as reported in the consolidated statements of<br />
income to net income as adjusted for the approximate effects of the application of US GAAP for the years<br />
ended December 31, 2003, 2002 and 2001 and shareholders’ equity, as reported in the consolidated balance<br />
sheets to shareholders’ equity as adjusted for the approximate effects of the application of US GAAP at<br />
December 31, 2003, 2002 and 2001.<br />
(a) Reconciliation of net income<br />
LAFARGE<br />
NOTES TO THE CONSOLIDATED FINANCIAL STATEMENTS — (Continued)<br />
Years ended December 31,<br />
2003 2002 2001<br />
(in million euros)<br />
Net income as reported in the consolidated Statements of income;;;;; 728 456 750<br />
1 — Business combinations ;;;;;;;;;;;;;;;;;;;;; 128 168 (93)<br />
2 — Deferred income taxes ;;;;;;;;;;;;;;;;;;;;; (9) (2) (5)<br />
3 — Pension obligations ;;;;;;;;;;;;;;;;;;;;;; (4) 1 8<br />
4 — Restructuring provisions ;;;;;;;;;;;;;;;;;;;; (7) (87) (71)<br />
5 — Other provisions ;;;;;;;;;;;;;;;;;;;;;;; (24) (15) 3<br />
6 — Stock based compensation and employee stock plans ;;;;;;;; (2) 35 (50)<br />
7 — Investments in marketable securities ;;;;;;;;;;;;;;; — — —<br />
8 — Equity method investments ;;;;;;;;;;;;;;;;;;; 4 — (25)<br />
9 — Start up costs;;;;;;;;;;;;;;;;;;;;;;;;; 1 9 3<br />
10 — Disposal of the Specialty Products division ;;;;;;;;;;;; — — 88<br />
11 — Derivative instruments ;;;;;;;;;;;;;;;;;;;;; 29 (8) 52<br />
12 — Investment subsidies ;;;;;;;;;;;;;;;;;;;;;; (1) — 1<br />
13 — Other items ;;;;;;;;;;;;;;;;;;;;;;;;; (12) (3) 4<br />
Total US GAAP adjustments before income tax, minority interests and<br />
cumulative effect of change in accounting principles ;;;;;;;;; 103 98 (85)<br />
Tax effects of the above US GAAP adjustments ;;;;;;;;;;;;; 18 35 14<br />
Minority interests (Note 31-15) ;;;;;;;;;;;;;;;;;;;; (18) 7 23<br />
Net income before cumulative effect of change in accounting principle<br />
according to US GAAP ;;;;;;;;;;;;;;;;;;;;;; 831 596 702<br />
Goodwill impairment on adoption of SFAS 142 (Note 31-18 (a)) ;;;;;; — (160) —<br />
Net income according to US GAAP ;;;;;;;;;;;;;;;;; 831 436 702<br />
F-84
LAFARGE<br />
NOTES TO THE CONSOLIDATED FINANCIAL STATEMENTS — (Continued)<br />
(b) Statements of income according to US GAAP<br />
For purposes of presenting consolidated statements of income for the years ended December 31, 2003,<br />
2002 and 2001 consistent with US GAAP, the Company has reflected the financial statement impact of the<br />
above reconciling items between French GAAP and US GAAP presented in the above mentioned notes.<br />
Years ended December 31,<br />
2003 2002 2001<br />
(in million euros)<br />
Sales ;;;;;;;;;;;;;;;;;;;;;;;;;;; 12,468 13,406 12,434<br />
Cost of goods sold ;;;;;;;;;;;;;;;;;;;;;; (9,159) (9,820) (9,393)<br />
Selling and administrative expenses ;;;;;;;;;;;;;;; (1,734) (1,711) (1,587)<br />
Other operating income (expenses), net ;;;;;;;;;;;;; 279 (295) (51)<br />
Operating income ;;;;;;;;;;;;;;;;;;;;;; 1,854 1,580 1,403<br />
Interest expense ;;;;;;;;;;;;;;;;;;;;;;; (520) (565) (609)<br />
Interest income ;;;;;;;;;;;;;;;;;;;;;;; 78 103 116<br />
Foreign currency exchange gains (losses), net ;;;;;;;;;;; (67) 83 141<br />
Non operating income (expenses), net ;;;;;;;;;;;;;; (64) (117) 67<br />
Income before income tax, share of net income (loss) of equity<br />
affiliates, minority interests and cumulative effect of change in<br />
accounting principle ;;;;;;;;;;;;;;;;;;;; 1,281 1,084 1,118<br />
Income tax ;;;;;;;;;;;;;;;;;;;;;;;;; (353) (370) (306)<br />
Share of net income (loss) of equity affiliates ;;;;;;;;;;; 134 122 94<br />
Minority interests ;;;;;;;;;;;;;;;;;;;;;; (231) (240) (204)<br />
Income before cumulative effect of change in accounting principle ; 831 596 702<br />
Goodwill impairment on adoption of SFAS 142 (Note 31-18 (a)) ;;; — (160) —<br />
Net income ;;;;;;;;;;;;;;;;;;;;;;;;; 831 436 702<br />
F-85
LAFARGE<br />
NOTES TO THE CONSOLIDATED FINANCIAL STATEMENTS — (Continued)<br />
(c) Earnings per share according to US GAAP<br />
In accordance with Statement of Financial Accounting Standards 128, Earnings per Share (‘‘SFAS<br />
128’’), basic earnings per share is computed by dividing income available to common shareholders by the<br />
weighted average number of common shares outstanding. The computation of diluted earnings per share is<br />
adjusted to include any potential common shares. Potential common shares include stock options, warrants,<br />
and convertible securities issued by the Company on its own stock.<br />
The computation and reconciliation of basic and diluted earnings per share for the years ended<br />
December 31, 2003, 2002 and 2001 prepared in accordance with US GAAP are as follows:<br />
2003<br />
Years ended December 31,<br />
2002 2001<br />
(in million euros, except share and per share data)<br />
Numerator<br />
Earnings before cumulative effect of adoption of SFAS 142<br />
(Note 31.18 (a)) ;;;;;;;;;;;;;;;;; 831 596 702<br />
Cumulative effect of adoption of SFAS 142 (Note 31-18 (a)) — (160) —<br />
Net earnings — basic earnings per share ;;;;;;;; 831 436 702<br />
Interest expense on convertible debt (OCEANE) ;;;;; 30 — 23<br />
Net earnings — diluted earnings per share;;;;;;;; 861 436 725<br />
Denominator (in thousands)<br />
Weighted average number of shares outstanding ;;;;; 146,891 129,629 125,974<br />
Dilutive effect of rights issue subsequent to year end ;;; — — —<br />
Weighted average number of shares outstanding — basic;; 146,891 129,629 125,974<br />
Weighed average of dilutive effect of:<br />
— Stock options ;;;;;;;;;;;;;;;;;; 310 918 1,241<br />
— Stock warrants ;;;;;;;;;;;;;;;;;; — — 100<br />
— Assumed conversion of convertible debt (OCEANE) ;; 10,769 — 5,118<br />
Total potential dilutive shares ;;;;;;;;;;;;; 11,079 918 6,459<br />
Weighed average number of shares outstanding — fully<br />
diluted ;;;;;;;;;;;;;;;;;;;;; 157,970 130,547 132,433<br />
Basic earnings per share<br />
— Earnings before cumulative effect of adoption of<br />
SFAS 142 ;;;;;;;;;;;;;;;;;;; 5.66 4.59 5.57<br />
— Cumulative effect of adoption of SFAS 142 ;;;;;; — (1.23) —<br />
— Net earnings;;;;;;;;;;;;;;;;;;; 5.66 3.36 5.57<br />
Diluted earnings per share<br />
— Earnings before cumulative effect of adoption of<br />
SFAS 142 ;;;;;;;;;;;;;;;;;;; 5.45 4.56 5.47<br />
— Cumulative effect of adoption of SFAS 142 ;;;;;; — (1.22) —<br />
— Net earnings;;;;;;;;;;;;;;;;;;; 5.45 3.34 5.47<br />
For purposes of computing diluted earnings per share, 5,313, 1,638 and 1,200 thousands stock options<br />
were excluded from the calculation, for 2003, 2002 and 2001 respectively, as the effect of including such<br />
options would have been antidilutive. In 2002, convertible debt with a carrying value of 1,342 million euros<br />
was also excluded as inclusion would have been antidilutive.<br />
F-86
LAFARGE<br />
NOTES TO THE CONSOLIDATED FINANCIAL STATEMENTS — (Continued)<br />
(d) Reconciliation of shareholders’ equity<br />
2003<br />
At December 31,<br />
2002<br />
(in million euros)<br />
2001<br />
Shareholders’ equity as reported in the consolidated balance sheets ;; 8,185 6,981 7,882<br />
1 — Business combinations ;;;;;;;;;;;;;;;;;; 162 118 77<br />
2 — Deferred income taxes ;;;;;;;;;;;;;;;;;; (15) 15 26<br />
3 — Pension obligations ;;;;;;;;;;;;;;;;;;; (767) (536) (34)<br />
4 — Restructuring provisions ;;;;;;;;;;;;;;;;; 7 33 49<br />
5 — Other provisions ;;;;;;;;;;;;;;;;;;;;; (31) (15) 41<br />
6 — Employee stock purchase loans;;;;;;;;;;;;;;; (7) (21) —<br />
7 — Investments in marketable securities;;;;;;;;;;;;; (44) (105) (53)<br />
8 — Equity method investments ;;;;;;;;;;;;;;;; (20) (26) (26)<br />
9 — Start up costs ;;;;;;;;;;;;;;;;;;;;;; (3) (5) (14)<br />
10 — Disposal of the Specialty Products division ;;;;;;;;;; — — —<br />
11 — Derivative instruments ;;;;;;;;;;;;;;;;;; (78) (154) (146)<br />
12 — Investment subsidies ;;;;;;;;;;;;;;;;;;; (28) (27) (28)<br />
13 — Other items;;;;;;;;;;;;;;;;;;;;;;; (78) (4) (31)<br />
Total US GAAP adjustments before income tax, minority interests and<br />
cumulative effect of change in accounting principles ;;;;;;; (902) (727) (139)<br />
Tax effects of the above US GAAP adjustments ;;;;;;;;;;; 308 236 42<br />
Minority interests (Note 31-15) ;;;;;;;;;;;;;;;;;; 69 64 26<br />
Shareholders’ equity according to US GAAP before cumulative effect of<br />
change in accounting principles ;;;;;;;;;;;;;;;; 7,660 6,554 7,811<br />
Goodwill impairment on adoption of SFAS 142 (Note 31-18 (a)) ;;;; (160) (160) —<br />
Shareholders’ equity according to US GAAP;;;;;;;;;;;; 7,500 6,394 7,811<br />
The information below discloses the items affecting shareholders’ equity under US GAAP.<br />
2003 2002 2001<br />
(in million euros)<br />
Balance at January 1, ;;;;;;;;;;;;;;;;;;;;; 6,394 7,811 6,309<br />
Net income ;;;;;;;;;;;;;;;;;;;;;;;;; 831 436 702<br />
Dividends paid;;;;;;;;;;;;;;;;;;;;;;;; (303) (297) (273)<br />
Issuance of common stock (dividend reinvestment plan) ;;;;;;; 121 132 108<br />
Issuance of common stock ;;;;;;;;;;;;;;;;;;; 1,262 — —<br />
Issuance of rights (conversion to common stock) ;;;;;;;;;; — — 1,113<br />
Issuance of common stock (Cementia exchange offer);;;;;;;; — 50 —<br />
Exercise of stock options ;;;;;;;;;;;;;;;;;;; 6 8 17<br />
Employee stock purchase plan ;;;;;;;;;;;;;;;;; — 45 —<br />
Exercise of stock subscription warrants ;;;;;;;;;;;;;; — — 150<br />
Purchase (sale) of treasury shares ;;;;;;;;;;;;;;;; 9 (4) —<br />
Deferred stock based compensation ;;;;;;;;;;;;;;; 2 (35) 50<br />
Employee stock purchase loans ;;;;;;;;;;;;;;;;; 13 (21) —<br />
Changes in other comprehensive income ;;;;;;;;;;;;; (83) (328) (345)<br />
Changes in translation adjustments ;;;;;;;;;;;;;;; (752) (1,403) (20)<br />
Balance at December 31, ;;;;;;;;;;;;;;;;;;;; 7,500 6,394 7,811<br />
F-87
LAFARGE<br />
NOTES TO THE CONSOLIDATED FINANCIAL STATEMENTS — (Continued)<br />
(e) Comprehensive income for the years ended December 31, 2003, 2002 and 2001 under US GAAP<br />
Comprehensive income is a concept that is not addressed by French GAAP. Under US GAAP,<br />
comprehensive income is the term used to define all non-owner changes in shareholders’ equity.<br />
Comprehensive income includes, in addition to net income, net unrealized gains and losses arising during the<br />
period on available for sale securities, movements in cumulative translation adjustments and additional<br />
minimum pension liability.<br />
2003 2002 2001<br />
(in million euros)<br />
Net income ;;;;;;;;;;;;;;;;;;;;;;;;;;; 831 436 702<br />
Net unrealized gains and losses arising during the period on available for sale<br />
securities, net of tax benefit ;;;;;;;;;;;;;;;;;;; 82 (55) (246)<br />
Net unrealized loss on derivative instruments ;;;;;;;;;;;;; 31 2 (87)<br />
Additional minimum pension liability adjustment net of income taxes ;;; (196) (275) (13)<br />
Changes in cumulative translation adjustments;;;;;;;;;;;;; (752) (1,403) (20)<br />
Comprehensive (loss) income for the year ended December 31;;;;; (4) (1,295) 336<br />
F-88
LAFARGE<br />
NOTES TO THE CONSOLIDATED FINANCIAL STATEMENTS — (Continued)<br />
(f) Balance sheets according to US GAAP<br />
Certain reclassifications have been made to the prior periods to conform the 2003 presentation.<br />
2003<br />
At December 31,<br />
2002 2001<br />
Notes (in million euros)<br />
ASSETS<br />
Cash and cash equivalents;;;;;;;;;;;;; 1,357 959 1,017<br />
Accounts receivable-trade, net ;;;;;;;;;;; 1,626 1,644 2,062<br />
Other receivables ;;;;;;;;;;;;;;;; 899 974 1,087<br />
Inventories ;;;;;;;;;;;;;;;;;;; 1,315 1,459 1,610<br />
Deferred taxes ;;;;;;;;;;;;;;;;; 33-3 55 60 41<br />
Current assets ;;;;;;;;;;;;;;;;; 5,252 5,096 5,817<br />
Goodwill, net ;;;;;;;;;;;;;;;;;; 6,041 6,638 7,618<br />
Intangible assets, net ;;;;;;;;;;;;;;; 31-18 (a) 131 68 67<br />
Property, plant and equipment, net ;;;;;;;;; 9,414 10,384 11,951<br />
Investments in equity affiliates ;;;;;;;;;;; 1,822 1,979 1,732<br />
Other investments ;;;;;;;;;;;;;;;; 415 245 498<br />
Deferred taxes ;;;;;;;;;;;;;;;;; 33-3 971 1,307 1,180<br />
Other long-term assets ;;;;;;;;;;;;;; 252 681 826<br />
Long-term assets ;;;;;;;;;;;;;;;; 19,046 21,302 23,872<br />
Total assets ;;;;;;;;;;;;;;;;;; 24,298 26,398 29,689<br />
LIABILITIES AND SHAREHOLDERS’ EQUITY<br />
Accounts payable-trade ;;;;;;;;;;;;;; 1,087 1,083 1,329<br />
Other payables ;;;;;;;;;;;;;;;;; 1,615 1,864 2,267<br />
Current portion of long-term debt;;;;;;;;;; 958 467 1,314<br />
Short-term bank borrowings ;;;;;;;;;;;; 308 450 435<br />
Current liabilities ;;;;;;;;;;;;;;;; 3,968 3,864 5,345<br />
Deferred taxes ;;;;;;;;;;;;;;;;; 33-3 1,496 2,046 1,971<br />
Pension liability ;;;;;;;;;;;;;;;;; 33-1 1,013 988 816<br />
Provisions ;;;;;;;;;;;;;;;;;;; 33-4 983 1,005 727<br />
Long-term debt ;;;;;;;;;;;;;;;;; 7,275 10,165 10,818<br />
Long-term liabilities;;;;;;;;;;;;;;; 10,767 14,204 14,332<br />
Minority interests;;;;;;;;;;;;;;;; 2,063 1,936 2,201<br />
Common stock (par value: 3.81 euros; authorized:<br />
12,441,935);;;;;;;;;;;;;;;;;; 669 532 521<br />
Outstanding 2003: 167,217,813 , 2002: 132,880,433;<br />
2001: 130,145,800<br />
Additional paid-in capital ;;;;;;;;;;;;; 6,121 4,805 4,678<br />
Retained earnings ;;;;;;;;;;;;;;;; 3,659 3,193 2,989<br />
Cumulative translation adjustments ;;;;;;;;; (2,250) (1,497) (91)<br />
Accumulated other comprehensive income (loss) ;;; (584) (501) (173)<br />
Employee loans receivables ;;;;;;;;;;;; (7) (21) —<br />
Treasury shares (2003: 1,856,266, 2002: 1,920,959;<br />
2001: 1,864,372) ;;;;;;;;;;;;;;; (108) (117) (113)<br />
Total shareholders’ equity ;;;;;;;;;;;; 7,500 6,394 7,811<br />
Total liabilities and shareholders’ equity ;;;;;; 24,298 26,398 29,689<br />
F-89
LAFARGE<br />
NOTES TO THE CONSOLIDATED FINANCIAL STATEMENTS — (Continued)<br />
(g) Consolidated statements of cash flows according to US GAAP<br />
For purposes of presenting consolidated statements of cash flows for the years ended December 31,<br />
2003, 2002 and 2001 in a format consistent with US GAAP, the Company has reflected the financial<br />
statement impact of the reconciling items between French GAAP and US GAAP presented in the above<br />
mentioned notes.<br />
Years ended December 31,<br />
2003 2002<br />
(in million euros)<br />
2001<br />
NET CASH PROVIDED BY OPERATING ACTIVITIES<br />
Net income ;;;;;;;;;;;;;;;;;;;;;;;;;;;;;;<br />
Adjustments to reconcile net income to net cash provided by operating activities:<br />
831 436 702<br />
Minority interests ;;;;;;;;;;;;;;;;;;;;;;;;;;; 231 240 204<br />
Depreciation and amortization of goodwill ;;;;;;;;;;;;;;;;; 814 851 945<br />
Cumulative effect of adoption of SFAS 142 (Note 31.18 (a)) ;;;;;;;;; — 160 —<br />
Share of net income of equity affiliates ;;;;;;;;;;;;;;;;;; (134) (122) (94)<br />
Gains on disposals, net ;;;;;;;;;;;;;;;;;;;;;;;;; (294) (212) (369)<br />
Deferred income taxes and tax provisions ;;;;;;;;;;;;;;;;; (10) 70 (67)<br />
Stock based compensation;;;;;;;;;;;;;;;;;;;;;;;; 2 (35) 50<br />
Other, net ;;;;;;;;;;;;;;;;;;;;;;;;;;;;;; 97 359 67<br />
Extraordinary loss on extinguishment of debt ;;;;;;;;;;;;;;;;<br />
Changes in operating assets and liabilities, net of effects from acquisitions of<br />
businesses<br />
— — —<br />
Decrease (increase) in inventories;;;;;;;;;;;;;;;;;;;; 35 (39) 35<br />
Decrease (increase) in accounts receivable-trade ;;;;;;;;;;;;;; (80) 460 32<br />
Decrease (increase) in other receivables ;;;;;;;;;;;;;;;;; (58) (51) 11<br />
Increase (decrease) in accounts payable-trade ;;;;;;;;;;;;;;; 58 (517) (30)<br />
Increase (decrease) in other payables ;;;;;;;;;;;;;;;;;; 271 (45) 116<br />
Net cash provided by operating activities;;;;;;;;;;;;;;;;;<br />
NET CASH USED IN INVESTING ACTIVITIES<br />
1,763 1,555 1,602<br />
Capital expenditures ;;;;;;;;;;;;;;;;;;;;;;;;;; (764) (1,010) (1,332)<br />
Acquisitions of subsidiaries ;;;;;;;;;;;;;;;;;;;;;;; (318) (263) (4,599)<br />
Investments in equity affiliates ;;;;;;;;;;;;;;;;;;;;;; 6 (32) (17)<br />
Dividends received from equity affiliates ;;;;;;;;;;;;;;;;;; 70 57 81<br />
Proceeds from sale of property plant and equipment ;;;;;;;;;;;;; 175 514 336<br />
Proceeds from sale of companies ;;;;;;;;;;;;;;;;;;;;; 370 247 1,759<br />
Net increase (decrease) in other long-term assets ;;;;;;;;;;;;;; (50) (3) (155)<br />
Net cash used in investing activities ;;;;;;;;;;;;;;;;;;;<br />
NET CASH PROVIDED BY FINANCING ACTIVITIES<br />
(511) (490) (3,927)<br />
Proceeds from issuance of common stock ;;;;;;;;;;;;;;;;; 1,389 185 1,388<br />
Proceeds from issuance of common stock — minority interests subscription ;;; 34 48 131<br />
Issuance of warrants ;;;;;;;;;;;;;;;;;;;;;;;;;; — — —<br />
Purchase of treasury shares ;;;;;;;;;;;;;;;;;;;;;;; 9 (4) —<br />
Dividends paid ;;;;;;;;;;;;;;;;;;;;;;;;;;;; (303) (297) (273)<br />
Dividends paid by subsidiaries to minority interests ;;;;;;;;;;;;; (78) (69) (43)<br />
Proceeds from issuance of long-term debt ;;;;;;;;;;;;;;;;; 133 582 5,485<br />
Repayment of long-term debt ;;;;;;;;;;;;;;;;;;;;;; (1,943) (734) (4,598)<br />
Increase (decrease) in short-term debt ;;;;;;;;;;;;;;;;;;; (16) (664) 282<br />
Net cash provided (used in) by financing activities ;;;;;;;;;;;;; (775) (953) 2,372<br />
Net effect of foreign currency translation on cash and cash equivalents ;;;;; (79) (170) (6)<br />
(Decrease) Increase in cash and cash equivalents ;;;;;;;;;;;;; 398 (58) 41<br />
Cash and cash equivalents at beginning of year ;;;;;;;;;;;;;;; 959 1,017 976<br />
Cash and cash equivalents at end of year ;;;;;;;;;;;;;;;; 1,357 959 1,017<br />
SUPPLEMENTAL DISCLOSURES<br />
Cash payments during the period for<br />
Interest ;;;;;;;;;;;;;;;;;;;;;;;;;;;;;;; 458 574 493<br />
Income taxes ;;;;;;;;;;;;;;;;;;;;;;;;;;;;; 354 409 180<br />
Non-cash transactions:<br />
Issuance of shares in connection with the acquisition of Cementia ;;;;;;; — 50 —<br />
F-90
LAFARGE<br />
NOTES TO THE CONSOLIDATED FINANCIAL STATEMENTS — (Continued)<br />
Note 33 — Additional US GAAP Disclosure Information<br />
1. Pensions and employee benefits<br />
The liability with respect to defined benefit pension plans is in substantially all instances the defined<br />
benefit obligation calculated annually by independent actuaries using the projected unit credit method and<br />
applying, when relevant, all provisions of Statement of Financial Accounting Standards 87, Employers’<br />
Accounting for Pensions (‘‘SFAS 87’’), Statement of Financial Accounting Standards 88, Employers<br />
Accounting for Settlements and Curtailments of Defined Pension Plans and for Termination Benefits (‘‘SFAS<br />
88’’), Statement of Financial Accounting Standards 106, Employers Accounting for Post-retirement Benefits<br />
Other than Pensions (‘‘SFAS 106’’) and Employers Accounting for Post-employment Benefits (‘‘SFAS 112’’),<br />
Statement of Financial Accounting Standard 112.<br />
As of December 31, 2003, 2002 and 2001, the Company recorded a minimum pension liability of<br />
772 million euros, 538 million euros and 35 million euros respectively related to the accumulated benefit<br />
obligation in excess of the fair value of the plan assets, and an intangible asset of 22 million euros, 17 million<br />
euros and 7 million euros respectively reflecting the portion of minimum pension liability generated from<br />
unamortized prior service costs and transition obligation. The remaining 750 million euros, 521 million euros<br />
and 27 million euros million euros was recorded as ‘‘Accumulated other comprehensive loss’’ in the<br />
Consolidated Balance Sheets and in the Consolidated Statements of Shareholders’ Equity as of December 31,<br />
2003, 2002 and 2001, net of tax and minority interests of 437 million euros, 275 million euros and 14 million<br />
euros.<br />
The Company has recorded additional minimum liability adjustments as reductions (increases) in other<br />
comprehensive income of 196 million euros, 275 million euros and 13 million euros, net of tax and minority<br />
interests, for the years ended December 31, 2003, 2002 and 2001 respectively. Accounting for pension costs<br />
under French GAAP does not require the recording of a minimum liability adjustment.<br />
The projected benefit obligation, accumulated benefit obligation and fair value of plan assets for the<br />
pension plans with accumulated benefit obligations in excess of plan assets were 3,824 million euros,<br />
3,448 million euros, and 2,773 million euros respectively, at December 31, 2003; 2,853 million euros,<br />
2,619 million euros, and 2,046 million euros respectively, at December 31, 2002; and 903 million euros,<br />
807 million euros, and 373 million euros respectively, at December 31, 2001.<br />
F-91
LAFARGE<br />
NOTES TO THE CONSOLIDATED FINANCIAL STATEMENTS — (Continued)<br />
The difference between the net amount accrued for under US GAAP and the net amount accrued for<br />
under French GAAP can be summarized as follows:<br />
Pension benefits Other benefits Total<br />
2003 2002 2001 2003 2002 2001 2003 2002 2001<br />
(in million euros)<br />
Net amount recognized under US GAAP 57.1 140.2 131.4 (217.9) (243.3) (266.9) (160.8) (103.1) (135.5)<br />
Minimum liability adjustment (MLA) ;;; (772.2) (538.4) (34.5) — — — (772.2) (538.4) (34.5)<br />
Net amount accrued for under US GAAP (715.1) (398.2) 96.9 (217.9) (243.3) (266.9) (933.0) (641.5) (170.0)<br />
Accrued benefit liability (including MLA) (795.3) (745.0) (548.8) (217.9) (243.3) (266.9) (1,013.2) (988.3) (815.7)<br />
Prepaid benefit cost (including MLA) ;; 80.2 346.8 645.7 — — — 80.2 346.8 645.7<br />
US GAAP adjustments, see Note 32(d)(3)* 768.5 536.1 34.1 (1.3) (0.6) — 767.2 535.5 34.1<br />
Change in scope of consolidation ;;;; (12.5) (13.6) (15.1) (2.8) — — (15.3) (13.6) (15.1)<br />
Reclassifications** ;;;;;;;;;; 2.6 14.5 25.7 — — — 2.6 14.5 25.7<br />
Net amount accrued in consolidated<br />
financial statements under French<br />
GAAP ;;;;;;;;;;;;;; 43.5 138.8 141.6 (222.0) (243.9) (266.9) (178.5) (105.1) (125.3)<br />
Accrued;;;;;;;;;;;;;;; (517.1) (478.1) (511.4) (222.0) (243.9) (266.9) (739.1) (722.0) (778.3)<br />
Prepaid ;;;;;;;;;;;;;;; 560.6 616.9 653.0 — — — 560.6 616.9 653.0<br />
* Adjustments include impacts of transition obligation, prior service cost, actuarial gains recognized with a<br />
different timing under local regulations and minimum liability adjustment.<br />
** Reclassifications include amounts recorded for French GAAP within other payables<br />
Specific comments for North-American employee benefits other than pension plans<br />
The company provides certain retiree health and life insurance benefits to eligible employees who retire<br />
in the U.S. or Canada. Salaried participants generally become eligible for retiree health care benefits when<br />
they retire from active service at age 55 or later, although there are some variances by plan or unit in the<br />
U.S. and Canada. Benefits, eligibility and cost-sharing provisions for hourly employees vary by location and/<br />
or bargaining unit. Generally, the health care plans pay a stated percentage of most medical and dental<br />
expenses reduced for any deductible, copayment and payments made by government programs and other<br />
group coverage. These plans are unfunded. An eligible retiree’s health care benefit coverage is coordinated in<br />
Canada with provincial health and insurance plans and in the U.S., after attaining age 65, with Medicare.<br />
Certain retired employees of businesses acquired by the company are covered under other health care plans<br />
that differ from current plans in coverage, deductibles and retiree contributions.<br />
In the U.S., salaried retirees and dependents under age 65 have a 2.0 million US dollars (approximately<br />
1.9 million euros) health care lifetime maximum benefit. At age 65 or over, the maximum is 50,000 US<br />
dollars (approximately 47,700 euros). Lifetime maximums for hourly retirees are governed by the location<br />
and/or bargaining agreement in effect at the time of retirement. In Canada, some units have maximums, but<br />
in most cases there are no lifetime maximums. In some units in Canada, spouses of retirees have lifetime<br />
medical coverage.<br />
In Canada, both salaried and nonsalaried employees are generally eligible for postretirement life<br />
insurance benefits. In the U.S., postretirement life insurance is provided for a number of hourly employees as<br />
stipulated in their hourly bargaining agreements, but it is not provided for salaried employees, except those of<br />
certain acquired companies.<br />
The assumed health care cost trend rate used in measuring the accumulated postretirement benefit<br />
obligation differs between U.S. and Canadian plans. In 2003, the pre-65 and post-65 assumed rate was<br />
12.0 percent in the U.S. plan, decreasing to 5.5 percent over ten years, and 9.3 percent in the Canadian plan,<br />
decreasing to 4.7 percent over seven years. In 2002, the pre-65 and post-65 assumed rate was 13.0 percent in<br />
F-92
the U.S. plan, decreasing to 5.5 percent over ten years, and 9.8 percent in the Canadian plan, decreasing to<br />
4.7 percent over seven years. The assumed rate for Medicare health cost trends was the same as for the<br />
company’s U.S. plan.<br />
Assumed health care cost trend rates have a significant effect on the amounts reported for the health care<br />
plans. A one-percentage-point increase or decrease in assumed health care cost trend rates would have the<br />
following effects:<br />
One-percentage-point<br />
Increase Decrease<br />
(in million US dollars)<br />
Increase (decrease) in postretirement benefit obligation at December 31, 2003 ;; 30.3 (25.6)<br />
Increase (decrease) in the total of service and interest cost components for 2003 ; 2.7 (2.3)<br />
2. Accounting for stock-based compensation<br />
<strong>Lafarge</strong> S.A. maintains a variable stock option plan and an employee stock purchase plan. The stock<br />
option plan grants options to purchase or subscribe shares of the Company’s common stock to executives,<br />
senior management, and other employees who have contributed significantly to the performance of the<br />
Company. The option exercise price approximates market value on the grant date. The options expire ten<br />
years from the grant date. The vesting period of the options range from immediate, to five years. The<br />
Company accounts for employee stock options using the intrinsic value method prescribed by APB 25.<br />
Information relating to the <strong>Lafarge</strong> S.A. stock options granted during 2003, 2002 and 2001 is<br />
summarized as follows:<br />
Shares<br />
LAFARGE<br />
NOTES TO THE CONSOLIDATED FINANCIAL STATEMENTS — (Continued)<br />
2003 2002 2001<br />
Average<br />
option price Shares<br />
Average<br />
option price Shares<br />
Average<br />
option price<br />
(in euros) (in euros) (in euros)<br />
At January 1;;;;;;;; 5,379,723 81.22 4,653,256 77.34 3,758,414 66.53<br />
Options granted ;;;;;;; 1,616,572* 68.15 909,763 93.11 1,270,427 100.17<br />
Options exercised ;;;;;; (127,443) 47.51 (181,359) 42.66 (372,923) 46.44<br />
Options cancelled ;;;;;; (2,775) 47.97 (1,937) 32.43 (2,662) 33.70<br />
At December 31 ;;;;;; 6,866,077 74.29 5,379,723 81.22 4,653,256 77.34<br />
Options exercisable at<br />
December 31 ;;;;;;; 1,797,255 50.93 1,585,453 50.22 960,878 46.49<br />
Weighted average fair value of<br />
options granted during the<br />
year ;;;;;;;;;; 28.07 31.38 41.27<br />
* including readjustments due to financial transactions in 2003<br />
F-93
Information relating to the <strong>Lafarge</strong> S.A. stock options outstanding at December 31, 2003 is summarized<br />
as follows:<br />
4 Exercise price<br />
(in euros)<br />
Number of options<br />
outstanding<br />
LAFARGE<br />
NOTES TO THE CONSOLIDATED FINANCIAL STATEMENTS — (Continued)<br />
Weighted average<br />
remaining life in months<br />
Number of options<br />
exercisable<br />
48.62 127,880 9 127,880<br />
44.20 17,170 10 17,170<br />
43.10 368,301 24 368,301<br />
43.10 176,751 24 176,751<br />
42.57 57,543 37 57,543<br />
50.19 368,869 49 368,869<br />
50.19 436,138 49 436,138<br />
74.72 134,484 54 134,484<br />
74.18 110,119 61 110,119<br />
82.70 1,046,514 73 —<br />
79.74 499,285 85 —<br />
102.12 12,754 89 —<br />
96.16 1,264,338 95 —<br />
101.79 472,985 101 —<br />
74.48 499,021 107 —<br />
65.95 1,273,925 119 —<br />
6,866,077 1,797,255<br />
In addition to the <strong>Lafarge</strong> S.A. plan described above, the following information describes the stock-based<br />
compensation plans of <strong>Lafarge</strong> North America Inc., a 53%-owned subsidiary of <strong>Lafarge</strong> S.A. The stock-based<br />
compensation plans of <strong>Lafarge</strong> North America Inc. are denominated in its own stock.<br />
<strong>Lafarge</strong> North America Inc. and its subsidiaries stock option and purchase plans<br />
<strong>Lafarge</strong> North America Inc. stock option plan and employee stock purchase plan are originally<br />
denominated in US dollars and this information has been translated to euros for the convenience of the reader<br />
using exchange rates of 0.7918, 0.9536 and 1.1347 applicable at December 31 2003, 2002 and 2001<br />
respectively.<br />
<strong>Lafarge</strong> North America Inc. maintains a fixed stock option plan and an employee stock purchase plan.<br />
Under the fixed stock option plan, directors and key employees of <strong>Lafarge</strong> North America Inc, may be<br />
granted stock options that entitle the holder to receive shares of <strong>Lafarge</strong> North America Inc.’s common stock<br />
based on the market price of the securities at the date of grant. Director’s options are exercisable based on<br />
the length of a director’s service on the Board of Directors and become fully exercisable when a director has<br />
served on the Board for over four years. Employee options vest ratably over a four-year period. The options<br />
expire ten years after the date of grant. There were approximately 5.1 million, 4.3 million and 4.0 million<br />
outstanding options at December 31, 2003, 2002 and 2001, respectively.<br />
The employee stock purchase plan allows substantially all employees to purchase common stock of<br />
<strong>Lafarge</strong> North America Inc., through payroll deductions, at 90 percent of the lower of the beginning or end of<br />
the plan year market prices. During 2003, 139,380 shares were issued at a price of 22.36 euros, in 2002,<br />
95,299 shares were issued at a share price of 28.09 euros and in 2001, 103,464 shares were issued at a price<br />
of 26.04 euros. At December 31, 2003, 2002 and 2001, 1.7 million euros, 1.9 million euros and 1.6 million<br />
euros, respectively, were allocated for future share purchases.<br />
The Company accounts for the <strong>Lafarge</strong> North America Inc.’s stock option plans under APB 25. No<br />
compensation expense was recognized for these plans.<br />
F-94
Information relating to <strong>Lafarge</strong> North America Inc.’s stock options granted during 2003, 2002 and 2001<br />
is summarized as follows:<br />
Shares<br />
LAFARGE<br />
NOTES TO THE CONSOLIDATED FINANCIAL STATEMENTS — (Continued)<br />
2003 2002 2001<br />
Average<br />
option price Shares<br />
Average<br />
option price Shares<br />
Average<br />
option price<br />
(in euros) (in euros) (in euros)<br />
At January 1 ;;;;;;;; 4,260,293 31.08 3,978,950 33.05 3,835,175 30.74<br />
Options granted ;;;;;;; 1,279,750 23.61 1,167,500 39.20 1,088,750 34.15<br />
Options exercised ;;;;;; (256,426) 20.03 (762,720) 26.60 (801,850) 23.18<br />
Options cancelled ;;;;;; (146,313) 26.83 (123,437) 29.71 (143,125) 35.00<br />
At December 31 ;;;;;; 5,137,304 25.52 4,260,293 31.08 3,978,950 33.05<br />
Options exercisable at<br />
December 31 ;;;;;;; 2,391,104 23.60 1,775,593 28.55 1,716,933 32.25<br />
At December 31, 2003, the 5.1 million stock options outstanding under <strong>Lafarge</strong> North America Inc.’s<br />
stock option plans have an exercise price between 12.47 euros per share and 34.73 euros per share and a<br />
weighted average remaining contractual life of 6.94 years.<br />
The Company estimates the fair value of the options granted in 2003, 2002 and 2001 based on the<br />
following assumptions:<br />
<strong>Lafarge</strong> S.A. options <strong>Lafarge</strong> North America Inc. options<br />
Years ended December 31, Years ended December 31,<br />
2003 2002 2001 2003 2002 2001<br />
Expected dividend yield ;;;;;;;;;;; 2.7% 2.5% 2.0% 2.0% 1.5% 2.0%<br />
Expected volatility of stock;;;;;;;;;; 37.2% 36.2% 36.5% 34.0% 38.0% 43.0%<br />
Risk-free interest rate ;;;;;;;;;;;; 4.1% 4.0% 5.0% 3.6% 4.9% 4.9%<br />
Expected life of the options (in years) ;;;;; 8.0 8.0 8.0 5.1 5.4 5.4<br />
The Company assumes that the equivalent risk-free interest rate is the closing market rate, on the last<br />
trading day of the year, for treasury bills with maturity similar to the expected life of the options.<br />
The <strong>Lafarge</strong> S.A. stock incentive plan was introduced on November 29, 1989. The Company assumes<br />
the estimated life of the outstanding option agreements based upon the number of options historically<br />
exercised and cancelled since the plan inception.<br />
The Company uses the treasury shares method for purposes of determining the number of shares to be<br />
issued in conjunction with the Company’s stock incentive plan. Based upon the number and amounts of<br />
vested and unvested options outstanding, the dilutive effect on the Company’s outstanding shares for the<br />
years ended December 31, 2003, 2002 and 2001 was 310, 918 and 1,241 thousands shares respectively.<br />
F-95
LAFARGE<br />
NOTES TO THE CONSOLIDATED FINANCIAL STATEMENTS — (Continued)<br />
3. Income taxes (SFAS 109)<br />
(a) Deferred tax assets and liabilities<br />
The net deferred tax liabilities under US GAAP are as follows:<br />
2003<br />
At December 31,<br />
2002<br />
(in million euros)<br />
2001<br />
Net capital loss carry forwards ;;;;;;;;;;;;;;;;; 569 245 257<br />
Net operating loss and tax credit carry forwards ;;;;;;;;;; 939 815 625<br />
Net world-wide consolidation foreign tax credit carry forwards ;;;; — 75 108<br />
Pensions and other post-retirement benefits ;;;;;;;;;;;; 288 333 218<br />
Property, plant and equipment ;;;;;;;;;;;;;;;;;; 177 374 420<br />
Provisions and other current liabilities other ;;;;;;;;;;;; 215 259 227<br />
Restructuring provisions ;;;;;;;;;;;;;;;;;;;; 20 56 17<br />
Deferred tax assets ;;;;;;;;;;;;;;;;;;;;;; 2,208 2,157 1,872<br />
Valuation allowance ;;;;;;;;;;;;;;;;;;;;;; (1,182) (790) (651)<br />
Net deferred tax assets ;;;;;;;;;;;;;;;;;;;; 1,026 1,367 1,221<br />
Property, plant and equipment ;;;;;;;;;;;;;;;;;; (1,354) (1,611) (1,648)<br />
Prepaid pension assets ;;;;;;;;;;;;;;;;;;;;; (17) (117) (199)<br />
Other ;;;;;;;;;;;;;;;;;;;;;;;;;;;; (130) (324) (146)<br />
Deferred tax liabilities ;;;;;;;;;;;;;;;;;;;; (1,501) (2,052) (1,993)<br />
Net deferred tax liabilities ;;;;;;;;;;;;;;;;;;; (475) (685) (772)<br />
Deferred income taxes under US GAAP are summarized as follows:<br />
At December 31,<br />
2003 2002 2001<br />
(in million euros)<br />
Current deferred tax assets ;;;;;;;;;;;;;;;;;;; 55 60 41<br />
Long-term deferred tax assets ;;;;;;;;;;;;;;;;;; 971 1,307 1,180<br />
Current deferred tax liabilities ;;;;;;;;;;;;;;;;;; (5) (6) (22)<br />
Long-term deferred tax liabilities ;;;;;;;;;;;;;;;; (1,496) (2,046) (1,971)<br />
Net deferred tax liabilities ;;;;;;;;;;;;;;;;;;; (475) (685) (772)<br />
(b) Taxes not accrued on undistributed earnings<br />
The Company has not provided any deferred income taxes on the undistributed earnings of its foreign<br />
subsidiaries based upon its determination that such earnings will be indefinitely reinvested. At December 31,<br />
2003, the cumulative undistributed earnings of these subsidiaries were approximately 11,419 million euros.<br />
Company management has decided that the determination of the amount of any unrecognized deferred tax<br />
liability for the cumulative undistributed earnings of the foreign subsidiaries is not practical since it would<br />
depend on a number of factors that cannot be known until such time as a decision to repatriate the earnings<br />
might be made. In addition, no provision for income taxes has been made for approximately 588 million<br />
euros of unremitted earnings of the Company’s French subsidiaries in that:<br />
— the remittance of such earnings would be tax exempt for 95% or more owned subsidiaries,<br />
— the income tax which would be paid upon distribution of the undistributed earnings of 95% or less<br />
owned subsidiaries and equity investees could be offset by foreign tax credits in the world-wide<br />
consolidated tax return as described in Note 9 and reimbursed to the Company.<br />
F-96
4. Provisions<br />
(a) Changes in the balance of provisions<br />
Restructuring<br />
provisions<br />
LAFARGE<br />
NOTES TO THE CONSOLIDATED FINANCIAL STATEMENTS — (Continued)<br />
Site restoration<br />
and<br />
environmental<br />
provisions Other provisions Total provisions<br />
(in million euros)<br />
Balance at January 1, 2001 ;; 35 146 206 387<br />
Current year addition, net ;;; 107 38 149 294<br />
Current year release ;;;;;; (157) (40) (212) (409)<br />
Other changes ;;;;;;;; 173 28 253 454<br />
Translation adjustments ;;;; — 2 (1) 1<br />
Balance at December 31, 2001 ; 158 174 395 727<br />
Current year addition, net ;;; 156 52 393 601<br />
Current year release ;;;;;; (231) (43) (106) (380)<br />
Other changes ;;;;;;;; 22 34 60 116<br />
Translation adjustments ;;;; (10) (16) (33) (59)<br />
Balance at December 31, 2002 ; 95 201 709 1,005<br />
Current year addition, net ;;; 66 35 188 209<br />
Current year release ;;;;;; (102) (38) (200) (340)<br />
Changes in scope and other<br />
changes ;;;;;;;;;; (4) 22 61 79<br />
Translation adjustments ;;;; (5) (14) (31) (50)<br />
Balance at December 31, 2003 ; 50 206 727 983<br />
5. Summarized Combined Balance Sheet and Income Statement Information of Equity Affiliates<br />
The following tables present balance sheet and income statement information, on a combined basis, for<br />
those entities that are accounted for using the equity method under US GAAP. The combined information for<br />
those entities that are proportionately consolidated under French GAAP is separately presented.<br />
(a) Combined balance sheet information<br />
Equity affiliates Proportionately consolidated<br />
At December 31, At December 31,<br />
2003 2002 2001 2003 2002 2001<br />
(in million euros) (in million euros)<br />
Current assets ;;;;;;;;;;; 1,085 1,721 2,018 1,269 1,109 905<br />
Long-term assets ;;;;;;;;;; 1,655 4,154 3,159 3,047 3,180 2,149<br />
Total assets ;;;;;;;;;;;; 2,740 5,875 5,177 4,316 4,289 3,054<br />
Current liabilities ;;;;;;;;;; 833 1,277 1,271 560 597 499<br />
Long-term liabilities ;;;;;;;;; 563 2.117 1,668 871 963 739<br />
Total equity ;;;;;;;;;;;; 1,344 2,481 2,238 2,885 2,729 1,816<br />
Total shareholders’ equity and liabilities 2,740 5,875 5,177 4,316 4,289 3,054<br />
F-97
(b) Combined income statement information<br />
LAFARGE<br />
NOTES TO THE CONSOLIDATED FINANCIAL STATEMENTS — (Continued)<br />
Equity affiliates Proportionately consolidated<br />
Years ended December 31, Years ended December 31,<br />
2003 2002 2001 2003 2002 2001<br />
(in million euros) (in million euros)<br />
Sales ;;;;;;;;;;;;;;; 3,057 3,804 3,566 2,379 2,177 1,878<br />
Operating income ;;;;;;;;;; 511 446 413 359 346 219<br />
Net income ;;;;;;;;;;;; 222 116 134 217 245 131<br />
6. FIN 45 disclosure about the Company’s obligations under guarantees<br />
As part of the operations of the roofing division, the Company generally promises the end-user — often<br />
for 30 years — the delivery of replacement material free of charge, where products lack defined basic<br />
features. The installers typically are promised replacement material and reimbursement of labor costs<br />
associated with the replacement of defective material. The promise typically expires with the installer’s duty<br />
to repair free of charge. The Company’s policy is to accrue the undiscounted estimated cost of warranty<br />
coverage at the time the sale is recorded. The foreseeable expense calculation is based on sales under<br />
warranty and the amount is estimated by weighting all possible outcomes by their associated probabilities<br />
determined based on past experience and future expectations. The provision for product warranty amounts to<br />
28 millions euros at December 31, 2003.<br />
7. Recently issued accounting pronouncements<br />
s FASB Interpretation No. 46 ‘‘Consolidation of Variable Interest Entities’’<br />
The Financial Accounting Standards Board (FASB) issued Interpretation No. 46 (‘‘FIN 46’’),<br />
‘‘Consolidation of Variable Interest Entities,’’ in January 2003 and amended the Interpretation in December<br />
2003. FIN 46 requires an investor with a majority of the variable interests (primary beneficiary) in a variable<br />
interest entity (VIE) to consolidate the entity and also requires majority and significant variable interest<br />
investors to provide certain disclosures. A VIE is an entity in which the voting equity investors do not have a<br />
controlling financial interest or the equity investment at risk is insufficient to finance the entity’s activities<br />
without receiving additional subordinated financial support from the other parties. The main provisions of FIN<br />
46 are effective in financial statements for periods ending after March 15, 2004. The company does not<br />
expect this Interpretation to have an effect on the Consolidated Financial Statements.<br />
s SFAS 132 ‘‘Employers’ Disclosures about Pensions and Other Postretirement Benefits, an<br />
amendment of FASB Statements No. 87, 88 and 106’’<br />
In December 2003, the FASB issued FASB Statement No. 132, ‘‘Employers’ Disclosures about Pensions<br />
and Other Postretirement Benefits, an amendment of FASB Statements No. 87, 88 and 106’’ (‘‘SFAS 132’’),<br />
which amended the previously issued SFAS 132 issued in February 1998. SFAS 132 revises employers’<br />
disclosures about pension plans and other postretirement benefit plans and requires enhanced disclosure<br />
regarding the assets, obligations, cash flows, and net periodic benefit cost of defined benefit pension plans and<br />
other defined benefit postretirement plans. The required information should be provided separately for pension<br />
plans and for other postretirement benefit plans. SFAS 132 does not change the measurement or recognition<br />
of those plans required by FASB Statements No. 87, 88, or 106. Adoption of SFAS 132 is required for the<br />
years ending December 31, 2003 and 2004 for the Company’s domestic and foreign plans, respectively.<br />
Adoption of the provisions did not and will not have an impact on the Company’s financial position or results<br />
of operations for the years ended December 31, 2003 and 2004, respectively.<br />
F-98
LAFARGE<br />
NOTES TO THE CONSOLIDATED FINANCIAL STATEMENTS — (Continued)<br />
Note 34 — Scope of Consolidation — Major Companies<br />
Aggreg.<br />
Consolidation method<br />
and Control Ownership French US<br />
Companies Countries Cement Concrete Roofing Gypsum Others % % GAAP GAAP<br />
Colpa;;;;;;;;;;;; Algeria q 100.00 57.15 Full Full<br />
Durlock S.A.(2) ;;;;;;; Argentina q 40.00 40.00 Proportionate Equity<br />
<strong>Lafarge</strong> Australia (Pty) Ltd ;;; Australia q 100.00 100.00 Full Full<br />
<strong>Lafarge</strong> Plasterboard (Pty) Ltd ; Australia q 100.00 100.00 Full Full<br />
<strong>Lafarge</strong> Perlmooser AG ;;;; Austria q q 100.00 100.00 Full Full<br />
Schiedel Kaminwerke GmbH ;; Austria q 100.00 100.00 Full Full<br />
Bramac Dachsysteme International<br />
GmbH(2) ;;;;;;;;; Austria q 50.00 50.00 Proportionate Equity<br />
Tondach Gleinstätten AG;;;; Austria q 25.00 25.00 Equity Equity<br />
<strong>Lafarge</strong> Surma Cement Limited(2) Bangladesh q 50.00 29.44 Proportionate Equity<br />
<strong>Lafarge</strong> Roof Product Belgium<br />
N.V. ;;;;;;;;;;; Belgium q 100.00 100.00 Full Full<br />
SCB <strong>Lafarge</strong>(2) ;;;;;;; Benin q 50.00 50.00 Proportionate Equity<br />
Schiedel Sistemi dimnjaka d.o.o.; Bosnia q 100.00 100.00 Full Full<br />
Bramac Krovnisistemi d.o.o(2) ; Bosnia q 50.00 50.00 Proportionate Equity<br />
Companhia Nacional de Cimento<br />
Portland ;;;;;;;;;; Brazil q 99.75 99.75 Full Full<br />
Cimento Maua ;;;;;;;; Brazil q 99.90 90.84 Full Full<br />
<strong>Lafarge</strong> Brasil S.A. ;;;;;; Brazil q q 99.15 90.12 Full Full<br />
Centralbeton Ltda ;;;;;;; Brazil q 99.99 90.11 Full Full<br />
Cimento Tupi S.A. ;;;;;; Brazil q 20.00 19.96 Equity Equity<br />
Gipsita SA Mineraçào, Industria E<br />
commercio(2) ;;;;;;; Brazil q 60.00 60.00 Proportionate Equity<br />
<strong>Lafarge</strong> Roofing Brasil Ltda ;; Brazil q 100.00 100.00 Full Full<br />
Bramac Prokrovni Sistemi<br />
EOOD(2) ;;;;;;;;; Bulgaria q 50.00 50.00 Proportionate Equity<br />
CPAC Monier (Cambodia) Co Ltd Cambodia q 25.00 25.00 Equity Equity<br />
Cimenteries du Cameroun ;;; Cameroon q 56.73 56.73 Full Full<br />
<strong>Lafarge</strong> Canada;;;;;;;; Canada q q q 53.13 53.13 Full Full<br />
Sociedad Industrial Romeral<br />
S.A.(2) ;;;;;;;;;; Chile q 40.00 40.00 Proportionate Equity<br />
Empresas Melon SA;;;;;; Chile q q Mortars 84.21 84.14 Full Full<br />
Beijing Chinefarge Cement<br />
Limited Liability Company ;; China q 65.00 58.62 Full Full<br />
Beijing Ycheng <strong>Lafarge</strong> Concrete China q 76.72 69.20 Full Full<br />
Dujiangyan ;;;;;;;;; China q 75.00 67.64 Full Full<br />
<strong>Lafarge</strong> Onoda Gypsum<br />
Shangaï(2) ;;;;;;;;; China q 50.00 31.29 Proportionate Equity<br />
<strong>Lafarge</strong> Roofing Systems (China)<br />
Ltd ;;;;;;;;;;;; China q 100.00 100.00 Full Full<br />
<strong>Lafarge</strong> Chongqing Cement<br />
Company ;;;;;;;;; China q 70.59 63.67 Full Full<br />
Bramac pokrovni sistemi d.o.o.(2) Croatia q 50.00 50.00 Proportionate Equity<br />
<strong>Lafarge</strong> Cement AS ;;;;;; Czech Rep. q q 96.37 96.36 Full Full<br />
Bramac spol s.r.o.(2) ;;;;; Czech Rep. q 50.00 50.00 Proportionate Equity<br />
<strong>Lafarge</strong> Tekkin A/S ;;;;;; Denmark q 100.00 100.00 Full Full<br />
Alexandria Portland Cement<br />
Company(2) ;;;;;;;; Egypt q 44.50 44.50 Proportionate Equity<br />
Beni Suef Cement Company(2) ; Egypt q 50.00 50.00 Proportionate Equity<br />
(2) These companies are proportionately consolidated under French GAAP, but accounted for under the<br />
equity method under US GAAP [see Note 31-17 (b)]<br />
F-99
LAFARGE<br />
NOTES TO THE CONSOLIDATED FINANCIAL STATEMENTS — (Continued)<br />
Aggreg.<br />
Consolidation method<br />
and Control Ownership French US<br />
Companies Countries Cement Concrete Roofing Gypsum Others % % GAAP GAAP<br />
<strong>Lafarge</strong> Tekkin OY ;;;;;; Finland q 100.00 100.00 Full Full<br />
Schiedel Savuhormistot OY;;; Finland q 100.00 100.00 Full Full<br />
<strong>Lafarge</strong> Ciments ;;;;;;; France q 100.00 100.00 Full Full<br />
Société des Ciments Antillais ;; France q q 69.44 69.44 Full Full<br />
<strong>Lafarge</strong> Bétons ;;;;;;;; France q 100.00 100.00 Full Full<br />
<strong>Lafarge</strong> Granulats ;;;;;;; France q 100.00 100.00 Full Full<br />
<strong>Lafarge</strong> Plâtres ;;;;;;;; France q 100.00 100.00 Full Full<br />
<strong>Lafarge</strong> Couverture SA ;;;; France q 100.00 100.00 Full Full<br />
Cie Réunionaise d’importation ; France q 100.00 82.88 Full Full<br />
Sobex;;;;;;;;;;;; France q 100.00 93.30 Full Full<br />
<strong>Lafarge</strong> Zement GmbH ;;;; Germany q q 100.00 100.00 Full Full<br />
Wössinger Zement GmbH ;;; Germany q 100.00 100.00 Full Full<br />
Karsdorfer Zement GmbH ;;; Germany q 100.00 100.00 Full Full<br />
<strong>Lafarge</strong> Beton GmbH ;;;;; Germany q 100.00 100.00 Full Full<br />
<strong>Lafarge</strong> Gips GmbH;;;;;; Germany q 100.00 100.00 Full Full<br />
<strong>Lafarge</strong> Roofing GmbH ;;;; Germany q 100.00 100.00 Full Full<br />
<strong>Lafarge</strong> Dachsysteme GmbH ;; Germany q 100.00 100.00 Full Full<br />
<strong>Lafarge</strong> Roofing Components<br />
GmbH & Co KG * ;;;;; Germany q 100.00 100.00 Full Full<br />
RuppKeramik GmbH ;;;;; Germany q 100.00 100.00 Full Full<br />
Schiedel GmbH & Co* ;;;; Germany q 100.00 100.00 Full Full<br />
btg Schornsteintechnik GmbH ;; Germany q 100.00 100.00 Full Full<br />
Kloeber GmbH & Co KG* ;;; Germany q 100.00 100.00 Full Full<br />
<strong>Lafarge</strong> Beton Industrial<br />
Commercial S.A. ;;;;;; Greece q 53.17 53.12 Full Full<br />
Heracles General Cement;;;; Greece q q 53.17 53.12 Full Full<br />
Industria Cementera Hondurena ; Honduras q 53.00 52.80 Full Full<br />
Leier BCM-KFT ;;;;;;; Hungary q 40.00 40.00 Equity Equity<br />
<strong>Lafarge</strong> India Ltd ;;;;;;; India q 70.78 70.78 Full Full<br />
P.T. Semen Andalas Indonesia ; Indonesia q 100.00 100.00 Full Full<br />
P.T. <strong>Lafarge</strong> Roofing Indonesia ; Indonesia q 100.00 100.00 Full Full<br />
P.T. Petrojaya Boral Plasterboard<br />
Indonesia(2) ;;;;;;;; Indonesia q 50.00 42.90 Proportionate Equity<br />
<strong>Lafarge</strong> Plasterboard Ireland Ltd ; Ireland q 100.00 100.00 Full Full<br />
Redland Tile & Brick Ltd ;;; Ireland q 100.00 100.00 Full Full<br />
Schiedel Chimey Systems Ireland<br />
Ltd ;;;;;;;;;;;; Ireland q 100.00 100.00 Full Full<br />
<strong>Lafarge</strong> Adriasebina ;;;;;; Italy q q 100.00 99.62 Full Full<br />
<strong>Lafarge</strong> Gessi SpA ;;;;;; Italy q 100.00 100.00 Full Full<br />
<strong>Lafarge</strong> Roofing Italia SpA ;;; Italy q 100.00 100.00 Full Full<br />
<strong>Lafarge</strong> Braas Roofing Japan Co<br />
Ltd ;;;;;;;;;;;; Japan q 85.20 75.10 Full Full<br />
ASO Cement;;;;;;;;; Japan q q 39.40 22.45 Equity Equity<br />
Jordan Cement<br />
Factories(1) ;;;;;;;; Jordan q 48.15 48.15 Full Equity<br />
Bamburi Cement Ltd ;;;;; Kenya q 73.31 58.64 Full Full<br />
<strong>Lafarge</strong> Buycksan Gypsum(2) ;; Korea q 50.00 49.70 Proportionate Equity<br />
<strong>Lafarge</strong> Halla Cement(2) ;;;; Korea q 39.90 39.90 Proportionate Equity<br />
<strong>Lafarge</strong> Roofing (Korea) Ltd ;; Korea q 100.00 75.00 Full Full<br />
(1) This company is consolidated under French GAAP, but accounted for under the equity method under US<br />
GAAP [see Note 31-17 (a)]<br />
(2) These companies are proportionately consolidated under French GAAP, but accounted for under the<br />
equity method under US GAAP [see Note 31-17 (b)]<br />
* The following subsidiaries having fulfilled the relevant legal exemption requirements have elected to be<br />
exempt from disclosing their annual financial statements.<br />
F-100
LAFARGE<br />
NOTES TO THE CONSOLIDATED FINANCIAL STATEMENTS — (Continued)<br />
Aggreg.<br />
Consolidation method<br />
and Control Ownership French US<br />
Companies Countries Cement Concrete Roofing Gypsum Others % % GAAP GAAP<br />
<strong>Lafarge</strong> Tekkin UAB ;;;;; Lithuania q 100.00 100.00 Full Full<br />
Nouvelle Cimenterie d’Amboanio<br />
SA (Sanca) ;;;;;;;; Madagascar q 100.00 65.97 Full Full<br />
Portland Malawi ;;;;;;; Malawi q 75.17 75.17 Full Full<br />
<strong>Lafarge</strong> Roofing Holdings Sdn<br />
Bhd ;;;;;;;;;;; Malaysia q 100.00 100.00 Full Full<br />
Associated Pan Malaysia Cement<br />
Sdn Bhd;;;;;;;;;; Malaysia q 100.00 60.73 Full Full<br />
Kedah Cement Sdn Bhd ;;;; Malaysia q 100.00 60.73 Full Full<br />
Supermix concrete Malaysia Sdn<br />
Bhd ;;;;;;;;;;; Malaysia q 61.74 37.49 Full Full<br />
Boral Plasterboard Malaysia(2) ; Malaysia q 50.00 30.03 Proportionate Equity<br />
California Clay Tile de Mexico<br />
S.A. de C.V. ;;;;;;;; Mexico q 50.00 50.00 Equity Equity<br />
<strong>Lafarge</strong> Cementos S.A. de C.V. ; Mexico q 100.00 90.12 Full Full<br />
<strong>Lafarge</strong> Maroc(2) ;;;;;;; Morocco q q 50.00 49.99 Proportionate Equity<br />
<strong>Lafarge</strong> Ciment Maroc(2) ;;; Morocco q 50.00 34.93 Proportionate Equity<br />
<strong>Lafarge</strong> Cementos(2) ;;;;; Morocco q 50.00 34.19 Proportionate Equity<br />
<strong>Lafarge</strong> Béton(2) ;;;;;;; Morocco q 50.00 34.58 Proportionate Equity<br />
Gyvlon BV ;;;;;;;;; Netherlands q 100.00 100.00 Full Full<br />
<strong>Lafarge</strong> Gips BV ;;;;;;; Netherlands q 100.00 100.00 Full Full<br />
<strong>Lafarge</strong> Roofing Benelux BV ;; Netherlands q 100.00 100.00 Full Full<br />
West African Portland Cement<br />
Company ;;;;;;;;; Nigeria q 50.01 49.96 Full Full<br />
Ashakacem Plc. ;;;;;;; Nigeria q 50.16 50.11 Full Full<br />
<strong>Lafarge</strong> Tekkin AS ;;;;;; Norway q 100.00 100.00 Full Full<br />
Schiedel Skorsteiner AS ;;;; Norway q 100.00 100.00 Full Full<br />
<strong>Lafarge</strong> Philippines ;;;;;; Philippines q 100.00 100.00 Full Full<br />
CPAC Monier Philippines Inc.(2) Philippines q 50.00 50.00 Proportionate Equity<br />
Boral Philippines(2) ;;;;;; Philippines q 50.00 42.90 Proportionate Equity<br />
<strong>Lafarge</strong> Polska Spolka Akcyja;; Poland q q 100.00 100.00 Full Full<br />
<strong>Lafarge</strong> Cement Polska ;;;; Poland q q 100.00 100.00 Full Full<br />
<strong>Lafarge</strong> Beton Polska ;;;;; Poland q 100.00 100.00 Full Full<br />
<strong>Lafarge</strong> Kruszywa sp z.o.o ;;; Poland q 100.00 100.00 Full Full<br />
Braas Polska Sp z.o.o. ;;;;; Poland q 100.00 100.00 Full Full<br />
Rupp Ceramika Polska Sp z.o.o. ; Poland q 100.00 100.00 Full Full<br />
<strong>Lafarge</strong> Gips Polska ;;;;;; Poland q 100.00 100.00 Full Full<br />
Dolina Nidy ;;;;;;;;; Poland q 100.00 95.90 Full Full<br />
Nida Gips ;;;;;;;;;; Poland q 100.00 97.54 Full Full<br />
Betecna Betao Pronto(2) ;;;; Portugal q 50.00 49.81 Proportionate Equity<br />
Britas do Alenquer(2) ;;;;; Portugal q 50.00 49.81 Proportionate Equity<br />
Thomas Eurobetao(2) ;;;;; Portugal q 50.00 49.81 Proportionate Equity<br />
<strong>Lafarge</strong> Romcim SA ;;;;; Romania q q Lime 98.56 77.81 Full Full<br />
<strong>Lafarge</strong> Arcom Gips;;;;;; Romania q 90.00 70.03 Full Full<br />
OAO Voskresenskcement;;;; Russia q 83.85 83.85 Full Full<br />
OOO Braas DSK 1 ;;;;;; Russia q 67.10 67.10 Full Full<br />
Ural Cement ;;;;;;;;; Russia q 75.00 75.00 Full Full<br />
Beocinska Fabrika Cementa;;; Serbia q 69.41 34.72 Full Full<br />
Schiedel dimnjacki sistemi d.o.o. Serbia q 100.00 100.00 Full Full<br />
(2) These companies are proportionately consolidated under French GAAP, but accounted for under the<br />
equity method under US GAAP [see Note 31-17 (b)]<br />
F-101
Aggreg.<br />
Consolidation method<br />
and Control Ownership French US<br />
Companies Countries Cement Concrete Roofing Gypsum Others % % GAAP GAAP<br />
Blue Circle Materials Singapore Singapore q 100.00 60.73 Full Full<br />
Supermix Singapore ;;;;; Singapore q 51.00 33.77 Full Full<br />
Boral Singapore(2) ;;;;; Singapore q 50.00 30.03 Proportionate Equity<br />
<strong>Lafarge</strong> South Africa Limited ; South Africa q q 100.00 100.00 Full Full<br />
<strong>Lafarge</strong> Roofing (Pty) Ltd;;; South Africa q 100.00 100.00 Full Full<br />
Macsteel Interior Systems;;; South Africa q 40.00 40.00 Equity Equity<br />
<strong>Lafarge</strong> Asland SA ;;;;; Spain q q 99.62 99.62 Full Full<br />
Readymix Asland(2) ;;;;; Spain q 50.00 49.81 Proportionate Equity<br />
Yesos Ibericos ;;;;;;; Spain q 40.69 40.69 Equity Equity<br />
Cementos Molins ;;;;;; Spain q 40.91 40.75 Equity Equity<br />
Redland Ibérica SA ;;;;; Spain q 47.00 47.00 Equity Equity<br />
Povazska Cementaren a.s ;;; Slovakia q 27.00 27.00 Equity Equity<br />
Chimneys Slovaque republic NC<br />
Bramac Dachsteinprodulktion<br />
Slovakia q 100.00 100.00 Full Full<br />
Baustoffindustrie d.o.o.(2);;; Slovenia q 50.00 50.00 Proportionate Equity<br />
Schiedel d.o.o. ;;;;;;; Slovenia q 100.00 100.00 Full Full<br />
<strong>Lafarge</strong> Cement D.D* ;;;; Slovenia q 55.89 55.89 Full Full<br />
Mahawelhi Marine Cement Co; Sri Lanka q 90.00 84.96 Full Full<br />
Orebrö Kartongbruck AB ;;; Sweden q 100.00 100.00 Full Full<br />
<strong>Lafarge</strong> Tekkin AB ;;;;; Sweden q 100.00 100.00 Full Full<br />
Cementia Trading Ltd AG ;; Switzerland q 100.00 100.00 Full Full<br />
Marine Cement Ltd ;;;;; Switzerland q 100.00 99.96 Full Full<br />
Braas Schweiz AG ;;;;; Switzerland q 100.00 100.00 Full Full<br />
Mbeya ;;;;;;;;;; Tanzania q 62.76 62.76 Full Full<br />
<strong>Lafarge</strong> Prestia Co Ltd(2) ;;; Thailand q 50.00 42.90 Proportionate Equity<br />
CPAC Roof Tiles Co. Ltd ;; Thailand q 24.90 24.90 Equity Equity<br />
Siam Gypsum Industry(2) ;;;<br />
<strong>Lafarge</strong> Roofing (Thailand) Co.<br />
Thailand q 50.00 30.46 Proportionate Equity<br />
Ltd ;;;;;;;;;;; Thailand q 100.00 100.00 Full Full<br />
<strong>Lafarge</strong> Siam Roofing Co. Ltd ; Thailand q 100.00 75.00 Full Full<br />
<strong>Lafarge</strong> Aslan Cimento AS ;;<br />
Agretas Agrega Insaat San. Ve<br />
Turkey q q 96.84 96.72 Full Full<br />
Tic. AS ;;;;;;;;; Turkey q q 100.00 99.85 Full Full<br />
Dalsan Alçy AS(2) ;;;;; Turkey q 50.00 50.00 Proportionate Equity<br />
Yloac Cement(2) ;;;;;; Turkey q 50.00 49.92 Proportionate Equity<br />
Yloac AS(2) ;;;;;;;; Turkey q q 50.00 49.92 Proportionate Equity<br />
<strong>Lafarge</strong> Ybitas(2) ;;;;;; Turkey q 50.00 49.92 Proportionate Equity<br />
<strong>Lafarge</strong> Entegre Harç Sanayi ve<br />
Mortars/<br />
Ticaret AS(2) ;;;;;;;<br />
<strong>Lafarge</strong> Cati Cözümleri Sanayi<br />
Turkey<br />
Lime 50.00 50.00 Proportionate Equity<br />
VE Ticaret A.S. ;;;;;; Turkey q 100.00 100.00 Full Full<br />
Hima Cement Ltd ;;;;;; Uganda q 100.00 71.01 Full Full<br />
Mykolaivcement ;;;;;; Ukraine q 98.10 98.10 Full Full<br />
<strong>Lafarge</strong> Gypsum Ukraine ;;; Ukraine q 100.00 100.00 Full Full<br />
Stromgips ;;;;;;;;; Ukraine q 100.00 81.44 Full Full<br />
Braas Ukraine GmbH ;;;; Ukraine q 100.00 100.00 Full Full<br />
<strong>Lafarge</strong> Redland Aggregates Ltd UK q Lime 100.00 100.00 Full Full<br />
<strong>Lafarge</strong> Plasterboard Ltd ;;; UK q 100.00 100.00 Full Full<br />
<strong>Lafarge</strong> Roofing Limited ;;; UK q 100.00 100.00 Full Full<br />
Blue Circle Industries Plc ;;; UK q 99.91 99.91 Full Full<br />
Britannia Aggregates Limited(2) UK q 50.00 25.00 Proportionate Equity<br />
Bluewater Concrete Ltd(2) ;; UK q 50.00 50.00 Proportionate Equity<br />
Redland Westminster Aggregates<br />
Ltd(2) ;;;;;;;;;; UK q 50.00 50.00 Proportionate Equity<br />
Scotcem Roof Tiles Ltd ;;; UK q 100.00 100.00 Full Full<br />
BC Ebbsfleet Ltd(2) ;;;;; UK<br />
LAFARGE<br />
NOTES TO THE CONSOLIDATED FINANCIAL STATEMENTS — (Continued)<br />
Real<br />
estate 50.00 49.96 Proportionate Equity<br />
(2) These companies are proportionately consolidated under French GAAP, but accounted for under the<br />
equity method under US GAAP [see Note 31-17 (b)]<br />
* Cementarna Trbovlje changed its legal name in 2003 and became <strong>Lafarge</strong> Cement DD<br />
F-102
LAFARGE<br />
NOTES TO THE CONSOLIDATED FINANCIAL STATEMENTS — (Continued)<br />
Aggreg.<br />
Consolidation method<br />
and Control Ownership French US<br />
Companies Countries Cement Concrete Roofing Gypsum Others % % GAAP GAAP<br />
<strong>Lafarge</strong> North America ;;;; USA q q q 53.13 53.13 Full Full<br />
Carmeuse North America;;;; USA Lime 40.00 40.00 Equity Equity<br />
Monier Inc. ;;;;;;;;; USA q 100.00 100.00 Full Full<br />
<strong>Lafarge</strong> Road Marking System ; USA<br />
Road<br />
markings 100.00 100.00 Full Full<br />
MonierLifetile LLC(2) ;;;;; USA q 50.00 50.00 Proportionate Equity<br />
Blue Circle North America ;;; USA q q 100.00 99.91 Full Full<br />
Bulk Materials Inc ;;;;;; USA q 48.24 48.24 Equity Equity<br />
Fabrica Nacional de Cementos ; Venezuela q 61.14 60.93 Full Full<br />
Cementos Catatumbo CA;;;; Venezuela q 23.32 23.32 Equity Equity<br />
Tachira Cementos;;;;;;; Venezuela q 99.75 75.44 Full Full<br />
Induconagre ;;;;;;;;; Venezuela q 100.00 60.93 Full Full<br />
Supermix concrete Co Ltd ;;; Vietnam q 70.00 23.64 Full Full<br />
Chilanga ;;;;;;;;;; Zambia q 84.00 84.00 Full Full<br />
Circle Cement ;;;;;;;; Zimbabwe q 76.45 76.39 Full Full<br />
(2) These companies are proportionately consolidated under French GAAP, but accounted for under the<br />
equity method under US GAAP [see Note 31-17 (b)]<br />
F-103
Ó <strong>Lafarge</strong> – March 2004<br />
Production: Department of Legal Affairs <strong>Lafarge</strong> / Design for the cover: 4 Lunes / Production: St Ives Burrups.