ARDSnet Ventilatory Protocol and Alveolar Hyperinflation
ARDSnet Ventilatory Protocol and Alveolar Hyperinflation
ARDSnet Ventilatory Protocol and Alveolar Hyperinflation
You also want an ePaper? Increase the reach of your titles
YUMPU automatically turns print PDFs into web optimized ePapers that Google loves.
764 AMERICAN JOURNAL OF RESPIRATORY AND CRITICAL CARE MEDICINE VOL 176 2007<br />
DISCUSSION<br />
Our data support the hypothesis that application of the <strong>ARDSnet</strong><br />
protocol may generate tidal alveolar hyperinflation in patients<br />
with ARDS with a focal pattern of loss of aeration. Furthermore,<br />
they show that the observed hyperinflation is likely due to<br />
the PEEP setting criteria of this specific protocol (table based,<br />
alternating PEEP <strong>and</strong> FI O2 increases to achieve an oxygenation<br />
target). We demonstrated that adjusting PEEP based on the<br />
respiratory system mechanics of an individual patient allows<br />
reduced risk of alveolar hyperinflation.<br />
In the present study, the application of the stress index<br />
analysis revealed the occurrence of tidal alveolar hyperinflation<br />
in patients with focal ARDS who were ventilated using the<br />
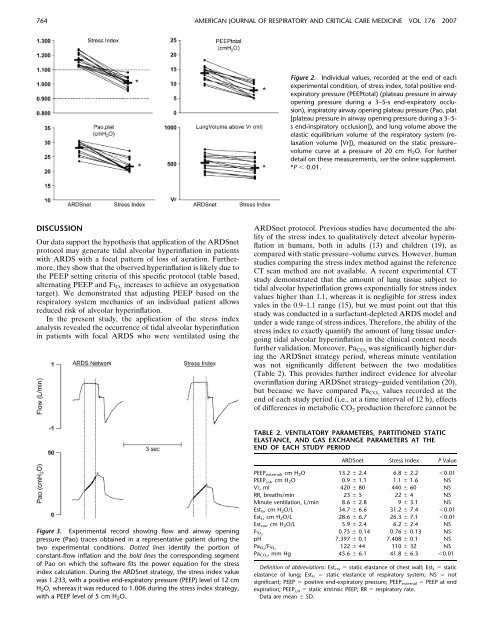
Figure 3. Experimental record showing flow <strong>and</strong> airway opening<br />
pressure (Pao) traces obtained in a representative patient during the<br />
two experimental conditions. Dotted lines identify the portion of<br />
constant-flow inflation <strong>and</strong> the bold lines the corresponding segment<br />
of Pao on which the software fits the power equation for the stress<br />
index calculation. During the <strong>ARDSnet</strong> strategy, the stress index value<br />
was 1.233, with a positive end-expiratory pressure (PEEP) level of 12 cm<br />
H2O, whereas it was reduced to 1.006 during the stress index strategy,<br />
with a PEEP level of 5 cm H 2O.<br />
Figure 2. Individual values, recorded at the end of each<br />
experimental condition, of stress index, total positive endexpiratory<br />
pressure (PEEPtotal) (plateau pressure in airway<br />
opening pressure during a 3–5-s end-expiratory occlusion),<br />
inspiratory airway opening plateau pressure (Pao, plat<br />
[plateau pressure in airway opening pressure during a 3–5s<br />
end-inspiratory occlusion]), <strong>and</strong> lung volume above the<br />
elastic equilibrium volume of the respiratory system (relaxation<br />
volume [Vr]), measured on the static pressure–<br />
volume curve at a pressure of 20 cm H2O. For further<br />
detail on these measurements, see the online supplement.<br />
*P , 0.01.<br />
<strong>ARDSnet</strong> protocol. Previous studies have documented the ability<br />
of the stress index to qualitatively detect alveolar hyperinflation<br />
in humans, both in adults (13) <strong>and</strong> children (19), as<br />
compared with static pressure–volume curves. However, human<br />
studies comparing the stress index method against the reference<br />
CT scan method are not available. A recent experimental CT<br />
study demonstrated that the amount of lung tissue subject to<br />
tidal alveolar hyperinflation grows exponentially for stress index<br />
values higher than 1.1, whereas it is negligible for stress index<br />
vales in the 0.9–1.1 range (15), but we must point out that this<br />
study was conducted in a surfactant-depleted ARDS model <strong>and</strong><br />
under a wide range of stress indices. Therefore, the ability of the<br />
stress index to exactly quantify the amount of lung tissue undergoing<br />
tidal alveolar hyperinflation in the clinical context needs<br />
further validation. Moreover, PaCO 2 was significantly higher during<br />
the <strong>ARDSnet</strong> strategy period, whereas minute ventilation<br />
was not significantly different between the two modalities<br />
(Table 2). This provides further indirect evidence for alveolar<br />
overinflation during <strong>ARDSnet</strong> strategy–guided ventilation (20),<br />
but because we have compared Pa CO2 values recorded at the<br />
end of each study period (i.e., at a time interval of 12 h), effects<br />
of differences in metabolic CO 2 production therefore cannot be<br />
TABLE 2. VENTILATORY PARAMETERS, PARTITIONED STATIC<br />
ELASTANCE, AND GAS EXCHANGE PARAMETERS AT THE<br />
END OF EACH STUDY PERIOD<br />
<strong>ARDSnet</strong> Stress Index P Value<br />
PEEP external, cmH 2O 13.2 6 2.4 6.8 6 2.2 ,0.01<br />
PEEP i,st, cmH 2O 0.9 6 1.1 1.1 6 1.6 NS<br />
VT, ml 420 6 80 440 6 60 NS<br />
RR, breaths/min 23 6 5 22 6 4 NS<br />
Minute ventilation, L/min 8.6 6 2.8 9 6 3.1 NS<br />
Estrs, cmH2O/L 34.7 6 6.6 31.2 6 7.4 ,0.01<br />
EstL, cmH2O/L 28.6 6 6.7 26.3 6 7.1 ,0.01<br />
Est cw, cmH 2O/L 5.9 6 2.4 6.2 6 2.4 NS<br />
FI O2 0.75 6 0.14 0.76 6 0.13 NS<br />
pH 7.397 6 0.1 7.408 6 0.1 NS<br />
PaO 2 /FIO 2 122 6 44 110 6 32 NS<br />
PaCO 2 , mm Hg 45.6 6 6.1 41.8 6 6.3 ,0.01<br />
Definition of abbreviations: Estcw 5 static elastance of chest wall; EstL 5 static<br />
elastance of lung; Estrs 5 static elastance of respiratory system; NS 5 not<br />
significant; PEEP 5 positive end-expiratory pressure; PEEP external 5 PEEP at end<br />
expiration; PEEP i,st 5 static intrinsic PEEP; RR 5 respiratory rate.<br />
Data are mean 6 SD.


