Emetic toxin-producing strains of Bacillus cereus show distinct ...
Emetic toxin-producing strains of Bacillus cereus show distinct ...
Emetic toxin-producing strains of Bacillus cereus show distinct ...
Create successful ePaper yourself
Turn your PDF publications into a flip-book with our unique Google optimized e-Paper software.
International Journal <strong>of</strong> Food Microbiology Volume 109, Issues 1-2 , 25 May 2006, Pages 132-138<br />
curves diverged from linearity, the non-linear model <strong>of</strong> Mafart et al. (2002) was used to<br />
calculate the time to first decimal reduction ( ).<br />
2.6. Germination <strong>of</strong> B. <strong>cereus</strong> spores<br />
The method was similar to that used by Dufrenne et al. (1994). Briefly B. <strong>cereus</strong> spores were<br />
produced and stored as previously described. A spore suspension containing ca 10 7 –10 8 B.<br />
<strong>cereus</strong> spores/ml in 100 mM phosphate buffer at pH 6.8 was prepared and pasteurised at 80<br />
°C for 5 min. Aliquots <strong>of</strong> 100 l were inoculated in tubes containing 9.9 ml <strong>of</strong> J broth. The<br />
tubes were then incubated at 30 °C for 50 min and at 7 °C ± 0.5 °C for 7 days. After<br />
incubation tubes were pasteurised at 80 °C for 5 min. Spores were counted just after<br />
inoculation into tubes and after pasteurisation at the end <strong>of</strong> incubation, as described above.<br />
Two replicate tubes were performed for each incubation temperature. The extent <strong>of</strong><br />
germination was expressed as the log10(N0/N), N0 being the initial spore number and N the<br />
number <strong>of</strong> remaining spores after incubation.<br />
2.7. Statistical analysis<br />
Differences between emetic <strong>toxin</strong>-<strong>producing</strong> <strong>strains</strong>, diarrheal, and food–environment <strong>strains</strong><br />
were tested (i) with the Pearson's Chi-square test for upper and lower growth temperatures<br />
and (ii) with the Kruskal–Wallis test for heat resistance and germination, using Systat version<br />
9 (SPSS, Chicago, USA). Threshold values were kept for statistical analysis when no<br />
accurate value could have been determined.<br />
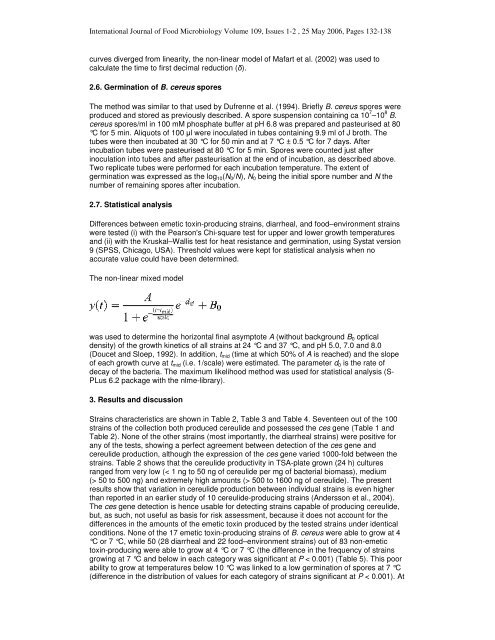
The non-linear mixed model<br />
was used to determine the horizontal final asymptote A (without background B0 optical<br />
density) <strong>of</strong> the growth kinetics <strong>of</strong> all <strong>strains</strong> at 24 °C and 37 °C, and pH 5.0, 7.0 and 8.0<br />
(Doucet and Sloep, 1992). In addition, tmid (time at which 50% <strong>of</strong> A is reached) and the slope<br />
<strong>of</strong> each growth curve at t mid (i.e. 1/scale) were estimated. The parameter d 0 is the rate <strong>of</strong><br />
decay <strong>of</strong> the bacteria. The maximum likelihood method was used for statistical analysis (S-<br />
PLus 6.2 package with the nlme-library).<br />
3. Results and discussion<br />
Strains characteristics are <strong>show</strong>n in Table 2, Table 3 and Table 4. Seventeen out <strong>of</strong> the 100<br />
<strong>strains</strong> <strong>of</strong> the collection both produced cereulide and possessed the ces gene (Table 1 and<br />
Table 2). None <strong>of</strong> the other <strong>strains</strong> (most importantly, the diarrheal <strong>strains</strong>) were positive for<br />
any <strong>of</strong> the tests, <strong>show</strong>ing a perfect agreement between detection <strong>of</strong> the ces gene and<br />
cereulide production, although the expression <strong>of</strong> the ces gene varied 1000-fold between the<br />
<strong>strains</strong>. Table 2 <strong>show</strong>s that the cereulide productivity in TSA-plate grown (24 h) cultures<br />
ranged from very low (< 1 ng to 50 ng <strong>of</strong> cereulide per mg <strong>of</strong> bacterial biomass), medium<br />
(> 50 to 500 ng) and extremely high amounts (> 500 to 1600 ng <strong>of</strong> cereulide). The present<br />
results <strong>show</strong> that variation in cereulide production between individual <strong>strains</strong> is even higher<br />
than reported in an earlier study <strong>of</strong> 10 cereulide-<strong>producing</strong> <strong>strains</strong> (Andersson et al., 2004).<br />
The ces gene detection is hence usable for detecting <strong>strains</strong> capable <strong>of</strong> <strong>producing</strong> cereulide,<br />
but, as such, not useful as basis for risk assessment, because it does not account for the<br />
differences in the amounts <strong>of</strong> the emetic <strong>toxin</strong> produced by the tested <strong>strains</strong> under identical<br />
conditions. None <strong>of</strong> the 17 emetic <strong>toxin</strong>-<strong>producing</strong> <strong>strains</strong> <strong>of</strong> B. <strong>cereus</strong> were able to grow at 4<br />
°C or 7 °C, while 50 (28 diarrheal and 22 food–environment <strong>strains</strong>) out <strong>of</strong> 83 non-emetic<br />
<strong>toxin</strong>-<strong>producing</strong> were able to grow at 4 °C or 7 °C (the difference in the frequency <strong>of</strong> <strong>strains</strong><br />
growing at 7 °C and below in each category was significant at P < 0.001) (Table 5). This poor<br />
ability to grow at temperatures below 10 °C was linked to a low germination <strong>of</strong> spores at 7 °C<br />
(difference in the distribution <strong>of</strong> values for each category <strong>of</strong> <strong>strains</strong> significant at P < 0.001). At


