Successfully Linking Leadframe Roughening Processes - Atotech
Successfully Linking Leadframe Roughening Processes - Atotech
Successfully Linking Leadframe Roughening Processes - Atotech

You also want an ePaper? Increase the reach of your titles
YUMPU automatically turns print PDFs into web optimized ePapers that Google loves.
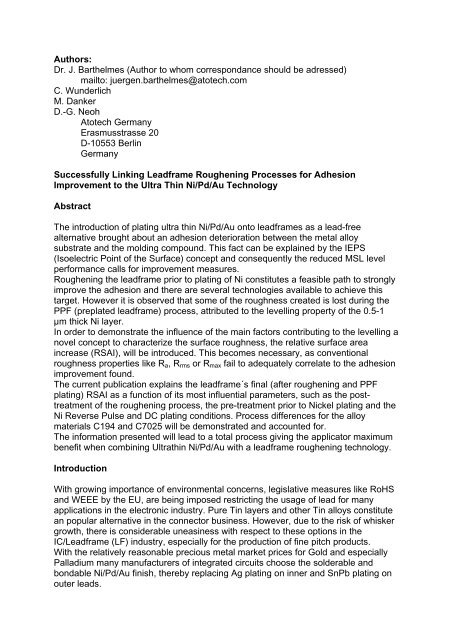
Authors:<br />
Dr. J. Barthelmes (Author to whom correspondance should be adressed)<br />
mailto: juergen.barthelmes@atotech.com<br />
C. Wunderlich<br />
M. Danker<br />
D.-G. Neoh<br />
<strong>Atotech</strong> Germany<br />
Erasmusstrasse 20<br />
D-10553 Berlin<br />
Germany<br />
<strong>Successfully</strong> <strong>Linking</strong> <strong>Leadframe</strong> <strong>Roughening</strong> <strong>Processes</strong> for Adhesion<br />
Improvement to the Ultra Thin Ni/Pd/Au Technology<br />
Abstract<br />
The introduction of plating ultra thin Ni/Pd/Au onto leadframes as a lead-free<br />
alternative brought about an adhesion deterioration between the metal alloy<br />
substrate and the molding compound. This fact can be explained by the IEPS<br />
(Isoelectric Point of the Surface) concept and consequently the reduced MSL level<br />
performance calls for improvement measures.<br />
<strong>Roughening</strong> the leadframe prior to plating of Ni constitutes a feasible path to strongly<br />
improve the adhesion and there are several technologies available to achieve this<br />
target. However it is observed that some of the roughness created is lost during the<br />
PPF (preplated leadframe) process, attributed to the levelling property of the 0.5-1<br />
µm thick Ni layer.<br />
In order to demonstrate the influence of the main factors contributing to the levelling a<br />
novel concept to characterize the surface roughness, the relative surface area<br />
increase (RSAI), will be introduced. This becomes necessary, as conventional<br />
roughness properties like Ra, Rrms or Rmax fail to adequately correlate to the adhesion<br />
improvement found.<br />
The current publication explains the leadframe´s final (after roughening and PPF<br />
plating) RSAI as a function of its most influential parameters, such as the posttreatment<br />
of the roughening process, the pre-treatment prior to Nickel plating and the<br />
Ni Reverse Pulse and DC plating conditions. Process differences for the alloy<br />
materials C194 and C7025 will be demonstrated and accounted for.<br />
The information presented will lead to a total process giving the applicator maximum<br />
benefit when combining Ultrathin Ni/Pd/Au with a leadframe roughening technology.<br />
Introduction<br />
With growing importance of environmental concerns, legislative measures like RoHS<br />
and WEEE by the EU, are being imposed restricting the usage of lead for many<br />
applications in the electronic industry. Pure Tin layers and other Tin alloys constitute<br />
an popular alternative in the connector business. However, due to the risk of whisker<br />
growth, there is considerable uneasiness with respect to these options in the<br />
IC/<strong>Leadframe</strong> (LF) industry, especially for the production of fine pitch products.<br />
With the relatively reasonable precious metal market prices for Gold and especially<br />
Palladium many manufacturers of integrated circuits choose the solderable and<br />
bondable Ni/Pd/Au finish, thereby replacing Ag plating on inner and SnPb plating on<br />
outer leads.
Besides the economical risk of fluctuating precious metal costs the technical<br />
disadvantage of the noble finish is its high IEPS [1] (isoelectric point of the surface),<br />
which decreases the adhesion between metal and molding compound. In general a<br />
lower thermal reliability and a reduced MSL (moisture sensitivity level) performance is<br />
found for a Ni/Pd/Au or preplated leadframe (PPF). The trend towards thinner<br />
packages/new package designs and the higher reflow temperature further deteriorate<br />
the MSL rating.<br />
<strong>Leadframe</strong> roughening through immersion in an intergranular etch solution increases<br />
the LF surface area and thereby the mechanical adhesion between metal and<br />
molding compound. This technology is already applied by LF and IC manufacturers<br />
mainly for their Ag spot plating products, such as QFN. This paper will discuss<br />
various important aspects of applying the LF roughening technology in combination<br />
with plating Ni/Pd/Au finishes.<br />
The <strong>Leadframe</strong> <strong>Roughening</strong> Process<br />
The process sequence consists of a pre-treatment (mild etch to activation) to clean<br />
the Cu alloy off surface impurities from preceding operations and to minimize the<br />
drag in of contaminants into the main bath. The following etching electrolyte is a<br />
mixture of hydrogen peroxide, sulphuric acid and proprietary organic additives. It<br />
attacks the LF, roughens it through intergranular etching effected by the organic<br />
components and creates an organo-metallic coating of Cu(II) on the LF surface. The<br />
sequence is concluded by an alkaline PostDip which removes most of the coating. In<br />
conventional Ag spot plating technology its purpose is cleaning the Ag surface for<br />
best wire bondability, in combination with PPF it strips off the organic film to optimize<br />
the adhesion to the Ni layer, which will be deposited subsequently. Table 1 gives a<br />
summary of process conditions of the MoldPrep LF roughening process for<br />
conveyorized and rack application.<br />
Process Step T (°C)<br />
Dwell Time (sec)<br />
Conveyor Rack<br />
Mild Etch 25-30 30 60<br />
Cleaning 45-55 30 240<br />
Activator 30-40 15 120<br />
LF Etching 30-40 60 90<br />
PostDip 40-50 20 60<br />
Table 1: Summary of Dwell Times and Temperatures for the Individual Steps of the<br />
MoldPrep LF Process as a Function of Application<br />
Typical etch depths in production range between 0.7 and 1.3 µm.<br />
The Cu Alloy Surface Morphology – The RSAI Concept<br />
During the etching process the Cu surface roughness is altered and strongly<br />
increased. The conventional parameters to quantify this property are the average<br />
roughness Ra or the root mean square roughness Rrms.<br />
In Table 2 the change in Ra and Rrms with roughening treatment is shown. On the<br />
average Ra and Rrms increase by 100 %. The values were obtained by Scanning<br />
Force Microscopy (SFM). The area scanned was 100µmx100µm.
Condition Ra [µm] % Rrms [µm] %<br />
Untreated LF 0,088 100% 0,113 100%<br />
After <strong>Roughening</strong> 0,195 222% 0,250 221%<br />
Table 2: Ra and Rrms as measured by SFM (100µmx100µm) of a C194 LF surface<br />
before and after roughening<br />
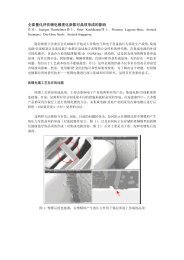
An optical impression of a surface morphology can be obtained by Scanning Electron<br />
microscopy (SEM). Figure 1 depicts the common leadframe alloys C194 and C7025<br />
after treatment with MoldPrep LF.<br />
MoldPrep LF – Morphology of Alloy Surfaces<br />
Alloy C194<br />
Alloy C7025<br />
3000 X 5000 X<br />
Figure 1: SEM Images of Alloys C194 and C7025 after LF <strong>Roughening</strong> at 3000-fold<br />
and 5000-fold Magnification<br />
However when attempting to quantify roughness to precisely assess and describe the<br />
etching processes’ result with respect to adhesion, neither Ra nor Rrms are meaningful<br />
parameters, as they do not relate to the increase of the interfacial area between<br />
molding compound and leadframe.<br />
In a first approximation the adhesion strength between two different materials is a<br />
function of the joint contact interface. Three dimensional data from SFM and<br />
Interference Microscopy (IM) can be used to calculate a morphology property called<br />
Relative Surface Area Increase (RSAI). The RSAI relates a computed alloy surface<br />
area to an ideally flat one.<br />
Figure 2 displays a series of images taken after each step of the LF roughening<br />
process MoldPrep LF. It shows the base material C194 as seen by SFM. Ra ,Rrms<br />
and RSAI of these morphologies are summarized in Table 3.
MoldPrep LF – Morphology and<br />
Relative Surface Area Increase (RSAI)<br />
Morphology Change with Process Step (by SFM) – Example C194<br />
Before<br />
After Descale<br />
After Cleaner After Activator<br />
After MoldPrep<br />
Figure 2: The C194 Alloy Surface after Each Step of the LF <strong>Roughening</strong> Process (10<br />
µm x10 µm) as seen by Scanning Force Microscopy<br />
The value of the various parameters is a function of the surface area scanned. As the<br />
resolution increases more information about a given morphology is obtained,<br />
therefore the RSAI increases with decreasing image size. At the same time Ra and<br />
Rrms become smaller. This is another clear indication for the fact that these<br />
parameters should not be assessed to quantify and relate to the expected adhesion.<br />
Sample Image Size R rms [nm] R a [nm] RSAI [%]<br />
100 µm x 100 µm 113 88 0,6<br />
62 µm x 62 µm 89 71 0,8<br />
Before<br />
after<br />
Cleaner<br />
after<br />
Descale<br />
after<br />
Activator<br />
after<br />
MoldPrep<br />
20 µm x 20 µm 83 69 3,3<br />
10 µm x 10 µm 60 48 4,7<br />
100 µm x 100 µm 118 88 0,6<br />
62 µm x 62 µm 109 85 1,3<br />
20 µm x 20 µm 83 64 3,8<br />
10 µm x 10 µm 55 45 5,9<br />
100 µm x 100 µm 132 104 1,5<br />
62 µm x 62 µm 112 88 2,8<br />
20 µm x 20 µm 85 67 7,8<br />
10 µm x 10 µm 72 56 10,6<br />
100 µm x 100 µm 130 103 1,4<br />
62 µm x 62 µm 120 96 2,9<br />
20 µm x 20 µm 87 69 7,3<br />
10 µm x 10 µm 73 57 10,9<br />
100 µm x 100 µm 250 195 30,9<br />
62 µm x 62 µm 295 240 66,7<br />
20 µm x 20 µm 250 202 78,3<br />
10 µm x 10 µm 239 193 92,9<br />
Table 3: Comparison of Different Roughness Values obtained by SFM,<br />
Characterising the C194 Surface after Each Step of the LF <strong>Roughening</strong> Process;<br />
Function of Image Size scanned<br />
RSAI Development with Post-Treatment of the <strong>Roughening</strong> Process<br />
As mentioned above after roughening the LFs will be immersed in a postdip to either<br />
clean the Ag surface for bonding or to prepare for optimized adhesion of the Ni (Ag)<br />
layer to be plated.<br />
Different alloy materials thereby exhibit different results with respect to the roughness<br />
created during the etching process. Table 4 compares typical results obtained for<br />
alloys C7025 and C194 for an etch depth of 1 µm.
Alloy R rms [µm] R a [µm] R max [µm] RSAI %<br />
C7025 0,290 0,232 2,320 54,1<br />
C194 0.330 0.263 2,443 79.0<br />
Table 4: Roughness Characteristics of C7025 and C194 after Treatment with the<br />
MoldPrep LF <strong>Roughening</strong> Process<br />
Acidic Postdip<br />
The relative surface area increase for the Si containing alloy C7025 is lower than for<br />
C194. More important however is the formation of a Si smut on the C7025 LF surface<br />
during the etching operation. For further processing of this material it is imperative to<br />
remove this smut within the subsequent post-treatment. This can only be done by an<br />
acidic type of postdip, which is slightly oxidising and which will remove some of the<br />
surface Cu layer.<br />
The following data explains the influence of the smut removing acidic postdip on the<br />
RSAI of the LF morphology. It is found that some of the extra surface area created is<br />
removed by this type of post-treatment.<br />
Alloy PD Condition RSAI<br />
C7025 No PostDip 54%<br />
C7025 Acidic PD, low conc. 44%<br />
C7025 Acidic PD, high conc. 38%<br />
Table 5: RSAI Development of a C7025 LF Surface after Treatment with the Acidic<br />
Postdip for Si Smut Removal<br />
After immersion of C7025 into the acidic postdip the LF can be Ni (Ag) plated without<br />
adjustment of the common pre-treatment for the subsequent operation.<br />
Alkaline Postdip<br />
An alkaline postdip is applied to all LF materials other than C7025, i.e. C194, EFTEC<br />
64T, MF202 and C151. In general the RSAI of those base alloys will slightly increase<br />
with alkaline post-treatment, along with that an enhancement in adhesion as<br />
witnessed in the button shear test is seen. The increase in RSAI can be as high as<br />
10-20 %.<br />
Table 6: Button Shear Test Results (in N/mm 2 Alloy Alkaline PD w ithout PD<br />
C194 17,1 13,5<br />
C7025 16,4 10,3<br />
EFTEC 64T 15,1 11,8<br />
) for Various Alloys with and without<br />
Alkaline Post Treatment<br />
RSAI Development with Ni-Plating<br />
When combining a leadframe roughening process with the ultrathin Ni/Pd/Au<br />
technology it is evident that the RSAI increase obtained shall not be destroyed or<br />
overly reduced by the subsequent pre-treatment of the PPF line. The same<br />
consideration holds true for the following plating of Ni, Pd and Au.
As the deposits of Pd and Au are in general between 5 to 50 nm thick, thus a<br />
noticeable levelling of the surface roughness can be expected by the Ni thickness<br />
only. The most prominent Ni electrolyte used in production is the Sulfamate type, for<br />
it exhibits the best ductility performance in the LF bending test.<br />
In Figure 3 images of C194 LF surfaces are displayed as a function of Ni thickness<br />
plated. Together with these the corresponding RSAI values are denoted. A gradual<br />
decrease of the RSAI with Ni thickness is observed. When manufacturing PPF the Ni<br />
layers are between 0.5 to 1.0 µm thick. Plating 0.7 µm Ni will reduce the RSAI as<br />
effected by the LF roughening process by around 40 % of its initial value. This holds<br />
true only for alkaline post-treatment after LF etching and proper, non-etching or<br />
oxidising, Ni pre-treatment.<br />
RSAI Development with Ni Thickness<br />
Morphology Change with Ni Thickness Plated – Example C194<br />
Images from Interference Microscope (IM)<br />
After Etching/Alk. PD<br />
RSAI: 95 %<br />
After 0.6 µm Ni<br />
RSAI: 58 %<br />
After 0.2 µm Ni<br />
RSAI: 80 %<br />
After 0.8 µm Ni<br />
RSAI: 51 %<br />
After 0.4 µm Ni<br />
RSAI: 68 %<br />
After 1.0 µm Ni<br />
RSAI: 41 %<br />
Figure 3: Morphology Change with Ni Thickness as Witnessed by the Interference<br />
Microscope, Base Alloy C194, Ni Thickness Range 0-1.0 µm, Ni Sulfamate Type<br />
Figure 4 depicts the RSAI decay with Ni thickness. The Ni layer was determined by<br />
means of XRF, which averages over the entire size of the measurement spot. As the<br />
surface area is strongly increased, the real Ni thickness will be lower.<br />
60<br />
RSAI [%] 50<br />
40<br />
RSAI Decay with Ni Thickness<br />
Morphology Change with Ni Thickness Plated – Example C194<br />
Images from Interference Microscope (IM)<br />
•Slow Exponential Decay of RSAI with Ni Thickness<br />
•Pre (before Ni) - and Post Treatment (after MP) contain no Etch Cleaner<br />
RSAI Decay after MoldPrep LF with Ni Thickness Plated RSAI Decay with Ni Thickness<br />
100<br />
90<br />
80<br />
70<br />
30<br />
20<br />
10<br />
0<br />
0 0,2 0,4 0,6 0,8 1<br />
Ni Thickness [µm]<br />
RSAI [%]<br />
y = 94,842e -0,8197x<br />
100<br />
90<br />
80<br />
70<br />
60<br />
50<br />
40<br />
30<br />
20<br />
10<br />
0<br />
0 0,2 0,4 0,6 0,8 1 1,2<br />
Ni Thickness [µm]<br />
Figure 4: RSAI Decay with Ni Thickness, Base Alloy C194, Ni Thickness Range 0-1.0<br />
µm, Ni Sulfamate Type<br />
Direct Current Plating Conditions
The levelling property of the Ni Sulfamate bath has been investigated as a function of<br />
direct current density and Ni concentration. For this, the samples to be plated were<br />
characterized in terms of RSAI before and after Ni plating. The reduction of RSAI<br />
serves as an indicator for the levelling performance of a given parameter set. As the<br />
absolute errors add up only substantial differences in the RSAI reduction will be<br />
considered significant. Starting from an RSAI between 60 – 70 % a reduction for 0.7<br />
µm Ni plated of 20-30% absolute RSAI is found. The current density was varied<br />
between 5 and 15 Asd (A/dm 2 ), the Ni concentration between 70 and 110 g/l. Due to<br />
the large relative error of the measurement the differences between the individual<br />
RSAI reductions are not significant. Figure 5 summarizes the results of this<br />
investigation. The two values displayed on the x-axis of the chart denote the current<br />
density in Asd and the Ni concentration in g/l.<br />
RSAI Reduction with Ni Plating Conditions<br />
DC Plating Conditions (0.7 µm Ni, Initial RSAI at 60-70 %)<br />
Current Density and Ni Concentration<br />
RSAI Reduction [%]<br />
35<br />
30<br />
25<br />
20<br />
15<br />
10<br />
5<br />
0<br />
Reduction of RSAI<br />
by Ni Plating of 0.7 µm<br />
5/70 15/70 5/110 10/110 15/110<br />
DCPlating Conditions CD/Ni conc. [Asd and g/l]<br />
Figure 5: RSAI Reduction for different DC Plating Conditions in the Ni Sulfamate<br />
bath, 0.7 µm Ni plated, Initial RSAI at 60-70 %<br />
Pulse Break and Reverse Pulse Plating Conditions<br />
Reverse Pulse Plating (PP) is widely applied for plating acid Cu in the field of PCB<br />
and IC substrate manufacturing. One well known property of these layers is that their<br />
levelling capacity is lost with stronger reverse pulses or larger reverse charges.<br />
Therefore basic investigations were initiated to understand the influence of PP for the<br />
deposition of Ni on the surface morphology of roughened LFs.<br />
In Figure 6 the RSAI decrease is shown for three different sets of PP parameters.<br />
The average current density applied is 10 Asd, the ratio of reverse to forward current<br />
density is 3:1, the Ni thickness plated 0.7 µm. As for the DC plating experiments the<br />
initial RSAI was between 60-70 %.<br />
Even though the overall RSAI reduction is smaller than in the DC experiments the<br />
difference observed between PP and DC can not be considered significant either.<br />
Pulse breaks (PB) or pauses are frequently used as the so called chopper plating<br />
also in LF manufacturing. The influence of such current-time functions on the RSAI<br />
change during the Ni deposition was investigated and is displayed in Figure 6 as<br />
well. The commonly applied pulse durations did not exhibit different responses as<br />
compared to those obtained in the DC or PP experiments.
RSAI Difference [%]<br />
30<br />
25<br />
20<br />
15<br />
10<br />
5<br />
0<br />
RSAI Reduction with Ni Plating Conditions<br />
Pulse Break (PB) and Reverse Pulse Plating (PP) Conditions<br />
(0.7 µm Ni, Initial RSAI at 65 %, 10 Asd average CD, CD rev/fwd 3:1)<br />
PB: On and Off Time [ms]<br />
PP: Forward and Reverse Plating Times [ms]<br />
Reduction of RSAI by Ni Plating of 0.7 µm<br />
Pulse Break and Reverse Pulse Plating at Average 10 Asd<br />
10 on/10off 20on/20off 20on/40off 10/0,5 80/4 400/20<br />
PP Reverse Plating Times fwd/rev [ms]<br />
Figure 6: RSAI Reduction for different Pulse Break and Reverse Pulse Plating<br />
Conditions in the Ni Sulfamate bath, 0.7 µm Ni plated, Initial RSAI at 60-70 %<br />
Summary<br />
Due to its higher IEPS the ultrathin Ni/Pd/Au finish exhibits deteriorated MSL<br />
performance as compared to conventional Ag spot plated leadframes. One option to<br />
increase the adhesion of the noble metal surface to the molding compound<br />
constitutes the roughening of the LF prior to the Ni deposition.<br />
Commonly used roughness parameters can not appropriately describe the surface<br />
morphology when adhesion phenomena have to be assessed. The concept of the<br />
relative surface area increase (RSAI) is introduced to correlate the result of the<br />
roughening process to the expected adhesion increase. The RSAI compares the<br />
surface area of a three dimensional morphology to an ideally flat surface.<br />
The influence of different postdip options for the LF etching process on the RSAI was<br />
demonstrated. An alkaline postdip generally increases the RSAI and the adhesion as<br />
measured in the button shear test. The acidic postdip is required for smut removal<br />
from C7025 LFs and slightly decreases the RSAI through.<br />
During Ni plating the RSAI as generated in the roughening process is reduced. The<br />
function of RSAI with Ni thickness was established for a Ni Sulfamate electrolyte. The<br />
deposition of 0.7 µm Ni reduces the RSAI by 40% of its initial value.<br />
A significant influence of DC or pulse current conditions on the RSAI decrease could<br />
not be established.<br />
For certain packages the roughening of the LF prior to Ni/Pd/Au effects an MSL<br />
improvement of two levels. These packages can achieve MSL 1.<br />
References<br />
[1] J.C. Bolger and A.S. Michaelis “Interface Conversions for Polymer Coatings”, P.<br />
Weiss and D. Cheever, Editors, Chapter 1, Elsevier, New York (1968)