Noise reduction of a multistage export / reinjection - Dresser-Rand
Noise reduction of a multistage export / reinjection - Dresser-Rand
Noise reduction of a multistage export / reinjection - Dresser-Rand

You also want an ePaper? Increase the reach of your titles
YUMPU automatically turns print PDFs into web optimized ePapers that Google loves.
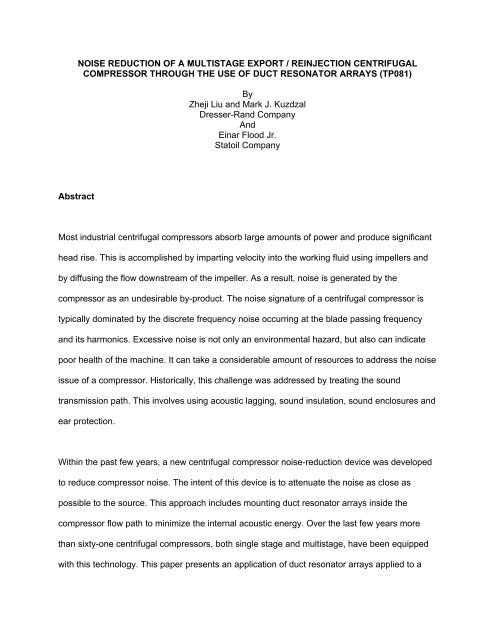
NOISE REDUCTION OF A MULTISTAGE EXPORT / REINJECTION CENTRIFUGAL<br />
COMPRESSOR THROUGH THE USE OF DUCT RESONATOR ARRAYS (TP081)<br />
Abstract<br />
By<br />
Zheji Liu and Mark J. Kuzdzal<br />
<strong>Dresser</strong>-<strong>Rand</strong> Company<br />
And<br />
Einar Flood Jr.<br />
Statoil Company<br />
Most industrial centrifugal compressors absorb large amounts <strong>of</strong> power and produce significant<br />
head rise. This is accomplished by imparting velocity into the working fluid using impellers and<br />
by diffusing the flow downstream <strong>of</strong> the impeller. As a result, noise is generated by the<br />
compressor as an undesirable by-product. The noise signature <strong>of</strong> a centrifugal compressor is<br />
typically dominated by the discrete frequency noise occurring at the blade passing frequency<br />
and its harmonics. Excessive noise is not only an environmental hazard, but also can indicate<br />
poor health <strong>of</strong> the machine. It can take a considerable amount <strong>of</strong> resources to address the noise<br />
issue <strong>of</strong> a compressor. Historically, this challenge was addressed by treating the sound<br />
transmission path. This involves using acoustic lagging, sound insulation, sound enclosures and<br />
ear protection.<br />
Within the past few years, a new centrifugal compressor noise-<strong>reduction</strong> device was developed<br />
to reduce compressor noise. The intent <strong>of</strong> this device is to attenuate the noise as close as<br />
possible to the source. This approach includes mounting duct resonator arrays inside the<br />
compressor flow path to minimize the internal acoustic energy. Over the last few years more<br />
than sixty-one centrifugal compressors, both single stage and <strong>multistage</strong>, have been equipped<br />
with this technology. This paper presents an application <strong>of</strong> duct resonator arrays applied to a
2528 PSIG (172 BARG) <strong>multistage</strong> centrifugal compressor on a platform in the North Sea. This<br />
compressor is used in a gas <strong>export</strong> process.<br />
Comparative field noise data taken from the compressor with duct resonator arrays and a<br />
second compressor <strong>of</strong> the same design but without duct resonator arrays will be shown in this<br />
study. The compressor with the duct resonator arrays was commissioned in September 2002<br />
and has been running successfully. The field data presented in the paper will show that noise<br />
<strong>reduction</strong> <strong>of</strong> 12 dBA can be achieved without the use <strong>of</strong> traditional noise insulation products.<br />
Introduction<br />
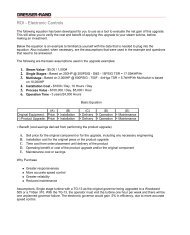
The Sleipner field, as depicted in Figures 1 and 2, consists <strong>of</strong> two major gas and condensate<br />
processing platforms (Sleipner A and T) plus a wellhead platform (Sleipner B), and a pipeline<br />
riser platform (Sleipner R) located in the Norwegian part <strong>of</strong> the North Sea. The Sleipner A<br />
platform started production <strong>of</strong> gas and condensate in August 1993. Sleipner T started in<br />
September 1996. Statoil operates the Sleipner field with partners ExxonMobil, Norsk Hydro and<br />
Total.<br />
The Sleipner T processing platform and the Sleipner B wellhead platform have a production<br />
6 3<br />
capacity <strong>of</strong> 554,200 SCFM ( 22. 6×<br />
10 Sm<br />
/day) <strong>of</strong> dry sales gas and 235 SCFM<br />
3 3<br />
( 9. 6×<br />
10 Sm<br />
/day) <strong>of</strong> condensate. An overview <strong>of</strong> the Sleipner Field is given in Figure 3.<br />
As the reservoir pressure gradually decreases in the Sleipner field, the natural gas<br />
recompression demand increases to maintain the same <strong>export</strong> capacity. In the summer <strong>of</strong> 2002<br />
both <strong>of</strong> the <strong>export</strong> compressors and gears (trains A and B) on the Sleipner T platform were
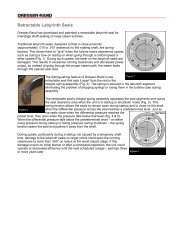
evamped. The revamped configuration was a five-stage straight-through centrifugal<br />
compressor. At the design point, the unit power was 17,300 horsepower (12.9 MW) and<br />
compressor inlet and discharge pressures were 1154 psia and 2229 psia. The unit operating<br />
speed was 8200 RPM at design point and the impeller tip diameter was 17.93 inches. A picture<br />
<strong>of</strong> the unit in operation is shown in Figure 4 and a cross section <strong>of</strong> the revamped five-stage unit<br />
is shown in Figure 5.<br />
This revamp was part <strong>of</strong> the Sleipner West compression project. With the new higher flow and<br />
higher head demands, it was estimated that the noise would increase 4-6 dB around the<br />
compressors. As a result, the end user was looking for a way to increase flow demand without<br />
increasing noise.<br />
This challenge created an opportunity for the compressor operators to install noise attenuation<br />
hardware inside the compressor. The limited space available on the platform means that the<br />
operators work close to the equipment. As a result, noise control on the platform is an important<br />
issue.<br />
This paper focuses on the noise <strong>reduction</strong> <strong>of</strong> an <strong>export</strong> compressor on the Sleipner T platform.<br />
A unique noise control technique was implemented to one <strong>of</strong> the compressors during the<br />
summer 2002 revamp. It was different than the traditional approach <strong>of</strong> treating the noise<br />
transmission paths by using sound insulation to cover the noisy structure; it used duct resonator<br />
arrays to address the compressor noise, internal to the compressor and at the noise source.<br />
The two compressors were revamped with identical designs except that compressor A had a<br />
device called a duct resonator array installed in it and compressor B did not. This arrangement
was proposed by the end user so that the noise attenuation effectiveness <strong>of</strong> the duct resonator<br />
arrays could be verified side by side once the two compressors were running.<br />
Duct Resonator Array<br />
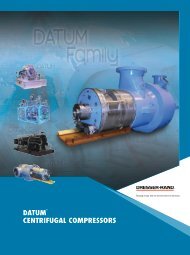
The duct resonator arrays used in this application took the form <strong>of</strong> flat plates. They were<br />
mounted in the last stage diffuser, just downstream <strong>of</strong> the impeller exit, as shown in Figure 6.<br />
This noise control approach has several advantages over the insulation approach. It attenuates<br />
the noise source directly instead <strong>of</strong> treating the symptom. Being installed inside the compressor<br />
diffuser, this approach minimizes the internal acoustic energy by reducing pressure pulsations.<br />
This internal energy relief not only provides the impeller with a smoother operating environment,<br />
but also means less acoustic energy traveling to upstream or downstream pipes. Less in-pipe<br />
pressure pulsation means less pipe vibration and less noise radiation.<br />
In addition, the duct resonator does not create equipment accessibility issues because it is<br />
internally mounted. Pipe or compressor body insulation not only causes inconvenience in<br />
equipment maintenance and accessibility, but also has the potential to trap seawater under it<br />
that can accelerate corrosion <strong>of</strong> the insulated structure.<br />
Before this application, the success <strong>of</strong> using duct resonator arrays to reduce centrifugal<br />
compressor noise had been experimentally validated through comprehensive in-house OEM<br />
acoustics testing and numerous field applications on pipeline compressors. Both in-house<br />
experimental data and field data gathered from a wide range <strong>of</strong> operation showed that the duct<br />
resonator arrays reduced the noise level by more than 10 dB without adverse effects on<br />
compressor efficiency, head, and range [1-3]. This proven technology has now been applied to
more than sixty-one <strong>multistage</strong> and single stage compressors. The results presented in this<br />
study represents the first duct resonator array application to a <strong>multistage</strong> compressor.<br />
The device has an array <strong>of</strong> acoustic chambers that are connected to the flow path by a series <strong>of</strong><br />
perforated openings. The array chambers behave like dead volume to the mean flow but are<br />
transparent to sound waves. The array does not have gas passing through it but does have<br />
acoustic waves oscillating through at all times. The insertion <strong>of</strong> a duct resonator array in a<br />
diffuser wall changes the diffuser wall from being acoustically rigid to acoustically transmissive.<br />
Consequently, the placement <strong>of</strong> the duct resonator array changes the diffuser wall impedance;<br />
this determines the noise attenuation performance [4-5]. A well-tuned duct resonator array can<br />
provide remarkably effective noise attenuation in a targeted frequency range with a limited<br />
space requirement. The array was designed to attenuate a frequency range where high<br />
amplitude noise occurs. Because centrifugal compressors tend to produce predominant noise at<br />
the blade passing frequency (BPF) and higher harmonics, tuning the array to attenuate these<br />
frequencies is the ultimate goal.<br />
Compressor <strong>Noise</strong> Characteristics<br />
In general, the noise signature <strong>of</strong> a centrifugal compressor is a superposition <strong>of</strong> discrete<br />
frequency tonal noise peaks on a broadband noise floor. The tonal noise peaks occur at the<br />
impeller blade passing frequency (BPF) and its harmonics. The tonal noise is a result <strong>of</strong> the<br />
impeller rotation. The noise level increases if stationary vanes (such as diffuser vanes) are used<br />
in the compressor. The broadband noise is mainly caused by the turbulence in the flow.<br />
Because the tonal noise peaks dominate the overall noise level <strong>of</strong> a centrifugal compressor,<br />
noise control strategy must focus on the <strong>reduction</strong> <strong>of</strong> the dominant noise peak level as a first<br />
priority.
The blade passing frequency (BPF) is dependent on machine operating speed (RPM) and<br />
impeller blade count ( N b ) and is given by:<br />
BPF =<br />
N<br />
b ×<br />
RPM<br />
60<br />
Knowing just the blade passing frequency is not enough to understand the compressor noise<br />
characteristics. There are other features in the compressor noise spectrum and they vary from<br />
machine to machine. These include the tonal prominence, peak bandwidth, and relative strength<br />
among the noise peaks (first BPF and second harmonic). Each has essential information for the<br />
design <strong>of</strong> the duct resonator array.<br />
These noise characteristics have been mostly determined by experimental test data. Narrow<br />
band FFT sound pressure level or narrow band sound intensity level measured from the<br />
compressor provides all the noise characteristics in the spectrum, although the latter requires a<br />
more sophisticated acoustic data acquisition system. The full octave and one-third octave sound<br />
data are easier to obtain but do not provide all the acoustical details and frequency<br />
characteristics.<br />
Physical measurement, particularly with a new compressor design, is not always possible.<br />
Under this circumstance, the computational approach becomes the only choice. Using an<br />
unsteady computational fluid dynamics (CFD) model incorporating a transient sliding mesh<br />
approach is required to simulate the impeller/diffuser aerodynamic interaction. Using this<br />
analysis, the dominant tonal noise peaks <strong>of</strong> the compressor can be predicted. The current CFD<br />
codes can not predict the broadband flow noise with good accuracy, this is determined<br />
empirically.
The measured compressor noise data in Figures 9-10 show that the compressor overall noise is<br />
dominated by the BPF. The noise peak at the second harmonic also is relatively strong. Both<br />
peaks are sharp with an elevated level <strong>of</strong> more than 10 dB above the broadband noise. This<br />
indicates that there is a large amount <strong>of</strong> sound energy surrounding the peak frequencies.<br />
These two figures will be discussed in greater detail later in this paper.<br />
The tonal noise dominance characteristics <strong>of</strong> a centrifugal compressor match very well with the<br />
noise attenuation characteristics <strong>of</strong> duct resonator arrays. Understanding compressor noise<br />
characteristics is a vital step to the success <strong>of</strong> devising a noise <strong>reduction</strong> solution.<br />
Compressor <strong>Noise</strong> Generation Mechanisms<br />
Discrete frequency noise at the first blade passing frequency and its harmonics is the dominant<br />
noise source <strong>of</strong> a centrifugal compressor. Understanding how and where it is generated is<br />
another important step to develop a noise <strong>reduction</strong> solution.<br />
There are two types <strong>of</strong> discrete frequency noise. The first one is the rotational noise associated<br />
with steady forces exerted by the rotating blades on the fluid being compressed. The rotation <strong>of</strong><br />
the rotor blades converts a steady, circumferentially varying pressure field around the surface <strong>of</strong><br />
the rotor blades in the rotating frame <strong>of</strong> reference into a periodic time-varying pressure field<br />
experienced in the stationary frame <strong>of</strong> reference. In addition, the flow field surrounding the rotor<br />
blades is rarely circumferentially uniform because a centrifugal compressor is geometrically<br />
non-axisymmetrical and <strong>of</strong>ten has obstructions (i.e., vanes) in the flow path. Any flow<br />
nonuniformity or distortion felt by the rotor blades cause a periodic fluctuating force on the rotor.<br />
For a compressor with vaneless diffusers, this type <strong>of</strong> rotor-alone discrete noise is the prominent<br />
noise source.
The second type <strong>of</strong> discrete frequency noise is the interaction noise, generated by the<br />
aerodynamic interaction between the rotating impeller blades and the stationary vanes (e.g.,<br />
diffuser vanes or low solidity diffuser vanes (LSD)). The discrete frequency noise due to this<br />
interaction can be further classified into wake interaction and potential field interaction. As the<br />
wake from an upstream object (e.g., an impeller blade) impinges on a downstream object (e.g. a<br />
vane), the velocity deficit in the wake causes the downstream object to experience a momentary<br />
change in angle <strong>of</strong> attack and in velocity because <strong>of</strong> the variation <strong>of</strong> the in-flow velocity in the<br />
wake. Consequently, a fluctuating load is imposed on the downstream object and a dipole noise<br />
source is generated.<br />
The potential field interaction is caused by the local periodic interference between the potential<br />
field <strong>of</strong> the upstream object such as an impeller blade and the potential field <strong>of</strong> the downstream<br />
object such as a vane. These potential fields interact with each other as the impeller rotates.<br />
That is, the pressure field <strong>of</strong> an impeller blade disturbs an LSD vane and the pressure field <strong>of</strong> an<br />
LSD vane disturbs an impeller blade. These disturbances also cause periodic loading variations<br />
that produce tonal noise at blade passing frequency and higher harmonics.<br />
The discrete frequency noise that results from this interaction is commonly associated with<br />
centrifugal compressors using LSD vanes. As a result, compressors with diffuser vanes are<br />
typically noisier than vaneless diffuser designs.<br />
Duct Resonator Array Location and Design Considerations<br />
There are two major reasons why the aeroacoustic noise source is mainly generated in the<br />
region between the impeller exit and diffuser entrance. First, the gas exiting the impeller is <strong>of</strong> the
highest velocity. High gas velocity directly relates to high amplitude pressure pulsations and<br />
higher acoustic power. Second, impeller/diffuser aerodynamic interaction is strongest between<br />
the impeller and the diffuser. This makes the diffuser an ideal location for the duct resonator<br />
arrays. The closer a noise control device is installed to the noise source, the more effective it<br />
becomes.<br />
In this application, duct resonator arrays are mounted to the diffuser walls using a T-slot<br />
geometry (see Figure 6). The flat plate arrays are horizontally split and the top and bottom<br />
halves are rolled into the top and bottom halves <strong>of</strong> the diaphragm assembly. Anti-rotation<br />
screws at the horizontal split are used to keep the arrays in place.<br />
The array is a one-piece unitary design machined from a solid steel plate with no bonding or<br />
welding. This eliminates the possibility <strong>of</strong> any mechanical failure associated with the bonding or<br />
welding process.<br />
Partitions between the array cavities are much bulkier than that <strong>of</strong> the honeycomb used as the<br />
middle layer <strong>of</strong> the aircraft engine acoustic liners [6]. This significantly increases the rigidity <strong>of</strong><br />
the duct resonator array.<br />
Stress and Modal Analysis<br />
Under normal operation, the static pressure differential across the array is zero; the holes in the<br />
array equalize the pressure. Nevertheless, a stress analysis was conducted assuming the<br />
cavities do not equalize during a sudden depressurization. For the Sleipner T application, a<br />
pressure differential <strong>of</strong> 441 psi (172 Bar –142 Bar = 30 Bar delta pressure) was applied to the<br />
array.
The step change in pressure was modeled as a static pressure load. A representative section <strong>of</strong><br />
the array was analyzed with a constant pressure load <strong>of</strong> 441 psi across the array. The<br />
maximum stress value is located at the edge <strong>of</strong> the small holes and has a value <strong>of</strong> 30 ksi. The<br />
material used was a low alloy steel plate, grade 4140 annealed to achieve NACE limits <strong>of</strong><br />
235HB maximum hardness. Because the material yield strength is 55 ksi, generalized yielding<br />
is not expected from this rare load event. Plate deformation is calculated to be 2.1 mils.<br />
Based on measured dynamic pressure pulsations from full load, full pressure test stand data,<br />
dynamic pressure pulsations <strong>of</strong> less than 10 psi are expected in the application [7]. The<br />
corresponding stress associated with a 10 psi pulsation is 0.7 ksi.<br />
Results <strong>of</strong> the above analysis are represented in Figure 7, which shows an alternating load <strong>of</strong><br />
0.7 ksi and a mean load <strong>of</strong> 0 ksi for the normal operating condition. Also shown on this plot is<br />
the 30 ksi maximum stress with 0.7 ksi alternating load for a hypothetical emergency shutdown<br />
condition. In either case, infinite life is expected.<br />
The modal analysis was conducted to determine the natural frequencies <strong>of</strong> the array<br />
membranes.<br />
The frequency <strong>of</strong> the first mode is well above the expected alternating pressure excitation<br />
frequency. Depending on the operating speed range, the blade passing frequency and<br />
associated alternating pressure excitation is between 2.4 kHz and 2.9 kHz. Membrane<br />
excitation is not expected.<br />
Acoustic Measurements and <strong>Noise</strong>-Reduction Results
In 2002, two compressors installed on the Sleipner T platform were revamped. Compressor A<br />
was modified from a four-stage compressor to a five-stage compressor with duct resonator<br />
arrays retr<strong>of</strong>itted into the last stage diffuser. Compressor B was revamped from a four-stage to a<br />
five-stage but without duct resonator arrays. After revamping, compressors A and B are <strong>of</strong> the<br />
same design except that duct resonator arrays are used only in unit A. With these two<br />
compressors running, a final acoustic test was conducted in January 2003 to determine the<br />
effectiveness <strong>of</strong> the duct resonator arrays on noise attenuation.<br />
The complex sound field around a compressor consists <strong>of</strong> contributions from various noise<br />
sources or components such as the compressor, the driver, the gearbox, and other auxiliary<br />
equipment in the vicinity. This generally makes the sound intensity level measurement more<br />
accurate and more reliable than the sound pressure level measurement. The accuracy <strong>of</strong> the<br />
sound intensity measurement results from the following two factors.<br />
First, sound intensity is a vector quantity that contains the magnitude and the direction <strong>of</strong> sound,<br />
while the sound pressure level is a scalar quantity that contains only the magnitude information.<br />
The sound intensity measurement can distinguish the targeted noise source facing the intensity<br />
probe and other noise sources behind the probe. On the other hand, the sound pressure level<br />
measurement by a microphone picks up sound from all noise sources existing in the given<br />
environment.<br />
Second, the sound intensity measurement can be conducted very close to the targeted noise<br />
source while the sound pressure level is typically measured by positioning the microphone in<br />
the far field <strong>of</strong> the sound source, at a distance <strong>of</strong> 3 feet or 1 meter. Measuring the sound<br />
intensity level close to the sound source improves the signal-to-noise ratio. The sound pressure<br />
measured in the far field has lower signal-to-noise ratio due to background noise.
Because sound intensity data are generally more accurate than sound pressure data for the<br />
given acoustic environment <strong>of</strong> a compressor installation site, the sound intensity measurement<br />
was used in this study. Before the start <strong>of</strong> the measurement, surface segments need to be<br />
predefined around the compressor. Sound intensity levels were obtained by scanning the<br />
specified surface segments with sound intensity equipment.<br />
<strong>Noise</strong> Signature Measurement <strong>of</strong> Compressor B<br />
Both compressors are installed in a room on the weather deck <strong>of</strong> the platform and both are<br />
driven by a gas turbine through a gearbox. Because compressor B was not equipped with duct<br />
resonator arrays, its acoustic measurement provides the baseline noise data.<br />
The compressor system was divided into several segments for sound intensity measurement.<br />
The surface segments defined prior to the measurement are shown as white blocks in Figure 8.<br />
Two 20-inch long (50-cm) quarter pipe segments represent the sound emitted from the suction<br />
and discharge pipes. A portion <strong>of</strong> the compressor casing surface represents another segment <strong>of</strong><br />
measurement.<br />
Each segment was scanned individually according to ISO 9614-2 [8]. Using the multiple<br />
analysis capability <strong>of</strong> the B&K pulse system, the following quantities were obtained<br />
simultaneously: (1) Sound intensity level in both narrow band (FFT) and 1/3 octave band, (2)<br />
mean sound pressure averaged between the phase-match microphone pair <strong>of</strong> the intensity<br />
probe, and (3) the p-I (pressure-intensity) index that gives an indication <strong>of</strong> the quality <strong>of</strong> the<br />
measurement. The p-I index <strong>of</strong> 2 to 8 dB was observed for all intensity data measured in the
critical frequency range. This indicates the sound intensity measurement is <strong>of</strong> good quality since<br />
the p-I index does not exceed 10 dB (ISO 9416-2 Engineering grade).<br />
Figures 9-11 present the baseline noise data measured from compressor B for the operating<br />
conditions listed in Table 1. The compressor noise signature shows that the blade passing<br />
frequency (BPF) dominates the overall noise. The noise peak at the second harmonic is also<br />
relatively strong. Both peaks are sharp and have a relatively narrow bandwidth. Extending the<br />
noise attenuation range <strong>of</strong> the duct resonator arrays to cover both peaks will help reduce the<br />
overall noise level.<br />
Comparing the sound intensity levels <strong>of</strong> the suction and discharge pipes at the high speed<br />
(8900 rpm), i.e., Figure 9 versus Figure 10, shows that the discharge pipe radiates higher noise<br />
than the suction pipe. This reveals that the last stage <strong>of</strong> the compressor is the first priority in<br />
noise <strong>reduction</strong> efforts. The duct resonator arrays installed in the last stage diffuser <strong>of</strong><br />
Compressor A were intended to reduce the dominant discharge pipe noise level. Figure 11<br />
shows sound intensity levels <strong>of</strong> the discharge pipe <strong>of</strong> compressor B while running at a slower<br />
speed. Comparing figures 9 and 11 indicates the higher noise level occurs at the higher speed.<br />
As expected, the compressor casing (cylinder) did a good job containing the noise. The sound<br />
intensity level from the casing is much lower than that <strong>of</strong> the suction and discharge pipes, as<br />
shown by Figure 12. The compressor casing is typically a thicker structure and, therefore,<br />
provides higher noise transmission loss than the thinner suction and discharge piping. The<br />
noise level emitted from the casing is more than 10 dBA lower than the suction and discharge<br />
pipes. As a result, the ambient noise is controlled by the noise emitted from the suction and<br />
discharge pipes. Because the dominate noise source is the discharge pipe, the majority <strong>of</strong> the<br />
remaining data presented will be focused on this pipe.
Acoustic Measurement <strong>of</strong> Compressor A<br />
The same acoustics equipment, personnel and test procedures used for compressor B were<br />
applied to compressor A. The same surface segments on the discharge pipe, the suction pipe,<br />
and the casing were specified for measurement. The same operating conditions (as practically<br />
could be achieved) run for compressor B, as listed in Table 1, were also run for compressor A.<br />
Figure 13 is the sound intensity spectrum measured from compressor A at the high speed <strong>of</strong><br />
8900 rpm. Relative to the baseline data <strong>of</strong> Figure 9, the spectrum plot <strong>of</strong> compressor A has<br />
different characteristics. The magnitude <strong>of</strong> the sound intensity level <strong>of</strong> compressor A is lower<br />
and the shape <strong>of</strong> the spectrum is changed. The installation <strong>of</strong> the duct resonator arrays<br />
significantly reduced noise peaks at the blade passing frequency and its second harmonic. This<br />
indicates that the duct resonator arrays worked effectively.<br />
At 8200 rpm, the sound intensity levels measured from compressor A, as shown in Figure 14, is<br />
also significantly lower than that <strong>of</strong> compressor B, as shown in Figure 11. The duct resonator<br />
array was effective for not just one condition or speed but for a range <strong>of</strong> operating conditions.<br />
The duct resonator array does not necessarily give its peak attenuation at the aerodynamic<br />
design condition since the aero design condition is not necessarily the high noise level<br />
condition. The optimum acoustic design condition was selected based upon the high noise level<br />
condition in this application.<br />
To quantify the noise attenuation achieved by the duct resonator arrays, Table 2 compares the<br />
blade passing frequency noise levels on the discharge pipe between compressor A and
compressor B and lists the noise attenuation under each operating condition. Table 3 compares<br />
the overall intensity levels between compressors A and B and lists the overall intensity level<br />
<strong>reduction</strong>.<br />
Figure 15 overlays the sound intensity plots <strong>of</strong> compressors A and B at the high-speed<br />
condition. At this high noise level, the <strong>reduction</strong> <strong>of</strong> 16 dB at the blade passing frequency and 14<br />
dB at the second harmonic corresponds to an overall intensity level <strong>reduction</strong> <strong>of</strong> 11.7 dBA on<br />
the discharge pipe. This demonstrates the great potential <strong>of</strong> duct resonator arrays on noise<br />
attenuation.<br />
At 8250 rpm, the duct resonator arrays reduced the blade passing frequency intensity level by<br />
12 dB, as compared in Figure 16. The overall intensity level <strong>of</strong> the discharge pipe was reduced<br />
by 8.9 dBA. Decibels are measured on a log scale. A 10 dB <strong>reduction</strong> corresponds to a 90<br />
percent <strong>reduction</strong> <strong>of</strong> sound power on a linear scale.<br />
Conclusions<br />
Acoustic tests demonstrated that the noise from the Sleipner T compressors was dominated by<br />
the blade passing frequency emitted from the suction and discharge pipes. Comparing the noise<br />
levels measured from compressors A and B confirmed that the installation <strong>of</strong> the duct resonator<br />
arrays in the last stage diffuser <strong>of</strong> Compressor A effectively reduced the major noise component<br />
at the blade passing frequency and its second harmonic on the discharge pipe. Consequently,<br />
the overall noise level was effectively reduced.<br />
The highest noise attenuation occurred at the high-speed condition (8900 rpm). This<br />
corresponds to the high-noise generation condition and, therefore, requires the maximum
amount <strong>of</strong> noise attenuation. A <strong>reduction</strong> <strong>of</strong> 16 dB at the blade passing frequency was obtained<br />
at this condition. The overall intensity level <strong>of</strong> the discharge pipe was reduced by 11.7 dBA. This<br />
demonstrated the great potential <strong>of</strong> noise attenuation by duct resonator arrays.<br />
At the design condition (8250 rpm), the BPF noise level <strong>of</strong> the discharge pipe was reduced by<br />
12 dB. The overall intensity level <strong>of</strong> the discharge pipe was reduced by 8.9 dBA.<br />
The duct resonator array is made <strong>of</strong> a solid plate with a rugged structural design. Rigorous finite<br />
element analysis and successful operating experience indicate that the duct resonator array is<br />
fit for the intended service. In 2004, the compressor was again revamped to match the new<br />
field condition. When the array, which had run successfully for two years, was removed from the<br />
compressor, inspection <strong>of</strong> the array revealed the array was in “like new” condition. The new<br />
revamped compressor was outfitted with duct resonator arrays that were tuned to the new<br />
operating conditions.<br />
Duct resonator arrays have been successfully applied to many single-stage pipeline<br />
compressors. This paper documents the first application <strong>of</strong> a duct resonator array in a<br />
<strong>multistage</strong> centrifugal compressor. The application <strong>of</strong> duct resonator arrays enabled the end<br />
user to increase flow and head and still meet noise regulations.<br />
Acknowledgements<br />
The authors would like to thank Mr. Per Gustafsson for conducting both the initial and final noise<br />
surveys. In addition, the authors would like to thank Mr. Bernard Ghim for his solid mechanics<br />
analysis work and Mr. Kevin Majot for his drafting support. Finally, the authors also thank<br />
<strong>Dresser</strong>-<strong>Rand</strong> Company and Statoil for allowing them to publish this paper.
References<br />
1. Liu, Z. and Hill, D. L., "Centrifugal Compressor <strong>Noise</strong> Reduction by Using Helmholtz<br />
Resonator Arrays." Proceedings <strong>of</strong> the 30th Turbomachinery Symposium, September 17-20,<br />
2001, Houston, Texas.<br />
2. Liu, Z., Jahnke, W., Marczak, M., and Kiteck, P., "Reducing Compressor Station Ambient<br />
<strong>Noise</strong> Level By Controlling Compressor Internal <strong>Noise</strong> Source," Proceedings <strong>of</strong> the<br />
International Pipeline Conference 2002, September 29 - October 3, 2002 Calgary, Alberta,<br />
Canada.<br />
3. Liu, Z., Hill, D. L., and Motriuk, R., "On Reducing Piping Vibration Levels – Attacking the<br />
Source," Proceedings <strong>of</strong> ASME Turbo Expo: Land, Sea & Air, June 3-5, 2002, Amsterdam,<br />
The Netherlands.<br />
4. Rice, E. J., "Optimum Wall Impedance for Spinning Modes- A Correlation with Mode Cut<strong>of</strong>f<br />
Ratio." Journal <strong>of</strong> Aircraft, vol. 16, No 5, May, 1979.<br />
5. Rice, E. J.,"Acoustic Liner Optimum Impedance for Spinning Modes with Mode Cut-<strong>of</strong>f Ratio<br />
as the Design Criterion." 3 rd AIAA Aero-Acoustics Conference, Palo Alto, California, July,<br />
1976.<br />
6. Hubbard, H. H., Aeroacoustics <strong>of</strong> Flight Vehicles, Acoustical Society <strong>of</strong> America, 1995.
7. Borer, et. al. , An Assessment <strong>of</strong> the Forces Acting Upon a Centrifugal Impeller Using Full<br />
Load, Full Pressure Hydrocarbon Testing, Proceedings <strong>of</strong> the 26th Turbomachinery<br />
Symposium, PP 111-121.<br />
8. ISO 9614-2, Acoustics - Determination <strong>of</strong> Sound Power Levels <strong>of</strong> <strong>Noise</strong> Sources Using<br />
Sound Intensity - Part 2: Measurement by Scanning.
Table 1 - Operating Conditions during Final Test<br />
Table 2 - <strong>Noise</strong> Attenuation at BPF<br />
Table 3 - Overall Intensity Level Reduction<br />
Figure 1 - Off-Shore Platform at Sleipner<br />
Figure 2 – Close-up <strong>of</strong> one <strong>of</strong> the Sleipner Platforms<br />
Figure 3 - Sleipner Fields<br />
Figure 4 - Photograph <strong>of</strong> the Compressor in Operation<br />
Figure 5 - Multistage Compressor for Sleipner West Compression Project<br />
Figure 6 - Multistage Compressor with Duct Resonator Array<br />
Figure 7 - Goodman Diagram for the Duct Resonator Array<br />
Figure 8 - Definition <strong>of</strong> Suction/Discharge Pipe and Casing Segments<br />
Figure 9 - Compressor B (without array) Running at 8903 RPM; Discharge Pipe Overall<br />
Intensity Level = 102 dBA<br />
Figure 10 - Compressor B (without array) Running at 8903 RPM; Suction Pipe Overall<br />
Intensity Level = 97.3 dBA<br />
Figure 11 - Compressor B (without array) Running at 8250 RPM; Discharge Pipe Overall<br />
Intensity Level = 95.1 dBA<br />
Figure 12 - Compressor B (without array) Running at 8250 RPM; Casing Overall Intensity<br />
Level = 78.5 dBA<br />
Figure 13 - Compressor A (with arrays) Running at 8858 RPM, Discharge Pipe Overall<br />
Sound Intensity Level = 90.3 dBA<br />
Figure 14- Compressor A (with arrays) Running at 8200 RPM; Discharge Pipe Overall<br />
Intensity Level = 86.2 dBA<br />
Figure 15 - Discharge Pipe -Comparison at High Speed<br />
Figure 16 – Discharge Pipe Comparison at Design Speed
Table 1 - Operating Conditions during Final Test<br />
Comp TS<br />
[°C]<br />
PS<br />
[bara]<br />
TD<br />
[°C]<br />
PD<br />
[bara]<br />
Speed<br />
[rpm]<br />
Flow<br />
[sm 3 /h]<br />
1× BPF<br />
[Hz]<br />
A 19.4 69 87 154 8200 610000 2597<br />
B 19.3 69 86 154 8250 660000 2613<br />
A 19.6 68 91 154 8858 756000 2805<br />
B 19.4 68 90 155 8903 821000 2819<br />
Table 2 - <strong>Noise</strong> Attenuation at BPF<br />
Operating points BPF Reduction on Discharge Pipe (dB)<br />
8900 rpm 16<br />
8250 rpm 12<br />
Table 3 - Overall Intensity Level Reduction<br />
Operating pts Discharge Pipe Overall Intensity Level<br />
Unit A (dBA) Unit B (dBA) Reduction (dBA)<br />
8900 rpm 90.3 102 11.7<br />
8250 rpm 86.2 95.1 8.9<br />
Figure 4 - Off-Shore Platform at Sleipner
Figure 5 – Close-up <strong>of</strong> One <strong>of</strong> the Sleipner Platforms
543 km<br />
12 km<br />
18 km<br />
Figure 6 - Sleipner Fields<br />
12 km<br />
8 km<br />
650 km<br />
240 km
Figure 4 - Photograph <strong>of</strong> the Compressor in Operation
Figure 5 - Multistage Compressor for Sleipner West Compression Project
Array<br />
Location<br />
Figure 6 - Multistage Compressor with Duct Resonator Arrays
Alternating Stress (ksi)<br />
60<br />
50<br />
40<br />
30<br />
20<br />
10<br />
HCF<br />
Yield<br />
Normal Operation<br />
Worst Case<br />
Scenario<br />
0<br />
0 10 20 30 40 50 60 70 80 90 100<br />
Mean Stress (ksi)<br />
Figure 7 - Goodman Diagram for the Duct Resonator Array
V1<br />
Z<br />
Y<br />
X<br />
Suction pipe<br />
Casing<br />
Figure 8 - Definition <strong>of</strong> suction/discharge pipe and casing segments<br />
Discharge pipe
[dB(A)/1.00p W/m²]<br />
Calc. Intensity Spectrum(Mic B,Mic A) - Mark 1<br />
Working : pipe_dis3 : Input : FFT Analyzer<br />
100<br />
90<br />
80<br />
70<br />
60<br />
50<br />
40<br />
BPF<br />
2 nd<br />
harmonic<br />
0 1k 2k 3k 4k<br />
[Hz]<br />
5k 6k 7k 8k<br />
Figure 9 - Compressor B (without array) Running at 8903 RPM; Discharge Pipe Overall Intensity Level =<br />
102 dBA
[dB(A)/1.00p W/m²]<br />
Calc. Intensity Spectrum(Mic B,Mic A) - Mark 1<br />
Working : pipe_suc3 : Input : FFT Analyzer<br />
100<br />
90<br />
80<br />
70<br />
60<br />
50<br />
40<br />
BPF<br />
2 nd<br />
harmonic<br />
0 1k 2k 3k 4k<br />
[Hz]<br />
5k 6k 7k 8k<br />
Figure 10 - Compressor B (without array) Running at 8903 RPM; Suction Pipe Overall Intensity Level = 97.3<br />
dBA
[dB(A)/1.000p W/m²]<br />
Calc. Intensity Spectrum(Mic B,Mic A) - Mark 1<br />
Working : pipe_dis21 : Input : FFT Analyzer<br />
100<br />
90<br />
80<br />
70<br />
60<br />
50<br />
40<br />
BPF<br />
2 nd<br />
harmonic<br />
0 1k 2k 3k 4k<br />
[Hz]<br />
5k 6k 7k 8k<br />
Figure 11 - Compressor B (without array) Running at 8250 RPM; Discharge Pipe Overall Intensity Level =<br />
95.1 dBA
[dB(A)/1.00p W/m²]<br />
Calc. Intensity Spectrum(Mic B,Mic A) - Mark 1<br />
Working : case_suc22 : Input : FFT Analyzer<br />
100<br />
90<br />
80<br />
70<br />
60<br />
50<br />
40<br />
0 1k 2k 3k 4k<br />
[Hz]<br />
5k 6k 7k 8k<br />
Figure 12 - Compressor B (without array) Running at 8250 RPM; Casing Overall Intensity Level = 78.5 dBA
[dB(A)/1.00p W/m²]<br />
Calc. Intensity Spectrum(Mic B,Mic A) - Mark 1<br />
Working : pipe_dis3 : Input : FFT Analyzer<br />
100<br />
90<br />
80<br />
70<br />
60<br />
50<br />
40<br />
BPF<br />
2 nd<br />
harmonic<br />
0 1k 2k 3k 4k<br />
[Hz]<br />
5k 6k 7k 8k<br />
Figure 13 - Compressor A (with arrays) Running at 8858 RPM, Discharge Pipe Overall Sound Intensity Level<br />
= 90.3 dBA
[dB(A)/1.000p W/m²]<br />
Calc. Intensity Spectrum(Mic B,Mic A) - Mark 1<br />
Working : pipe_dis11 : Input : FFT Analyzer<br />
100<br />
90<br />
80<br />
70<br />
60<br />
50<br />
40<br />
BPF<br />
2 nd<br />
harmonic<br />
0 1k 2k 3k 4k<br />
[Hz]<br />
5k 6k 7k 8k<br />
Figure 14- Compressor A (with arrays) Running at 8200 RPM; Discharge Pipe Overall Intensity Level = 86.2<br />
dBA
Sound Intensity Level [dB]<br />
100<br />
95<br />
90<br />
85<br />
80<br />
75<br />
70<br />
65<br />
60<br />
55<br />
50<br />
45<br />
BPF<br />
40<br />
0 1000 2000 3000 4000 5000 6000 7000 8000<br />
Frequency [Hz]<br />
Compressor B<br />
Compressor A (with Array)<br />
Figure 15 - Discharge Pipe -Comparison at High Speed<br />
2 nd<br />
harmonic
Sound Intensity Level [dB]<br />
100<br />
95<br />
90<br />
85<br />
80<br />
75<br />
70<br />
65<br />
60<br />
55<br />
50<br />
45<br />
BPF<br />
Compressor B<br />
Compressor A (with Array)<br />
2 nd<br />
harmonic<br />
40<br />
0 1000 2000 3000 4000<br />
Frequency [Hz]<br />
5000 6000 7000 8000<br />
Figure 16 – Discharge Pipe Comparison at Design Speed