Sustainable Building and Infrastructure Systems: Our Future ... - USM
Sustainable Building and Infrastructure Systems: Our Future ... - USM
Sustainable Building and Infrastructure Systems: Our Future ... - USM

You also want an ePaper? Increase the reach of your titles
YUMPU automatically turns print PDFs into web optimized ePapers that Google loves.
Editors:<br />
Abdul Naser Abdul Ghani<br />
Md Azree Othuman Mydin<br />
Noor Faisal Abas
International <strong>Building</strong> & <strong>Infrastructure</strong> Technology Conference<br />
7-8 June 2011, Vistana Hotel, Penang, Malaysia<br />
PROCEEDINGS OF INTERNATIONAL BUILDING & INFRASTRUCTURE<br />
TECHNOLOGY CONFERENCE 2011<br />
“<strong>Sustainable</strong> <strong>Building</strong> <strong>and</strong> <strong>Infrastructure</strong> <strong>Systems</strong>: <strong>Our</strong> <strong>Future</strong> Today”<br />
June 7 th – 8 th , 2011<br />
Vistana Hotel, Penang, Malaysia<br />
Editors<br />
Abdul Naser Abdul Ghani<br />
Md Azree Othuman Mydin<br />
Noor Faisal Abas<br />
Organized by<br />
School of Housing, <strong>Building</strong> <strong>and</strong> Planning,<br />
Universiti Sains Malaysia<br />
11800, Penang, Malaysia
International <strong>Building</strong> & <strong>Infrastructure</strong> Technology Conference<br />
7-8 June 2011, Vistana Hotel, Penang, Malaysia<br />
PROCEEDINGS OF INTERNATIONAL BUILDING & INFRASTRUCTURE<br />
TECHNOLOGY CONFERENCE 2011<br />
ORGANIZING COMMITTEE<br />
ADVISOR<br />
Prof. Ir. Dr. Mahyuddin Ramli<br />
CHAIRMAN<br />
Dr. Hanizam Awang<br />
SECRETARY<br />
Ir. Dr. Abdul Naser Abdul Ghani<br />
COMMITTEE<br />
Assoc. Prof. Ir. Nik Fuaad Nik Abllah<br />
Dr. Noor Faisal Abas<br />
Dr. Ahmad Hilmy Abdul Hamid<br />
Sr. Dr. Md Azree Othuman Mydin<br />
Dr. Mohd Zailan Sulieman<br />
Ir. Dr Mohd Zaid Yusof<br />
SCIENTIFIC COMMITTEE<br />
Abdul Naser Abdul Ghani PhD, P.Eng, MASCE, Associate Professor<br />
Meor Othman Hamzah PhD, Professor<br />
Ta-Peng Chang PhD, PE, Professor<br />
Narayanan Sambu Potty PhD, Associate Professor<br />
Siti Halipah Ibrahim PhD<br />
Md Azree Othuman Mydin PhD, MBEng, MIET<br />
Hanizam Awang PhD<br />
Noor Faisal Abas PhD<br />
Ruby Abraham PhD, Professor<br />
Nasly Mohamed Ali PhD, Professor<br />
Chan Chee Ming PhD, Associate Professor<br />
Kartini Kamaruddin PhD, P.Eng, Associate Professor<br />
Zainal Abidin Akasah PhD, Associate Professor<br />
Nik Fuaad Nik Abllah PE, Associate Professor<br />
Mohd Zaid Yusof PhD, P.Eng.<br />
Mohd Rodzi Ismail PhD<br />
Abdul Malek Abdul Rahman PhD, Reg. Arch., Associate Professor<br />
Ahmad Hilmy Abdul Hamid PhD<br />
Mohd Zailan Sulieman PhD<br />
Evelyn Tan G.L. PhD, Associate Professor<br />
CONFERENCE STAFF<br />
Kwan Wai Hoe<br />
Cheah Chee Ban<br />
Md Nor Atan<br />
Nur Diana Salihi<br />
Ahmad Farhan Roslan<br />
EDITORS<br />
Ir. Dr. Abdul Naser Abdul Ghani<br />
Sr. Dr. Md Azree Othuman Mydin<br />
Dr. Noor Faisal Abas
Published by:<br />
School of Housing, <strong>Building</strong> <strong>and</strong> Planning,<br />
Universiti Sains Malaysia<br />
11800, Penang, Malaysia<br />
International <strong>Building</strong> & <strong>Infrastructure</strong> Technology Conference<br />
7-8 June 2011, Vistana Hotel, Penang, Malaysia<br />
© School of Housing, <strong>Building</strong> <strong>and</strong> Planning, Universiti Sains Malaysia<br />
Proceedings of International <strong>Building</strong> & <strong>Infrastructure</strong> Technology Conference 2011<br />
First Edition 2011<br />
All rights reserved. No part of this publication may be reproduced, stored in a retrieval system, or<br />
transmitted, in any form or by any means, without the express permission of the School of Housing,<br />
<strong>Building</strong> <strong>and</strong> Planning, Universiti Sains Malaysia. Within Malaysia, exceptions are allowed in respect of<br />
any fair dealing for the purposes of research or private study, or criticism or review, as permitted under<br />
the Copyright, Designs <strong>and</strong> Patents Act, 1988, or in the case of reprographic reproduction in<br />
accordance with the licenses issued by the Copyright Licensing Agency.<br />
Enquiries concerning reproduction outside these terms <strong>and</strong> in other countries should be sent to the<br />
School of Housing, <strong>Building</strong> <strong>and</strong> Planning at the address above. All registered trademarks are hereby<br />
acknowledged <strong>and</strong> the publisher makes no claim to these trademarks.<br />
The School of Housing, <strong>Building</strong> <strong>and</strong> Planning <strong>and</strong> the Secretariat of the International <strong>Building</strong> &<br />
<strong>Infrastructure</strong> Technology Conference 2011 would like to thank the many contributors to this<br />
conference for waiving their moral rights to any or part of the complete work <strong>and</strong> for their support of<br />
the generous aims of the organisation <strong>and</strong> the conference.<br />
Every effort has been made by the editors, publishers <strong>and</strong> printers of these proceedings to see that no<br />
inaccurate data, opinion, or statement appears in the proceedings, <strong>and</strong> the data <strong>and</strong> opinions<br />
appearing in the articles herein are the responsibility of the author(s). Accordingly, the publishers,<br />
printers, editors <strong>and</strong> the Secretariat of the International <strong>Building</strong> & <strong>Infrastructure</strong> Technology<br />
Conference 2011 accept no liability whatsoever for the consequences of such inaccurate or<br />
misleading data, opinion or statement. Users are responsible for the correct application of the<br />
information in this publication.<br />
Concordance with the Proceedings of International <strong>Building</strong> & <strong>Infrastructure</strong> Technology Conference<br />
2011 does not in itself confer any immunity from legal obligations.
Proceedings Editor’s Foreword<br />
International <strong>Building</strong> & <strong>Infrastructure</strong> Technology Conference<br />
7-8 June 2011, Vistana Hotel, Penang, Malaysia<br />
Welcome to the International <strong>Building</strong> & <strong>Infrastructure</strong> Technology Conference 2011 in Penang,<br />
Malaysia.<br />
The main objective of this conference is to provide a unique international platform <strong>and</strong> forum for<br />
academicians, industrial players, key trade <strong>and</strong> investment policy makers, <strong>and</strong> PhD students with a<br />
clear aspiration to bridge the gaps existing between the aforementioned members in engineering,<br />
science <strong>and</strong> technology sectors.<br />
The submissions leading to the formation of these Proceedings are testament to the continual effort by<br />
the participants to produce the collective creative output which can only be achieved by bringing<br />
together all building <strong>and</strong> infrastructure technology disciplines in a unifying conference like the<br />
International <strong>Building</strong> & <strong>Infrastructure</strong> Technology Conference 2011.<br />
The inclusion of presentations by local <strong>and</strong> international key industrial players offers a practical<br />
dimension to the progress of research in science <strong>and</strong> technology. Furthermore, the additional inputs<br />
from the professionals provide a perspective of reality to combined academic <strong>and</strong> practical approach<br />
to building <strong>and</strong> infrastructure technology research <strong>and</strong> development.<br />
We would like to extend our appreciation to the contributors of these Proceedings <strong>and</strong> the presenters<br />
at the International <strong>Building</strong> & <strong>Infrastructure</strong> Technology Conference 2011 making the event a<br />
convention of thought-provoking <strong>and</strong> innovative ideas.<br />
International <strong>Building</strong> & <strong>Infrastructure</strong> Technology Conference 2011<br />
Ir. Dr. Abdul Naser Abdul Ghani<br />
Sr. Dr. Azree Othuman Mydin<br />
Dr. Noor Faisal Abas
About the Conference<br />
International <strong>Building</strong> & <strong>Infrastructure</strong> Technology Conference<br />
7-8 June 2011, Vistana Hotel, Penang, Malaysia<br />
The discipline of building <strong>and</strong> infrastructure technology is very related <strong>and</strong> important to the<br />
development industry. <strong>Building</strong> <strong>and</strong> infrastructures such as road, drainage, sewerage, water supply,<br />
power supply <strong>and</strong> communications are always part <strong>and</strong> parcel of any development works. In the 9 th<br />
Malaysia Plan, the government has allocated more than RM 14 billion for infrastructure development<br />
<strong>and</strong> another almost RM 5 billion for infrastructure maintenances.<br />
In order to achieve this goal we need the contributions of academicians, researchers, professionals<br />
<strong>and</strong> postgraduates to underpin the effort in advancing innovation in building <strong>and</strong> infrastructure<br />
technology. It is this factor that School of Housing, <strong>Building</strong> <strong>and</strong> Planning, Universiti Sains Malaysia<br />
gather for the Conference <strong>and</strong> by underst<strong>and</strong>ing the current phenomenon of sustainability<br />
development in building <strong>and</strong> infrastructure technology through research showcase <strong>and</strong> academic<br />
forum, together we encompass a shared vision, mutual underst<strong>and</strong>ing <strong>and</strong> trust in addressing the<br />
industry about the opportunities <strong>and</strong> challenges for growth in the future.<br />
This conference will bring together experts <strong>and</strong> practitioners from local <strong>and</strong> overseas who work in<br />
infrastructure, building <strong>and</strong> construction fields. The participant <strong>and</strong> presenters will discuss about case<br />
studies, emerging technologies, <strong>and</strong> the business side of building infrastructure technology. This event<br />
will be the best platform to discuss new strategies for the coming Malaysia’s RMK10 projects<br />
especially in terms of emerging technologies.<br />
Objectives:<br />
� Providing an opportunity for Malaysian <strong>and</strong> overseas academicians, researchers, professionals<br />
<strong>and</strong> postgraduates to present <strong>and</strong> challenge the cutting edge research projects that facilitates<br />
exchange of knowledge, acknowledges latest findings <strong>and</strong> stimulates innovative approaches.<br />
� Offering a platform for Malaysian researchers <strong>and</strong> professionals to pursue their learning <strong>and</strong><br />
research interests through the presentation of specific case studies that encourages interdisciplinary<br />
discourse <strong>and</strong> provides opportunity for recognising the connection between<br />
innovation <strong>and</strong> commercialisation.<br />
� Fostering a network for academicians, researchers, professionals <strong>and</strong> postgraduates through<br />
the formation of special interest groups in the field of building <strong>and</strong> infrastructure technology from<br />
Malaysia <strong>and</strong> overseas that enables research <strong>and</strong> education collaboration.
CONTENTS<br />
International <strong>Building</strong> & <strong>Infrastructure</strong> Technology Conference<br />
7-8 June 2011, Vistana Hotel, Penang, Malaysia<br />
Code Titles <strong>and</strong> authors Page<br />
T104<br />
T105<br />
T107<br />
T109<br />
T110<br />
T111<br />
T112<br />
T113<br />
T114<br />
T117<br />
T118<br />
T121<br />
T122<br />
T123<br />
T127<br />
T128<br />
T129<br />
T130<br />
T132<br />
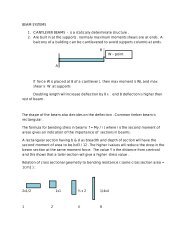
THE PERFORMANCE OF CONCRETE BEAMS REINFORCED WITH<br />
EMBEDDED CFRP PLATES<br />
R.B. Ohu, M.S. Jaafar, J. Noorzaie, F.N. Aznieta <strong>and</strong> A.H. Alwathaf<br />
TRAFFIC ACCIDENTS ANALYSIS IN LIBYA<br />
Hussin .A.M.Yahia <strong>and</strong> Amiruddin Ismail<br />
SEISMIC RISK ASSESSMENT OF BUILDINGS IN KOLLAM INDIA<br />
Narayanan Sambu Potty <strong>and</strong> Sirajuddin, M<br />
COMPUTER APPLICATION IN EARLY PHASE OF DESIGN OF INTELLIGENT<br />
BUILDINGS<br />
Sutapa Das <strong>and</strong> Abhijit Chaudhuri<br />
COMPRESSIVE STRESS-STRAIN RELATIONSHIP OF FOAMED CONCRETE<br />
AT ELEVATED TEMPERATURES<br />
Md Azree Othuman Mydin<br />
ASSESSING THE GREEN ROOF TECHNOLOGY IN GREEN BUILDING<br />
RATING SYSTEMS<br />
Lee Xia Sheng, Ati Rosemary Mohd Ariffin, Hazreena Hussein<br />
SUITABLE CRITERIA FOR THE LOCATION OF GATED COMMUNITY<br />
HOUSING<br />
Zurinah Binti Tahir, Khadijah Binti Hussin<br />
STRESS-STRAIN RELATIONSHIP FOR MASONRY MODELLING<br />
Ahmed Hasan Alwathaf, Mohd Saleh Jaafar, Waleed A. Thanoon, Jamaloddin<br />
Noorzaei<br />
THE NEEDS OF INDUSTRIALISED BUILDING SYSTEM IN MALAYSIA<br />
Muhamad Azani Yahya, Suriyadi Sojipto, Ahmad Shahrir Ismail<br />
A LITERATURE REVIEW ON THE STATE AND PRACTICE OF LCC IN<br />
MALAYSIA<br />
Mohd Fairullazi Ayob, Khairuddin Abdul Rashid<br />
SUSTAINABLE HOUSING USING AN INNOVATIVE MORTARLESS<br />
INTERLOCKING BLOCKWORK SYSTEM – THE EFFECT OF PALM OIL FLY<br />
ASH (POFA) AS AN AGGREGATE REPLACEMENT<br />
Nasly M.A, Abu Azam Md Yassin, Norhaiza Nordin, Khairunisa Abdullah, Noram Irwan<br />
Ramli<br />
CIVIL ENGINEERING AND ARCHITECTURAL BUILDING FEATURES<br />
DISPARITY AND PRESERVATION OF STRUCTURAL AND FABRICS<br />
INTEGRITY IN HERITAGE BUILDING: A REVIEW<br />
Siti Nor Fatimah Binti Zuraidi, Zainal Abidin Akasah, Mohammad Ashraf Abdul Rahman<br />
PROBLEMS OF CONSTRUCTION QUALITY IN SARAWAK, MALAYSIA<br />
Ibrahim, S. H., Baharun, A., Ayagi, K. M.<br />
AN INVESTIGATION INTO ABANDONED HOUSING PROJECTS IN<br />
SARAWAK, MALAYSIA<br />
Ibrahim, S. H., Baharun, A., Ayagi, K. M.<br />
RECYCLED COARSE AGGREGATES (RCA) AS NATURAL COARSE<br />
AGGREGATES REPLACEMENT IN CONCRETE DESIGN; THE BETTER<br />
ALTERNATIVE<br />
Kam Kenn Jhun, Mohd Zailan Sulieman, Roslan Talib<br />
MANAGING RISK CONSTRAINTS OF MULTIPLE DESIGN & BUILD PROJECTS<br />
S.P. Narayanan, Arazi B. Idrus, CT. Ramanathan<br />
FULLY UTILISATION OF FINE BOTTOM ASH AGGREGATE (FBAA) AS<br />
REPLACEMENT AGGREGATE IN CONCRETE BLOCK<br />
Mohd Syahrul Hisyam Mohd Sani, Fadhluhartini Muftah, Zulkifli Muda<br />
STRENGTH AND PERMEABILITY OF FIBRE REINFORCED POOR FINES<br />
HIGH STRENGTH CONCRETE<br />
Kwan Wai Hoe, Mahyuddin Ramli<br />
CHARACTERISATION OF HIGH CALCIUM WOOD ASH FOR USE AS<br />
MINERAL ADMIXTURE IN CONCRETE<br />
Cheah Chee Ban, Mahyuddin Ramli<br />
1<br />
7<br />
13<br />
20<br />
29<br />
38<br />
45<br />
52<br />
56<br />
65<br />
73<br />
82<br />
93<br />
101<br />
109<br />
115<br />
122<br />
133<br />
142
T133<br />
T134<br />
T135<br />
T137<br />
T139<br />
T140<br />
T145<br />
T146<br />
T147<br />
T148<br />
T149<br />
T150<br />
T151<br />
T152<br />
T155<br />
T158<br />
T159<br />
T163<br />
T164<br />
T166<br />
International <strong>Building</strong> & <strong>Infrastructure</strong> Technology Conference<br />
7-8 June 2011, Vistana Hotel, Penang, Malaysia<br />
ILLUMINATING INDOOR SPACES FOR THE WELL BEING OF OCCUPANTS<br />
USING INNOVATIVE ROOFING SYSTEM<br />
Hazril Sherney Basher, Abdul Malek Abdul Rahman<br />
THE PERFORMANCE OF THREE DIFFERENT SOLAR PANELS FOR SOLAR<br />
ELECTRICITY APPLYING SOLAR TRACKING TIMER DEVICE UNDER THE<br />
MALAYSIAN CLIMATE CONDITION<br />
Azhar Ghazali, M, Abdul Malek Abdul Rahman<br />
FINITE ELEMENT MODELLING OF RC BEAMS WITH LARGE OPENING AT<br />
CRITICAL FLEXURE AND SHEAR STRENGTHENED WITH CFRP LAMINATES<br />
Chin S.C, Shafiq N., Nuruddin M.F.<br />
PRELIMINARY STUDY ON STRUCTURAL BEHAVIOUR OF PRECAST<br />
LIGHTWEIGHT FOAMED CONCRETE SANDWICH PANEL<br />
N. Mohamad, A.A.A Samad, W. Adnan<br />
DISTRIBUTION OF LIVE LOAD ON SKEWED MULTICELL BOX-GIRDER<br />
BRIDGES UDER TRUCK LOADS<br />
Mohseni, Iman, Khalim A, R<br />
EXPERIMENTAL COMPARATIVE ANALYSIS OF SOLAR CHIMNEY HOUSE<br />
PERFORMANCE WITH ENERGY SAVING HOUSE AND GENERAL HOUSE IN<br />
THAILAND<br />
Jaran Ratanachotinun, Jongjit Hirunlabh, Nat Kasayapan<strong>and</strong>, Sopa Visitsak, Sombat<br />
Teekasap, Joseph Khedari<br />
THE POTENTIAL OF USING BOTTOM ASH (BA) ADDITIVES IN ROAD BASE<br />
Norazlan K., Norbaya S., Mohd Fadzil A.<br />
STATIC LOADING ON DEEP BEAMS WITH LARGE OPENING WITH AND<br />
WITHOUT CFRP SHEETS AT BENDING ZONE<br />
Preetpal Kaur a/p Ragbir Singh, Nasir Shafiq<br />
SUBURBAN NEIGHBORHOODS SATISFACTION TOWARDS CREATION HIGH<br />
QUALITY OF URBAN LIFE THROUGH NEW URBANISM<br />
Rozina Farajollahzdeh, Hasanuddin Lamit<br />
ASSESSMENTS OF GREEN BUILDING INDEX RATING FOR CONCRETE AND<br />
ITS EFFECTS ON GLOBAL WARMING<br />
Alonge O. Richard, Mahyuddin Ramli<br />
THE POTENTIALS OF URBAN WIND POWER IN MALAYSIA<br />
Hirda Lailani Khalid, Abdul Malek Abdul Rahman<br />
FACILITIES MANAGEMENT DECISION SUPPORT IN INTELLIGENT BUILDING<br />
TECHNOLOGIES: A STUDY IN KLANG VALLEY, MALAYSIA<br />
Mohamad Ridzuan Yahya<br />
A STUDY OF THE HEALTH AND SAFETY CIRCUMSTANCES OF SHOP<br />
APARTMENT AND APARTMENT BUILDINGS IN KLANG VALLEY, MALAYSIA<br />
Mohamad Ridzuan Yahya<br />
MAINTENANCE MANAGEMENT SYSTEM FOR INDUSTRIALIZED BUILDING<br />
SYSTEM<br />
Ng Ban Kiong, Zainal Abidin Akasah<br />
IMPLEMENTING LIFE CYCLE COSTING IN MALAYSIA CONSTRUCTION<br />
INDUSTRY: A REVIEW<br />
Nor Azizah Mohammed Rum, Zainal Abidin Akasah<br />
KEY FACTORS IN DEVELOPING MAINTENANCE CULTURE OF PUBLIC<br />
ASSET MANAGEMENT<br />
Suwaibatul Islamiah Abdullah Sani, Abdul Hakim Mohammed<br />
PERFORMANCE OF SAND-CEMENT BLOCK WITH KENAF (Hibiscus<br />
cannabunus L.) FIBER<br />
Aimi Munirah Jalilluddin, Kartini Kamaruddin<br />
DATA CENTER OPERATION OPTIMIZATION USING COMPUTATIONAL FLUID<br />
DYNAMICS (CFD)<br />
Rawnee Ho, M.R Ismail<br />
ROOM AIR DISTRIBUTION OPTIMIZATION<br />
Rawnee Ho, M.R Ismail<br />
PERFORMANCE OF SAND CEMENT BRICKS INCORPORATING KENAF<br />
POWDER AND RICE HUSK ASH<br />
Kartini, K., Ahmad Farhan, H., Nor Azlina, U.<br />
151<br />
158<br />
166<br />
175<br />
186<br />
193<br />
202<br />
209<br />
218<br />
222<br />
229<br />
237<br />
243<br />
252<br />
260<br />
269<br />
276<br />
283<br />
290<br />
297
T167<br />
T168<br />
T169<br />
T173<br />
T186<br />
T188<br />
T189<br />
T190<br />
T191<br />
T192<br />
T193<br />
T194<br />
T195<br />
T196<br />
T197<br />
T198<br />
T199<br />
T200<br />
T119<br />
TRANSPORTATION STRATEGIES FOR URBAN SUSTAINABLE<br />
DEVELOPMENT<br />
Mojtaba Zourbakhsh<br />
International <strong>Building</strong> & <strong>Infrastructure</strong> Technology Conference<br />
7-8 June 2011, Vistana Hotel, Penang, Malaysia<br />
GIS BASED STUDIES OF GEOTECHNICAL PROPERTIES FOR LAND<br />
DEVELOPMENT PLANNING AND DESIGN<br />
Wan Nur Syazwani W.M, A. Naser Abdul Ghani<br />
AN OVERVIEW ON INTEGRATING OF NON-MOTORIZED AND PUBLIC<br />
TRANSPORT IN URBAN ENVIRONMENT<br />
Bibie Sara Salleh, Riza Atiq Abdullah O.K Rahmat, Amiruddin Ismail<br />
A COMPARATIVE STUDY ON RC MULTI-STORIED BUILDING FRAMES<br />
DESIGN BETWEEN NON SWAY AND SWAY METHOD USING STAAD. PRO<br />
V8i SOFTWARE<br />
Noor Md. Sadiqul Hasan, Habibur Rahman Sobuz, Costas Ioannou, Md. Shiblee<br />
Sayed<br />
SUSTAINABLE CONCRETE FROM MALAYSIA’S INDUSTRIAL BY-PRODUCTS<br />
AND BIOGENIC WASTES<br />
M. R. Karim, M. F. M. Zain, M. Jamil, F.C. Lai, M. N. Islam<br />
THE STATE-OF-ART OF DECISION SUPPORT SYSTEM DEVELOPMENT:<br />
PROGRESS OF REQUIREMENT ENGINEERING IN CONSTRUCTION<br />
Mohd Faizal Omar, Bambang Trigunarsyah, Johnny Wong<br />
A REVIEW ON THERMAL PERFORMANCE OF ROOFING MATERIALS IN<br />
MALAYSIA<br />
Ahmad Al Yacouby, Mohd Faris Khamidi, Muhd Fadhil Nuruddin, Arazi Idrus, Syed<br />
Ahmad Farhan, Azrul Esf<strong>and</strong>y Razali<br />
ULTRA HIGH PERFORMANCE CONCRETE (UHPC) TECHNOLOGY FROM<br />
MATERIAL TO STRUCTURE: A REVIEW<br />
Behzad Nematollahi, Raizal Saifulnaz M.R., Yen Lei Voo<br />
RELATIONSHIP BETWEEN ROADSIDE DEVELOPMENTS AND ROAD<br />
TRAFFIC ACCIDENTS<br />
Intan Suhana Mohd Razelan, Adnan Zulkiple, Azlina Ismail<br />
THE ENGINEERING PERFORMANCE OF SUPERPLASTICIZED CONCRETE<br />
Noor Faisal Abas, Muhammad Naim Mahyuddin<br />
USE OF RAW CLAY OF LABU SAYONG AS A PARTIAL CEMENT<br />
REPLACEMENT IN CONCRETE: ENGINEERING PROPERTIES<br />
Zulazril bin Idris, Noor Faisal bin Abas<br />
A REVIEW ON MECHANICAL AND THERMAL PROPERTIES OF<br />
LIGHTWEIGHT FOAMED CONCRETE AT AMBIENT TEMPERATURE<br />
Md Azree Othuman Mydin, Hanizam Awang<br />
DEFECT MANAGEMENT FOR THE HIGH RISE OFFICE TOWER<br />
Idris Othman, Nadia Azman<br />
ESTABLISHMENT AND DEVELOPMENT OF IBS IN MALAYSIA<br />
Mohammad Abedi, Mohamad Syazli Fathi, Abdul Karim Mirasa<br />
PROPERTIES OF GYPSUM PLASTERBOARDS AT ELEVATED TEMPERATURES<br />
Hanizam Awang, Md Azree Othuman Mydin<br />
INVESTIGATING THE STRENGTH OF SELF COMPACTING CONCRETE<br />
INCORPORATING LOW AND MODERATE VOLUME CEMENT REPLACEMENT<br />
USING RAW RICE HUSK ASH<br />
Md Nor Atan, Hanizam Awang<br />
PROBLEMS OF PRIVATE RESIDENTIAL PROPERTY DEVELOPMENT IN<br />
MAKAMA JAHUN NEIGHBOURHOOD OF BAUCHI METROPOLIS, NIGERIA<br />
Aliyu Ahmad Aliyu, Rozilah Kasim, David Martin<br />
������������������������������������<br />
FLOORING<br />
Md Azree Othuman Mydin<br />
INNOVATIVE SEISMIC BASE ISOLATION TECHNIQUE<br />
Shivam R. Mishra, Sameer S. Dhuri<br />
306<br />
312<br />
319<br />
328<br />
337<br />
342<br />
351<br />
359<br />
367<br />
373<br />
383<br />
388<br />
396<br />
405<br />
413<br />
420<br />
428<br />
439<br />
445
T104<br />
1<br />
International <strong>Building</strong> & <strong>Infrastructure</strong> Technology Conference<br />
7-8 June 2011, Vistana Hotel, Penang, Malaysia<br />
THE PERFORMANCE OF CONCRETE BEAMS REINFORCED WITH<br />
EMBEDDED CFRP PLATES<br />
R.B. Ohu 1 , M.S. Jaafar 2 , J. Noorzaie 3 , F. N. Aznieta 4 <strong>and</strong> A.H. Alwathaf 5<br />
1,2,3,4 Civil Engineering Department, Universiti Putra Malaysia, Serdang, 43400, Malaysia<br />
5 Civil Engineering Department, Faculty of Engineering, Sana’a University, P.O. Box<br />
12544, Sana’a, Yemen<br />
1 budan60@yahoo.com<br />
ABSTRACT: FRP plates are known to be traditionally used for strengthening or retrofitting of<br />
structural elements, however it is proposed herein that treated FRP plates in place of FRP grids or<br />
even FRP bars could be a useful alternative technique in reinforcing structural elements with the<br />
added advantage of further reducing the overall weight of the structure together with its non-corrosive<br />
benefits. This proposed technique could also be adapted for use in section enlargement of beams.<br />
The present work is carried out to study the performance of this proposed technique <strong>and</strong> it showed<br />
good performance results in terms of ductility performance similar to conventional reinforced concrete<br />
with an increase in ultimate load capacity of more than 100% in comparison to conventional reinforced<br />
concrete beams.<br />
Keywords: embedded, carbon fiber reinforced polymer plates, performance, failure mode,<br />
surface treatment<br />
1. INTRODUCTION<br />
The traditional use of fiber reinforced polymer plates/strips has been in the strengthening/retrofitting of<br />
concrete structures. There already exists a wide range of research articles that have looked into the<br />
behavior of fiber reinforced polymer plates/strips as externally bonded reinforcement <strong>and</strong> more<br />
recently as near surface mounted reinforcements [Chen et al., Hassan et al., Teng et al., Benjeddou et<br />
al., De Lorenzis <strong>and</strong> Teng, Mazzotti et al.]. One of the major conclusions <strong>and</strong> detriments from these<br />
research findings has been about the premature de-bonding of the plates from the concrete surface<br />
with an associated brittle mode of failure [Ritchie et al., Rahimi <strong>and</strong> Hutchinson]. This premature debonding<br />
occurs due to the inadequate bond between the FRP plate <strong>and</strong> the concrete. Rasheed et al.<br />
recently made a successful attempt to improve this by using transverse anchoring reinforcement to<br />
control this premature de-bonding. The result was a more ductile behavior due to the transverse<br />
strengthening <strong>and</strong> concrete confinement effects. In order to further eliminate or reduce the risk of<br />
premature de-bonding <strong>and</strong> to better improve on the bond between the FRP plate <strong>and</strong> the concrete<br />
leading to a more ductile structural response, a new reinforcing technique is herein proposed wherein<br />
CFRP plates are embedded within the concrete section. This proposed reinforcing technique is an<br />
adaptation which stems from the existing externally bonded reinforcements <strong>and</strong> the near-surface<br />
mounted methods with the aim of improving on the use of FRP plates in construction while<br />
simultaneously taking advantage of its most beneficial properties in terms of strength, weight,<br />
corrosion resistance <strong>and</strong> ease of application.<br />
The proposed technique could serve dual purposes as both a reinforced concrete design concept or in<br />
the repair of structures (such as section enlargement). The proposed technique also has the<br />
advantage of further reducing congestion of reinforcement in a section as well as reducing the overall<br />
cost of reinforcement which will be gained in the long term due to reduced maintenance costs.
2<br />
International <strong>Building</strong> & <strong>Infrastructure</strong> Technology Conference<br />
7-8 June 2011, Vistana Hotel, Penang, Malaysia<br />
2. EXPERIMENTAL PROGRAM<br />
Five small beams of length 750mm <strong>and</strong> cross-section 150 x 150mm were cast, cured <strong>and</strong> tested under<br />
a two point load as shown in Figure 1(a). The beams had an average concrete strength of 40MPa <strong>and</strong><br />
were reinforced as shown in Figure 1. All beams were simply supported <strong>and</strong> loaded with specific<br />
incremental loads until failure. Beams denoted by RC (steel reinforced concrete beam) <strong>and</strong> EBR<br />
(externally bonded reinforced concrete) served as control specimens <strong>and</strong> were each reinforced with<br />
4no.s 6mmØ mild steel rebar’s with fy = 250N/mm 2 . Three other beams were internally reinforced by<br />
embedding CFRP plates within the stirrups as shown in Figure 1(b). These beams were given<br />
denotations based on the treatment provided on each embedded CFRP plate which consisted of beam<br />
NE (No Epoxy), BE (Bottom Epoxy) <strong>and</strong> TE (Top Epoxy). 6mmØ mild steel stirrups (fy = 250N/mm 2 )<br />
placed at 100 centres were used for all beam specimens.<br />
The CFRP plate used for all the beams except the control beam RC were 100mm wide with a<br />
thickness of 1.2mm <strong>and</strong> a cross-sectional area of 120mm 2 . The E-modulus is 165,000N/mm 2 <strong>and</strong> the<br />
tensile strength is 2800N/mm 2 according to tests done by the manufacturer (Sika Kimia Sdn. Bhd.<br />
Malaysia). The lengths of the CFRP plates used for the embedded beams were 720mm while the<br />
length for the EBR was 400mm according to design procedures (ACI 440).<br />
15.0<br />
2�6mm<br />
��mm stirrups<br />
15.0<br />
5.0<br />
Beam RC<br />
(Steel Reinforced)<br />
Strain gauge<br />
LVDT<br />
Beam NE<br />
(No epoxy<br />
treatment)<br />
All dimensions in cm except where specified<br />
2.1 Embedded CFRP beams<br />
1.0<br />
65.0<br />
75.0<br />
CFRP plate<br />
P<br />
(a)<br />
epoxy treatment<br />
layer<br />
Beam BE<br />
(Bottom epoxy<br />
treatment)<br />
(b)<br />
Beam TE<br />
(Top epoxy<br />
treatment)<br />
CFRP plate for EBR beam only<br />
5.0<br />
epoxy treatment layer<br />
Tensile steel OR<br />
tensile CFRP plate<br />
CFRP plate<br />
2.0<br />
Beam EBR<br />
(Externally bonded<br />
reinforcment)<br />
Figure1. a) Test setup; b) Reinforcement details<br />
In order to increase the roughness of the plate surface <strong>and</strong> hence enhance the bond between the<br />
concrete <strong>and</strong> the FRP plate, a thin layer of epoxy was applied to one side surface as depicted in<br />
Figure 1(b). In beam BE the side face with epoxy treatment was placed downwards towards the<br />
concrete cover while in beam TE the epoxy treated face was placed upwards in the section of the<br />
beam. Beam NE had no plate surface treatment. After treatment, the CFRP plate was placed within<br />
the reinforcement cage after which casting of the concrete was carried out in three batches followed<br />
by proper vibration. All beams were cured for 28days before testing. Beam EBR was externally<br />
reinforced (using epoxy) with a CFRP plate after curing of the beam was completed according to the<br />
manufacturer’s specifications (Sika Kimia Sdn. Bhd. Malaysia) before testing. The instrumentation<br />
included strain gages placed at the mid-span for all beams <strong>and</strong> one LVDT connected to the TDS-530<br />
data logger. Incremental load was applied by using a manual hydraulic machine. Observations made<br />
on all beams included deflections, concrete strains, cracking loads, crack patterns, ultimate loads <strong>and</strong><br />
failure mechanisms. All beams were loaded until failure.
3. RESULTS AND DISCUSSIONS<br />
3<br />
International <strong>Building</strong> & <strong>Infrastructure</strong> Technology Conference<br />
7-8 June 2011, Vistana Hotel, Penang, Malaysia<br />
3.1 Load-Deflection Response<br />
The load-deflection curves for all beams are shown in Figure 2 (a) <strong>and</strong> (b). In Figure 2(a), it was<br />
observed that both beams RC <strong>and</strong> NE had similar load-deflection responses throughout the loading<br />
process. Both beams initially had steep slopes which correspond to the uncracked section of the<br />
beams wherein deflection is proportional to the load applied. It can however be seen that beam NE<br />
exhibited a relatively steeper slope than beam RC at this initial elastic stage with a corresponding<br />
delay in cracking as shown in Figure 2(a). This response of beam NE is attributed to the higher tensile<br />
properties of the CFRP plate over the steel rebar. After cracking <strong>and</strong> further load application the<br />
difference in stiffness between beam NE <strong>and</strong> RC was about 18% (the stiffness here refers to the load<br />
per unit deflection). A similar pattern of behavior was also observed between beams RC <strong>and</strong> NE<br />
mainly due to the untreated CFRP plate which led to the bond between the concrete <strong>and</strong> the plate<br />
being due to frictional forces only, which is similar to the conventional yielding of mild steel used in<br />
beam RC. This is unlike the bond being due to both frictional forces <strong>and</strong> mechanical interlock of<br />
grooved surfaces as is already established for high yield steel. However as beam NE approached<br />
failure, the beam deflection also increased significantly <strong>and</strong> at failure the difference between beam RC<br />
<strong>and</strong> NE was merely 8%. This behavior is thus similar to the load-deflection response of beams<br />
reinforced with CFRP bars (Rafi et al. 2008; Benmokrane et al. 1996; Nanni 1993) wherein a reduced<br />
stiffness behavior was observed in comparison to beams reinforced with conventional steel mainly due<br />
to the lower elastic modulus of the CFRP bar/plate as the case may be.<br />
In Figure 2(b) all beams behaved in a similar fashion before cracking becomes wider <strong>and</strong> slipping of<br />
the plate or yielding of the steel occurs. This can be observed by the initial linear slope of the loaddeflection<br />
graph. After cracking, the next part of the beams response gives an insight as to the quality<br />
of bond that exists. In this segment the rate of increase in deflection rapidly increases with a<br />
corresponding decrease in beam stiffness. As expected beam EBR exhibited a predominantly linear<br />
response unlike the other beams. The load-deflection behavior of beam EBR did not show the same<br />
ductile trend as seen in the other beams.<br />
LOAD(kN)<br />
50<br />
40<br />
30<br />
20<br />
10<br />
0<br />
Slipping of plate<br />
5kN Initial<br />
cracking point<br />
Yielding of steel<br />
0 2 4 6 8 10<br />
DEFLECTION(mm)<br />
(a) Beams RC <strong>and</strong> NE<br />
NE<br />
RC
LOAD(kN)<br />
120<br />
100<br />
80<br />
60<br />
40<br />
20<br />
0<br />
EBR<br />
NE<br />
4<br />
RC<br />
International <strong>Building</strong> & <strong>Infrastructure</strong> Technology Conference<br />
7-8 June 2011, Vistana Hotel, Penang, Malaysia<br />
0 2 4 6 8 10 12 14 16 18<br />
DEFLECTION(mm)<br />
Figure 2. Mid-span deflections<br />
The treatment of the plate with epoxy in beams BE <strong>and</strong> TE resulted in a higher stiffness performance<br />
after cracking as shown in Figure 5. From the same figure it can be seen that the load-deflection curve<br />
for beam EBR is predominantly linear until failure in comparison to all the other beams especially the<br />
beams with embedded CFRP plates which exhibited a more ductile trend similar to beam RC. At the<br />
failure load of beam NE, beams BE, TE recorded higher deflection values of 73%, 81% more than NE<br />
respectively. This could be attributed to the treatment of the plates in beams BE <strong>and</strong> TE which thus<br />
increased the bond between the plate <strong>and</strong> concrete thereby leading to a satisfactory load-deflection<br />
response <strong>and</strong> thus improved ductility from the start of the loading process until cracking occurred.<br />
However, beam TE showed a slightly stiffer response compared to beam BE at service mainly due to<br />
the position of the treated face of the plate which resulted in further increased bond characteristics due<br />
to higher effective depth by bond. Epoxy at the top of the plate ensured that there was an increased<br />
distribution of stresses on the plate together with increased bonding mechanism between the plate<br />
<strong>and</strong> concrete thereby leading to higher load-deflection response in comparison to the other beams<br />
except beam EBR.<br />
3.2 Cracking <strong>and</strong> Ultimate loads<br />
The cracking loads used herein refer to the load at which the first cracks become visible <strong>and</strong> wider<br />
during the loading process <strong>and</strong> is shown for all tested beams in Table 1. From the results, the beams<br />
with embedded CFRP plates; NE, BE <strong>and</strong> TE all showed an increase in cracking loads of 50%, 13%<br />
<strong>and</strong> 50% respectively in comparison to beam RC. This indicates that beams with embedded CFRP<br />
exhibited a good performance in terms of delaying the onset of cracking to higher loads than for<br />
beams reinforced with steel.<br />
Beam<br />
*Pcr<br />
(kN)<br />
Pu<br />
(kN)<br />
Table 1. Cracking, Ultimate loads <strong>and</strong> failure modes<br />
∆ at Pu<br />
(mm)<br />
(b) All Beams<br />
∆ at initiation of<br />
yielding/slipping<br />
(mm)<br />
∆ at service<br />
(mm)<br />
At 35% Pu<br />
BE<br />
TE<br />
Failure modes<br />
R.C 24 36 8.54 1.59 0.17 Flexural failure<br />
N.E 36 46 7.84 1.28 0.15<br />
Flexural failure associated with<br />
plate slip<br />
B.E 27 57 14.13 3.13 0.30 Flexural Shear failure<br />
T.E 36 97 15.73 3.04 1.12 Shear failure<br />
EBR 57 100 2.43 1.90 0.65<br />
Shear failure associated with<br />
plate debonding<br />
*Refers to the first visible wide crack
5<br />
International <strong>Building</strong> & <strong>Infrastructure</strong> Technology Conference<br />
7-8 June 2011, Vistana Hotel, Penang, Malaysia<br />
The crack patterns for all test specimens are shown in Figure 3. The patterns of beams RC <strong>and</strong> NE<br />
mainly consisted of flexural cracks originating from the tension face of the beam at mid-span within the<br />
maximum moment region. These cracks propagated upwards towards the compression zone of the<br />
beam. In addition to the flexural cracks, beams BE <strong>and</strong> TE also exhibited shear crack patterns as the<br />
load increased. In both beams these shear cracks were not only diagonal formations but also<br />
consisted of large diagonal shear cracks along the path line of the embedded CFRP plate. As the load<br />
increased, the flexural <strong>and</strong> shear cracks increased in width <strong>and</strong> depth forming a definite path<br />
eventually leading to failure of the beam.<br />
EB<br />
Figure 3. Crack pattern for all test specimens<br />
After the initial flexural cracks in beam TE, it was observed that after about 46kN shear cracks began<br />
to form <strong>and</strong> at about 70% (68kN) the failure load of beam TE a large diagonal shear crack formed<br />
which grew very wide as the failure of the beam approached. In comparison to the other beams except<br />
EBR, it was observed that the crack propagation for beam TE was much slower. It was further<br />
observed that both beams TE <strong>and</strong> EBR exhibited similar crack patterns of both flexural <strong>and</strong> shear<br />
cracks throughout the loading process until failure. This therefore gives an indication of the bond<br />
quality between the treated embedded plate <strong>and</strong> the surrounding concrete.<br />
Results of the ultimate loads shown in Table 1 show that the beams with treated CFRP plates; BE <strong>and</strong><br />
TE performed better than the beam with the untreated CFRP plate NE <strong>and</strong> were therefore capable of<br />
attaining higher ultimate load capacities. Beam TE showed an increase in ultimate load capacity of<br />
70% more than BE <strong>and</strong> 110% more than NE. The difference in ultimate load capacities between the<br />
beams with embedded CFRP plates could be attributed to the location of the treatment. As long as<br />
there is adequate bond action this technique has the potential to attain higher ultimate load capacities.<br />
Also considering this technique from the surface area point of view, it is good to mention that the<br />
embedded CFRP plates which have a wider surface area <strong>and</strong> thereby increased contact with the<br />
surrounding concrete led to the high ultimate loads observed.<br />
4. CONCLUSIONS<br />
The following conclusions can be drawn based on this study;<br />
1. The ductility trend of beams with embedded CFRP plates without treatment is similar to steel<br />
reinforced concrete beams but with an increase in ultimate load of 28% more than steel reinforced<br />
concrete beams. Although beams with treated embedded CFRP plates showed improved bond<br />
characteristics resulting in higher ultimate loads, they however, exhibited reduced stiffness properties<br />
with an average difference of 68% at service condition in comparison to the beam without plate<br />
treatment.
6<br />
International <strong>Building</strong> & <strong>Infrastructure</strong> Technology Conference<br />
7-8 June 2011, Vistana Hotel, Penang, Malaysia<br />
2. The use of embedded CFRP plates shows improved performance over plain RC beams however, if<br />
the plate is untreated then premature slip of the plate occurs resulting in early failure of the beam<br />
unlike beams that were treated with epoxy. This is because the bond that occurs is mainly due to<br />
frictional forces. Therefore the treatment of the embedded CFRP plates helps to improve the bond<br />
characteristics <strong>and</strong> thereby result in higher ultimate load capacities of up to 24% <strong>and</strong> 110%<br />
respectively in comparison to untreated embedded CFRP plates.<br />
3. The improved performance shown in beam TE over beam BE could be attributed to the location of<br />
the treated surface area. In beam TE, the treated surface is within the effective concrete area of the<br />
section which therefore led to a better overall performance. While in beam BE the treated surface was<br />
in the weak tensile concrete area further weakened due to cracking of the section thereby resulting in<br />
a faster initiation of slip <strong>and</strong> hence failure in comparison to beam TE. At failure, the difference in<br />
deflection between both beams was on the average about 10% with BE being less than beam TE.<br />
4. Flexural-shear mode type of failure was observed in the beams with embedded CFRP plates<br />
treated with epoxy associated with crushing of the concrete in compression. The shear failure mode<br />
was however more predominant in beam TE <strong>and</strong> led to the failure of the beam <strong>and</strong> plate rupture.<br />
5. Similar to using FRP rebars, the use of FRP plates resulted in concrete crushing in compression at<br />
beam failure especially when the FRP plate is treated to increase the surface roughness which is<br />
similar to results of studies carried out by other researchers [Rafi et al.].<br />
REFERENCES<br />
Chen, J.F., Teng, J.G. (2003). Shear capacity of FRP-strengthened RC beams:FRP<br />
debonding. Construction <strong>and</strong> <strong>Building</strong> Materials Journal; Vol. (17), pp 15-26.<br />
Hassan T., Rizkalla S. (2003). Investigation of Bond in Concrete Structures Strengthened with Near<br />
Surface Mounted Carbon Fiber Reinforced Polymer Strips. Journal of Composites for<br />
Construction; ASCE, pp 248-257.<br />
Teng J.G., De Lorenzis L., Wang B., Li R., Wong T. N., Lam L. (2006). Debonding Failures of RC<br />
Beams Strengthened with Near Surface Mounted CFRP Strips. Journal of Composites for<br />
Construction; ASCE, pp 92-105.<br />
Benjeddou, O., Ouezdou M.B., Bedday, A. (2007). Damaged RC beams repaired by bonding CFRP<br />
laminates. Construction <strong>and</strong> <strong>Building</strong> Materials Journal; (21), pp 1301-1310.<br />
De Lorenzis L., Teng J.G. (2007). Near-surface mounted FRP reinforcement: An emerging technique<br />
for strengthening of structures. Composites: Part B; 38, pp.119-143.<br />
Mazzotti, C., Savoia, M., Ferracuti, B. (2008). An experimental study on delamination of FRP plates<br />
bonded to concrete. Construction <strong>and</strong> <strong>Building</strong> Materials Journal 2008; (22)7, pp 1409-1421.<br />
Ritchie, P., Thomas, D., Lu, L., Connelly, G. (1991). External reinforcement of concrete beams using<br />
fiber reinforced plastics. ACI Structural Journal; 88(4):pp 490-499.<br />
Rahimi, H., Hutchinson, A. (2001). Concrete beams strengthened externally bonded FRP plates.<br />
Journal of Composites Construction 2001; 5(1):44-56.<br />
Rasheed, H.A., Harrison, R.R., Peterman, R.J., <strong>and</strong> Alkhrdaji, T. (2010). Ductile strengthening using<br />
externally bonded <strong>and</strong> near surface mounted composite systems. Journal of Composite Structures,;<br />
(92), pp 2379-2390.<br />
Rafi, M.M., Nadjai, A., Ali, F., <strong>and</strong> Talamona, D. (2008). Aspects of behavior of CFRP reinforced<br />
concrete beams in bending. Construction <strong>and</strong> <strong>Building</strong> Materials, 22, pp 277-285.<br />
Reported by ACI Committee. Guide for the Design <strong>and</strong> Construction of Externally Bonded FRP<br />
<strong>Systems</strong> for Strengthening Concrete Structures. July, 2008.<br />
Sika Kimia Sdn. Bhd. Malaysia. http://www.sika.com.my/
T105<br />
TRAFFIC ACCIDENTS ANALYSIS IN LIBYA<br />
Hussin A.M. Yahia 1 <strong>and</strong> Amiruddin Ismail 2<br />
7<br />
International <strong>Building</strong> & <strong>Infrastructure</strong> Technology Conference<br />
7-8 June 2011, Vistana Hotel, Penang, Malaysia<br />
1, 2 <strong>Sustainable</strong> Urban Transport Research Center (SUTRA), Department of Civil <strong>and</strong><br />
Structural Engineering, Faculty of Engineering <strong>and</strong> Built Environment, Universiti<br />
Kebangsaan Malaysia, 43600 UKM Bangi, Selangor D.E., Malaysia<br />
1 Husseinukm@yahoo.com , 2 abim@eng.ukm.my<br />
ABSTRACT: Road traffic accidents is one of the most important problems facing developing<br />
countries, More than 1.2 million people die around the world in traffic accidents, <strong>and</strong> between 20 to 50<br />
million people are injured each year around the world, In the World Health Organization report issued<br />
in 2008, revealed that 50 thous<strong>and</strong> people died in Libya On public roads during the period 1969 -<br />
2009, the population in of Libya 5.125 million (Statistics 2000) <strong>and</strong> area 1,760,000 square kilometres.<br />
Libya suffers from concentration of population in major cities, <strong>and</strong> this in turn led to congestion <strong>and</strong><br />
the number increase of accidents inside the cities. The purpose of this study is the analysis of road<br />
accidents in 6 major cities recorded the highest proportion of accidents in recent years <strong>and</strong> knowledge<br />
of the most important factors <strong>and</strong> solutions that can reduce from traffic accidents.<br />
Keywords: road accidents, population.<br />
1. INTRODUCTION<br />
Human societies began long ago in the payment of tax advances that seeks to running fast behind him<br />
driving her self in the direction of all the forces of its economic or social <strong>and</strong> among the most what you<br />
pay these communities after by the so-called effects of traffic accidents <strong>and</strong> their implications for<br />
psychological, social <strong>and</strong> economic community, <strong>and</strong> Libyan society <strong>and</strong> one of the communities taking<br />
into growth <strong>and</strong> progress since the discovery of oil by as the number of motor vehicles used in Libya<br />
of about 18 thous<strong>and</strong> a vehicles in 1960 to about 101 thous<strong>and</strong> vehicles in 1970, then increased to<br />
about 265 thous<strong>and</strong> vehicles in 1975. In 2008 about 1524429 cars, it was a result of this massive<br />
increase in motor vehicles is the high rates of traffic accidents <strong>and</strong> increase the cost of these incidents,<br />
humanitarian, economic <strong>and</strong> resulted in many social problems, which include the surviving spouse's<br />
families <strong>and</strong> children lost their parents. The Road Statistics Review of Libya M. O. I. (1996) we find<br />
that the proportion of deaths of young people was caused by traffic accidents , <strong>and</strong> road traffic<br />
accidents in Libya is considered high if you compare with another countries , In ( 1990), the<br />
population was 3,821 million <strong>and</strong> number of accidents 7,847, in ( 2000) the population was 5,125<br />
million <strong>and</strong> number of accidents was 10,667 , Increased incidents in recent years was in (2008)<br />
18662 accident. Fatal accidents represent not only tragic family losses but also serious economic<br />
losses to the community in respect of their education <strong>and</strong> training. Property damage from traffic<br />
accidents cost the Libyan economy 8 million $ (10 million LD) annually (Road Accident Statistics,<br />
Libya, 2001). It is not only mortality that has to be considered, but also the temporary <strong>and</strong> permanent<br />
incapacity resulting from road traffic accidents. In addition to the pain <strong>and</strong> suffering caused <strong>and</strong> the<br />
tragedy of death or permanent disability, serious economic losses to the community arise from road<br />
traffic accidents.<br />
2. THE ARE OF STUDY<br />
Libya is an Arab country, located in the North Africa continent <strong>and</strong> in the south coast of the<br />
Mediterranean Sea. It is bounded by the Egypt on the east, Sudan on the southeast, Chad on the<br />
south, Niger on the south-west, Algeria on the west <strong>and</strong> Tunisia on the north-west. In this study, we<br />
chose 6 major cities in terms of congestion, the area, population's density <strong>and</strong> the proportion of<br />
accidents are Tripoli, Benghazi, Sirt, Al margheb, Al joufra <strong>and</strong> Misurata.
Figure 1. The location of states in Libyan.<br />
8<br />
International <strong>Building</strong> & <strong>Infrastructure</strong> Technology Conference<br />
7-8 June 2011, Vistana Hotel, Penang, Malaysia<br />
3. MATERIALS AND METHODS<br />
The motor vehicle accidents statistics used in this study were taken from General Administration of<br />
Traffic, The General People's Committee of General Security <strong>and</strong> from Yearly Statistical Report <strong>and</strong><br />
the Annual Reports of the Directorate of Traffic (Directorate of Traffic Annual Reports 1990 to 2000),<br />
the study was based on the collection of data about all fatal motor vehicle accidents that occurred In<br />
all Libyan cities during the period 1 January 1970 to 31 December 2005 <strong>and</strong> we in this study will<br />
focus on the 6 major cities, Tripoli, Benghazi, Sirt, Al margheb, Al joufr <strong>and</strong> Misurata , <strong>and</strong> also the<br />
annual statistical report contains information such as the number of registered vehicles, number <strong>and</strong><br />
nature of accidents, causes of road accidents, number of fatalities <strong>and</strong> casualties, age <strong>and</strong> gender of<br />
victims. Additional data were obtained from various sources, including the Ministry of Health, Health<br />
Statistics Annual Report for the period 1990 to 2008 (Ministry of Health Annual Reports 1990 <strong>and</strong><br />
2000) .<br />
4. ROAD TRAFFIC ACCIDENTS IN LIBYA<br />
Traffic accidents increased dramatically in Libya <strong>and</strong> the deaths will reach 25 cases per day in the<br />
coming years if there is no real measures as duplication , separate roads ,the <strong>and</strong> providing the<br />
means for road safety ,lighting control on the quality of vehicles <strong>and</strong> the introduction of high import for<br />
Cars from the European countries <strong>and</strong> Asian ,<strong>and</strong> the application of traffic law strictly , <strong>and</strong> the total<br />
number of traffic accidents <strong>and</strong> injuries <strong>and</strong> the victims is increasing continuously as show in figure (2).<br />
World Health Organization (WHO) 2008 has stated that one of the most serious losses of people lives<br />
in Libya comes from car <strong>and</strong> road accidents. Statistics have shown a very clear increase in road<br />
deaths number, Injuries <strong>and</strong> the accidents during the last ten years. There is also a decline in the<br />
number of injuries, accidents <strong>and</strong> the death during the years 1992-1999. This decline can be explained<br />
by the slowdown in traffic volumes throughout the cities streets in Libya as a result of UN embargo to<br />
Libya <strong>and</strong> the relative economic recession which took place during these particular years.
5. RESULTS<br />
Table 1. The latest vehicles statistic until 2009<br />
9<br />
International <strong>Building</strong> & <strong>Infrastructure</strong> Technology Conference<br />
7-8 June 2011, Vistana Hotel, Penang, Malaysia<br />
Type of Vehical 2005 2006 2007 2008 2009<br />
Motorcycles 559 660 784 873 1040<br />
Private car 957226 1106894 1343422 1525429 1703362<br />
Truck 253674 289718 345099 367824 398080<br />
Public taxi 54307 61360 72827 77320 80967<br />
Trailer truck 21617 24288 30874 36790 44786<br />
Traction lorry 11848 13193 17204 24334 32838<br />
Tractor 2072 2165 2723 2983 25144<br />
Winches <strong>and</strong> automobiles 9227 10081 13600 17126 25144<br />
Total 1310530 1508359 1826533 2052679 2289763<br />
Course: General Administration of Traffic <strong>and</strong> Authorizations (GATA)<br />
Figure 2. Traffic accidents (1970-2005)<br />
Figure 3. Traffic accidents in 2009
Figure 4. Percentage of population total<br />
10<br />
International <strong>Building</strong> & <strong>Infrastructure</strong> Technology Conference<br />
7-8 June 2011, Vistana Hotel, Penang, Malaysia<br />
Figure 5. The relationship between the number of accidents <strong>and</strong> deaths<br />
Table 2. Distribution of Libya <strong>and</strong> the total population - area (km2) population density<br />
States<br />
Area<br />
Km2<br />
%<br />
Libyan of population<br />
Populatio<br />
Populatio<br />
%<br />
n<br />
n Density<br />
Gr<strong>and</strong> Total<br />
Populatio<br />
%<br />
n<br />
Populatio<br />
n Density<br />
Benghazi 11372 0.86 622148 11.74 54.71 674951 11.93 95.35<br />
Misurata 29172 1.74 511628 9.66 17.54 543129 9.60 18.62<br />
Tripoli 835 0.05 997065 18.82 1194.09 1063571 18.80 1273.74<br />
Almargheb 6796 0.41 410187 7.74 60.36 427886 7.56 62.96<br />
Sirt 86399 5.15 131786 2.94 1.53 141495 2.50 1.64<br />
Aljoufra 2666 0.16 422999 7.98 158.66 451175 7.97 169.23<br />
Figure 6. The relationship between of % of area <strong>and</strong> % of population
11<br />
International <strong>Building</strong> & <strong>Infrastructure</strong> Technology Conference<br />
7-8 June 2011, Vistana Hotel, Penang, Malaysia<br />
Traffic accidents types of in libya<br />
According to statistics, <strong>and</strong> reports of traffic accidents in Libya, Car accidents are classified into 6<br />
classes, vehicle – vehicle, vehicle-fixed object, vehicle – pedestrian, overturning - vehicle, out-ofcontrol,<br />
<strong>and</strong> other types of accidents<br />
Causes of traffic accidents in libya:<br />
The causes of traffic accidents in Libya can be divided into specific <strong>and</strong> general causes:<br />
A. General causes<br />
a. A large increase in the number of vehicles <strong>and</strong> population in major cities <strong>and</strong> expansion of road<br />
networks within <strong>and</strong> between far cities.<br />
b. National development projects which require the development of supporting transport systems<br />
in major cities in Libya for example (Tripoli, Benghazi).<br />
c. Increased number of expatriates from different countries with different habits <strong>and</strong> culture who<br />
are unfamiliar with local driving.<br />
d. Concentration of population in major cities in turn led to the overcrowding <strong>and</strong> increase in<br />
accidents number.<br />
B. Specific causes<br />
a. Most accidents occurred as a result of driver negligence <strong>and</strong> error.<br />
b. Over 50% of the traffic accidents are due to excess speed <strong>and</strong> using mobile phones during<br />
driving <strong>and</strong> violation of signals at intersections.<br />
c. Road safety <strong>and</strong> vehicle condition contribute in reducing from traffic accidents, particularly those<br />
on open roads.<br />
Therefore errors <strong>and</strong> negligence of drivers contribute significantly to traffic accidents throughout Libya.<br />
6. DISCUSSIONS<br />
Figure 8., Causes of traffic accidents in Libya<br />
Road traffic accidents are one of the leading causes of death in Libya , a review of traffic accident<br />
<strong>and</strong> their resulting casualties in Libya between 1970<strong>and</strong> 2005 <strong>and</strong> review of police records, we find<br />
that traffic accidents have increased dramatically, as show figure (2), we find that the population<br />
increases progressively with the passage of years, but traffic accidents registered an increase in the<br />
mid-seventies <strong>and</strong> then declined because of the economic embargo on Libya by the United Nations<br />
(1992-2002) , After the lifting of economic blockade increased the number of cars as well as the<br />
number of incidents <strong>and</strong> recorded in 2008, 13352 incident <strong>and</strong> 2332 death ( Statistics 2009 ) ,<br />
Injuries <strong>and</strong> the number of incidents grow quickly <strong>and</strong> increase in the number of cars contributed to the<br />
increase in the number of accidents ,the increase in population <strong>and</strong> all the way also led to an increase<br />
in the number of usage of vehicles on the road have reached in 2006 to 1310530 vehicles while the<br />
population was 5212000 million. The ratio of vehicles to population is 3.97 people per vehicle. In table(<br />
2) , If we show at Figure (1) we find that all the cities that took place in the study are located on the<br />
Sea beach , as a result of the more populous cities are located on the sea beach where the weather<br />
is moderate , from through statistics, we find the city Tripoli is the least in terms of area 835 km2, but<br />
it is more in terms of population <strong>and</strong> density of population, population density rate 1273.74 persons in<br />
km2 ,while the city of Sirt , the most area between the cities of the six is area 86399 km2 <strong>and</strong> least
12<br />
International <strong>Building</strong> & <strong>Infrastructure</strong> Technology Conference<br />
7-8 June 2011, Vistana Hotel, Penang, Malaysia<br />
population density 1.64 persons in km2 , city following the Tripoli city , in terms of population density is<br />
Aljoufra because the Aljoufra is an extension to the city of Tripoli , this diversity in the distribution of<br />
the population on the coastal cities has helped to increase vehicles on the coastal road (Amsaad ,Ras<br />
Igdir) , in order to focus density residential areas on the coastal cities. Libya as well as space for large<br />
<strong>and</strong> long distances between cities <strong>and</strong> in the absence of good public transport. Many factors<br />
influenced the movement of road traffic in Libya the absence of public transport between cities, as well<br />
as the lack of trains or the good transport inside cities centre which caused the increasing of number<br />
of flights between cities, this led to increase the number of cars, which helped to increase the number<br />
of accidents in the absence of good transport system.<br />
7. RECOMMENDATION<br />
Road traffic accidents can not be removed entirely, but by the efforts of citizens, traffic police,<br />
engineers <strong>and</strong> the governments can reduce road accidents, the following is a set of recommendations<br />
which could be considered as remedies to reduce the effect of road traffic accidents.<br />
a. The government should improve general public transportation among cities <strong>and</strong> encourage<br />
people to use <strong>and</strong> regulate the import of foreign auto.<br />
b. Intensify the efforts of traffic police should be rising in the days before the end of the week (i.e.,<br />
Wednesday <strong>and</strong> Thursday) because the social visits <strong>and</strong> trips go up at these days.<br />
c. All media should be utilized to increase the traffic awareness among people <strong>and</strong> drivers <strong>and</strong> the<br />
dangers of traffic accidents.<br />
d. Ambulances should be equipped with medical equipment <strong>and</strong> respiratory equipment at all times<br />
<strong>and</strong> speed in the event of a traffic accident because the time is an important element in reducing<br />
the severity of Accidents.<br />
e. Speed is one of the main reasons for accidents in Libya, so must apply the law to those who<br />
drive their car at high speed<br />
REFERENCES<br />
Abuaiash, A.T., (1996). The basic factors of road accidents in Benghazi. Al-H<strong>and</strong>asi Bulletin, No. 35,<br />
pp. 83-92<br />
Azmani, W. Mohamed Rusli, A. Aziz Al-Sufi Ismail & Hashim M., (1977-2003). Pattern of road traffic<br />
accidents ub Kelantan. Jurnal Kesihatan Masyarakat Zsu Khas .<br />
General Authority for Information (statistics 1970-2009).<br />
General People's Committee of General Security (2009).<br />
Statistics General Administration of traffic <strong>and</strong> Authorizations (2007).<br />
http://en.wikipedia.org/wiki/Libya<br />
Lee, K.W. (1986). An analysis of automobile accidents in Riyadh. Institute of Transportation Engineers<br />
(ITE) Journal, Feb.: 35-39<br />
Mufti, M.H. (1984) Traffic accidents, general health problem in Saudi Arabia, Saudi Medical Journal,<br />
43:25-28.<br />
Secretariat of the Libyan justice, (Data as of 2008) general Traffic Department- office <strong>and</strong> Licensing of<br />
Tripoli.<br />
World Health Organization, WHO (2008). Global Status Report on Road Safety
T107<br />
13<br />
International <strong>Building</strong> & <strong>Infrastructure</strong> Technology Conference<br />
7-8 June 2011, Vistana Hotel, Penang, Malaysia<br />
SEISMIC RISK ASSESSMENT OF BUILDINGS IN KOLLAM INDIA<br />
Narayanan Sambu Potty 1 <strong>and</strong> Sirajuddin, M 2<br />
1 Department of Civil Engineering, Universiti Teknologi Petronas, Malaysia.<br />
2 Department of Civil Engineering, TKM College of Engineering, Kollam, India<br />
1 narayanan_sambu@petronas.com.my , 2 msiraj23@rediffmail.com<br />
ABSTRACT: Many earthquakes (EQ) were recorded from coastal margins of Indian peninsula during<br />
the last 200 years. The vulnerability of Kerala in India to EQ was highlighted at a meeting of<br />
Government <strong>and</strong> NGOs held recently in association with United Nations Development Fund (UNDP).<br />
The entire state is in Zone III, a moderate risk zone. Many cities deserved more attention owing to high<br />
concentrations of population. While an EQ cannot be prevented, the damage to life <strong>and</strong> property can<br />
be minimized if effective steps are taken. Each area differs in terms of climate, culture, methods of<br />
construction <strong>and</strong> living st<strong>and</strong>ards. Materials used also differ. A localized survey can find out the<br />
methods <strong>and</strong> materials for construction, general pattern of the structures etc. This will enable the<br />
identification of damage prone structures during a seismic event. Suitable retrofit measures can also<br />
be planned. This study carries out such as survey of Kollam district in Kerala, India. The data was<br />
analysed <strong>and</strong> suitable retrofit measures have been suggested.<br />
Keywords: earthquake, seismic, risk assessment, damage prone structure<br />
1. INTRODUCTION<br />
The Indian st<strong>and</strong>ards have suggestions for seismic resistive measures. For assessing expected<br />
seismic performance of existing load bearing masonry wall buildings one approach is to compare the<br />
safety provisions in the building code IS 4326 with the actual condition of building. Where it complies<br />
with code, it will be considered safe <strong>and</strong> acceptable. When deficient, it will be considered as weak <strong>and</strong><br />
damageable. It will require up gradation or strengthening or retrofitting (Arya <strong>and</strong> Agarwal). The<br />
pattern of construction <strong>and</strong> construction methods varies from place to place. Due to this diversity, a<br />
localized survey is the only method to obtain the exact details of the structure, methods of construction<br />
<strong>and</strong> materials used. Kollam was selected for survey due to its proximity to the authors. This study is<br />
significant since Kerala was elevated from zone II to zone III. Local tremors have been reported in<br />
various areas of Kerala in the near past (Bhattacharya <strong>and</strong> Dattatrayam, 2002). There exists no rule<br />
regarding the magnitude of earthquake (EQ) up to which a particular structure is safe. Only predictions<br />
<strong>and</strong> suggestions can be made about how many structures are to be retrofitted to withst<strong>and</strong> seismic<br />
shocks. Kollam has different types of soil varying from rocky, s<strong>and</strong>y to reclaimed soil type. Data<br />
collected will have a representation from all types of soil. In this study the general pattern of structures<br />
is determined <strong>and</strong> the number of structures that can with st<strong>and</strong> moderate tremors are identified.<br />
2. LITERATURE REVIEW<br />
The peninsular shield was long held to be non-seismic. The Peninsular coast is now observed to be<br />
vulnerable to intermittent seismicity (Banerji et al., 2001). Indian Meteorological Department (IMD) has<br />
precise data on relatively recent EQs <strong>and</strong> their after effects. IMD provides information on seismic<br />
zones <strong>and</strong> seismicity map for the period from 1505 to October, 2005 showing EQs with M>5.0. In<br />
Kerala, EQ are of Magnitude 5 to 6.9. Since authentic historical records of seismicity along the<br />
peninsula cost are virtually unavailable, the likely recurrence interval between shakes in such sectors<br />
cannot be gauged. Regional seismicity since historic times gives hints about major faults in this part of<br />
south India. The region has witnessed several slight to moderate magnitude EQs in the past. The most<br />
significant one is the Coimbatore EQ (M 6.0) of 8 February 1900. Two EQs occurred in 2000 <strong>and</strong> 2001<br />
(M 5.0 <strong>and</strong> 4.8 respectively) (Bhattacharya <strong>and</strong> Dattatrayam, 2002). No major damage was reported;
14<br />
International <strong>Building</strong> & <strong>Infrastructure</strong> Technology Conference<br />
7-8 June 2011, Vistana Hotel, Penang, Malaysia<br />
however cracks occurred in some buildings in the epicentre area. The chances <strong>and</strong> types of damages<br />
that are possible during an EQ in Kerala are discussed in Rajendran et.al (2009). The vulnerability of<br />
Kerala was highlighted at a recent meeting of Government, NGOs <strong>and</strong> UNDP.<br />
3. OBJECTIVES<br />
� To conduct a localized survey on the materials <strong>and</strong> methods of construction, geometry <strong>and</strong><br />
general pattern of the structures etc in Kollam (no such survey has been reported in literature)<br />
� To identify the buildings that require retrofitting <strong>and</strong> to compile suggestions for retrofit of these<br />
structures.<br />
4. METHODOLOGY<br />
Kollam Corporation has 52 wards with estimated one lakh legal structures. The different areas of the<br />
city have nothing in common considering the geology. The coastal areas have s<strong>and</strong>y soil while the<br />
eastern zones have laterite soil. Some regions have marshy soil also. After discussions <strong>and</strong> field<br />
verifications six soil categories was included. Under “type of structures”, reinforced walls, concrete<br />
slab over steel truss, timber structures <strong>and</strong> fully steel houses were eliminated as they were not used<br />
locally. In slums, mud bricks were commonly used. Framed, reinforced masonry, ordinary masonry<br />
<strong>and</strong> mortar free construction were included. The number of floors, floor areas, height of walls etc was<br />
included. The use of the building was also considered as the number of causalities during an EQ<br />
differs in various types of structures. Special consideration was given to strategically important<br />
buildings. To ascertain the general strength of masonry, type of masonry, mortar composition <strong>and</strong> the<br />
plastering was included separately. Most of the structures being masonry, wall shear failure will be<br />
high during an EQ. Hence the longest wall length was considered. The size <strong>and</strong> positions of openings<br />
in bearing wall, the most important criteria proposed by IS codes was included. Similarly the pier width<br />
between consecutive openings, distance of the first opening from inside corner of outside wall etc<br />
were included. Laterite, wire cut <strong>and</strong> country burnt bricks; hollow cement block, solid cement block,<br />
r<strong>and</strong>om rubble masonry, Interlocking bricks, wooden planks etc were included “materials used building<br />
blocks” category. The roof type covers RCC- flat, RCC-sloped, Tiled, AC sheet, Tin sheet <strong>and</strong><br />
Thatched. Filler slab was also included but only a few houses were found in that category. To check<br />
the overall stability of the structures, especially at corners, the provision for lintel <strong>and</strong> plinth beam all<br />
around the building were noted. The symmetry <strong>and</strong> age of structure play an important role during an<br />
EQ. For sub structure, the points noted were the presence of plain cement concrete at the bottom of<br />
trench <strong>and</strong> type of foundation. The foundation types include r<strong>and</strong>om rubble, isolated footing, strip<br />
footing, raft foundation, brick foundation, pile foundation etc. The average number of occupants was<br />
noted irrespective of the type <strong>and</strong> use of the structure. The provision of cellar parking spaces, high<br />
weight RCC overhead tanks etc. was also noted. The presence of high rise towers adjacent to a<br />
selected structure was considered. The aim was to collect a minimum of 250 data from each ward.<br />
Care was taken to select various types of structures from each ward so as to get a clear cross section<br />
of structure types in the locality. The survey succeeded in collecting data in good quality <strong>and</strong> quantity.<br />
The accuracy of this study would increase with the number of data collected. Time constraints forced<br />
to reduce the number to around 200 from each ward. Interaction with incumbents gave more details<br />
about the structure. Details were available from the City Corporation office. Those found correct in all<br />
respects were included. Problems faced during field survey included uncertainty (1) whether plain<br />
cement concrete was placed at the bottom of trench for the substructure (2) presence of plinth beam<br />
<strong>and</strong> (3) type of cement mortar used for construction of super structure. As many structures are<br />
plastered, there was no way to find the composition of mortar used. Same problem was faced with<br />
plastered walls. Application of wall putty made the walls hard <strong>and</strong> the mortar combination was not<br />
known <strong>and</strong> difficult to find. The type of roof covering also created some problems. Many multi storied<br />
structures had sloped roof at the top. The doubt was where to include the data, as flat slab or as<br />
sloped roof. It was decided to include in sloped roof segment. The questionnaire had 30 questions. IS<br />
1893, IS 113828 <strong>and</strong> IS 4326 were used for preparing the questionnaire <strong>and</strong> also assessing the areas<br />
of a structure that is more prone to seismic damage. It helped in pinpointing the parts of a structure<br />
that has to be strengthened to attain seismic resistivity.
15<br />
International <strong>Building</strong> & <strong>Infrastructure</strong> Technology Conference<br />
7-8 June 2011, Vistana Hotel, Penang, Malaysia<br />
5. RESULTS OF SURVEY AND ANALYSIS<br />
A total of 6817 data were collected. Those having not enough details or ambiguity were removed,<br />
resulting in a total of 6800 data for analysis. In Kollam city, residential buildings constituted 64.2%,<br />
Commercial buildings 19.2%, Government buildings 3.5%, Public buildings 4%, Educational buildings<br />
5.1% <strong>and</strong> hospitals 4%. Kollam, once an industrial area has now only 1% industrial buildings.<br />
Educational st<strong>and</strong>ards <strong>and</strong> facilities are high <strong>and</strong> hence educational buildings contribute to 5.1%.<br />
General Pattern of Structures in Kollam: It is seen that residential buildings are increasing in<br />
numbers, compared with commercial ones. They are constructed largely by individuals, with their own<br />
likes <strong>and</strong> knowledge; seem to have no seismic provisions. The general method of making structure<br />
strong by adding “more cement, more steel” creates an over reinforced structure only. This is not a<br />
good practice since the structure will not give enough warning before collapse. In this study more<br />
attention was given to residential structures. Norms <strong>and</strong> st<strong>and</strong>ards for residential structures up to two<br />
floors were considered.<br />
Detailed analysis of residential structures (RS): For RS, 17.63% does not satisfy the requirement<br />
of minimum distance from the inside corner of the outside wall. IS 13828 (1993) requirement is 23 cm.<br />
A minimum pier width of 45 cm between consecutive openings (IS 13828,1993) was not satisfied by<br />
5.88% of the total buildings. The ratio of width of the opening to the length of the wall was limited to<br />
0.40 to 0.46 by IS code. It was modified as no attics <strong>and</strong> mezzanine floors are seen in Kollam. The<br />
value was interpolated to 0.45. On this, a total of 77.77% of buildings satisfies this requirement.<br />
Majority of RS satisfy the three important requirements proposed by IS codes. Even though these<br />
code provisions draw less attention of the builders, accidently or fortunately majority have satisfied the<br />
requirement. All the surveyed buildings using masonry had cement mortar proportions not less than<br />
1:5. To attain more strength for structures many house owners spend lavishly on cement <strong>and</strong> s<strong>and</strong>,<br />
while the code proposed a minimum of 1:6. Only 10.45% buildings do not have all-round lintels. This<br />
can be accepted to a certain level as this percentage contains buildings that are mortar free, thatched<br />
sheds etc. It was noticed that some of RS, that too multistoried ones, did not have all-round lintels. In<br />
some places lintels are as thin as a line with a very small percentage of reinforcement. It has been<br />
found that these structures were constructed not by individuals, but by contractors. Surely the<br />
contractor is exploiting the owner. 27.45% of RS were found to be non symmetric. Symmetry plays an<br />
important role during EQ as stability is directly related to symmetry. If the structure is symmetric, the<br />
additional shear <strong>and</strong> moment that occurs at the time of quake gets distributed uniformly over the<br />
structure. Otherwise it will create an unbalanced effect <strong>and</strong> the structure concedes easily. Symmetry<br />
has not received sufficient importance in RS due to the reasons like aesthetics, better cross<br />
ventilation, space constraints, non availability of enough l<strong>and</strong>, extension works etc. Regarding<br />
subsurface details; 86.92% of the residential buildings rest on soft soil strata of which 93.23% rests on<br />
s<strong>and</strong>y soil, 4.5% rests on clayey strata, 1.3% on marshy strata <strong>and</strong> 0.97% on reclaimed l<strong>and</strong>. It is<br />
good to see that all RS constructed on marshy <strong>and</strong> reclaimed strata were provided with plinth beams<br />
<strong>and</strong> plain cement concrete at base. 30.97% of the buildings in the s<strong>and</strong>y soil have plinth beams. This<br />
is concern because, at places where s<strong>and</strong>y soil was supported by some other weak soil strata, cracks<br />
were seen on structures. These areas require special attention since a mild quake can topple these<br />
structures. But another surprising fact is that 75.18% of buildings in s<strong>and</strong>y soil have got a PCC bed<br />
beneath the foundation. The genuiness of this is bit difficult to prove. Percentage wise distribution of<br />
various types of masonry structures showed that ordinary masonry structures constituted (90.32%),<br />
framed structures (5.66%), mortar free construction (0.84%) <strong>and</strong> reinforced masonry (3.18%). On<br />
surface finishes, 92.81% had plastered walls. This makes good sense as during an EQ, it holds the<br />
walls <strong>and</strong> transmits the forces. Of the unplastered buildings, 36.36% are non-masonry <strong>and</strong> 44.33% are<br />
r<strong>and</strong>om rubble construction. 19.31% of masonry buildings are left unplastered. Non plastered walls<br />
exist not due to aesthetics or non availability of raw materials or labour. Many owners admit that it is<br />
due to the cost incurred for plastering, with plan to plaster it in the immediate future. As it is a normal<br />
procedure, 95.42% of residential buildings have foundation <strong>and</strong> basement constructed using rubble.<br />
Out of the remaining minority, 60.32% have got laterite or brick foundation. This type of buildings has<br />
got mainly tile roofs. A small percentage has got isolated footings. The isolated footing-plinth beam<br />
construction is seen in many newly completed buildings. A new trend of using concrete for<br />
substructure is observed in Kollam city. When it comes to roofing, lions share is occupied by RCC<br />
roofs, 84.31%. 4.19% are tiled roof houses, 2.61% uses tin sheet or AC sheets <strong>and</strong> 8.89% uses<br />
thatched roofing. The last two are found commonly in coastal areas. It is good to use this type roofing<br />
as many possibilities exist for sea-erosion. This type of roofs <strong>and</strong> structures can keep losses to a<br />
minimum. No residential structures were found to be older than 70 years. Even structures aged about<br />
50 to 60 years are altered <strong>and</strong> modified. Interactions revealed that it is not due to aesthetics, but on
16<br />
International <strong>Building</strong> & <strong>Infrastructure</strong> Technology Conference<br />
7-8 June 2011, Vistana Hotel, Penang, Malaysia<br />
fear about the strength of the structure, many had done alterations. The percentage wise age of<br />
residential structures showed “less than 50 years” (1.32%); (21-50 years) 13.72%; (11-20 years)<br />
7.84% <strong>and</strong> (0-10 years) were 77.12%. It is evident from the above data that buildings aged between<br />
21 to 50 years are comparatively more. These structures on an average should have further minimum<br />
life of 15 more years. This needs the prime attention. Here retrofits are to be provided to increase the<br />
life span <strong>and</strong> seismic resistivity. This group contains both RCC buildings <strong>and</strong> tiled roof buildings. For<br />
retro fitment, classifications are to be deduced out based on the type of structure. A total of 80.39% of<br />
residences has got water tanks. The percentage wise distribution of different types of tanks is Fibre<br />
tanks (86.17%), RCC tank (7.31%) <strong>and</strong> masonry tanks (6.52%). Even though RCC <strong>and</strong> masonry tanks<br />
are stronger <strong>and</strong> can be cast as per size <strong>and</strong> shape requirements, they pose a big danger as in most<br />
of the cases it is impossible to place these tanks in the central point of the structure. The eccentricity<br />
of the water tank may cause it to overturn during an EQ. The water tank itself is a big structure. On<br />
break up during an EQ, the incumbents are affected by the debris too. Thus permanent water tanks<br />
add to the secondary damages of EQs. Fibre tanks are more advisable than other types. For larger<br />
capacity more number of tanks can be used with interconnections <strong>and</strong> these tanks can be placed<br />
uniformly throughout the structure.<br />
Commercial Structures (CS): Out of CS surveyed 55% were framed structures, 7.5% were of<br />
reinforced masonry, 32.5% of ordinary masonry <strong>and</strong> 5% mortar free construction. The mortar free<br />
buildings were small pan shops, tea shops <strong>and</strong> provision stores of temporary nature. About 5% of CS<br />
was found to be more than 50 years of age. They include establishments in cashew <strong>and</strong> coir fields<br />
where lot of people are engaged in work. 40% of the buildings are between 20 to 50 years of age, 15%<br />
are 10 to 15 years <strong>and</strong> 40% are less than 10 years in age. An important point noticed during analysis<br />
was the absence of big type commercial complexes. The highest was a five floor structure owned by<br />
government. Medium type commercial structures ranging up to three floors are common. All of them<br />
have stair cases rigidly attached to the structures which are not a good procedure for seismic<br />
resistivity, though they conform to minimum requirement of IS codes <strong>and</strong> building rules. 73.22% of the<br />
CB can be considered as rigid frames since they have structural support between walls <strong>and</strong> roof.<br />
Those that do not fall under this criteria poses risk, but many are single storied commercial structures<br />
with light weight roof or RCC. Only 50% of the structures satisfy the minimum requirement of width of<br />
opening to length of wall of 0.40. This is for maximum exposure of the shop for exhibiting the products<br />
to the public. Majority of first floor shops have this value greater than 0.40. Almost the same is the<br />
case of width between adjacent piers. About 69% satisfies the minimum width of 50 cm. The<br />
recommended minimum distance from inside of the outside wall to first opening by code is 30cm. 88%<br />
of buildings satisfy this criterion successfully. For space saving <strong>and</strong> for obtaining maximum floor area,<br />
symmetry was achieved by majority of structures. 93% of CS were found to be symmetric. Only 20%<br />
of CS had over head water tank. Here also economy had played a vital role. Two-three storied CS<br />
were served by four or more number of tanks connected together. It constituted about 12% of the total<br />
commercial structures. The rest have RCC over head tank, most being at centre portion of the<br />
structure creating a balance. Considering roofing, 71% has RCC roofs, 12% has tiled roofs <strong>and</strong> 17%<br />
has AC or Tin sheet roofs. The tiled roofs account for most of the aged structures. 63% of the<br />
structures rest on isolated footings, 35.3% rests on r<strong>and</strong>om rubble masonry. Just above 1% have pile<br />
foundation <strong>and</strong> 0.7% has a raft base. The presence of strong soil <strong>and</strong> absence of big business malls<br />
may be the reason for this low percentage of pile <strong>and</strong> raft foundations. The pile foundations were all<br />
cast in situ concrete piles. 71% of the commercial establishments had all-round lintels, also all of the<br />
cashew factories got intermittent concrete horizontal b<strong>and</strong>s in addition to lintels. About 21% of the<br />
commercial buildings had cellar floors. Most of them are used as parking lots or storage spaces. The<br />
existence of cellars merely over columns is not advisable from seismic point of view. In Chile, where<br />
EQ struck recently, most of the commercial structures overturned or tumbled because of cellar<br />
openings. However strong the basement, there are chances of structural failure in case of an EQ.<br />
Space constraints for parking etc are making constructors to go for cellars.<br />
Detailed Analysis of Hospitals, Government <strong>Building</strong>s <strong>and</strong> Public <strong>Building</strong>s: These structures<br />
that attract the public at all times play a vital role during an EQ. On hospital buildings majority about<br />
90% rests on isolated footings with tie beams <strong>and</strong> plinth beams. All are well plastered <strong>and</strong> have the<br />
required width to length of wall ratio. About 80% of these hospitals have got separate over head water<br />
tanks, which is a good thing. 65% of these hospitals exists in the very core areas of the city <strong>and</strong> have<br />
another hazard from adjacent towers. The towers erected by mobile communication service providers<br />
for repeating signals are a point of danger if an EQ strikes. These towers can fall over hospitals<br />
thereby harming their smooth functioning as relief centres. The average occupant rates in the<br />
surveyed hospitals were 45. Thus the magnitude of danger posed by these towers is comparatively
17<br />
International <strong>Building</strong> & <strong>Infrastructure</strong> Technology Conference<br />
7-8 June 2011, Vistana Hotel, Penang, Malaysia<br />
high <strong>and</strong> has to be avoided immediately. These towers may be kept away from hospital <strong>and</strong> city<br />
centre, or to make use of some new technique for mobile receptions. Due to expansion, 95% of<br />
hospitals have lost symmetry. Only a few seems to have planned growth pattern. However<br />
construction joints were provided on the exp<strong>and</strong>ed structures. The designers deserve credit for these<br />
measures which reduce the risk of total collapse. Majority of hospitals have RCC covered roof. And<br />
many have additional tin sheet covering, few have tiled roof. It can be accepted as there are no<br />
inpatient wings functioning in these hospitals. The government buildings seem to conform to all the<br />
code regulations <strong>and</strong> buildings rules, but the quality of work is a matter of concern. Even a government<br />
building less than 10 years of age was found to have large cracks on main walls. In the planning stage<br />
engineers can avoid risk by keeping the structure symmetric. Only one building was found to be nonsymmetric<br />
throughout this survey. Most government buildings had overhead water tank, but all are of<br />
fibre material. The credit is due to the PWD schedule of rates for incorporating fibre tanks in them.<br />
67% of government buildings were aged between 10 to 20 years, 13% in between 21 to 30 <strong>and</strong> 5%<br />
between 31 to 40%. Just a few were greater than 40 years of age. But they were also face lifted <strong>and</strong><br />
retrofitted in the near past. About 30% of the government buildings are tile roofed. Rest are RCC<br />
covered. A few government structures were with AC sheet roofing, but they were negligible in numbers<br />
<strong>and</strong> were eliminated from analysis. About 20% of the government buildings were adjacent to high<br />
structures in the form of over head water tanks or mobile towers. This is the source of hazard. The<br />
strategically important structures were very few in number. The KSEB substations were made<br />
conforming exactly to the code provisions. They are also symmetric, had plinth beam <strong>and</strong> lintels allround<br />
<strong>and</strong> isolated footing as foundation. Same was the case with the Communication department<br />
also. They extensively use r<strong>and</strong>om rubble masonry with concrete b<strong>and</strong>s in between. But some<br />
structures were not symmetric. Any way the strategically important structures can function well if an<br />
EQ happens. Public buildings were largely in the form of clubs, libraries <strong>and</strong> reading rooms where the<br />
pattern of occupancy is more in the evening time. About 78% of the public buildings were less than 10<br />
years in age. This is due to the fact that the local aid schemes for people’s representatives are being<br />
made very good use for these type structures. Hence they got plinth beam, lintels, isolated footings<br />
<strong>and</strong> RCC roof covering. Only less than 3% buildings were more than 30 years of age. Just 6% has got<br />
overhead water tanks, that to fibre made. Symmetry was there in most of the structures. 35.7% of<br />
structures fall short of the criteria of width of opening to length of the wall. This is due to the usage of<br />
mild steel grills extensively, especially in the case of reading rooms. Some other public buildings like<br />
fish market simply rests on columns with roof <strong>and</strong> tie beams posing a big question mark about seismic<br />
resistivity. In general, public buildings appear to be safe during an EQ according to the general<br />
st<strong>and</strong>ards.<br />
Detailed Analysis of Educational <strong>Building</strong>s: About 5% of the total buildings fall under this category.<br />
Educational institutions having age greater than 60 years were seen. The most peculiar features found<br />
from the analysis are as follows - 98.7% of buildings are symmetric, 76.8% have RCC roofs, <strong>and</strong><br />
23.2% have tiled roofs. All the tiled roof buildings got intermediate b<strong>and</strong>s of concrete in addition to all<br />
round lintels. A few of the tiled roof buildings were two storied with wooden floor, which is finely<br />
performing. The width of opening to length of wall ratio, pier to pier opening distance <strong>and</strong> minimum<br />
corner edge distance was found to be satisfied by all the structures with tiled roof, i.e. those having<br />
age between 30 to 50 years. It is pathetic to say that the comparatively new buildings of RCC fall well<br />
short of this criteria. About 48.7% does not satisfy any of the three provisions regarding openings. 67%<br />
schools got separate over head water tanks. Structures which have overhead water tanks use fibre<br />
ones for the purpose. As most schools have play ground adjacent to buildings, the possible danger of<br />
high rise structure is avoided. Educational buildings has got r<strong>and</strong>om rubble foundation for 55%,<br />
isolated footing for the rest of 45%. The average number of occupants for each class was about 45. As<br />
the old buildings do not have rigid structural support between walls <strong>and</strong> roof; it seems a sort of danger.<br />
52% of schools have multi-storey structure. But the maximum number of storeys was limited to three,<br />
that to a minimum number. No educational building was found to have raft or pile foundation.<br />
6. SUMMARY OF ANALYSES<br />
Residential Structures: Structures in soft soil strata constitute 86.92% <strong>and</strong> hard soil strata 13.08% of<br />
the structures. Information on various aspects of structures in soft <strong>and</strong> hard soil was collected. The<br />
most important feature that affects the seismic resistivity of masonry structures is the structural<br />
support between walls <strong>and</strong> roof. On an average of 31.13% of buildings doesn’t have that support.<br />
Hence they need the prime attention for retrofit. Also an average of 11.41% doesn’t have all round
18<br />
International <strong>Building</strong> & <strong>Infrastructure</strong> Technology Conference<br />
7-8 June 2011, Vistana Hotel, Penang, Malaysia<br />
lintels. Here retrofit in the form of wire-meshed concrete at corners is necessary. In general, an<br />
average of 21.27% structures requires essential retrofits.<br />
Commercial Structures: Framed structures constitute 55% <strong>and</strong> non-framed structures constitute 45%<br />
of the structures. The important factors that affect the seismic resistivity of commercial buildings are<br />
the ratio of openings <strong>and</strong> the cellar parking provisions. 50% of the commercial structures have to be<br />
modified for necessary ratio of openings. 21% of the structures have to be altered to reduce the risk<br />
due to cellar parking. Hence a total of 35.5% commercial structures require essential retrofits.<br />
Hospital buildings: The secondary damages caused due to the collapse of high rise structures may<br />
affect the proper functioning of hospitals after an EQ. The functionality can be harmed by the collapse<br />
of water tanks also. Hence in an average 41.65 % of hospital structures are likely to be affected by<br />
EQ.<br />
Government buildings: Majority of GB have full filled the requirements by IS codes. But the quality of<br />
workmanship is a matter of concern. The structural support between walls <strong>and</strong> roofs are essential <strong>and</strong><br />
42% of government buildings require retrofit in that section. The high rise structures also pose danger.<br />
Hence an average of 31% of GB is to be retrofitted suitably to avoid the danger of EQ. Most of the<br />
public buildings do not satisfy the criteria of minimum opening ratio. Hence 64.3% of public buildings<br />
are to be retrofitted. Absence of structural supports is seen in 42 %. Therefore an average of 53.15%<br />
has to be considered for retrofit to ensure their successful functioning. Educational buildings have an<br />
average of 45 incumbents per class. Hence the prime importance must be given to the structural<br />
support between walls <strong>and</strong> roof <strong>and</strong> the opening ratios. As per analysis, both the criteria are not full<br />
filled by majority. Hence an average of 38.15% of educational structures requires retro fitment. Overall<br />
36.78% of the existing building structures in Kollam Corporation require essential retrofitting for<br />
smooth <strong>and</strong> safe functioning.<br />
7. METHODS OF RETROFIT<br />
The masonry building can be retrofitted effectively by strengthening the corners. For this, the wall<br />
plastering of the corners is to be removed <strong>and</strong> an iron mesh with exactly same width as the plaster<br />
removed is nailed in the gap. Concreting can be done over that additional reinforcement using a rich<br />
mortar mix of 1:1.5:3 or 1:2:4.The surface can be then plastered <strong>and</strong> trowelled smooth. This process is<br />
comparatively cheap <strong>and</strong> requires less skilled labour. The wall will look the same as before retrofit.<br />
The most important problem of lack of structural connection between roof <strong>and</strong> walls of ordinary<br />
masonry structures can be remedied by using any of the following technique. A rigid connection is kept<br />
between the roof <strong>and</strong> wall using specially made clamps <strong>and</strong> bolts. This method is comparatively cheap<br />
<strong>and</strong> can be adopted in a region like Kollam very easily. Timber structures can be retrofitted using MS<br />
plates at joints of the members with the help of nut <strong>and</strong> bolts. The joints which are generally weak are<br />
held together using two plates placed on the both sides of the members. Bolts are inserted through<br />
holes drilled <strong>and</strong> the members are held in tight position with the help of nuts. This method has the<br />
advantage of easy maintenance <strong>and</strong> can be used for many years. Periodic checking <strong>and</strong> tightening, if<br />
necessary, can be done in this method. Existing CS can be retrofitted using mild steel beams <strong>and</strong><br />
channels. An additional brace-cum-girder arrangement can be provided for commercial buildings. The<br />
loads are carried by these new beams <strong>and</strong> shear walls <strong>and</strong> low ductile beams are exempted from<br />
carrying heavy loads. Thus safety of the structure is ensured. For new multi storey constructions,<br />
cross bracings can be provided on columns <strong>and</strong> base isolators on the foundation to reduce the effect<br />
of quakes. Trenches around the structure called ‘MOAT’ is formed for the easy placement of structure<br />
over the base isolators. A shear core is formed exactly at the centre of the structure to receive any<br />
shocks during quakes. Shear walls are also positioned towards the centre of the structure.<br />
8. CONCLUSIONS<br />
In general, buildings in Kollam city have sufficient resistance against moderate EQs as per Indian<br />
st<strong>and</strong>ards <strong>and</strong> general criteria. Immediate <strong>and</strong> important attention is required for the RS. The growth<br />
rate of RS is very high <strong>and</strong> just a few have got seismic resistivity of its own. Government should<br />
impose new rules regarding seismic resistivity regulations <strong>and</strong> should educate the public about the<br />
possible damages due to EQs. The tendency of providing large openings <strong>and</strong> asymmetric designs are<br />
to be curbed. Economic retrofits in the form of wire meshed concrete on the corners of masonry walls<br />
in tiled roof structures <strong>and</strong> division of longer walls to shorter ones can be done for structures greater<br />
than 30 years of age. In CS strict rules must be imposed to avoid huge capacity overhead water tanks.
19<br />
International <strong>Building</strong> & <strong>Infrastructure</strong> Technology Conference<br />
7-8 June 2011, Vistana Hotel, Penang, Malaysia<br />
The provision of open cellar area for parking must be avoided. Tie beams at regular intervals should<br />
be provided for structures having floor height higher than 4m. The government should seriously think<br />
about changes to be incorporated in the IS codes regarding EQ resistivity. The water tanks must be<br />
kept away from the buildings in the campus. The structural support between roof <strong>and</strong> walls of old tiled<br />
buildings should be improved by using cleat <strong>and</strong> angles connection. Long <strong>and</strong> big construction in a<br />
single stretch must be avoided. On the other h<strong>and</strong> smaller structure must be placed well apart.<br />
ACKNOWLEDGEMENTS<br />
Authors acknowledge the facilities provided by TKM College of Engineering <strong>and</strong> the UG students<br />
Bhupesh. S., Santhosh Unni. V, Hussain. M., Abhilash. B <strong>and</strong> Usha Kumari. T.S., who collected the<br />
data for the survey very meticulously.<br />
REFERENCES<br />
Arya A.S. <strong>and</strong> Agarwal,A., Seismic assessment of brick masonry buildings – situated anywhere in<br />
seismic zone IV of India, National Disaster Management Division, Ministry of Home Affairs, New Delhi<br />
Banerjee, P.K., G. G. Vaz, B. J. Sengupta <strong>and</strong> A. Bagchi, (2001) A qualitative assessment of seismic<br />
risk along the Peninsular coast of India, south of 19°N, Journal of Geodynamics, 31, 5, July 2001, pp.<br />
481-498<br />
Bhattacharya, S.N., <strong>and</strong> Dattatrayam, R.S., (2002) “EQ sequence in Kerala during Dec 2000 <strong>and</strong> Jan<br />
2001", Current Science, 82,10, pp. 1275 – 1278. 25 May<br />
Bhupesh.S., Santhosh U.V, Hussain.M., Abhilash.B <strong>and</strong> Usha Kumari.T.S, Seismic Risk<br />
Assessment Of Existing <strong>Building</strong>s In Kollam Corporation Limits, UG Project Report, TKMCE, Kerala<br />
University<br />
IMD, Lodhi Road, New Delhi (.http://www.imd.gov.in/section/seismo/)<br />
IS-13828-1993, Improving EQ resistance of low strength masonry buildings<br />
IS -1893-Part 1 (2002) Criteria for EQ resistant design of structures- General Provisions <strong>and</strong> <strong>Building</strong>s<br />
IS -4326-1993, EQ resistant design <strong>and</strong> construction <strong>and</strong> buildings-code of practice<br />
Rajendran. C.P , Biju J., Sreekumari. K <strong>and</strong> Kusala R. (2009) Reassessing the EQ hazard in Kerala<br />
based on the historical <strong>and</strong> current seismicity. International Journal of the Geological Society of India<br />
The Hindu (2004). Kerala vulnerable to EQs, Feb 08, 2004
T109<br />
20<br />
International <strong>Building</strong> & <strong>Infrastructure</strong> Technology Conference<br />
7-8 June 2011, Vistana Hotel, Penang, Malaysia<br />
COMPUTER APPLICATION IN EARLY PHASE OF DESIGN OF INTELLIGENT<br />
BUILDINGS<br />
Sutapa Das 1 <strong>and</strong> Abhijit Chaudhuri 2<br />
1 Indian Institute of Technology Kharagpur, India<br />
2 Tata Consultancy Services, Kolkata, India<br />
1 sutapa@arp.iitkgp.ernet.in , 2 abhix.c@gmail.com<br />
ABSTRACT: Compared to earlier days, modern building projects have significantly evolved in terms of<br />
size, complexity <strong>and</strong> speed of completion resulting into a multi-user multi-tasking design environment.<br />
<strong>Building</strong>s have become a complex integration of various systems <strong>and</strong> services. The trend has been<br />
technically supported by development in information <strong>and</strong> communication technology <strong>and</strong> resulted in<br />
intelligent building (IB). In case of IB, tr<strong>and</strong>isciplinary integration must cater to the places, processes,<br />
people <strong>and</strong> management in a synchronized manner. Hence, with a huge array of possible technical<br />
solutions, the importance of design management <strong>and</strong> decision making in order to critically assess<br />
alternative schemes from early phase of design is emphasised more than ever before. Unlike other<br />
engineered products, building design varies from project to project. Hence virtual prototyping or testing<br />
the alternatives in design phase itself is recommended leading to integrated project delivery. The<br />
iterative process of design can be made systematic <strong>and</strong> conscious decision can be drawn by using<br />
various CAD based tools such as <strong>Building</strong> Information Modelling (BIM), where computing can reduce<br />
significant amount of time <strong>and</strong> confusion through calculation, drawing, drafting, presentation,<br />
communication <strong>and</strong> data h<strong>and</strong>ling. Apart from these generative tasks, computers help in analytical<br />
tasks of design evaluation – a m<strong>and</strong>ate especially for high-tech intelligent buildings. Starting with a<br />
brief history of evolution of IB <strong>and</strong> its unique requirements, this paper illustrates the whole design<br />
process with reference to IB in details with examples. The paper also includes the potential of BIM in<br />
IB design along with a future scope of its application in facility management of IB.<br />
Keywords: BIM, computing, design, integrated project delivery, intelligent building.<br />
1. INTRODUCTION<br />
Since last two decades, we are undergoing major transformation of how buildings are designed,<br />
constructed <strong>and</strong> operated. The reasons are not only the complexity <strong>and</strong> size of the buildings have<br />
risen steeply along with the users’ dem<strong>and</strong> for a better performing building, but an, emphasis on life<br />
cycle costing, expedited project deadline, energy efficiency <strong>and</strong> building automation have added to the<br />
‘Market pull’. At the same time, there has been a ‘Technology push’ via tremendous growth of<br />
information <strong>and</strong> communication technology (ICT) based hardware to aid to integration of building<br />
services (BSI & <strong>Building</strong>SMART, 2010). As a result, the intelligent building (IB) concept emerged in<br />
1990s in a multi-user multi-tasking environment (Wong et al., 2005). IB differs significantly from its<br />
predecessors in terms of design, construction, operation or maintenance. This paper presents a stateof-the<br />
art review of designing of IB using computers.<br />
2. IB VS. CONVENTIONAL BUILDINGS<br />
Concept of IB has changed over time. A building which has fully automated building service control<br />
systems (Cardin, 1983 - sited in Wigginton & Harris, 2002) or one which integrates various systems to<br />
effectively manage resources in a coordinated mode to maximize: technical performance, investment<br />
<strong>and</strong> operating cost savings, flexibility (The Intelligent <strong>Building</strong> Institution in Washington, 1988 – sited in<br />
Clements-Croome, 1997) has a purely technical focus <strong>and</strong> no consideration of human productivity<br />
carried the potential threat of functional obsolescence.
21<br />
International <strong>Building</strong> & <strong>Infrastructure</strong> Technology Conference<br />
7-8 June 2011, Vistana Hotel, Penang, Malaysia<br />
On the contrary, a recent definition by CIB (1995) encompasses human factors <strong>and</strong> describes IB as a<br />
dynamic <strong>and</strong> responsive architecture that provides every occupant with productive, cost effective <strong>and</strong><br />
environmentally approved conditions through a continuous interaction among its four basic elements:<br />
places, processes, people <strong>and</strong> management <strong>and</strong> the interrelation between them.<br />
IB differs significantly from conventional buildings in terms integration of its systems rather than<br />
sophistication of the same (Arkin & Paciuk, 1997). This integration follows a hierarchy (Figure 1) which<br />
provides ‘qualities that create a productive <strong>and</strong> efficient environment such as functionality, security <strong>and</strong><br />
safety; thermal, acoustical, air-quality <strong>and</strong> visual comfort; <strong>and</strong> building integrity’ (Bradshaw & Miller,<br />
1993).<br />
Figure 1. The Intelligent <strong>Building</strong> Pyramid (Himanen, 2003)<br />
Because of the critical emphasis on integration, design <strong>and</strong> the design management of IB also differs<br />
significantly from that of conventional buildings. Often IB projects follow integrated project delivery<br />
(IPD) process such as design-build. In this case, project members are involved at an earlier phase of<br />
design <strong>and</strong> goals are set during the concept phase itself (Figure 2).
WHAT<br />
Pre‐design<br />
WHAT<br />
Conceptua<br />
lization<br />
Schematic<br />
design<br />
HOW<br />
WHO<br />
Criteria<br />
design<br />
Design<br />
development<br />
Design<br />
development<br />
HOW<br />
Construction<br />
documents<br />
Implementati<br />
on ocuments<br />
WHO<br />
Agency per‐<br />
mit / bidding<br />
Agency co‐ord<br />
/ Buyout<br />
22<br />
International <strong>Building</strong> & <strong>Infrastructure</strong> Technology Conference<br />
7-8 June 2011, Vistana Hotel, Penang, Malaysia<br />
REALIZE<br />
Construction<br />
REALIZE<br />
Construction<br />
Closeout<br />
Closeout<br />
Traditional<br />
design<br />
process<br />
Agency<br />
Owner<br />
Designer<br />
Design consultants<br />
Constructors<br />
Trade constructors<br />
Integrated<br />
design<br />
process<br />
Agency<br />
Owner<br />
Designer<br />
Design consultants<br />
Constructors<br />
Trade constructors<br />
Figure 2. Traditional Vs. Integrated Design Process (AIA 2007)<br />
3. LEVEL OF INTEGRATION IN IB<br />
Over time, focus of building design has changed as:<br />
� 1960: Functional efficiency.<br />
� 1970: Costs in use / life cycle cost.<br />
� 1980: Quality <strong>and</strong> effectiveness.<br />
� 1990: Human productivity <strong>and</strong> sustainability.<br />
� 2000 onwards: Flexibility, adaptability, service integration <strong>and</strong> high st<strong>and</strong>ards of finishes – all<br />
leading to intelligent threshold.<br />
As IB encompasses all of the above mentioned goals, Clements-Croome (2000) explains further why<br />
integration <strong>and</strong> transdisciplinary is the ultimate keyword in IB industry by stating:<br />
"Any consideration of intelligent buildings, whether learning, designing or managing them requires a<br />
freedom of thinking which can embrace transdisciplinary ideas <strong>and</strong> systems. The word<br />
transdisciplinary is a truly holistic <strong>and</strong> highly interactive concept. Intelligent building strategies are<br />
dealing with multiple criteria <strong>and</strong> attempting to integrate ideas over a very wide range."<br />
After this comment, more than a decade has passed. But the same trend is being followed <strong>and</strong> with a<br />
much higher intensity. Sinopoli (2011) predicts the trends in smart building design as:<br />
� Traditional <strong>Building</strong> Management <strong>Systems</strong> (BMS) will be obsolete due to their slow <strong>and</strong><br />
narrow response to latest IT applications <strong>and</strong> will be configured with open communication protocols.
23<br />
International <strong>Building</strong> & <strong>Infrastructure</strong> Technology Conference<br />
7-8 June 2011, Vistana Hotel, Penang, Malaysia<br />
� Energy management software with agility <strong>and</strong> speed will flourish irrespective of the size or fame of<br />
the companies developing them.<br />
� Large organizations with significant needs for facility technicians, engineers <strong>and</strong> managers will<br />
collaborate with technical institutions <strong>and</strong> offer internships to build the human resource pool.<br />
� Telephone or cable TV service network may also provide telemetry service for building operation<br />
or energy related information <strong>and</strong> majority of the wireless connectivity will be through ‘White-<br />
Space’ devices (WSD).<br />
� Certified <strong>and</strong> accredited designers, contractors <strong>and</strong> operators for integrated building systems (e.g.<br />
LEED, BIM) are in high dem<strong>and</strong>.<br />
� Concepts such as smart grid or dem<strong>and</strong> response will find extensive application.<br />
It is also worthy to note that while achieving transdisciplinary integration, not only regular services<br />
such as HVAC or elevator are included but the major part of ICT related services are also included<br />
(Abu Sharkh, 2007). These services are namely, cabling, networking (wired or wireless), smart<br />
building solutions (CCTV, remote access, security, fire detection, management system, car park<br />
control, alarms, etc), PBX with regular or IP telephony.<br />
4. BENEFITS OF EARLY INTEGRATION IN IB<br />
Here the vision is defined <strong>and</strong> design of all systems <strong>and</strong> services begin at the concept phase. Earlier<br />
the involvement of various key players - better is the result in terms of cost <strong>and</strong> performance. Such<br />
benefits are captured by MacLeamy Curve (Figure 3). While comparing the traditional <strong>and</strong> integrated<br />
project delivery, MacLeamy (CURT, 2004), argued that as the cost of making design changes rises<br />
over time, so the ability to design improvement <strong>and</strong> cost reduction decreases. These factors are<br />
plotted in a diagram known as the MacLeamy curve. It means that an earlier integrated effort in<br />
conceptualizing the design will save money <strong>and</strong> will be performance wise more effective compared to<br />
effort put in later phases (AIA, 2007).<br />
Design effort/ effect<br />
Traditional<br />
Integrated<br />
Integrated design<br />
process<br />
Ability to impact cost <strong>and</strong><br />
functional capabilities<br />
Cost of design changes<br />
Traditional design process<br />
Predesign Schematic Design Construction Bid Construction<br />
Design Dev. Document<br />
Concept- Criteria Detailed Implementation Buyout Construction<br />
ualization Design Dev. Document<br />
Project<br />
phases<br />
Figure 3. Macleamy Curve Showing Benefits of Early Integration<br />
More precise figures of these benefits are available where the benefits of early integration are<br />
quantized through cost saving or energy saving. For example, a typical IB compared to its traditional<br />
version can save in (CABA, 2009): first cost (56%), annual operation cost (32%), annual maintenance<br />
cost (82%), utility costs (10%) <strong>and</strong> net present value in 10 years at ROI 9% (24%). Only in terms of<br />
energy saving, the figure can be 21-35% depending on building type, size, climatic condition etc (Elliot,<br />
2009).
24<br />
International <strong>Building</strong> & <strong>Infrastructure</strong> Technology Conference<br />
7-8 June 2011, Vistana Hotel, Penang, Malaysia<br />
5. THE DESIGN PROCESS<br />
Before we discuss about design process of IB in particular, it is required to underst<strong>and</strong> the design<br />
process in general which will explain why design of IB is different from a traditional building. For any<br />
design, there is no unique <strong>and</strong> ultimate solution for a problem, but the optimum one is elected from<br />
possible alternatives based on various objective <strong>and</strong> subjective parameters. Hence, designing is<br />
rational decision making <strong>and</strong> problem solving process to meet certain functions. Design can be<br />
generative or analytical. In first case, numerous solutions are generated, for example various<br />
fenestration designs for a room, but selection of the best among them is beyond the scope of this<br />
process. On the contrary, the analytical method checks the viability of all proposed alternatives using<br />
the following methods (Radford & Gero, 1988):<br />
� Non-dynamic: Evaluates formula <strong>and</strong> check compliance with rules.<br />
� Dynamic: A function of a building component is run <strong>and</strong> upon variation of different parameters the<br />
outcomes are checked.<br />
For a high value project like building, conventional prototyping is infeasible in terms of time of cost.<br />
Hence in both cases appraisal of design alternatives is done through virtual prototyping which means<br />
testing <strong>and</strong> refining the scheme when still on drawing board (Maver, 2004).<br />
5.1 Appraisal of Design Alternatives Using Models<br />
The first appearance of architectural drawing by 2800 BC can be considered as the first step of<br />
modelling. For next 5000 years, plan, elevation, section, other sketches <strong>and</strong> physical scale models –<br />
all of which are devoid of virtual development remained the core model for building design.<br />
However, according to system approach, a critical evaluation in true sense is done through a model<br />
that can reflect operational behaviour <strong>and</strong> formal characteristics of the proposed system. Here, input is<br />
the design hypothesis; output is prediction of operational behaviour <strong>and</strong> functional characteristics<br />
under a particular set of context or extraneous variable. If the output does not comply with the desired<br />
result, the deviation is taken as a feedback <strong>and</strong> another scheme is developed. Hence design process<br />
is iterative (Figure 4a). For example, heat loss from a window can be regulated by various design input<br />
variables such as size, location, glazing material, shading device etc, but external factor climate also<br />
plays a big role (Figure 4b).<br />
Here apart from technical aspects, other aspects such as functional, aesthetic, social <strong>and</strong> economic<br />
aspects are also considered. Sometimes they can be contradictory also. For example, a window must<br />
have higher light transmission <strong>and</strong> lower heat gain. Both are not achievable at the same time unless<br />
low emission or double layered glass is used (Koengsberger et al., 1973).<br />
Extraneous<br />
variable<br />
Input variable <strong>Systems</strong> Output variable<br />
Feedback<br />
Window<br />
design<br />
Appraisal<br />
Design<br />
change<br />
Climate<br />
Heat loss<br />
Figure 4. Design Appraisal in System Terms (a) Generic, (b) Specific (Maver, 2004)<br />
5.2 Why CAD Based Models Are Popular<br />
The iterative design process essentially comprises of four stages, namely, representation,<br />
measurement, evaluation <strong>and</strong> modification. It is found that, compared to traditional paper-based or<br />
scale models, computer generated model performs significantly better in all these stages especially in<br />
the second one because they are predictive <strong>and</strong> dynamic instead of descriptive <strong>and</strong> static. If first two<br />
phases are set <strong>and</strong> made available, other two processes become dynamic <strong>and</strong> embedded within<br />
design itself. For example:<br />
� Representation – The design hypothesis is input in the computer. E.g. building plan, bridge<br />
elevation, printed circuit layout, mechanical linkage etc. It links designer’s mental model <strong>and</strong> CAD<br />
model i.e. it works as man-machine interface.
25<br />
International <strong>Building</strong> & <strong>Infrastructure</strong> Technology Conference<br />
7-8 June 2011, Vistana Hotel, Penang, Malaysia<br />
� Measurement – The software models the behaviour of the hypothesised design <strong>and</strong> generates<br />
cost <strong>and</strong> performance on a number of relevant criteria as output. E.g. bill of quality, deflection<br />
profile for bridge span, resistance between two circuit nodes, angular velocity of linkage arm etc.<br />
� Evaluation – The designer or client applies value judgement on deviation of actual output from<br />
desired one. E.g. To achieve 2% minimum daylight factor, window size may be increased which in<br />
turn increases the cooling load a lot. In such case, what should be prioritized?<br />
� Modification – Any appropriate change is suggested to the initial scheme.<br />
A first generation of dynamic model is shown in Figure 5 <strong>and</strong> was used by D'Cruz et al. (1983) in their<br />
research to find the optimum window design for a corner room in intermediate floor of an office<br />
building in Hobart, Australia. They changed the opening size <strong>and</strong> shading device to evaluate<br />
performance against thermal, lighting <strong>and</strong> spatial efficiency along with cost. The problem formulation<br />
used a form of Pareto optimal dynamic programming optimization.<br />
WINTER THERMAL PERFORMANCE<br />
Minimum internal environmental temperature °C<br />
SUMMER THERMAL PERFORMANCE peak environmental temperature °C<br />
Figure 5. Design Optimization for Window Using Pareto Set of Performance<br />
Today’s developed software programs <strong>and</strong> smart technology together have expedited <strong>and</strong> fine-tuned<br />
the whole process to a great extent. Now it is an ordinary event to work on the same project<br />
simultaneously by many people in design team using computer. Apart from speed, CAD based models<br />
offer the following benefits essential for IB:<br />
� Widened search – By changing any of the input parameters, numerous output or design<br />
alternatives can be generated compared to 2-3 alternatives generated by traditional method. It<br />
allows dynamic comparison of cost vs. performance of these models.<br />
� Greater integration in decision making – Previously, members of design team used to work on a<br />
scheme individually <strong>and</strong> in stages. Feedback from one profession often used to result in massive<br />
redesign of other disciplines. Now whole team can not only work together, but also people can<br />
check their work against predefined parameters before fine tunings are made.<br />
� Improved design insight – Study of influence of varying input parameters on performance outputs<br />
sets up causal relation among parameters.<br />
� Differentiation of objective <strong>and</strong> subjective judgements – Based on quantitative rather than intuitive.<br />
6. BIM AND OTHER TOOLS IN IB DESIGN<br />
IB is extensively service oriented <strong>and</strong> is seldom erected from scratch at site, its components <strong>and</strong><br />
services are manufactured separately in different factories <strong>and</strong> even at different countries <strong>and</strong><br />
assembled at site. As a result, the architect or the other core design team members coordinate with an
26<br />
International <strong>Building</strong> & <strong>Infrastructure</strong> Technology Conference<br />
7-8 June 2011, Vistana Hotel, Penang, Malaysia<br />
integration consultant who possesses knowledge of the products suited to the vision of the team <strong>and</strong><br />
who only specifies the requirements of the integration (Elliot, 2009). Many details <strong>and</strong> working<br />
drawings are left to the manufacturer cum contractor (Al Bizari & Gray, 2004). In this regard, <strong>Building</strong><br />
Information Model (BIM) is a major break-through which goes much ahead of other simulation tools for<br />
individual services such as acoustic, lighting, structural performance etc.<br />
BIM a 3D object oriented CAD approach which structures building related information in such a way<br />
that the data can be shared (Sinopoli, 2009). Widely recognised BIM softwares are Tekla, Revit,<br />
ArchiCAD, Microstation etc. A BIM is a digital model of a building in which information about a project<br />
is stored. It can be 3D, 4D (integrating time) or even 5D (including cost) – right up to ‘nD’ (a term that<br />
covers any other information). The key strength of BIM lies in information management as (BSI &<br />
<strong>Building</strong>SMART, 2010):<br />
� Information, once captured, can be reused <strong>and</strong> repurposed<br />
� Information can be reviewed <strong>and</strong> revised, corrected <strong>and</strong> controlled<br />
� Information can be checked <strong>and</strong> validated.<br />
� Information is object oriented <strong>and</strong> inter-operable following IFC (Industry Foundation Classes)<br />
st<strong>and</strong>ard.<br />
� Information-flow within the team is simple <strong>and</strong> comprehensive (Figure 6).<br />
Client<br />
Contractor Architect<br />
Manu -<br />
facturer<br />
Cost<br />
consultant<br />
Elec. Engg.<br />
Struct.<br />
Engg.<br />
Mech<br />
Engg.<br />
Client<br />
Contractor Architect<br />
Manu -<br />
facturer<br />
Cost<br />
consultant<br />
BIM<br />
Elec. Engg.<br />
Struct.<br />
Engg.<br />
Mech<br />
Engg.<br />
Figure 6. Information Flow in (a) Traditional Design (b) BIM Based Design<br />
Among various advantages of BIM, the salient ones are (Maunula, 2008):<br />
� Designers can connect project program <strong>and</strong> tools via web.<br />
� Detailed BOQ/ cost estimation.<br />
� Possible conflicts in design <strong>and</strong> construction are identified.<br />
� Marketing of construction approaches<br />
� Lesser errors <strong>and</strong> hence rectifications – saves costs <strong>and</strong> resources.<br />
� More “what if” analysis, such as construction sequencing options, shuffling of human resources,<br />
fine-tuning of cost factors, etc.<br />
� Underst<strong>and</strong>ing <strong>and</strong> visualizing the process <strong>and</strong> end products help in conscious <strong>and</strong> informed<br />
decision making<br />
6.1 <strong>Future</strong> Application in Facilities Management<br />
Facilities management is more considered as mere repair – maintenance but it has become a part of<br />
the design process where the ease of operation <strong>and</strong> maintenance is planned like performance of<br />
building systems <strong>and</strong> services. This is the longest <strong>and</strong> revenue-earning period of a building life cycle<br />
<strong>and</strong> BIM can be used effectively. For example, the ‘as-built’ information stored in BIM can be used in<br />
creating the maintenance manual, to observe the tasks of facility management virtually, <strong>and</strong> that the
27<br />
International <strong>Building</strong> & <strong>Infrastructure</strong> Technology Conference<br />
7-8 June 2011, Vistana Hotel, Penang, Malaysia<br />
model could be updated when renovation is conducted (Manaula, 2008). In this regard, BIM is<br />
expected to coordinate with other smart tools used in IB industry such as (MDCS, 2005):<br />
� Computer Integrated Facility Management (CIFM): Integrated technology <strong>and</strong> processes<br />
supporting facility management <strong>and</strong> real estate services.<br />
� Computer Aided Facility Management (CAFM): Calculation of building area <strong>and</strong> tracking of space<br />
classifications.<br />
� Computerized Maintenance Management System (CMMS): Manages scheduled <strong>and</strong> on-request<br />
building maintenance.<br />
� Electronic Document Management System (EDMS): manages the documents associated with<br />
facility design <strong>and</strong> management.<br />
� Geographic Information System (GIS).<br />
7. CONCLUSIONS<br />
This paper summarised why <strong>and</strong> how IB differs from its traditional counterparts. Next the importance<br />
of transdisciplinary integration in IB is explained considering the present <strong>and</strong> future trend of IB<br />
industry. The point is further illustrated with generic <strong>and</strong> specific examples. Once the goal of IB is<br />
established, the paper explains how the design of IB can be approached systematically using models<br />
especially the CAD based ones <strong>and</strong> how it can help in selecting the optimum solution. Finally the most<br />
recognised modelling technique of BIM is described briefly along with its realised advantages over<br />
previous models <strong>and</strong> its future potential in facility management of IB is explored.<br />
REFERENCES<br />
Abu Sharkh, N.A. (2007). Conceptual design for smart building. Proceedings of 1st Conference on<br />
Public Works, Kuwait Ministries Council, Kuwait.<br />
AIA (2007). Integrated Project Delivery: A Guide [online] California: AIA (The American Institute of<br />
Architects) Available at: http://www.aia.org/contractdocs/AIAS077630 {Accessed 02 March, 2011].<br />
Al Bizari, S. & Gray C. (2004). The management of design. In D. Clements-Croome, ed. Intelligent<br />
<strong>Building</strong> Design Management <strong>and</strong> Operation. London: Thomas Telford.<br />
Arkin, H. & Paciuk, M. (1997). Evaluating intelligent building according to level of service system<br />
integration. Automation in Construction. 6 (5/6), pp.471– 479.<br />
Bradshaw, V. & Miller, K.E. (1993). <strong>Building</strong> Control System (2nd Ed.). New York: John Wiley <strong>and</strong><br />
Sons.<br />
BSI <strong>and</strong> <strong>Building</strong>SMART UK (2010). Constructing the business case: <strong>Building</strong> information modelling.<br />
London: BSI (British St<strong>and</strong>ards Institution).<br />
CABA (2009). Energy efficiency in buildings: Transforming the market, Information Series, Ottawa,<br />
Canada: CABA (Continental Automated <strong>Building</strong> Association).<br />
CIB Working Group W98. (1995). Report of meeting held at international building congress<br />
proceedings at Tel Aviv, Israel, A. Lustig, ed. Netherl<strong>and</strong>s: CIB (Int. Council for Research <strong>and</strong><br />
Innovation in <strong>Building</strong> <strong>and</strong> Construction).<br />
Clements-Croome, D. (2000). Creating the Productive Workplace. London: E&FN Spon.<br />
Clements-Croome, D. (1997). What do we mean by intelligent buildings? Automation in Construction.<br />
6(5), pp.395-400.<br />
CURT (2004). Collaboration, integrated information <strong>and</strong> the project life cycle in building design,<br />
construction <strong>and</strong> operation, CURT White Paper 1202, Cincinnati, USA: CURT (Construction Users<br />
Roundtable).<br />
D'Cruz, N., Radford A.D. & Gero, J.S. (1983). A Pareto optimization problem formulation for building<br />
performance <strong>and</strong> design. Engineering Optimisation, 7(1), pp.17-33.
28<br />
International <strong>Building</strong> & <strong>Infrastructure</strong> Technology Conference<br />
7-8 June 2011, Vistana Hotel, Penang, Malaysia<br />
Elliott, G. (2009). The new kid on the block: How smart building design is changing the industry<br />
[online] Smart <strong>Building</strong>s, LLC. Available at<br />
[Accessed 10<br />
March, 2011].<br />
Himanen, M. (2003). The Intelligence of Intelligent <strong>Building</strong>s: The Feasibility of the Intelligent <strong>Building</strong><br />
Concept in Office <strong>Building</strong>s. Espoo, Finl<strong>and</strong>: VTT Technical Research Centre of Finl<strong>and</strong>.<br />
Koengsberger, O.H., Ingersol, T.G., Mayhew, A. & Szokolay, S.V. (1973). Manual of Tropical Housing<br />
<strong>and</strong> <strong>Building</strong>: Climatic Design. Chennai, India: Orient Longman.<br />
Maunula, A. (2008). The implementation of <strong>Building</strong> Information Modeling (BIM): A process<br />
perspective. Masters thesis. Helsinki University of Technology SimLab.<br />
Maver, T.W. (2004). Design in the computer age. In D. Clements-Croome, ed. Intelligent <strong>Building</strong><br />
Design Management <strong>and</strong> Operation. London: Thomas Telford.<br />
MDCS (2005). If 4-D CAD is good then 5-D must be better! What construction managers should know<br />
about CAD models? Presentation at Construction Super conference 2005, San Francisco, CA.<br />
Radford, A.D. & Gero, J.S. (1988).Design by Optimization in Architecture, <strong>Building</strong> <strong>and</strong> Construction.<br />
New York: Van Nostr<strong>and</strong> Reinhold.<br />
Sinopoli, J.M. (2009). Smart <strong>Building</strong>s <strong>Systems</strong> for Architects, Owners <strong>and</strong> Builders, Singapore:<br />
Butterworth-Heinemann.<br />
Sinopoli, J. (2011). Predictions for smart buildings 2011 [online] Smart <strong>Building</strong>s LLC. Available at<br />
[Accessed 10 March, 2011].<br />
Wigginton, M. & Harris, J. (2002). Intelligent Skin, Oxford: Architectural Press.<br />
Wong, J.K.W. Li, H. & Wang, S.W. (2005). Intelligent building research: A review. Automation in<br />
Construction. 14 (1), pp.143– 159.
T110<br />
29<br />
International <strong>Building</strong> & <strong>Infrastructure</strong> Technology Conference<br />
7-8 June 2011, Vistana Hotel, Penang, Malaysia<br />
COMPRESSIVE STRESS-STRAIN RELATIONSHIP OF FOAMED CONCRETE AT<br />
HIGH TEMPERATURES<br />
Md Azree Othuman Mydin<br />
School of Housing, <strong>Building</strong> <strong>and</strong> Planning, Universiti Sains Malaysia, 11800, Penang<br />
azree@usm.my<br />
ABSTRACT: Even though foamed concrete has low mechanical properties compared to normal<br />
weight concrete, there is a potential of using this material as partition or load-bearing wall in low-rise<br />
residential construction. Before it can be considered for use as a load-bearing element in the building<br />
industry, it is necessary to acquire reliable information of its mechanical properties at ambient <strong>and</strong> high<br />
temperatures for quantification of its fire resistance performance. This paper will present the results of<br />
experiments that have been carried out to examine <strong>and</strong> characterize the compressive stress-strain<br />
relationship of foamed concrete at high temperatures. Foamed concrete with 650 kg/m 3 <strong>and</strong> 1000<br />
kg/m 3 density were cast <strong>and</strong> tested. The compression tests were carried out at ambient temperature,<br />
100, 200, 300, 400, 500 <strong>and</strong> 600°C.<br />
Keywords: stress-strain, foamed concrete, high temperatures<br />
1. INTRODUCTION<br />
Foamed concrete is not a new material in the construction industry. It was first patented in 1923<br />
(Valore, 1954) <strong>and</strong> a limited scale of production was instigated in 1923. The use of foamed concrete<br />
was very limited until the late 1970s, when it was started to be consumed in Netherl<strong>and</strong>s for ground<br />
engineering applications <strong>and</strong> voids filling works. In 1987 a full-scale assessment on the application of<br />
foamed concrete as a trench reinstatement was carried out in the United Kingdom <strong>and</strong> the<br />
achievement of this trial led to the extensive application of foamed concrete for trench reinstatement<br />
<strong>and</strong> other applications followed (Brady et al., 2001). Since then, foamed concrete as a building<br />
material has become more widespread with exp<strong>and</strong>ing production <strong>and</strong> range of applications.<br />
Although foamed concrete has low mechanical properties in comparison with normal weight concrete,<br />
there is a possible of utilizing this material as partition or load-bearing wall in low-rise residential<br />
construction. Before it can be considered for use as a load-bearing component, it is essential to obtain<br />
dependable information of its mechanical properties at ambient <strong>and</strong> high temperatures for<br />
quantification of its fire resistance performance. Mechanical properties of concrete due to exposure to<br />
high temperatures have been studied since a long time ago. Nevertheless, there is no such extensive<br />
study of mechanical properties of foamed concrete at high temperatures.<br />
Lin et al. (1996) conducted studies to investigate the microstructure of concrete exposed to high<br />
temperatures in both actual fire <strong>and</strong> laboratory conditions with the assistance of Scanning-Electron-<br />
Microscopy (SEM) <strong>and</strong> stereo microscopy. They found that the absorption of moisture from the<br />
surrounding medium provides a mechanism for the rehydration of calcium oxide <strong>and</strong> unhydrated<br />
cement grains that refilled the void spaces. They observed that long irregular fibers of C-S-H gel<br />
combined with ettringite <strong>and</strong> C-H crystals <strong>and</strong> formed as a result of rehydration.<br />
In a study carried out by Schneider <strong>and</strong> Herbst (1989), chemical reactions <strong>and</strong> the behavior of calcium<br />
hydroxide, calcium carbonate, calcium silicate hydrate, non-evaporable water <strong>and</strong> micropores under<br />
various temperatures was examined. They found that the major increase of concrete permeability <strong>and</strong><br />
porosity at high temperature was primarily produced by arising microcracks <strong>and</strong> by changes of<br />
material inner structure, as well as by crack opening due to high gas pressure values. As a result, the<br />
permeability of concrete depends not only on temperature levels, moisture content <strong>and</strong> gas pressure<br />
but also upon the degree of crack development.
30<br />
International <strong>Building</strong> & <strong>Infrastructure</strong> Technology Conference<br />
7-8 June 2011, Vistana Hotel, Penang, Malaysia<br />
It can be pointed out that the degradation mechanisms of cement-based material like foamed concrete<br />
upon exposure to high temperatures include chemical degradation <strong>and</strong> mechanical deterioration<br />
where each mechanism is dominant within a specific temperature range. The dehydration process in<br />
the cement paste becomes significant at temperatures above about 110 °C (Khoury et al., 2002) <strong>and</strong><br />
diminishes the calcium silicate hydrate (C-S-H) links which provide the primary load-bearing formation<br />
in the hydrated cement. Furthermore, due to low permeability of the cement paste, internal water<br />
pressure built up during dehydration of the hydrated C-S-H, which increases internal stresses <strong>and</strong><br />
induce microcracks in the material from about 300°C, resulting in decreased strength <strong>and</strong> stiffness of<br />
the material (Hertz, 2005). At higher temperatures around 450°C, calcium hydroxide (Ca(OH)2), which<br />
is one of the most vital compounds in cement paste, dissociates, resulting in the shrinkage of foamed<br />
concrete.<br />
A variety of test methods may be used to obtain different aspects of mechanical properties of materials<br />
at high temperatures, including the stressed test, the unstressed test, <strong>and</strong> the unstressed residual<br />
strength test (Phan <strong>and</strong> Carino, 2003). In this research, the unstressed test method was adopted for<br />
convenience. In the unstressed test, the sample was heated, without preload, at a steady rate to the<br />
predetermined temperature. While maintaining the target temperature, load was applied at a<br />
prescribed rate until sample failure. Because the temperature is unchanged, the test is also referred to<br />
as steady state test, as opposed to transient test in which the specimen temperature changes with<br />
time.<br />
2. SET-UP FOR COMPRESSION TESTS<br />
Figure 1. High temperature electric furnace with specimens<br />
Two different electric furnaces were used for heating the foamed concrete specimens to the various<br />
steady-state temperatures. One furnace had a maximum operating temperature of 450°C (low<br />
temperature furnace), <strong>and</strong> the second furnace had a maximum operating temperature of 1000°C (high<br />
temperature furnace). Each of the furnaces was capable of holding three specimens. The low<br />
temperature furnace had a temperature range of 50°C to 450°C <strong>and</strong> was used for four of the reported<br />
thermal exposure conditions: 100°C, 200°C, 300°C <strong>and</strong> 400°C. The furnace temperature exposure<br />
profiles were produced by a programmable microprocessor temperature controller attached to the<br />
furnace power supply <strong>and</strong> monitored by a Type K thermocouple located in the furnace chamber. The<br />
high temperature furnace (Figure 1) had a maximum operating temperature of 1000°C. This furnace<br />
was used for exposing concrete specimens to 500°C <strong>and</strong> 600°C. This furnace was also controlled by a<br />
programmable microprocessor temperature controller attached to the furnace power supply based on<br />
feed-back temperature reading from a Type K thermocouple located in the furnace chamber. Pretesting<br />
checking of the furnaces showed that both furnace controllers <strong>and</strong> furnace power system could<br />
keep furnace operating temperatures within ±1°C over the test range.<br />
The compressive tests were carried out on 100 x 200 mm cylinders. The specimens were removed<br />
from moulds after 24 hours of casting <strong>and</strong> then cured in a water tank at 20 ± 2°C for 28 days. Prior to
31<br />
International <strong>Building</strong> & <strong>Infrastructure</strong> Technology Conference<br />
7-8 June 2011, Vistana Hotel, Penang, Malaysia<br />
testing, the specimens were removed from the curing tank <strong>and</strong> put in the oven for 24 hours at 105°C.<br />
After 24 hours, all the specimens were removed from the oven <strong>and</strong> their ends were ground flat. To<br />
monitor the strain behaviour at ambient temperature during loading, two strain gauges was fitted on<br />
each sample for the ambient test only. These ambient temperature strain measurements were used to<br />
confirm that the strain calculated based on the displacement of the loading platen was of sufficient<br />
accuracy. Since it was difficult to measure strain at high temperatures, the displacement of the loading<br />
platen was used to calculate the strain for the high temperature tests. Four Type K thermocouples<br />
were installed in the central plane of each cylinder specimen to measure the specimen temperature,<br />
as shown in Figure 2.<br />
Figure 2. Typical 100 x 200 mm cylinder specimen with thermocouples arrangement<br />
Loading was applied using an ambient temperature machine after removing the test samples from the<br />
furnace. Each specimen was wrapped with insulation sheets immediately after being removed from<br />
the electric furnace to minimise heat loss from the specimen to atmosphere. For each set, three<br />
replicate tests were carried out to check consistency of results. The target temperatures were 20°C<br />
(room temperature), 100, 200, 300, 400, 500, <strong>and</strong> 600°C.<br />
During the loading process, the temperature of each sample (thermocouple T3) was measured <strong>and</strong> it<br />
was found that the temperature was stable throughout the testing period. Figure 3 shows typical<br />
temperature variations throughout the loading phase for specimens of 1000 kg/m 3 density. As can be<br />
seen, because the duration of loading was short (just over one minute), there was very little heat loss<br />
<strong>and</strong> the temperature change was less than 0.5 o C.
Temperature (°C)<br />
203<br />
202<br />
201<br />
200<br />
199<br />
198<br />
197<br />
0 10 20 30 40 50 60 70 80<br />
Time (second)<br />
32<br />
International <strong>Building</strong> & <strong>Infrastructure</strong> Technology Conference<br />
7-8 June 2011, Vistana Hotel, Penang, Malaysia<br />
Specimen 1<br />
Specimen 2<br />
Specimen 3<br />
Figure 3. Temperature change during test of specimens of 1000 kg/m 3 density at target temperature<br />
of 200°C<br />
3. RESULTS AND DISCUSSIONS<br />
The engineering stress-strain relationships of foamed concrete were determined from the measured<br />
load <strong>and</strong> deflection results using the original specimen cross-sectional area Ao <strong>and</strong> length Lo. Due to<br />
difficulty of using strain gauges at high temperatures, the deflection used to calculate the strain was<br />
that of the movement of the loading platen. Strains were measured at ambient temperature to confirm<br />
this method. Figure 4 compares the measured strain <strong>and</strong> that calculated using the displacement of the<br />
loading platen for the ambient temperature test. This comparison demonstrates that it is sufficiently<br />
accurate to use the loading platen displacement to calculate the axial strain of the test specimen.<br />
Stress (N/mm 2 )<br />
2.0<br />
1.6<br />
1.2<br />
0.8<br />
0.4<br />
0.0<br />
Calculated strain (platen movement)<br />
Measured strain (strain gauge)<br />
0 0.001 0.002 0.003 0.004<br />
Strain<br />
Figure 4. Comparison of measured strain <strong>and</strong> calculated strain (based on movement of the loading<br />
platen) for foamed concrete of 650 kg/m 3 density at ambient temperature<br />
The tests were displacement controlled where the crack continue to develop <strong>and</strong> grow after the peak<br />
load is reached. However, since the test specimens failed in a brittle manner after reaching the peak<br />
stress, it was not possible to obtain the descending branch of the stress-strain relationship. Figures 5-<br />
8 present typical stress-strain relationships for the three duplicate samples at different temperatures<br />
for the 650 kg/m 3 density specimens <strong>and</strong> Figures 9-12 are for the 1000 kg/m 3 density specimens. It<br />
was clear that all the three duplicate samples produced very consistent results. Figures 13 <strong>and</strong> 14<br />
present the average stress-strain curves at all different testing temperatures for the two densities.
Stress (N/mm 2 )<br />
2.4<br />
2.0<br />
1.6<br />
1.2<br />
0.8<br />
0.4<br />
0.0<br />
0 0.001 0.002 0.003 0.004 0.005 0.006 0.007<br />
Strain<br />
33<br />
International <strong>Building</strong> & <strong>Infrastructure</strong> Technology Conference<br />
7-8 June 2011, Vistana Hotel, Penang, Malaysia<br />
Test 1<br />
Test 2<br />
Test 3<br />
Figure 5. Stress-strain relationship for foamed concrete of 650 kg/m 3 at ambient temperature<br />
Stress (N/mm 2 )<br />
2.4<br />
2.0<br />
1.6<br />
1.2<br />
0.8<br />
0.4<br />
0.0<br />
Test 1<br />
Test 2<br />
Test 3<br />
0 0.001 0.002 0.003 0.004 0.005 0.006 0.007<br />
Strain<br />
Figure 6. Stress-strain relationship for foamed concrete of 650 kg/m 3 at 200°C<br />
Stress (N/mm 2 )<br />
2.4<br />
2.0<br />
1.6<br />
1.2<br />
0.8<br />
0.4<br />
0.0<br />
Test 1<br />
Test 2<br />
Test 3<br />
0 0.001 0.002 0.003 0.004 0.005 0.006 0.007<br />
Strain<br />
Figure 7. Stress-strain relationship for foamed concrete of 650 kg/m 3 at 400°C
Stress (N/mm 2 )<br />
2.4<br />
2.0<br />
1.6<br />
1.2<br />
0.8<br />
0.4<br />
0.0<br />
0 0.001 0.002 0.003 0.004 0.005 0.006 0.007<br />
Strain<br />
34<br />
International <strong>Building</strong> & <strong>Infrastructure</strong> Technology Conference<br />
7-8 June 2011, Vistana Hotel, Penang, Malaysia<br />
Test 1<br />
Test 2<br />
Test 3<br />
Figure 8. Stress-strain relationship for foamed concrete of 650 kg/m 3 at 600°C<br />
Stress (N/mm 2 )<br />
6.0<br />
5.0<br />
4.0<br />
3.0<br />
2.0<br />
1.0<br />
0.0<br />
Test 1<br />
Test 2<br />
Test 3<br />
0 0.001 0.002 0.003 0.004 0.005<br />
Strain<br />
Figure 9. Stress-strain relationship for foamed concrete of 1000 kg/m 3 at ambient temperature<br />
Stress (N/mm 2 )<br />
6.0<br />
5.0<br />
4.0<br />
3.0<br />
2.0<br />
1.0<br />
0.0<br />
Test 1<br />
Test 2<br />
Test 3<br />
0 0.001 0.002 0.003 0.004 0.005<br />
Strain<br />
Figure 10. Stress-strain relationship for foamed concrete of 1000 kg/m 3 at 200°C
Stress (N/mm 2 )<br />
6.0<br />
5.0<br />
4.0<br />
3.0<br />
2.0<br />
1.0<br />
0.0<br />
0 0.001 0.002 0.003 0.004 0.005<br />
Strain<br />
35<br />
International <strong>Building</strong> & <strong>Infrastructure</strong> Technology Conference<br />
7-8 June 2011, Vistana Hotel, Penang, Malaysia<br />
Test 1<br />
Test 2<br />
Test 3<br />
Figure 11. Stress-strain relationship for foamed concrete of 1000 kg/m 3 at 400°C<br />
Stress (N/mm 2 )<br />
6.0<br />
5.0<br />
4.0<br />
3.0<br />
2.0<br />
1.0<br />
0.0<br />
Test 1<br />
Test 2<br />
Test 3<br />
0 0.001 0.002 0.003 0.004 0.005<br />
Strain<br />
Figure 12. Stress-strain relationship for foamed concrete of 1000 kg/m 3 at 600°C<br />
Stress (N/mm 2 )<br />
2.4<br />
2.0<br />
1.6<br />
1.2<br />
0.8<br />
0.4<br />
0.0<br />
Ambient<br />
200 °C<br />
400 °C<br />
600 °C<br />
0 0.001 0.002 0.003 0.004 0.005 0.006 0.007<br />
Strain<br />
Figure 13. Average stress-strain relationships for foamed concrete of 650 kg/m 3 at different<br />
temperatures
Stress (N/mm 2 )<br />
6.0<br />
5.0<br />
4.0<br />
3.0<br />
2.0<br />
1.0<br />
0.0<br />
0 0.001 0.002 0.003 0.004 0.005<br />
Strain<br />
36<br />
International <strong>Building</strong> & <strong>Infrastructure</strong> Technology Conference<br />
7-8 June 2011, Vistana Hotel, Penang, Malaysia<br />
Ambient<br />
200 °C<br />
400 °C<br />
600 °C<br />
Figure 14. Average stress-strain relationships for foamed concrete of 1000 kg/m 3 at different<br />
temperatures<br />
For both densities at all temperature levels, the ascending branch was linear for stress up to 75% of<br />
the peak strength. The strain corresponding to the peak strength increased at increasing<br />
temperatures. For foamed concrete of 650 kg/m 3 density, the maximum strains were 0.0034, 0.0039,<br />
0.0055 <strong>and</strong> 0.0066 at ambient temperature, 200°C, 400°C <strong>and</strong> 600°C respectively; for the 1000 kg/m 3<br />
density, the corresponding values were 0.0024, 0.0029, 0.0039 <strong>and</strong> 0.0048 at ambient, 200°C, 400°C<br />
<strong>and</strong> 600°C respectively. The increase in strain results from opening of cracks initiated by the heating<br />
at higher temperatures. Table 1 shows, for both densities <strong>and</strong> all temperatures, the elastic strain at the<br />
maximum stress, the maximum strain at the maximum stress <strong>and</strong> the ratio of these two strains. It<br />
appears that an average constant ratio of about 1.78 may be used for all cases.<br />
Table 1. Elastic strain at the maximum stress, maximum strain at the maximum stress <strong>and</strong> the ratio of<br />
these two strains for both densities at different temperatures<br />
Density<br />
(kg/m 3 )<br />
650<br />
1000<br />
4. CONCLUSIONS<br />
Temperature<br />
(°C)<br />
Elastic strain at<br />
maximum<br />
stress<br />
Maximum strain at<br />
maximum stress<br />
Ratio of maximum strain<br />
at peak stress to elastic<br />
strain at peak stress<br />
Ambient 0.0019 0.0034 1.79<br />
200 0.0022 0.0039 1.77<br />
400 0.0030 0.0055 1.83<br />
600 0.0037 0.0066 1.78<br />
Ambient 0.0013 0.0024 1.85<br />
200 0.0016 0.0029 1.81<br />
400 0.0023 0.0039 1.70<br />
600 0.0028 0.0048 1.71<br />
This paper has presented the results of an extensive series of experimental studies to attain stressstrain<br />
relationship of foamed concrete at high temperatures. Compressive cylinder tests were carried<br />
out for a range of foamed concrete densities at different temperatures from ambient up to 600 o C. The<br />
primary mechanism causing strength <strong>and</strong> stiffness degradation is microcracking, which occurs as<br />
water exp<strong>and</strong>s <strong>and</strong> evaporates from the porous body. As expected, reducing the density of foamed<br />
concrete reduces its strength. For both densities at all temperature levels, the ascending branch was<br />
linear for stress up to 75% of the peak strength. The strain equivalent to the peak strength increased<br />
at increasing temperatures. The increase in strain results from opening of cracks instigated by the<br />
heating at higher temperatures.
37<br />
International <strong>Building</strong> & <strong>Infrastructure</strong> Technology Conference<br />
7-8 June 2011, Vistana Hotel, Penang, Malaysia<br />
ACKNOWLEDGMENTS<br />
The author gratefully acknowledges financial support for this research provided by Universiti Sains<br />
Malaysia under <strong>USM</strong> Incentive Grant (Ref. No. 2011/0348). Acknowledgement is also made to the<br />
academic members <strong>and</strong> staff of the School of Housing, <strong>Building</strong> <strong>and</strong> Planning, Universiti Sains<br />
Malaysia for all their supports <strong>and</strong> assistance.<br />
REFERENCES<br />
Brady, K. C., Watts, G. R. A., <strong>and</strong> Jones, M. R. (2001). Specification for foamed concrete, Prepared<br />
for Quality Services, Civil Engineering, Highways Agency.<br />
Hertz, K. D. (2005). Concrete strength for fire safety design, Mag. Concr. Res., 57 (8), pp 445-453.<br />
Khoury, G. A., Majorana, C. E., Pesavento, F., <strong>and</strong> Schrefler, B. A. (2002). Modelling of heated<br />
concrete, Mag. Concr. Res., 54 (2), pp 77–101.<br />
Lin, W. M., Lina, T. D., <strong>and</strong> Powers-Couche, L. J. (1996). Microstructures of fire-damaged concrete, J.<br />
American Concrete Institute Materials 93 (3), pp 199-205.<br />
Phan, L. T., <strong>and</strong> Carino N. J. (2003). Code provisions for high strength concrete strength temperature<br />
relationship at elevated temperatures, J. Mater. Struct., 36 (256), pp 91-98.<br />
Schneider, U., <strong>and</strong> Herbst, H. (1989). Permeability <strong>and</strong> porosity of concrete at high temperature,<br />
Technical report 403, Deutscher Ausschuss für Stahlbeton, Berlin, In German.<br />
Valore, R.C. (1954). Cellular concrete Part 1 Composition <strong>and</strong> methods of production. J. American<br />
Concrete Institute. 50, pp 773-796.
T111<br />
38<br />
International <strong>Building</strong> & <strong>Infrastructure</strong> Technology Conference<br />
7-8 June 2011, Vistana Hotel, Penang, Malaysia<br />
ASSESSING THE GREEN ROOF TECHNOLOGY IN GREEN BUILDING RATING<br />
SYSTEMS<br />
Lee Xia Sheng 1 , Ati Rosemary Binti Mohd Ariffin 2 , Hazreena Binti Hussein 3<br />
1 School of Architecture, <strong>Building</strong> & Design, Taylor’s University;<br />
2, 3 Faculty of Built Environment, University of Malaya<br />
1 leexiasheng@gmail.com , 2 atiarchitectureum@gmail.com, 3 reenahussein@googlemail.com<br />
ABSTRACT: Green roofs or vegetated roofs are becoming popular for sustainable development. On<br />
one h<strong>and</strong>, research shows that green roofs have numerous environmental benefits such as reduce<br />
flood risk, improve rainwater runoff quality, mitigate urban heat isl<strong>and</strong>, building energy saving <strong>and</strong><br />
provide urban wildlife habitat. On the other h<strong>and</strong>, the development <strong>and</strong> utilisation of green building<br />
rating systems are crucial to appraise existing <strong>and</strong> new green buildings. The research was conducted<br />
foreseeing that the criteria <strong>and</strong> weight of scoring in such rating systems certainly will influence built<br />
environment stakeholders’ decision in pursuing green building technologies. A sufficient weight of<br />
scoring in the rating system will stimulate the implementation of green roof technology for the<br />
construction projects that are adopting that particular green building rating system. However,<br />
insufficient weight of scoring will make green roof technology less attractive <strong>and</strong> eventually being left<br />
out in the sustainable development process even though this technology have the potential to mitigate<br />
current environmental issues. This paper explores the approach of assessing green building<br />
technologies based on rating systems to measure its performance <strong>and</strong> potential, with an aim to clarify<br />
the role <strong>and</strong> position of green roof technology in various green building rating systems including<br />
Leadership in Energy <strong>and</strong> Environmental Design (LEED), Green <strong>Building</strong> Index (GBI) <strong>and</strong> Singapore<br />
<strong>Building</strong> Construction Authority Green Mark. The research methodology involves analysing the<br />
relevance <strong>and</strong> scoring performance of green roof based on the criteria stated in green building rating<br />
systems such as sustainable site planning <strong>and</strong> management, materials <strong>and</strong> resources, water efficiency<br />
<strong>and</strong> innovation. This paper will also explore the approach of assessing green building technologies<br />
based on rating systems to measure its performance <strong>and</strong> potential.<br />
Keywords: green roof, vegetated roof, Green <strong>Building</strong> Rating <strong>Systems</strong>, Green <strong>Building</strong> Index,<br />
LEED, BCA Green Mark, <strong>Sustainable</strong> Development<br />
1. INTRODUCTION<br />
The scoring performance of green roof technology in various green building rating systems is an<br />
important factor influencing built environment stakeholders’ decision in whether to pursue this<br />
particular green building technology for sustainable development.<br />
1.1 Green Roof’s Role in <strong>Sustainable</strong> Development<br />
The flood risk in Malaysia is increasing due to rapid urbanization of catchments for example urbanized<br />
areas. Georgetown <strong>and</strong> many parts of the places in Kuala Lumpur are so frequently inundated is<br />
because of over-development of river valleys (Ngai, 1997). Impermeable surface such as hard roof<br />
<strong>and</strong> pavement are replacing green areas, accelerating the rainwater peak runoff that increase the<br />
flood risk in the event of heavy monsoonal <strong>and</strong> convectional rainfall. Table 1 show that the runoff for<br />
conventional roof is very high ranging 0.9-0.95. However, implementation of the green roofs<br />
resembling the flat soil with vegetation category ranging 0.1-0.6 <strong>and</strong> flat lawns with heavy soil category<br />
ranging 0.13-0.17 on certain extend will greatly reduce the peak rainwater runoff <strong>and</strong> flood risk.<br />
Therefore green roofs can be very effective tools to mitigate rainwater runoff <strong>and</strong> without the<br />
construction of large capacity <strong>and</strong> costly drainage system.
39<br />
International <strong>Building</strong> & <strong>Infrastructure</strong> Technology Conference<br />
7-8 June 2011, Vistana Hotel, Penang, Malaysia<br />
Table 1. Typical Values of Runoff Coefficients (Waterfall, 1998)<br />
Type of Surface<br />
Roof:<br />
High Low<br />
Metal, gravel, fiber glass, mineral<br />
Paving:<br />
0.95 0.9<br />
Concrete, asphalt<br />
1.00 0.9<br />
Gravel<br />
Soil:<br />
0.7 0.25<br />
Flat, bare<br />
0.75 0.2<br />
Flat with vegetation<br />
Lawns:<br />
0.6 0.1<br />
Flat, s<strong>and</strong>y soil<br />
0.10 0.05<br />
Flat, heavy soil<br />
0.17 0.13<br />
Urban Heat Isl<strong>and</strong> (UHI) effect is the phenomena whereby the city centre area exhibits higher<br />
temperature as compared to rural or suburban areas. The increase in anthropogenic heat emissions<br />
from combustion of fuel, vehicle emissions <strong>and</strong> air conditioning, the decrease in green spaces <strong>and</strong><br />
water; <strong>and</strong> increase in manmade structures <strong>and</strong> pavements are the main causes of UHI (Wong, 2002).<br />
Cities in Malaysia are facing UHI effect as more <strong>and</strong> more green spaces are taken up for<br />
development. Given the hot <strong>and</strong> humid condition in Malaysia, green roofs can provide consistant<br />
passive thermal protection for buildings <strong>and</strong> environment. If green roofs are being implemented on a<br />
sufficient scale, they have the potential to help mitigating the uprising global warming effects.<br />
Generally, More than half of solar gain by low height building like a typical terraced house is through<br />
its roof, as the roof plane is the part of a building that receive the most solar radiation <strong>and</strong> for the<br />
longest duration through the day. Research shows that buildings built not complying to the 2006 UK<br />
building regulations will have much lower U-Values associated with poor roof insulation. These<br />
findings encourage retrofitting old buildings without good insulation in Malaysia with green roofs. New<br />
construction should also consider green roof as a green building design approach at the same time<br />
saving the cost for conventional roof insulation (Cartleton et al, 2010). The energy benefits provided by<br />
the green roof options also make a noteworthy impact in the life cycle assessment (Kosareo, 2007).<br />
Green roofs also have the potential to be a wild life habitat in urban area. Iinvestigations have<br />
indicated that green roof technology may lead to significant gains in biodiversity. Research shows that<br />
numerous species of spiders <strong>and</strong> beetles in the International Union for Conservation of Nature (IUCN)<br />
Red List have been found on green flat-roof habitats in Europe (Brenneisen, 2003). There is also<br />
evidence for the habitat potential of green roofs for endangered bird species (Brenneisen, 2003;<br />
Baumann, 2006). Until now, little consideration has been given to the intangible ecological functions<br />
that green roofs may perform as wild life habitat, this maybe due to the current green building<br />
technologies that are economically driven.<br />
Figure 1. A northern lapwing (Vanellus vanellus) on the green roof in Steinhausen,Canton Zoug.<br />
(Photo by A. Kaufmann)
40<br />
International <strong>Building</strong> & <strong>Infrastructure</strong> Technology Conference<br />
7-8 June 2011, Vistana Hotel, Penang, Malaysia<br />
Other research shows that green roofs house a large swathe of invertebrates in London, where at<br />
least 10% of which are rare or scarce, indicating the potential of green roofs’ as artificial habitats is<br />
vast (Kadas, 2006).<br />
From an aesthetic perspective the primary application of green roof is to provide a visually interesting<br />
vegetation layer of diverse texture <strong>and</strong> seasonal colour replacing a rock ballast or dark surface<br />
(Weiler, 2009). In fact the deep aesthetic discontent of concerned citizens <strong>and</strong> environmental activist<br />
with the status quo of the built environment is the trigger for Germany’s green roof movement<br />
(Werthmann, 2007).<br />
1.2 Green <strong>Building</strong> Rating <strong>Systems</strong><br />
Some expert has strong argument that green building is or will soon become a megatrend <strong>and</strong> building<br />
rating systems add objectivity <strong>and</strong> credibility to the process by offering st<strong>and</strong>ards <strong>and</strong> certification<br />
(Rock, 2010) . For credibility, a business must have clearly articulated, independently quantifiable <strong>and</strong><br />
verifiable st<strong>and</strong>ards, <strong>and</strong> it is not enough to have a set of published st<strong>and</strong>ard, <strong>and</strong> at same time selfevaluate<br />
<strong>and</strong> self-monitor the st<strong>and</strong>ards put in place. (Melaver; Mueller, 2009). Therefore a reliable<br />
rating system must have a st<strong>and</strong>ard by which success is defined <strong>and</strong> by having quantifiable<br />
components, <strong>and</strong> its components must be reviewed <strong>and</strong> verified by a third party. Only by doing this,<br />
people can compare <strong>and</strong> assess green buildings on a reliable <strong>and</strong> independent platform.<br />
In the US <strong>and</strong> Canada, a commercial green building is generally considered to be the one certified by<br />
the LEED green building rating system of the US Green <strong>Building</strong> Council (USGBC) or Canada Green<br />
<strong>Building</strong> Council. More than 98 percent of the certified green buildings in both countries come from this<br />
system (Yudelson, 2008). It is foreseeable that the similar will happen in Malaysia where people will<br />
recognize a building as green building only if the building is evaluated <strong>and</strong> certified by similar green<br />
building rating system.<br />
Knowing that a reliable <strong>and</strong> independent platform is needed, Malaysia’s construction industry players<br />
are absorbing other countries’ experience <strong>and</strong> at the same time developing elements that adapt local<br />
situations. The Green <strong>Building</strong> Index (GBI) is one of the myriad green rating system that has already<br />
been adopted by the UK (BREAM), US (LEED), Singapore (Green Mark), Japan (CASBEE), Australia<br />
<strong>and</strong> New Zeal<strong>and</strong> (Green Star). The GBI <strong>and</strong> as well as Green Mark are pioneering systems for<br />
measuring sustainability levels of buildings in a tropical zone.These evaluation <strong>and</strong> certification with<br />
these two rating systems come with cost just like other green rating systems.<br />
Comparison study between green building rating systems shows that one important gap appears to<br />
exist is many of the rating criteria are independently rated by cut-off values lacking an assessment of<br />
the tradeoffs between them. As a result, one may find two different combinations of scores that leading<br />
to a fulfillment of the same requirement (Smith et al, 2006). This study acknowledges such important<br />
gap <strong>and</strong> explores the impact of it to green roof technology <strong>and</strong> other green building technologies.<br />
1.3 Impact of Green <strong>Building</strong> Rating System<br />
As some green building rating system are put into implementation for years <strong>and</strong> steadily evolve into a<br />
mature system, researchers start to study about the various impacts of such rating system on<br />
constructors(Mago, 2007), small to medium sized enterprises(Lisowski, 2006) <strong>and</strong> higher education<br />
institutions (Chance, 2010). Researcher also highlight about the emerging significance of green<br />
building rating system for example LEED but little is known of the changes that have taken place from<br />
such implementation. This raise the question of some professionals adopting green building rating<br />
system as an article of faith when critical assessment seldom being carry out to evaluate the actual<br />
effectiveness of the green building rating system criteria (Zukowski, 2005). Therefore researchers <strong>and</strong><br />
built environment stake holders should assess <strong>and</strong> improve the green building rating systems,<br />
considering that these systems will have significant influence on the direction of green building<br />
implementation <strong>and</strong> sustainable development as a whole.<br />
The criteria <strong>and</strong> weight of scoring in green building rating systems certainly will influence built<br />
environment stakeholders’ decision in pursuing green building technologies. A sufficient weight of<br />
scoring in the rating system will stimulate the implementation of green roof technology for the<br />
construction projects that are adopting that particular green building rating system. However,<br />
insufficient weight of scoring will make green roof technology less attractive <strong>and</strong> eventually being left
41<br />
International <strong>Building</strong> & <strong>Infrastructure</strong> Technology Conference<br />
7-8 June 2011, Vistana Hotel, Penang, Malaysia<br />
out in the sustainable development process even though this technology have the potential to mitigate<br />
current environmental issues.<br />
2. METHODOLOGY<br />
The study methodology is partially adopted from a research exploring outer space technologies for<br />
sustainable buildings (Low, 2009) <strong>and</strong> will assess the potential score that can be achieved by the<br />
implementation of green roof technology based on various criteria <strong>and</strong> items in 3 different green<br />
building rating systems. The study is a simplified assessment just to explore the scoring performance<br />
of green roof technology under green building rating systems. The 3 selected rating systems are<br />
Leadership in Energy <strong>and</strong> Environmental Design (LEED), Green <strong>Building</strong> Index (GBI) <strong>and</strong> Singapore<br />
<strong>Building</strong> Construction Authority Green Mark <strong>and</strong> the assessment will based on the Non-Residential<br />
New Construction category. The potential scores will be compared in terms of the scoring in various<br />
criteria <strong>and</strong> also the maximum potential scoring weight.<br />
2.1 Criteria in LEED, GBI <strong>and</strong> Green Mark<br />
The three selected green building rating systems have varies criteria <strong>and</strong> weight of scoring.<br />
Table 2.1a. Leadership in Energy <strong>and</strong> Environmental Design-LEED 2009<br />
for New Construction <strong>and</strong> Major Renovations Criteria<br />
Criteria Possible Points<br />
1 <strong>Sustainable</strong> Sites (SS) 26<br />
2 Water Efficiency (WE) 10<br />
3 Energy <strong>and</strong> Atmosphere (EA) 35<br />
4 Materials <strong>and</strong> Resources (MR) 14<br />
5 Indoor Environmental Quality (IEQ) 15<br />
6 Regional Priority Credits (RP) 6<br />
7 Innovation <strong>and</strong> Design Process (ID) 4<br />
Total 110<br />
Table 2.1b. Green <strong>Building</strong> Index Non-Residential New Construction Criteria<br />
Criteria Possible Points<br />
1 Energy Efficiency (EE) 35<br />
2 Indoor Environmental Quality (EQ) 21<br />
3 <strong>Sustainable</strong> Site Planning & Management (SM) 16<br />
4 Materials <strong>and</strong> Resources (MR) 11<br />
5 Water Efficiency (WE) 10<br />
6 Innovation (IN) 7<br />
Total 100<br />
Table 2.1c. Singapore <strong>Building</strong> Construction Authority Green Mark<br />
New Non Residential <strong>Building</strong> Criteria<br />
Criteria Possible Points<br />
1 Part 1 Energy Efficiency 116<br />
2 Part 2 Water Efficiency 17<br />
3 Part 3 Environmental Protection 42<br />
4 Part 4 Indoor Environmental Quality 8<br />
5 Part 5 Other Green Features 7<br />
Total 190<br />
The tables above will be explained in detail in section 2.2.
42<br />
International <strong>Building</strong> & <strong>Infrastructure</strong> Technology Conference<br />
7-8 June 2011, Vistana Hotel, Penang, Malaysia<br />
2.2 Green Roof Technology Potential Scoring in Green <strong>Building</strong> Rating System<br />
The assessment of green roof technology will base on the requirements of LEED, GBI <strong>and</strong> Green<br />
Mark stated in their criteria <strong>and</strong> specific items. This study acknowledge the complex assessment<br />
process for each rating system, uniqueness of every green building project <strong>and</strong> also different possible<br />
outcome due to different opinion of assessor. Therefore, the focus of this study is not to do a detail<br />
evaluation on particular green building projects but to explore the scoring performance of green roof<br />
technology under different system. The scoring performance will have a significant impact influencing<br />
built environment stakeholders’ decision in pursuing green roof technology.<br />
Whenever green roof technology is stated as a criteria requirement fulfilment option, the assessment<br />
will consider green roof technology as the primary technology <strong>and</strong> award the potential maximum<br />
scoring points. In situations where green roof technology potentially serves only as a supporting<br />
technology in certain criteria <strong>and</strong> specific items, a pre-set of points will be deem as the contribution<br />
from green roof technology.<br />
The potential scores are summarised <strong>and</strong> put in tables as follow:<br />
Table 2.2a. Green Roof Technology Potential Score in Leadership in Energy <strong>and</strong> Environmental<br />
Design-LEED 2009 New Construction <strong>and</strong> Major Renovations<br />
1.<br />
Criteria / Items Points<br />
<strong>Sustainable</strong> Sites (SS)<br />
SS Credit 5.1: Site Development—Protect or Restore Habitat<br />
SS Credit 5.2: Site Development—Maximize Open Space<br />
SS Credit 6.1: Stormwater Design—Quantity Control<br />
SS Credit 6.2: Stormwater Design—Quality Control<br />
SS Credit 7.2: Heat Isl<strong>and</strong> Effect—Roof<br />
Water Efficiency (WE)<br />
WE Credit 1: Water Efficient L<strong>and</strong>scaping<br />
Energy <strong>and</strong> Atmosphere (EA)<br />
Materials <strong>and</strong> Resources (MR)<br />
MR Credit 4: Recycled Content<br />
Innovation <strong>and</strong> Design Process (ID)<br />
ID Credit 1: Innovation in Design<br />
Regional Priority Credits (RP)<br />
1<br />
-<br />
Total 8.5 (8.0**)<br />
*Green roof as supporting tool, **Points excluding Green roof as supporting tool<br />
Table 2.2b. Green Roof Technology Potential Score in Green <strong>Building</strong> Index Version 1.0<br />
1.<br />
Non-Residential New Construction (NRNC)<br />
1<br />
1<br />
1<br />
1<br />
1<br />
2<br />
-<br />
0.5*<br />
Criteria / Items Points<br />
Energy Efficiency (EE)<br />
EE1 Minimum EE Performance<br />
Indoor Environmental Quality (EQ)<br />
EQ12 External View<br />
<strong>Sustainable</strong> Site Planning & Management (SM)<br />
SM4 Environment Management: (A)Conservation (B)Open Space<br />
SM11 Stormwater Design – Quantity & Quality Control<br />
SM12 Greenery & Roof<br />
Materials <strong>and</strong> Resources (MR)<br />
MR2 Recycled Content Material<br />
MR3 Regional Material<br />
Water Efficiency (WE)<br />
WE3 Water Efficient L<strong>and</strong>scaping<br />
Innovation (IN)<br />
IN1 Innovation<br />
Total<br />
0.5*<br />
0.5*<br />
2<br />
1<br />
2<br />
0.5*<br />
0.5*<br />
0.5*<br />
1<br />
8.5 (6.0**)<br />
*Green roof as supporting tool, **Points excluding Green roof as supporting tool
43<br />
International <strong>Building</strong> & <strong>Infrastructure</strong> Technology Conference<br />
7-8 June 2011, Vistana Hotel, Penang, Malaysia<br />
Table 2.2b. Green Roof Technology Potential Score in - BCA Green Mark for New Non-Residential<br />
<strong>Building</strong>s (Version NRB/4.0)<br />
1.<br />
Weight of Scoring(%)<br />
Part 1 Energy Efficiency<br />
NRB 1-1 Thermal Performance of <strong>Building</strong> Envelope<br />
Part 2 Water Efficiency<br />
NRB 2-3 Irrigation System <strong>and</strong> L<strong>and</strong>scaping<br />
Part 3 Environmental Protection<br />
NRB 3-3 Greenery Provision<br />
NRB 3-7 Stormwater Management<br />
Part 4 Indoor Environmental Quality<br />
Part 5 Other Green Features<br />
NRB 5-1 Green Features <strong>and</strong> Innovations<br />
Criteria / Items Points<br />
Total<br />
8 (2*)<br />
0.5*<br />
3 (1*)<br />
3 (1*)<br />
-<br />
1<br />
15.5<br />
(11.5**)<br />
*Green roof as supporting tool, **Points excluding Green roof as supporting tool<br />
9.0<br />
8.0<br />
7.0<br />
6.0<br />
5.0<br />
4.0<br />
3.0<br />
2.0<br />
1.0<br />
0.0<br />
Green Roof Technology Weight of Scoring in Green <strong>Building</strong><br />
Rating <strong>Systems</strong><br />
7.7<br />
7.3<br />
8.5<br />
8.2<br />
6.0 6.1<br />
LEED GBI GM<br />
Type of Green <strong>Building</strong> Rating System<br />
Score Capturing Green Roof<br />
Tech as Supporting Tool<br />
Score Not Capturing Green Roof<br />
Tech as Supporting Tool<br />
Figure 2. Green Roof Technology Potential Weight of Scoring in LEED, GBI <strong>and</strong> GM<br />
Generally green roof technology have a weight of scoring ranging from 7.7% - 8.5% if the rating<br />
systems able to capture the role of green roof technology as a supporting tool, <strong>and</strong> a weight of scoring<br />
ranging from 6.0% - 7.3% if the rating systems fail to capture the role of green roof technology as a<br />
supporting tool. LEED scoring criteria is the rating system that most unlikely to overlook or missing out<br />
green roof technology as supporting tool in green building assessment with a difference of 0.1%. GBI<br />
scoring criteria is the rating system that most likely to overlook or missing out green roof technology as<br />
supporting tool in green building assessment with a difference of 2.5%.<br />
3. CONCLUSIONS<br />
The study is a simplified assessment to explore the possibility of using green building rating systems<br />
to gauge green roof technology performance. This assessment can be done on other green building<br />
technologies such as rainwater harvesting system ( Mohammed, T. A. et al, 2007), <strong>and</strong> the weight of<br />
scoring of different technologies can be used as an initial indication of built environment stakeholders’<br />
decision in pursuing green building technologies. Built environment stake holders can use this simple<br />
assessment to monitor the influence <strong>and</strong> impact of a particular green building technology. Green
44<br />
International <strong>Building</strong> & <strong>Infrastructure</strong> Technology Conference<br />
7-8 June 2011, Vistana Hotel, Penang, Malaysia<br />
building rating system researchers <strong>and</strong> developers can also utilised this simple assessment to improve<br />
the current rating system on capturing green building technology as a supporting tool for other<br />
sustainable development approach.<br />
REFERENCES<br />
Baumann, N., (2006). “Ground-Nesting Birds on Green Roofs in Switzerl<strong>and</strong>: Preliminary<br />
Observations”, Urban Habitats Electronic Journal Dec 2006. ISSN 1541-7115 Retrieved 1<br />
January, 2011, from Online:<br />
http://www.urbanhabitats.org/v04n01/birds_full.html#cite2<br />
Brenneisen, S., (2003). Ökologisches Ausgleichspotenzial von extensiven Dachbegrünungen—<br />
Bedeutung für den Arten- und Naturschutz und die Stadtentwicklungsplanung. Doctoral dissertation,<br />
Geographisches Institut Universität Basel, Switzerl<strong>and</strong>.<br />
Cartleton, H.f., Stovin, V., Beck, S.B.M., Davison J.B. (2010) “Green Roof; building energy savings <strong>and</strong><br />
the potential for retrofit.”, Energy <strong>and</strong> <strong>Building</strong>s 42 1582–1591<br />
Chance, S. M., “University Leadership In Energy <strong>and</strong> Environment Design: How Postsecondary<br />
Institutions Use The LEED Green <strong>Building</strong> Rating System”, Doctor of Philosophy dissertation, The<br />
College of William <strong>and</strong> Mary.<br />
Kadas, G., (2006) “Rare Invertebrates Colonizing Green Roofs in London”, Urban Habitats Electronic<br />
Journal Dec 2006. ISSN 1541-7115 Retrieved 1 January, 2011, from Online:<br />
http://www.urbanhabitats.org/v04n01/invertebrates_full.html<br />
Kosareo, L., Ries, R., (2007) “Comparative environmental life cycle assessment of green roofs”<br />
<strong>Building</strong> <strong>and</strong> Environment 42 (2007) 2606–2613<br />
Lisowski, J., (2006) “Using LEED Green <strong>Building</strong> Rating System For Small to Medium-sized<br />
Enterprises”, Master of Arts dissertation, Royal Road University.<br />
Low, S. P., Goh, X.T., (2009). “Exploring outer space technologies for sustainable<br />
buildings.” Facilities, 28(1/2), 31-45. Retrieved January 1, 2011, from ABI/INFORM Global.<br />
(Document ID: 1950996811).<br />
Mago, S., (2007) “Impact of LEED-NC Projects on Contractors <strong>and</strong> Construction Management Practice”,<br />
Master of Science dissertation, Michigan State University.<br />
Melaver, M., Mueller, P., (2009) The Green <strong>Building</strong> Bottom Line :The Real Cost of <strong>Sustainable</strong><br />
<strong>Building</strong>. Mc Graw Hill p.xv. p.111, p.225<br />
Mohammed, T. A., Mohd. Noor, M. J. M., Ghazali, A. H., (2007) “Checking the Adequacy of Rainwater<br />
Harvesting System for Housing <strong>and</strong> L<strong>and</strong>scaping.” ALAM CIPTA, International Journal on <strong>Sustainable</strong><br />
Tropical Design Research & Practice, 2 (1). pp. 19-26. ISSN 1823-7231<br />
Ngai, W.C. (1997) “Increasing flood risk in Malaysia: causes <strong>and</strong> solutions”, Disaster Prevention <strong>and</strong><br />
Management, Volume 6 Number 2, pp. 72-86<br />
Rock, J.. (2010). “Green <strong>Building</strong>: Trend or Megatrend?” Dispute Resolution Journal, 65(2/3), 72-<br />
77,103. Retrieved March 1, 2011, from ABI/INFORM Global. (Document ID: 2190502431)<br />
Smith, T.M., Feichlein, M., Suh, S., Huelman, Pat., (2006) “Green <strong>Building</strong> Rating <strong>Systems</strong> – A<br />
Comparison of The LEED And Green Globe <strong>Systems</strong> In The US.” University of Minnesota. p.19<br />
Weiler, S. K., Scholz-Barth, K., (2009) Green Roof <strong>Systems</strong>: A Guide to the Planning, Design, <strong>and</strong><br />
Construction of L<strong>and</strong>scape over Structure. John Wiley & Sons, Inc. p.10<br />
Werthmann, C., (2007) Green Roof: A Case Study. Princeton Architectural Press.p.25<br />
Wong, N.H. (2002) “Combating Urban Heat Isl<strong>and</strong> with Green <strong>and</strong> <strong>Sustainable</strong> Design”, Department<br />
of <strong>Building</strong>, National University of Singapore.<br />
Yudelson, J. (2008) Marketing Green <strong>Building</strong> Services : Strategies For Success. Elsevier p.5, p.6,<br />
p.127<br />
Zukowski, S. M., (2005) “From Green To Platinum: LEED In Professional Practice”, Doctor of<br />
Philosophy dissertation, The University of Winconsin-Milwaukee.
T112<br />
45<br />
International <strong>Building</strong> & <strong>Infrastructure</strong> Technology Conference<br />
7-8 June 2011, Vistana Hotel, Penang, Malaysia<br />
SUITABLE CRITERIA FOR THE LOCATION OF GATED COMMUNITY HOUSING<br />
Zurinah Binti Tahir 1 <strong>and</strong> Khadijah Binti Hussin 2<br />
1,2 Department of L<strong>and</strong> Administration <strong>and</strong> Development, Universiti Teknologi Malaysia,<br />
Skudai Malaysia<br />
1 zurinah2live@utm.my , 2 khadijah@utm.my<br />
ABSTRACT: Gated Communities set up without proper planning in housing developments could have<br />
a negative impact on urban planning <strong>and</strong> management. Issues arising from Gated Communities<br />
include matters relating to congestion, town management <strong>and</strong> the role of the local authorities. Looking<br />
at the current scenario, the planning that goes into determining suitable locations for housing<br />
development projects has not made the best use of technological tools. Consequently, decisions that<br />
are made are often unsuitable due to the lack of data or information that reflects the true spatial<br />
orientation <strong>and</strong> conditions of the selected location. This paper discusses the criteria that have been<br />
adopted in approving the development of existing Gated Communities. As a basis for developing<br />
analytical models for residential space usage <strong>and</strong> occupancy, such criteria would serve to identify<br />
areas suitable for the development of Gated Communities through the application of the Geographic<br />
Information System (GIS). The system of ‘location information’ being developed is very important to<br />
the Government, especially to urban planners in obtaining information related to location, area, <strong>and</strong><br />
address displayed in the form of maps. Such mapping information is very useful, especially when<br />
presented in a simplified format <strong>and</strong> shared by many users. The housing industry in Malaysia would<br />
greatly benefit by the application of such a system in the planning of gated communities.<br />
Keywords: analytic hierarchy process, approval criteria, gated community, Geographic<br />
Information System, housing, Multi-Criteria Analysis, Urban Planning, Weighted Linear<br />
Combination<br />
1. INTRODUCTION<br />
Modern urban planning must incorporate a long-term programme of planned housing development. To<br />
ensure that housing development is properly planned, especially with regard to the development of the<br />
gated communities, the government <strong>and</strong> the private sector need to develop an appropriate<br />
management system to enable its efficient operation <strong>and</strong> supervision. Rapid progress in information<br />
technology has brought many advantages <strong>and</strong> benefits in the areas of urban planning, for example, in<br />
the Geographic Information <strong>Systems</strong> (GIS) that has changed the way planning decisions are made.<br />
In recent years, the ‘Gated Community’ housing concept is becoming increasingly well-received as<br />
‘l<strong>and</strong>ed gated communities’ around the world, including the United States. This trend has extended to<br />
various parts of Europe, such as Portugal, Pol<strong>and</strong> <strong>and</strong> Sc<strong>and</strong>inavia (Nicholls, 2006). As the Gated<br />
Community housing concept is still new in Malaysia, there are no accurate statistics for the number of<br />
such communities in this country. Nevertheless, the development of these communities in Malaysia is<br />
gaining in popularity, especially in big cities like Kuala Lumpur, Penang <strong>and</strong> Johor Bahru. This is true<br />
also in other areas of high property value (Ismar M.S. Usman, Nur Akmal Goh Abdullah, Zuhairuse<br />
Md. Darus, Nik Lukman Nik Ibrahim, Mazlan Mohd Tahir, Abdul Halim Ismail, Azimin Samsul Tazilan,<br />
2006).<br />
There is presently no comprehensive legislation regulating gated housing communities in the country.<br />
There are even residential areas that exist not only as gated communities, but as ‘double gated<br />
communities’. The concept of the double gated community falls outside existing provisions governing<br />
gated communities. Many Gated Development Communities that have been planned primarily for<br />
enhanced security have in fact strayed from this original planning concept. If a gated community<br />
development is approved without proper study <strong>and</strong> regulation, development in the surrounding areas<br />
are likely to be affected in the future. This could have serious implications for subsequent development<br />
in the adjacent areas. The unregulated approval of Gated Communities could therefore have negative<br />
consequences for the long-term planning <strong>and</strong> management of the city.
46<br />
International <strong>Building</strong> & <strong>Infrastructure</strong> Technology Conference<br />
7-8 June 2011, Vistana Hotel, Penang, Malaysia<br />
Comprehensive planning is needed before any decision is made, taking into account the many<br />
relevant factors <strong>and</strong> sensitivities, as well as the views of all the parties involved (Mohd Sanusi, 2007).<br />
Establishing a suitable location for the development of a Gated Community requires a thorough review<br />
<strong>and</strong> analysis. Such planning is necessary to ensure that the area identified meets planning<br />
requirements in terms of the economic, social <strong>and</strong> environmental aspects.<br />
2. METHODOLOGY<br />
A study to assess the suitability of a location for a Gated Community entails several implementation<br />
stages that involve data acquisition, modeling <strong>and</strong> analysis (Figure 1). The GIS system, a key tool in<br />
this study, will be employed in the development of databases <strong>and</strong> in spatial analysis. In the analysis<br />
stage, two techniques, viz. the Multi-Criteria Analysis (MCA) <strong>and</strong> the Weighted Linear Combination<br />
(WLC), will principally be employed in ascertaining the suitability of a proposed location for the<br />
development of a Gated Community.<br />
Data acquisition,<br />
Software <strong>and</strong><br />
Hardware<br />
Stage 1: Establishment of<br />
the Database<br />
Spatial Data,<br />
Software <strong>and</strong><br />
system support<br />
Stage 2: Analysis<br />
Result evaluation<br />
Stage 3: Result Interpretations<br />
Analytical Assessment <strong>and</strong> Analytical Model<br />
Analytical Technique<br />
Database structure<br />
Combination of<br />
technique <strong>and</strong><br />
database<br />
Study Analysis<br />
Integration of Analytical<br />
Model <strong>and</strong> Analytical<br />
Technique<br />
Result<br />
Figure 1. The Methodology of the study<br />
Data requirement<br />
� Criteria for the<br />
location of<br />
Gated<br />
Communities<br />
Model selection<br />
(Suitability Index for<br />
Gated Community)<br />
<strong>and</strong> appropriate<br />
analytical technique<br />
(Multi-Criteria<br />
Analysis &<br />
Weighted Linear<br />
Combination)<br />
3. EXPERIMENTAL PROGRAMMES<br />
The developmental model uses the GIS software to identify the selection criteria to be used to assess<br />
the suitability of a proposed Gated Housing Community. Studies that determine appropriate selection<br />
criteria for sustainable development will be prepared in accordance with current principles <strong>and</strong><br />
concepts in urban planning. The present study focuses on analyzing various physical aspects,<br />
including l<strong>and</strong> suitability, to identify appropriate locations for the development of Gated Housing<br />
Communities in the District of Johor Bharu (Figure 2).
Rating by<br />
the Multi-<br />
Criteria<br />
Analysis<br />
(MCA)<br />
Figure 2: Location plan of the Johor Bharu District<br />
Analysis of suitability for the<br />
development of Gated Community<br />
housing<br />
Generation of spatial criteria data<br />
Justification <strong>and</strong> determination of<br />
the score value for each criterion<br />
St<strong>and</strong>ardisation of criteria score<br />
values<br />
Determination of weightage for<br />
each criterion using the AHP<br />
technique<br />
Construction of criteria map using<br />
the map overlay technique of the<br />
Weighted Linear Combination<br />
approach<br />
Suitable map<br />
47<br />
International <strong>Building</strong> & <strong>Infrastructure</strong> Technology Conference<br />
7-8 June 2011, Vistana Hotel, Penang, Malaysia<br />
GIS<br />
application<br />
Figure 3. Multi-Criteria Analysis (MCA) to determine the suitability of Gated Community locations
48<br />
International <strong>Building</strong> & <strong>Infrastructure</strong> Technology Conference<br />
7-8 June 2011, Vistana Hotel, Penang, Malaysia<br />
3.1 Multi-Criteria Analysis (MCA)<br />
The multi-criteria assessment of the GIS raster model is a decision-making process that combines<br />
spatial data in accordance with their importance. This procedure involves the production of maps of<br />
the relevant criteria (including constraining factors) used to identify suitable locations for Gated<br />
Community housing developments. The availability of relevant information is crucial to rational<br />
decision making <strong>and</strong> lays the foundation for better management efficiency in the future.<br />
The approach for this analysis is based on the Multi-Criteria Analysis (MCA) concept while the Analytic<br />
Hierarchy Process (AHP) technique will be used in its implementation. This technique links with the<br />
GIS to produce a weightage for each selected criterion (Figure 3). The AHP technique enhances the<br />
rationality <strong>and</strong> objectivity behind the decisions taken. To obtain a meaningful analysis that would be<br />
useful for planning purposes, it is essential that the MCA results are accurate before they are<br />
incorporated into the GIS database. Selection of the criteria for the suitability of a Gated Community<br />
location will also depend on the developmental status <strong>and</strong> topography of the particular housing area.<br />
Thirteen such criteria have been identified for Gated Community housing developments in Johor<br />
Bharu, namely:<br />
i) Crime rates<br />
ii) Urban areas<br />
iii) Network of roads<br />
iv) Proximity to villages<br />
v) Populated areas<br />
vi) Existing facilities (utilities)<br />
vii) Neighbourhood <strong>and</strong> surroundings<br />
viii) Appropriate l<strong>and</strong> use<br />
ix) Accessibility (distance <strong>and</strong> cost)<br />
x) Type of Gated Community housing<br />
xi) Tenure<br />
xii) Environmentally sensitive areas<br />
xiii) Topography<br />
3.2 Suitability Index Model<br />
A Suitability Index model can be constructed using the various functions of the GIS system as shown<br />
in Figure 4. These functions include input, display access, update <strong>and</strong> output. An appropriate<br />
Suitability Index model will be established using the Multiple Criteria Evaluation (MCE) technique in<br />
conjunction with the Weighted Linear Combination.<br />
Input Data (Criteria)<br />
� Crime rate<br />
� Major urban area<br />
� Road network<br />
� Not near villages<br />
� Residential area<br />
� Existing facilities<br />
(utilities)<br />
� Neighbourhood <strong>and</strong><br />
environment<br />
� Type of l<strong>and</strong> use<br />
� Accessibility<br />
� Type of housing<br />
� Topography (contour)<br />
� Sensitive environment<br />
site<br />
Step 2: Analytical<br />
technique<br />
Multi-<br />
Criteria<br />
Analysis<br />
(MCA)<br />
Step 2: Analytical<br />
technique Analisis<br />
Suitability Index<br />
model for Gated<br />
Community<br />
Suitability Map<br />
Step 3: Results<br />
Figure 4. Analysis of the Suitability Index model to determine the suitability of a proposed Gated<br />
Community location
49<br />
International <strong>Building</strong> & <strong>Infrastructure</strong> Technology Conference<br />
7-8 June 2011, Vistana Hotel, Penang, Malaysia<br />
The Suitability Index model is constructed by taking into consideration the combination of factors<br />
based on 12 criteria as shown in Figure 5. This analytical model will be developed conceptually to<br />
reflect the final map overlay. The results of the GIS analysis on the criteria will be presented in the<br />
form of st<strong>and</strong>ardised factor maps <strong>and</strong> maps depicting constraints. Integrating the multi-criteria<br />
evaluation techniques with the GIS enables decision-makers to differentiate or to change the<br />
weightage of the attribute scores of a factor map in assessing the suitability of a location<br />
Crime rate<br />
Urban area<br />
Road network<br />
Residents<br />
Facilities<br />
Neighbourhood<br />
Accessibility<br />
Housing<br />
Topography<br />
Tenure<br />
L<strong>and</strong> Use<br />
Environmentally<br />
sensitive areas<br />
Shape Index<br />
(SI)<br />
Regulation<br />
Network<br />
Analysis<br />
Opinion<br />
generation<br />
Classification<br />
Buffer<br />
Classification<br />
Classification<br />
Regulation<br />
Classification<br />
Classification<br />
Regulation<br />
Change to grid<br />
data (raster)<br />
<strong>and</strong> data<br />
classification<br />
Data layer<br />
Suitability map<br />
for location of<br />
Gated<br />
Community<br />
development<br />
Classification<br />
Figure 5: Suitability Index model for the development of Gated Community housing<br />
Map overlay using<br />
Weighted Linear<br />
Combination<br />
Map overlay<br />
(factor map <strong>and</strong><br />
constraints map)<br />
4. CONCLUSIONS<br />
The results of this study will provide an analysis of the physical aspects of the proposed location,<br />
including soil suitability, <strong>and</strong> identify criteria for acceptable locations for developing Gated<br />
Communities. The proposed criteria identified from such models will assist the local authorities in<br />
evaluating <strong>and</strong> monitoring the implementation of 'gated <strong>and</strong> guarded communities' (GC) in Johor<br />
Bharu. This will ensure that such developments do not conflict with the current tenets <strong>and</strong> practice of<br />
urban planning. At the same time, basic directives will be available to developers to design <strong>and</strong> build<br />
'gated <strong>and</strong> guarded communities' in compliance with the guidelines <strong>and</strong> st<strong>and</strong>ards adopted. The<br />
‘location information’ system being developed will assist urban planners make rational decisions. The<br />
system will yield relevant information based on set criteria for the development of future Gated<br />
Communities. Such information can be presented in a simplified map format <strong>and</strong> shared by many<br />
users. Hence urban planning, especially with regard to gated communities, will be greatly enhanced.<br />
This would augur well for the housing industry in Malaysia.
50<br />
International <strong>Building</strong> & <strong>Infrastructure</strong> Technology Conference<br />
7-8 June 2011, Vistana Hotel, Penang, Malaysia<br />
REFERENCES<br />
Ahris Yaakub, Fauziah Johar, Mohamad Anuar Maidin, dan Ezrein Faizal Ahmad (2004b). GIS <strong>and</strong><br />
Decision Support <strong>Systems</strong> For Malaysian Development Plan Studies. Kertas Kerja International<br />
Conference on SPDSS 2004. Universiti Islam Antarabangsa Malaysia Kuala Lumpur.<br />
Azimuddin Bahari (2007). Latest Amendment of the Strata Title Act 1985 <strong>and</strong> the Incorporation of<br />
Gated Community Scheme (GACOS), a paper presented in Seminar on Southern Johor Development:<br />
Prospects <strong>and</strong> Challenges in the 21 st Century, 27-28 th June 2007, The M-Suit Johore.<br />
Azimudin Bahari (2005). Regulatory <strong>and</strong> practical Aspects of Gated Community Projects’, a paper<br />
presented in a Seminar on Gated Community Projects: Regulatory <strong>and</strong> Contractual Issues, organized<br />
by Lexis-Nexis & MLJ, Prince <strong>and</strong> Residence Hotel Kuala Lumpur. 28 July 2005, p.4.<br />
Aziz Shafie (2008). Aplikasi Sistem Maklumat Geografi (GIS) Bagi Mengenal pasti Kawasan Berisiko<br />
Tinggi Bagi Penyakit Demam Denggi dan Demam Denggi Berdarah di Georgetown, Pulau Pinang.<br />
Universiti Sains Malaysia.<br />
Azlinor Sufian (2005). A Legal Perspective on Gated Community in Malaysia, a paper presented in 8 th<br />
International Conference of the Asian Planning schools Accosiation, 11-14 th September.<br />
Chris Webster (2001). Gated Cities of Tomorrow. The Town Planning Review, Vol. 72, No. 2, pp. 149-<br />
170 , Published by: Liverpool University Press.<br />
Clarke, P (2004). Developing a Gated Community , seminar Gated <strong>and</strong> Guarded Communities , 17<br />
April 2004, Hotel Istana in Kuala Lumpur.<br />
Clarke, K. (1999). Getting started with Geographic Information <strong>Systems</strong> (2nd ed.). New York: Prentice<br />
Derek Clifford Nicholls (2006). L<strong>and</strong> Management, Strata Title And Gated Communities: International<br />
Perspectives.<br />
Edward J. Blakely <strong>and</strong> Mary Gail Snyder (1997). Fortress America-Gated Communities in the United<br />
State<br />
Eric Damian Kelly (2010). Community Planning: An Introduction to the Comprehensive Plan<br />
Georjeanna Wilson-Doenges (2000). An Exploration of Sense of Community <strong>and</strong> Fear of Crime in<br />
Gated Communities, University of Wisconsin-Green Bay DOI: 10.1177/00139160021972694,<br />
Environment <strong>and</strong> Behavior 32: 597<br />
Hamdan Mohd Kassim (2006). Pembangunan Pangkalan Data Sistem Maklumat Geografi Negeri<br />
Sembilan Darul Khusus (gis9) : Aplikasi Jabatan Perancangan B<strong>and</strong>ar dan Desa, Kertas Seminar<br />
Jabatan Perancangan B<strong>and</strong>ar dan Desa, Negeri Sembilan Darul Khusus<br />
Ismar M.S. Usman, Nur Akmal Goh Abdullah, Zuhairuse Md. Darus, Nik Lukman Nik Ibrahim, Mazlan<br />
Mohd Tahir, Abdul Halim Ismail, Azimin Samsul Tazilan (2007). Komuniti Berpagar, Perkembangan<br />
dan Isu-Isu Sosial, Department of Architecture, Faculty of Engineering, Universiti Kebangsaan<br />
Malaysia, Bangi, Selangor, Malaysia<br />
Jieming Zhu (2010). Symmetric Development of Informal Settlements <strong>and</strong> Gated Communities:<br />
Capacity of the State the Case of Jakarta, Indonesia. Asia Research Institute, working paper Series<br />
No.135, February 2010<br />
Jones, P, et.al (2003). Gated Residential Developments in the United Kingdom. Management<br />
Research News, Vol 26(12), Page 12-19<br />
Karina L<strong>and</strong>man (2002). Planning in the African Context: Reconsidering Current Approaches to Gated<br />
Communities in South Africa, Csir <strong>Building</strong> <strong>and</strong> Construction Technology, 18-20 september 2002<br />
Mohd Sanusi S. Ahamad (2007). Kesan Pembuat Keputusan Terhadap Analisis Kesesuaian Tapak<br />
Kawasan Perindustrian GIS, Kertas Seminar, Pusat Pengajian Kejuruteraan Awam, Universiti Sains<br />
Malaysia<br />
Mohd Rizal Idris (2005). Mengenal pasti Tapak Stesyen Pemindahan Sisa Pepejal Dengan<br />
Menggunakan sistem maklumar geografi. Tesis Ijazah Sarjana Sains, Universiti Putra Malaysia<br />
Narimah Sumat. Aplikasi Sistem Maklumat Dalam Pembentukan Model Pembangunan Guna Tanah<br />
B<strong>and</strong>ar. Laporan Akhir Geran Penyelidikan Jangka Pendek <strong>USM</strong>, 305/PHUMANITI/635008
51<br />
International <strong>Building</strong> & <strong>Infrastructure</strong> Technology Conference<br />
7-8 June 2011, Vistana Hotel, Penang, Malaysia<br />
Norazmin Adibah binti Othman (2007). Kriteria Perancangan dalam Pembangunan Perumahan<br />
Komuniti Berpagar di Kawasan Dewan B<strong>and</strong>araya Kuala Lumpur. Sarjana Sains (Pentadbiran dan<br />
Pembangunan Tanah). Fakulti Kejuruteraan dan Sains Geoinformasi, Universiti Teknologi Malaysia,<br />
Skudai, Johor<br />
Nor Eeda Binti Haji Ali (2006). Pembangunan Komuniti di Dalam Perlaksanaan Konsep B<strong>and</strong>ar<br />
Selamat. Tesis Sarjana Sains Perancangan Perumahan, Fakulti Alam Bina Universiti Teknologi<br />
Malaysia<br />
Norhazliana Ezreen Harun (2006). Kajian penentuan kawasan bukit berisiko menggunakan sistem<br />
maklumat geografi (GIS). Tesis Sarjana Sains ,Pentadbiran dan Pembangunan Tanah Universiti<br />
Teknologi Malaysia<br />
Richard Grant , The Emergence of Gated Communities in a West African Context: Evidence From<br />
Greater Accra, Ghana . University of Miami, Bellwether Publishing, Ltd. ISSN-0272-3638, DOL-<br />
10.2747/0272-3638.26.8.661<br />
Samer Bagaeen, Ola Uduku (1963). Gated Communities: Social Sustainability in Contemporary <strong>and</strong><br />
Historical Gated Development. ISBN: 978-1-84407-519-5<br />
S<strong>and</strong>y Radhitya Akbar (2009). Aplikasi Sistem Informasi Geografis Dalam Penentuan Lokasi Rawan<br />
Kecelakaan di Jalan Tol Purbaleunyi, simposium xii fstpt, Universitas Kristen Petra Surabaya, 14<br />
november 2009<br />
Shaharuddin Haji Musa (2005). Skim Komuniti Berpagar di Malaysia: Isu-Isu Pembangunannya<br />
Terhadap Pemilikan. Tesis Sarjana Sains (Pentadbiran dan Pembangunan Tanah), Fakulti<br />
Kejuruteraan dan Sains Geoinformasi, Universiti Teknologi Malaysia, Skudai, Johor<br />
Thomas W. Sanchez, Robert E. Lang, & Dawn M. Dhavale (2005). Security versus Status? A First<br />
Look at the Census’s Gated Community Data. At: DOI: 10.1177/0739456X04270127 Journal of<br />
Planning Education <strong>and</strong> Research 2005 24: 281<br />
US Geological Survey Science for a Changing World. (2005b). Geographical Information <strong>Systems</strong> in<br />
education. Dimuat turun Julai 20, 2005, daripada http://rockyweb. cr.usgs .gov/outreach! giseduc .html
T113<br />
52<br />
International <strong>Building</strong> & <strong>Infrastructure</strong> Technology Conference<br />
7-8 June 2011, Vistana Hotel, Penang, Malaysia<br />
STRESS-STRAIN RELATIONSHIP FOR MASONRY MODELLING<br />
Ahmed Hasan Alwathaf 1 , Mohd Saleh Jaafar 2 ,<br />
Waleed A. Thanoon 3 , Jamaloddin Noorzaei 4<br />
1 Civil Engineering Department, Faculty of Engineering,<br />
Sana’a University, Sana’a, Yemen, P. O. Box. 12544<br />
2, 4 Civil Engineering Department, Faculty of Engineering, University Putra Malaysia, 43400<br />
UPM-Serdang, Malaysia<br />
3 College of Engineering <strong>and</strong> Architecture, University of Nizwa, Nizwa, Oman<br />
1 aalwathaf@yahoo.com , 1 aalwathaf@suye.ac<br />
ABSTRACT: Stress-strain relationship of masonry material is essential to predict strength <strong>and</strong><br />
deformation of masonry structures in analytical modelling. In this study, the best fit equation of<br />
experimental data for masonry block <strong>and</strong> grout under uniaxial compression test is proposed.<br />
Numerical technique is proposed to obtain appropriate material parameter for both ascending <strong>and</strong><br />
descending parts. Accurate simulation for the test results is attained by the proposed equation.<br />
Keywords: stress-strain, masonry, compression, modelling, numerical technique.<br />
1. INTRODUCTION<br />
Using stress-strain relationship that can describe accurately the behaviour of the masonry materials is<br />
essential to predict the actual strength <strong>and</strong> deformation of the masonry structure. This fact is more<br />
significant when the system consists of different constituents (block units, grout, mortar (if any)) in<br />
which every material has different stress-strain relation <strong>and</strong> required to be discretized separately in<br />
the finite element model to incorporate the effects of interactions of these constituents.<br />
Several mathematical models have been developed for simulating the experimental stress-strain<br />
relation for concrete under uniaxial compression. Some of these models developed for plain concrete<br />
<strong>and</strong> other models developed for concrete under different condition such as confinement by<br />
reinforcement (Park <strong>and</strong> Paulay 1975).<br />
In view of the fact that plain concrete is the actual status of the masonry concrete block <strong>and</strong> grout, the<br />
stress-strain relations reviewed in this section have been developed for plain concrete which is also<br />
applicable for concrete masonry block (Alwathaf, 2006). The reviewed stress-strain models are shown<br />
in Table 1 with the important features. The coefficients in the table were recommended by the<br />
respective authors in their studies (Alwathaf, 2006).
Table 1. Reviewed Stress-Strain Relations<br />
53<br />
International <strong>Building</strong> & <strong>Infrastructure</strong> Technology Conference<br />
7-8 June 2011, Vistana Hotel, Penang, Malaysia<br />
Reference Equation Feature Remarks<br />
Hognestad<br />
(1951)<br />
Desayi &<br />
Krishnan<br />
(1964)<br />
Saenz<br />
(1964)<br />
Wang et al.<br />
(1978)<br />
Carreira &<br />
Chu 1985)<br />
Thanoon<br />
(1997)<br />
2<br />
� � � � � �<br />
� � � �<br />
�<br />
�<br />
�<br />
�<br />
o 2 � �<br />
� � o � � � o � ��<br />
For ascending<br />
� � � � � � o �<br />
� � � � �<br />
�<br />
�<br />
�<br />
�<br />
o 1 0.<br />
15 �<br />
� � � u � � o ��<br />
For descending<br />
Eo�<br />
� � 2<br />
1 � ( � / � o )<br />
For ascending<br />
& descending<br />
Eo�<br />
� �<br />
1 � ( Eo<br />
/ Es<br />
� 2)(<br />
� / � o ) � ( � / � o )<br />
�<br />
�<br />
2<br />
� A(<br />
� / � o ) � B(<br />
� / � o )<br />
� o �<br />
�1�<br />
C(<br />
� / � o ) � D(<br />
� / � o )<br />
� 2<br />
A(<br />
� � ) �<br />
�<br />
�<br />
�<br />
2<br />
For ascending<br />
A=1.300501<br />
B= -0.835818<br />
C=-0.699498<br />
D=0.1641812<br />
o o<br />
�<br />
For ascending<br />
A<br />
A �1<br />
� ( � � o )<br />
�<br />
� � � o �<br />
�(<br />
� / � o )<br />
2. EXPERIMENTAL TEST<br />
3<br />
A(<br />
� / �<br />
�<br />
o )<br />
2<br />
�<br />
� B(<br />
� / � o ) � C(<br />
� / � o ) � D�<br />
Es= σo /εo should be<br />
equal to 2<br />
(Eo/Es) should be<br />
equal or greater<br />
than 2<br />
For descending<br />
A=0.349777<br />
B= -0.104963<br />
C=-1.650222<br />
D=0.895036<br />
1<br />
& descending 1 ( ) E<br />
A �<br />
�<br />
For ascending<br />
& descending<br />
s o E<br />
For plain concrete:<br />
A=1.1<br />
B=-1.3<br />
C= 0.75<br />
D=0.65<br />
2.1 Compression test of block <strong>and</strong> grout<br />
The objectives of these tests are to find stress-strain relation <strong>and</strong> compressive strength of the<br />
interlocking block masonry constituents. Specimens of these tests are the individual concrete block<br />
units <strong>and</strong> grout cylinders. The block units used in the test specimens have been produced especially<br />
for the current study using a semi automatic block making machine.<br />
2.2 Compression test of block <strong>and</strong> grout results<br />
Figure 1 shows typical stress-strain curves obtained from the tests. The curves indicate that stronger<br />
material is more brittle than weaker material. This is consistent with the observed test phenomenon<br />
where the failure was quite sudden for blocks having high compressive strength. On the other h<strong>and</strong>,<br />
load decreased gradually after the peak in the grout that having low strength. First sign of failure was<br />
observed approximately at 80% of the maximum load as pulling out small parts from the block. It can<br />
be also observed that the modulus of elasticity increases with compressive strength <strong>and</strong> the<br />
descending parts of these curves have high negative slopes after the peak. In contrast to block<br />
stress-strain curves, the peak of the grout cylinders are flatter <strong>and</strong> descending portion decreases<br />
gradually with small negative slope.
54<br />
International <strong>Building</strong> & <strong>Infrastructure</strong> Technology Conference<br />
7-8 June 2011, Vistana Hotel, Penang, Malaysia<br />
Figure1. Typical Stress-Strain Curve of Block <strong>and</strong> Grout under Compression Test<br />
3. PROPOSED STRESS-STRAIN RELATION<br />
In this study, the best fit equation of the experimental data of masonry block <strong>and</strong> grout under uniaxial<br />
compression test for both ascending <strong>and</strong> descending parts is adopted. It can be expressed as:<br />
A(<br />
� � o ) � o<br />
� � (1)<br />
A<br />
A �1<br />
� ( � � )<br />
o<br />
where<br />
σ , ε instantaneous values of the stress <strong>and</strong> the strain respectively<br />
σo , εo the ultimate stress (peak) <strong>and</strong> the corresponding strain respectively<br />
A a coefficient called material parameter depends on the shape of the stress- strain diagrams.<br />
Equation 1 is capable of simulating the stress-strain relation for different masonry materials <strong>and</strong> can<br />
be incorporated efficiently into the biaxial stress model. The material parameter, A, depends on the<br />
material stress-strain behaviour <strong>and</strong> takes a constant value for each material.<br />
An accurate numerical technique has been proposed in this study to find the suitable material<br />
parameter (A). This technique improves the ability of Eq. 1 to describe different curvature in the<br />
ascending <strong>and</strong> also in the descending part. In this study, nonlinear regression analysis is used to<br />
obtain the material parameter (A) of the selected stress-strain relation based on the entire diagram test<br />
data not only the data at the origin (Carreira <strong>and</strong> Chu, 1985). Nonlinear regression is a method of<br />
finding a nonlinear model of the relationship between the dependent variable <strong>and</strong> a set of independent<br />
variables (Bates <strong>and</strong> Watts, 1998). The dependent variable in Eq. 1 is the stress ratio (σ/σo) after<br />
normalizing the stress using the maximum stress at the peak, σo. Furthermore, the independent<br />
variable is the strain ratio (ε/εo).<br />
Figure 2 shows the experimental test data <strong>and</strong> the best fit curve drawn by Eq. 1. A comparison with<br />
the well-known formula suggested by Saenz (1964), which is frequently used for modelling of<br />
compressive stress-strain curves of masonry <strong>and</strong> concrete under biaxial stress state (Cerioni <strong>and</strong><br />
Doinda, 1994; Chen, 1982), is also shown in Fig. 2. Unlike Eq. 1, Saenz's formula fails to represent<br />
the variation of curvatures of the stress-strain relations for different materials which in turn makes<br />
Saenz's equation more suitable for masonry macro-model as used by some researchers (Cerioni <strong>and</strong><br />
Doinda, 1994). Another condition that restricts using Saenz's formula is the ratio of the tangential<br />
modulus of elasticity at the origin to the secant modulus at the peak which should be more than or<br />
equal to 2, otherwise concave curve at the low stress level will be produced.
55<br />
International <strong>Building</strong> & <strong>Infrastructure</strong> Technology Conference<br />
7-8 June 2011, Vistana Hotel, Penang, Malaysia<br />
Figure 2. Comparison of Test Data <strong>and</strong> the Best Fit Relation<br />
4. CONCLUSIONS<br />
It has been found that the stress-strain data of the masonry materials (block <strong>and</strong> grout) has been<br />
accurately fitted by the employing stress-strain equation after using the proposed numerical technique<br />
by means of the whole diagram data of the compression test. The proposed numerical technique for<br />
the material parameter yields accurate simulation for the stress-strain behaviour of the masonry<br />
material under compression for ascending <strong>and</strong> descending parts. The proposed stress-strain relational<br />
is easily incorporated in the masonry modelling for any numerical investigation.<br />
REFERENCES<br />
Alwathaf, A.H. (2006). Development of Finite Element Code for Non-linear Analysis of Interlocking<br />
Mortarless Masonry System, PhD thesis, Civil Engineering Department, University Putra Malaysia.<br />
Bates, D. M. <strong>and</strong> Watts, D. G. (1998). Nonlinear Regression <strong>and</strong> Its Applications. Wiley, New York.<br />
Carreira, D.J. <strong>and</strong> Chu, K.C. (1985). Stress-Strain Relationship for Plain Concrete in Compression.<br />
ACI Journal, Vol. 82, pp. 797-804.<br />
Cerioni, R. <strong>and</strong> Doinda, G., (1994). A Finite Element Model for the Nonlinear Analysis of Reinforced<br />
<strong>and</strong> Prestressed Masonry Wall. Computer <strong>and</strong> Structures, Vol. 53, pp.1291-1306.<br />
Chen, W.F. (1982). Plasticity in reinforced concrete, McGraw-Hill Book Company. USA.<br />
Desayi, P. And Krishnan, S. (1964). Equation for the Stress-Strain Curve of Concrete. ACI Journal,<br />
Vol. 61, No.3, pp. 345-350.<br />
Hognestad, E. (1951). A Study Of Combined Bending And Axial Load In Reinforced Concrete<br />
Member, University Of Illinois Engineering Experimental Station, Bulletin Series No. 399.<br />
Park, P. <strong>and</strong> Paulay, T. (1975). Reinforced Concrete Structures. John Wiley & Sons Inc. USA.<br />
Saenz, L.P. (1964). Discussion of “Equation for the stress-strain curve of concrete,” by Desayi <strong>and</strong><br />
Krishnan. ACI journal, Vol. 61, No.9, pp. 1229-1235.<br />
Thanoon, W. A. (1997). Modelling of Stress-Strain Relation of Steel Fibre Concrete, Proceeding of the<br />
5 th International Conference on Concrete Engineering <strong>and</strong> Technology, Universiti Malaya, Kuala<br />
Lumpur.<br />
Wang, P. T., Shah, S. P. <strong>and</strong> Naaman, A. E. (1978). Stress-Strain Curves of Normal <strong>and</strong> Lightweight<br />
Concrete in Compression. ACI Journal, Title No. 75-62, pp. 603-611.
T114<br />
56<br />
International <strong>Building</strong> & <strong>Infrastructure</strong> Technology Conference<br />
7-8 June 2011, Vistana Hotel, Penang, Malaysia<br />
THE NEEDS OF INDUSTRIALISED BUILDING SYSTEM IN MALAYSIA<br />
Muhamad Azani Yahya 1 , Suriyadi Sojipto 2 , Ahmad Shahrir Ismail 3<br />
1, 2, 3 Civil Engineering Department, Faculty of Engineering<br />
Universiti Pertahanan Nasional Malaysia,<br />
57000 Kem Sungai Besi, Kuala Lumpur<br />
1 azani@upnm.edu.my, 2 suriyadi@upnm.edu.my, 3 shahrir@upnm.edu.my<br />
ABSTRACT: The new approach in changes to new perspective of construction industry depending on<br />
the concept those focus on improving construction efficiency. Excellence in construction phase can<br />
help raise productivity <strong>and</strong> change the paradigm of current lacking view. The needs to be a greater<br />
concentration on achieving a better construction which meets the needs of the end user have to be<br />
focus as an improvement aspect on conventional construction process. Modernizing construction<br />
using Industrialised <strong>Building</strong> System (IBS) seems to be one of construction improvement aspect in<br />
Malaysia. IBS is a construction system that is built using pre-fabricated components. Questionnaire<br />
surveys have been distributed to 30 respondents which involved in construction phase to see the<br />
perception on IBS implementation in Malaysia. To validate the findings, schedule simulation was done<br />
on replacement elements of conventional construction process using IBS elements <strong>and</strong> the result<br />
shown IBS offer a principle of schedule compression. Construction players agreed that this method<br />
offer reduction of construction time, enhance construction efficiency, reduce construction wastage,<br />
decreased complexity <strong>and</strong> ensure the successes of project delivery.<br />
Key Words: Industrialised <strong>Building</strong> System, schedule simulation, modernizing construction<br />
1. INTRODUCTION<br />
Construction is a hugely important industry. Excellence in construction phase can help raise<br />
productivity <strong>and</strong> change the paradigm of current lacking view. The needs to be a greater concentration<br />
on achieving a better construction which meets the needs of the end user have to be focus as an<br />
improvement aspect on conventional construction process. Modernizing construction using<br />
Industrialised <strong>Building</strong> System (IBS) seem to be one of construction improvement aspect in Malaysia.<br />
IBS is a construction system that is built using pre-fabricated components. The general view of the<br />
construction process is that it is in ordered, linear phenomenon, which can be organized, planned <strong>and</strong><br />
managed top down. The frequent failures to complete construction projects on budget <strong>and</strong> schedule<br />
give rise to thinking that the process maybe not is as ordered <strong>and</strong> predictable in its nature as it may<br />
look (Bertelsen, 2002). A closer examination reveals that construction is indeed a complex, non linear<br />
<strong>and</strong> dynamic phenomenon which often exists on the edge of chaos. Construction projects are in<br />
general rich in plan failure, delays, cost overruns <strong>and</strong> grief, indeed more so than successes. The<br />
project itself as an assembly-like process was often more complicated, parallel <strong>and</strong> dynamic. The<br />
mistake is the ordered view of the surrounding world. All supply chains are believed to be made in<br />
accordance with the project’s schedule. All resources such as equipments <strong>and</strong> workers are supposed<br />
to st<strong>and</strong>by, ready for the project’s beck <strong>and</strong> call. However, this is not the way the world operates. This<br />
happened because of the concept of site production. Every item seems to be done in-situ. Since 1998,<br />
the Construction Industry Development Board of Malaysia has been actively promoting the use of<br />
Industrialised <strong>Building</strong> System (IBS) in the Malaysian construction industry. The existing of IBS is to<br />
realign <strong>and</strong> change the paradigm of the conventional construction process which was lack of<br />
efficiency.<br />
2. BACKGROUND OF INDUSTRIALISED BUILDING SYSTEM (IBS)<br />
Industrialsed <strong>Building</strong> System (IBS) has already utilized in Malaysia since 1960’s (IBS Digest, 2005).<br />
IBS is the way forward for construction players to make leaps <strong>and</strong> bounds progress in the construction<br />
industry. To date there has been no one commonly-accepted or agreed definition of IBS. However,
57<br />
International <strong>Building</strong> & <strong>Infrastructure</strong> Technology Conference<br />
7-8 June 2011, Vistana Hotel, Penang, Malaysia<br />
there are a few definitions by researchers who studied into this area previously were found through<br />
literature. Rahman <strong>and</strong> Omar (2006) defined IBS as a construction system that is built using prefabricated<br />
components. The manufacturing of the components is systematically done using machine,<br />
formworks <strong>and</strong> other forms of mechanical equipment. The components are manufactured offsite <strong>and</strong><br />
once completed will be delivered to construction sites for assembly <strong>and</strong> erection. Parid (1997)<br />
defined IBS as a system which use industrialised production technique either in the production of<br />
component or assembly of the building or both. Lessing, et. al. (2005) defined IBS as an integrated<br />
manufacturing <strong>and</strong> construction process with well planned organisation for efficient management,<br />
preparation <strong>and</strong> control over resources used, activities <strong>and</strong> results supported by the used of highly<br />
developed components. Trikha (1999) defined IBS as a system in which concrete components<br />
prefabricated at site or in factory are assembly to form the structure with minimum in situ<br />
construction. IBS was also defined as a set of interrelated element that act together to enable the<br />
designated performance of the building (Warszawski, 1999). Esa <strong>and</strong> Nurudin (1998) defined IBS as<br />
continuum beginning from utilising craftsmen for every aspect of construction to a system that make<br />
use of manufacturing production in order to minimise resource wastage <strong>and</strong> enhance value end<br />
users. Junid (1986) defined IBS as process by which components of building are conceived, planned<br />
<strong>and</strong> fabricated, transported <strong>and</strong> erected at site. The system includes balance combination between<br />
software <strong>and</strong> hardware component. The software element include system design, which is complex<br />
process of studying the requirement of the end user, market analysis <strong>and</strong> the development of st<strong>and</strong>ardize<br />
component. Chung <strong>and</strong> Kadir (2007) defined IBS as a mass production of building components either<br />
in factory or at site according to the specification with st<strong>and</strong>ard shape <strong>and</strong> dimensions <strong>and</strong> transport<br />
to the construction site to be re-arranged with certain st<strong>and</strong>ard to form a building. All the above<br />
definitions emphasized on prefabrication, off-site production <strong>and</strong> mass production of building<br />
components as the main characteristic of IBS. The focal of discussion in the study synergizes the key<br />
concept of IBS as defined as follows: A construction technique in which components are manufactured<br />
in a controlled environment (on or off site), transported, positioned <strong>and</strong> assembled into a structure<br />
with minimal additional site works (CIDB, 2003).<br />
2.1 IBS ENVIRONMENT IN MALAYSIA<br />
The usage of IBS has been implemented stage by stage in the building industry (Harun et. al., 2009).<br />
The construction industry <strong>and</strong> private sector assume an important role in generating wealth <strong>and</strong><br />
improving the quality of life for Malaysians through the translation of the government’s socio-economic<br />
policies into social <strong>and</strong> economic infrastructures <strong>and</strong> building (CIDB, 2007). Meaning to say that<br />
construction industry in Malaysia was not st<strong>and</strong> alone sector but it brings together many others related<br />
sector including manufacturing. That’s why the usage of IBS should tremendously been implement to<br />
change the norm of practiced. Figure 1 defines the construction industry value chain, as it involves<br />
multiple stakeholders at different stages of the value chain <strong>and</strong> key sectors that could leverage on the<br />
construction industry.<br />
Figure 1. Enabler of Government’s Socio-Economic Policies.<br />
Source: CIMP 2006-2001, CIBD (2007)
58<br />
International <strong>Building</strong> & <strong>Infrastructure</strong> Technology Conference<br />
7-8 June 2011, Vistana Hotel, Penang, Malaysia<br />
In Malaysia, the usage of IBS gives the opportunity to the construction industry to be more matured<br />
<strong>and</strong> it can be consider as modernizing method. The IBS, which enables on-site prefabricated or<br />
building components manufactured at factories, will enable cost saving <strong>and</strong> quality improvement<br />
through the reduction of labour intensity <strong>and</strong> construction st<strong>and</strong>ardization. Apart from this, it offers<br />
minimal wastage, less site materials, cleaner <strong>and</strong> neater environment, controlled quality <strong>and</strong> lower<br />
construction cost. Table 1 show the benefits of IBS compare from conventional construction system.<br />
Table 1. Benefits of IBS From Literature<br />
Item Benefits Supporting Statement<br />
1<br />
Reduce remittances by<br />
foreign workers<br />
2 Enhance efficiency<br />
3 Produce better product<br />
4<br />
5<br />
Reduce wastage, less<br />
site materials, costs,<br />
cleaner <strong>and</strong> neater<br />
environment<br />
Higher quality of<br />
component<br />
6 Reduce labour at site<br />
7 Faster completion<br />
8<br />
Not affected by adverse<br />
weather condition<br />
9 Flexible design<br />
*Extract literature from Haron et. al., 2009<br />
2.2 IBS Barriers in Malaysia<br />
The Malaysian government aimed to achieve 100 percent usage<br />
of IBS <strong>and</strong> to reduce 15% of foreign workers in the construction<br />
industry (Bernama, 2006)<br />
Construction industry is driven towards the adoption of an<br />
integrated <strong>and</strong> encouraging key players in the construction<br />
industry to produce <strong>and</strong> utilize pre-fabricated <strong>and</strong> mass<br />
production of the building at their work sites. This will help to<br />
enhance the efficiency of construction process, allowing a<br />
higher productivity, quality, time <strong>and</strong> cost saving (CIDB, 2004)<br />
IBS promises elevated levels of expertise throughout the<br />
industry, from manufacturers, installers, engineers, planners,<br />
designers <strong>and</strong> developers. The benefits of IBS will ultimately<br />
produce better products for the population (CIDB, 2003)<br />
Enables on-site prefabricated components manufactured at<br />
factories offer that benefits (CIDB, 2003).<br />
Attainable through careful selection of materials, use of<br />
advanced technology <strong>and</strong> strict quality assurance control.<br />
Prefabrication takes place at a centralized factory, thus reducing<br />
labour requirement at site. This is true when high degree of<br />
mechanization is involved (Warszawski, 1999)<br />
Casting of precast element at factory <strong>and</strong> foundation work at site<br />
can occur simultaneously. This provides earlier occupation of<br />
the building, thus reducing interest payment or capital outlays<br />
(Waleed et. al., 2003)<br />
Construction operation is not affected by adverse weather<br />
condition because prefabricated component is done in a factory<br />
controlled environment (Waleed et. al., 2003)<br />
Allows flexibility in architectural design in order to minimize the<br />
monotomy of repetitive facades (Warszawski, 1999). IBS<br />
provides flexibility in the design of precast element as well as in<br />
construction so that different systems may produce their own<br />
unique prefabrication construction methods (Zaini, 2000)<br />
The building industry is often described as an industry with many problems <strong>and</strong> lack of efficiency<br />
(Alinaitwe, 2009). The common consensus of all the stakeholders of construction in Malaysia is that<br />
the IBS implementation in construction industry is still very low compared to the conventional methods.<br />
This is due to several reasons as in Table 2.
59<br />
International <strong>Building</strong> & <strong>Infrastructure</strong> Technology Conference<br />
7-8 June 2011, Vistana Hotel, Penang, Malaysia<br />
Table 2. Summary of barriers to adoption of IBS in Malaysia<br />
Item Barriers Supporting Statement<br />
1<br />
2<br />
Return investment<br />
Lack of manpower<br />
skilled<br />
3 Nature practices<br />
4 Knowledge based<br />
5 Low quality<br />
6<br />
7<br />
Lack of incentive <strong>and</strong><br />
awareness<br />
Lack of scientific<br />
information<br />
Wide swings in building dem<strong>and</strong>, high interest rate <strong>and</strong> cheap<br />
labour cost, make it difficult to justify large capital investment. At<br />
present there is an abundance of cheap foreign workers in<br />
Malaysia <strong>and</strong> contractors prefer to use labour intensive<br />
conventional building system because it is far easier to lay off<br />
workers during slack period.<br />
Fully prefabricated construction system requires high<br />
construction precision. Malaysian labour force still lack of skilled<br />
workers in IBS implementation.<br />
The construction industry is very fragmented, diverse <strong>and</strong><br />
involves many parties. Consensus is required in the use of IBS<br />
during planning stage.<br />
Lack of R&D in the area of novel building system that uses local<br />
materials. Majorities of IBS in Malaysia are imported from<br />
developed countries, thus driving up the construction cost.<br />
Engineering degrees in local universities seldom teach about the<br />
design <strong>and</strong> construction of IBS.<br />
The use of IBS in Japan <strong>and</strong> Sweden are so successful due to<br />
high quality <strong>and</strong> high productivity but it is the opposite in<br />
Malaysia. Previous projects constructed with IBS concept were<br />
of low quality <strong>and</strong> high construction cost.<br />
Due to lack of incentive <strong>and</strong> promotion from government in the<br />
use of IBS, many architects <strong>and</strong> engineers are still unaware of<br />
the basic elements of IBS such as modular coordination.<br />
An IBS can only be accepted to practitioners if its major<br />
advantages are valuable compared to the conventional system.<br />
However, up to date, there is inadequate corroborative evidence<br />
to substantiate the benefits of IBS system. It is therefore,<br />
arguable that the implementation of IBS is particularly hindered<br />
by lack of scientific information (Badir et. al., 2002)<br />
8 Wastage of material<br />
St<strong>and</strong>ardization of building agreements faces resistance from the<br />
construction industry due to aesthetic reservation <strong>and</strong> economic<br />
reason. One good example of this is when a 300mm thick<br />
modular st<strong>and</strong>ardized floor slab has to be used although a<br />
260mm thick floor slab can achieved the similar structural<br />
performance. This results wastage of material (Waleed et. al.,<br />
2003)<br />
*Extract literature from Haron et. al., 2009<br />
3. OBJECTIVES<br />
The main aim of this paper is to establish the usage of Industrialised <strong>Building</strong> System (IBS) as a<br />
modernizing method in Malaysian construction industry. To achieve this aim, the paper will flow by the<br />
objectives of:<br />
1. To identify the implementation of IBS in construction industry;<br />
2. To identify the perception from construction players regarding the improvement aspects by<br />
implementing IBS; <strong>and</strong><br />
3. To evaluate the concept of IBS to achieved time reduction in construction phase by scheduling<br />
simulation.<br />
4. METHODOLOGY<br />
The research methodology in this paper serves as a guide in achieving the objectives of the study <strong>and</strong><br />
discusses in details the research procedures, from how the data is collected till how it is processed
60<br />
International <strong>Building</strong> & <strong>Infrastructure</strong> Technology Conference<br />
7-8 June 2011, Vistana Hotel, Penang, Malaysia<br />
<strong>and</strong> analyzed to achieve the objectives <strong>and</strong> scopes of the study. It involves the identification <strong>and</strong><br />
further underst<strong>and</strong>ing of the research topic, which consists of problem statement <strong>and</strong> research<br />
objectives. Literature review has been done on several references, either from electronic journals,<br />
books, magazines, articles <strong>and</strong> so on to further enhance the underst<strong>and</strong>ing on the research topic.<br />
The assembly <strong>and</strong> erection of the conceptual high rise residential building has been modelled using<br />
computer software <strong>and</strong> analysed. More emphasize is on how the scheduling on assembly time is<br />
carried out efficiently at a site using IBS components for the proposed conceptual high rise<br />
residential building. Therefore, a comparison between the work breakdown structure (WBS)<br />
between a typical high rise residential building construction using conventional construction<br />
method <strong>and</strong> the other using Industrialised <strong>Building</strong> System (IBS) components for the high-rise<br />
residential building been further analysed using Microsoft Project for Window. Finally, a conclusion<br />
will be drawn out based on the results of the analysis obtained.<br />
5. ANALYSIS AND RESULT<br />
The respondents that involves in this study are the individual that related to construction industry.<br />
They were called as construction player. Figure 2 show the percentage of respondent’s position<br />
that involve in the questionnaire survey.<br />
Figure 2. Percentage of respondent’s positions than involve in questionnaire survey<br />
An open ended question have been ask to see the perception from respondents about the credits<br />
given to the construction industry when implementing IBS <strong>and</strong> the results summarized as in table 3.
IBS IMPLEMENTATION IN MALAYSIA<br />
61<br />
International <strong>Building</strong> & <strong>Infrastructure</strong> Technology Conference<br />
7-8 June 2011, Vistana Hotel, Penang, Malaysia<br />
Table 3. Perception of IBS on contribution to construction process flow<br />
Reduce construction time<br />
Enhance construction efficiency<br />
Decreased complexity in construction<br />
phase<br />
Ensure the successes of project<br />
delivery<br />
Less platform preparation<br />
Easy to install<br />
Involving off site manufacturing<br />
Suitable for large scale project<br />
Less workers<br />
Resources efficient<br />
Technology involvement<br />
Should be implemented by all parties<br />
Similar contribution of lean construction<br />
Less flexibility <strong>and</strong> quite straight forward<br />
Less wet works at site<br />
Less stockpile on site (Reduce site congestion)<br />
Modernizing construction<br />
Changing the paradigm of conventional project<br />
delivery<br />
Less defects<br />
Easy to define timescale<br />
Figure 4 define that majority construction player agreed the usage of IBS can offer the element of time<br />
reduction. Therefore, it can ensure the successful of project delivery which is the goal of every<br />
construction project.<br />
Figure 4. Percentage of respondents on a element of time reduction for IBS<br />
Finally, to validate <strong>and</strong> proof that IBS offer the time reduction factor, a schedule simulation was done<br />
to the project located in the central region of Malaysia. This construction flow of 10 storeys building<br />
using conventional construction methods as in figure 5.<br />
According to this construction process flow, the activities for 10 storeys (building work only) were 470<br />
tasks. It is fully using traditional method of construction. By using IBS, some activities can be<br />
eliminate. The elimination could be as:<br />
Formwork activities such as preparation, installation <strong>and</strong> dismantle;<br />
1. Cutting, bending <strong>and</strong> installation of high tensile steel; <strong>and</strong> Concreting works
62<br />
International <strong>Building</strong> & <strong>Infrastructure</strong> Technology Conference<br />
7-8 June 2011, Vistana Hotel, Penang, Malaysia<br />
Figure 5. Gantt Chart for normal conventional construction method in Malaysia<br />
For this particular project, the elimination count as 128 activities. Mean that, by using IBS, it could<br />
reduce 25% of total activities. When replacing the element of IBS in the schedule, the construction<br />
process flow should be added the activity of supply chain <strong>and</strong> installation. The Gantt chart <strong>and</strong> the<br />
process flow becoming like figure 6. This simulation of schedule show that by using the IBS system,<br />
duration decrease tremendously. Without considering the period of supply chain like production <strong>and</strong><br />
transport, the duration decrease as 45% comparing to normal conventional method. But if the supply<br />
chain time included, it is probably take around 10% of construction time if the construction manager<br />
didn’t well manage <strong>and</strong> forget about just in time concept. But in this implementation of IBS system, it is<br />
still reduce the construction time. The situation in construction differs in many ways from the typical<br />
situation in manufacturing. Thus, by implementing IBS system, it can reduce the construction time by:<br />
1. Increasing the speed tasks;<br />
2. Reducing the buffer between consecutive tasks; <strong>and</strong><br />
3. Reducing the number of tasks.<br />
Elimination of<br />
tasks when using<br />
IBS
63<br />
International <strong>Building</strong> & <strong>Infrastructure</strong> Technology Conference<br />
7-8 June 2011, Vistana Hotel, Penang, Malaysia<br />
IBS replacement<br />
activities<br />
Figure 6. Gantt Chart for IBS construction method in Malaysia<br />
6. CONCLUSIONS<br />
The positive changes include creating a healthy working environment among those involved directly<br />
in the construction industry. The major players are architects, engineers, town planner, developer,<br />
contractor <strong>and</strong> the supplier or manufacturer have to play their roles in enhancing their working<br />
system, management <strong>and</strong> administration to enable the modernization in the industry. Although<br />
the long-introduced IBS has promised to solve <strong>and</strong> improved the current construction method <strong>and</strong><br />
scenario, but the IBS method has been low in gaining popularity, partly due to lack of awareness <strong>and</strong><br />
coordination among the relevant parties. Currently, the level of IBS usage method is very low as<br />
compared to the conventional methods in building construction. In spite of its many benefits, the<br />
different perceptions among the construction players <strong>and</strong> practitioners towards its application in<br />
construction industry has led to the low usage of IBS components in the construction industry.<br />
Nonetheless, there are still some areas in the IBS management that can be look to conduct a<br />
research for further studies <strong>and</strong> improvement. The finding of this study gives an effective strategy<br />
to implement IBS in the current state of the construction industry. The application of the IBS in the<br />
construction will eventually speed up the process of nation in achieving Vision 2020 <strong>and</strong> to become<br />
part of the developed nation. Therefore, by applying the IBS concept, it will improve the construction<br />
process flow <strong>and</strong> modernizing construction in Malaysia.<br />
REFERENCES<br />
Alinaitwe, H. M. (2009) Priortising Lean Construction Barriers in Ug<strong>and</strong>a’s Construction Industry,<br />
Journal of Construction in Developing Countries, Vol 4, No 1, 15-30<br />
Badir, Y.F., Kadir M.R.A., Hasim, S. (2002) IBS Construction in Malaysia, Journal of Architectural<br />
Engineering, Vol. 8, No. 1<br />
Bernama (2006) Local Construction Industry Urged to Use IBS Business, National News Agency,<br />
Malaysia<br />
Bertelsen, S. (2002) Complexity-Construction In A New Perspective. Proceeding of International<br />
Group for Lean Construction, Brazil
64<br />
International <strong>Building</strong> & <strong>Infrastructure</strong> Technology Conference<br />
7-8 June 2011, Vistana Hotel, Penang, Malaysia<br />
Chung, L. P.& Kadir, A. M. (2007) Implementation Strategy for Industrialised <strong>Building</strong> <strong>Systems</strong>, PhD<br />
thesis, Universiti Teknologi Malaysia (UTM), Malaysia<br />
CIDB (2003) IBS Roadmap 2003-2010, Construction Industry Development Board Malaysia (CIDB),<br />
Malaysia<br />
CIDB (2004) Dirty, Difficult <strong>and</strong> Dangerous? Simplify it Use IBS, IBS Digest, Malaysia<br />
CIDB (2005) IBS Digest, January-March Publication, Malaysia<br />
CIDB (2007) Construction Industry Master Plan Malaysia 2006-2015, Construction Industry<br />
Development Board Malaysia (CIDB), Malaysia<br />
T113 - Stress-Strain relationship for masonry modeling.doc<br />
Esa, H. <strong>and</strong> Nurudin, M.M. (1998) Policy on Industrialised <strong>Building</strong> <strong>Systems</strong>, Colloqium on<br />
Industrialised Construction <strong>Systems</strong>, Malaysia<br />
Haron, N. A., Rahman, H.A., Hanid,M. (2009) A Literature Review of the Advantages <strong>and</strong> Barriers to<br />
the Implementation of IBS in Construction Industry, Malaysian Construction Research Journal, Vol. 4,<br />
No. 1, Malaysia<br />
Junid, S.M.S. (1986) Industrialised <strong>Building</strong> <strong>Systems</strong>, Proceedings of UNESCO/ FEISEAP Regional<br />
Workshop, Universiti Putra Malaysia (UPM), Malaysia<br />
Lessing, J., Ekholm, A., <strong>and</strong> Stehn, L. (2005) Industrialised Housing-Definition <strong>and</strong><br />
Categorisation of the Concept, 13th International Group for Lean Construction, Sydney, Australia<br />
Parid, W. (1997) Global Trends in Research, Development <strong>and</strong> Construction, Proceeding of the<br />
International Conference on Industrialised <strong>Building</strong> System, Construction Industry Development Board<br />
(CIDB), Malaysia<br />
Rahman, A.B.A., Omar, W. (2006) Issue <strong>and</strong> Challenges in the Implementation of IBS in Malaysia,<br />
Proceeding of the 6th Asia-Pacific Structural Engineering <strong>and</strong> Construction Conference,<br />
Malaysia<br />
Trikha, D.N. (1999) Industrialised <strong>Building</strong> System: Prospect in Malaysia, Proceeding of World<br />
Engineering Congress, Kuala Lumpur<br />
Waleed, A.M.T., Lee, W.P., Kadir, M.R.A., Jaafar, M.S., Salit, M.S. (2003) The Essential<br />
Characteristics of IBS, International Conference on IBS, Malaysia<br />
Warszawski, A. (1999) Industrialised <strong>and</strong> Automated <strong>Building</strong> System, Technion-Israel Institute of<br />
Technology, E & FN Spon.<br />
Zaini, O. (2000) Malaysian Construction Industry: Challenges <strong>and</strong> Dem<strong>and</strong>, Malaysian Structural Steel<br />
Association Convention Report, Malaysia.
T117<br />
65<br />
International <strong>Building</strong> & <strong>Infrastructure</strong> Technology Conference<br />
7-8 June 2011, Vistana Hotel, Penang, Malaysia<br />
A LITERATURE REVIEW ON THE STATE AND PRACTICE OF LCC IN MALAYSIA<br />
Mohd Fairullazi Ayob 1 <strong>and</strong> Khairuddin Abdul Rashid 2<br />
1, 2 International Islamic University Malaysia<br />
1 fairullazi@yahoo.com , 2 khairuddin@iium.edu.my<br />
ABSTRACT: Commentators suggest that most clients focus only on initial or capital costs but very<br />
seldom they consider future costs (maintenance, replacement, etc) when they initiate <strong>and</strong> procure<br />
building <strong>and</strong> infrastructure facilities. In addition, techniques including Life Cycle Cost (LCC) were<br />
seldom applied; these despite the fact that past research indicated that the application of such<br />
techniques could provide clients with a holistic view on the total costs (initial, maintenance,<br />
replacement, etc) of their proposed development. Consequently, a research project aimed at<br />
investigating the state <strong>and</strong> practice of LCC in Malaysia was initiated <strong>and</strong> carried out. This paper<br />
reports on the initial stage of the study <strong>and</strong> its outcome. The initial study was conducted through a<br />
comprehensive review of literature on LCC in general <strong>and</strong> specifically on the practice of LCC in<br />
Malaysia. The outcome of the initial study suggests that among others; most clients <strong>and</strong> their<br />
consultants are aware of the concept of <strong>and</strong> practice of LCC, there exist several models <strong>and</strong><br />
techniques on how to apply LCC for building <strong>and</strong> infrastructure projects <strong>and</strong> yet LCC is seldom<br />
practiced in Malaysia. The findings provide current information on the state <strong>and</strong> practice of LCC in<br />
Malaysia.<br />
Keywords: life cycle cost (LCC), initial <strong>and</strong> future costs, building, construction <strong>and</strong> clients<br />
1. INTRODUCTION<br />
In this paper, our aim is to report the state <strong>and</strong> practice of LCC in the Malaysian construction industry.<br />
In preparing this paper, a comprehensive review of literature on the practice of LCC related to<br />
Malaysian construction industry were conducted. The outcomes of the review will be reported as an<br />
introduction of the research.<br />
The LCC assessment can be divided into three categories which are data inputs, conversion <strong>and</strong><br />
outputs (BS ISO 15686, 2008; Kelly et al., 2009; RTO-SAS-069, 2009). Nevertheless, it was observed<br />
from the literature review the main focus on the LCC practice in Malaysia is considerably on the<br />
conversion of LCC analysis. Most of the literatures written on LCC give emphasis to conversion, but<br />
less focus is given to the data input <strong>and</strong> outputs of LCC analysis. Indeed, there is no research has<br />
been carried out to identify of how the data inputs are utilized for conversion in producing accurate <strong>and</strong><br />
reliable outputs of the LCC analysis. Besides, there is no research has been performed to ascertain<br />
whether the local data inputs are appropriate to be used in monitoring the outputs of LCC analysis.<br />
2. THE DEFINITION AND CONCEPT OF LIFE CYCLE COST (LCC)<br />
There are many different expressions were used to refer to the ultimate cost or total cost of a building<br />
ownership (Schade, 2007; Khairani, 2009; Kirk et al., 1995; Br<strong>and</strong>on, 1995; Mohammed Kishk et al.,<br />
2003a, 2003b; Boussabaine et al., 2006; Kirkham, 2007; Lev<strong>and</strong>er et al., 2009; Zainal Abidin et al.,<br />
2010). The difference in wordings <strong>and</strong> expressions to symbolize total cost of building ownership have<br />
caused ambiguity <strong>and</strong> confusion to the practitioners to select an appropriate technique to compute<br />
total cost of building ownership in the industry. Although the expressions used are interchangeably,<br />
the Life Cycle Cost (LCC) is preferred as it is widely used in the practice <strong>and</strong> better known to represent<br />
the total cost related to the building ownership throughout the study life.<br />
There are many different definitions of Life Cycle Cost (LCC) found in the literature. The most basic<br />
definition is the total discounted cost of building ownership throughout the study life. It represents an<br />
economic assessment of an asset, expressed in terms of total costs related to the building ownership
66<br />
International <strong>Building</strong> & <strong>Infrastructure</strong> Technology Conference<br />
7-8 June 2011, Vistana Hotel, Penang, Malaysia<br />
which connects the initial capital cost with operating <strong>and</strong> maintenance costs, replacement costs,<br />
financing costs, <strong>and</strong> the cost or benefit of the building at the end of the study life.<br />
The LCC studies are performed to provide major cost factors <strong>and</strong> potential cost saving. The outputs of<br />
LCC studies are used to advise the clients or building owners in determining the most optimum cost of<br />
asset ownership, <strong>and</strong> comparing cost-effectiveness of mutually exclusive alternatives (Mohammed<br />
Kishk et al., 2003a, 2003b; RTO-SAS-069, 2009). The LCC studies are not only a one-off task but they<br />
can be applied as an on-going activity to constantly assess cost implication at any stage of<br />
procurement activity in the effort towards achieving value for money (Mohammed Kishk et al., 2003a,<br />
2003b; Bakis et al., 2003). Nevertheless, it is important the data inputs procured for producing a LCC<br />
analysis are reliable, comprehensiveness, updated, accessible <strong>and</strong> available in order to ensure the<br />
estimated results of LCC analysis are appropriate <strong>and</strong> accurate with minimum erratum.<br />
3. REVIEW<br />
3.1 The application of LCC in the Public Private Partnership (PPP) program<br />
Public Private Partnership (PPP) is a new procurement strategy in Malaysia that refers to a working<br />
relationship between a Government agency <strong>and</strong> a private agency in meeting a common goal to deliver<br />
public infrastructures <strong>and</strong> services (Khairuddin, 2010a, 2009; Ahmad Zamri, 2010). PPP focuses on<br />
efficient allocation of risk, life cycle cost, service approach, private sector innovation <strong>and</strong> management<br />
skills on the basis of long term partnership between public <strong>and</strong> private sector to attain value for money<br />
(Khairuddin, 2010a, 2009; Nor Hizam, 2010).<br />
The LCC application was adopted by the Government into PPP procurement approach as a technical<br />
instrument <strong>and</strong> cost effectiveness tool to drive the project activities in meeting the Government<br />
objectives (3PU, 2009a:p6; 3PU, 2009b:p5; EPU 2010a, 2010b). The Public Private Partnership Unit<br />
of Prime Minister’s Department (3PU) was formed by the Government to undertake effective planning<br />
<strong>and</strong> management in the implementation of PPP project programs in Malaysia (3PU, 2010; Khairuddin<br />
2009:p80, 2010a; 3PU, 2010; Ahmad Zamri, 2009; Nik Nasir, 2009; 3PU, 2009a: pg.6; 3PU, 2009b:<br />
pg.5; Mariyam, 2010).<br />
The market capitalisation for PPP (comprises of PPP/PFI/Privatisation projects) were extensively<br />
large, approximately RM182.45 billion achieved from 1983 till May 2010 (3PU, 2010a, 2010b).<br />
Unfortunately the concept <strong>and</strong> methodology of PPP approach was unknown to many. The concept <strong>and</strong><br />
methodology of PPP is ambiguous <strong>and</strong> limited evidence is existed to ascertain how LCC is framed <strong>and</strong><br />
used as a cost effectiveness initiative to produce reliable <strong>and</strong> accurate outputs in the PPP projects.<br />
The justifications were proven from survey conducted by Khairuddin (2008 cited in Khairuddin, 2010b)<br />
in identifying the key PPP competencies, <strong>and</strong> assessing the current level of PPP competencies on the<br />
group of construction key players with diversity of backgrounds (which include architects, engineer,<br />
quantity surveyors, contractors, financial management, financial <strong>and</strong> banking services). The survey<br />
reveals that 36 percent of the respondents were ambiguous <strong>and</strong> unclear with the PPP’s concept <strong>and</strong><br />
methodology. Lack of consistency on the level of PPP competencies due to a comparatively ‘big’ gap<br />
between the key areas of PPP competencies required <strong>and</strong> the availability of Malaysia experts in<br />
possessing the required competencies are some of the reasons found to the problem (Khairuddin,<br />
2008 cited in Khairuddin, 2010b).<br />
Based on the observation from the survey, it can be encapsulated the PPP’s concept is still new in<br />
Malaysia <strong>and</strong> the adoption of LCC in the PPP context has been relatively new <strong>and</strong> limited. These<br />
setbacks should be treated effectively by enhancing more knowledge <strong>and</strong> competencies required<br />
through seminars, trainings <strong>and</strong> publications. These approaches can therefore accelerate resources,<br />
expertise, <strong>and</strong> professionals in fostering effective cooperation <strong>and</strong> working collaboration between the<br />
public <strong>and</strong> private sectors in successfully attaining the goals <strong>and</strong> objectives of the PPP programme.<br />
3.2 The application of LCC in the Value Management (VM)<br />
Value Management (VM) was first introduced in Malaysia in 1986 by Roy Barton through the Quantity<br />
Surveying Department at Universiti Teknologi Malaysia (Mohd. Mazlan, 2004, 2006, 2010; Mohd Azmi,<br />
2004; Aini et al., 2006, Aini et al., 2009; Aini <strong>and</strong> Torrance, 2005 cited in Aini et al., 2008;; Olanrewaju<br />
et al., 2010).). Through the efforts carried out by Mohd Mazlan, VM was adopted as a m<strong>and</strong>atory<br />
requirement for the Government project (costing RM50 million <strong>and</strong> above), Malaysia Airport Holding
67<br />
International <strong>Building</strong> & <strong>Infrastructure</strong> Technology Conference<br />
7-8 June 2011, Vistana Hotel, Penang, Malaysia<br />
Berhad (for project costing above RM30 thous<strong>and</strong>), <strong>and</strong> Tenaga Nasional Berhad (for project costing<br />
above RM10 million). VM was also chosen as a cost prediction technique for several other local<br />
agencies like Public Work Department (PWD), Construction Industry Development Board (CIDB),<br />
Petronas, Ministry of Health (MOH) <strong>and</strong> etc. (Mohd. Mazlan, 2010). LCC is used to facilitate the<br />
agencies to search for eliminating unnecessary costs, increase cost saving in the building <strong>and</strong><br />
infrastructure projects, optimise the overall life cycle cost, <strong>and</strong> simultaneously get the qualities<br />
st<strong>and</strong>ard required (Mohd. Mazlan, 2004; Mohd Azmi, 2004).<br />
There are several alternatives of techniques can be chosen in producing a VM analysis (Nazirah et al.,<br />
2006). The LCC technique is a common used technique in the VM study that evaluates alternatives in<br />
selecting the most optimum solution for the purposes of removing unnecessary costs while increasing<br />
the cost savings, quality, reliability, performance, <strong>and</strong> other criteria to meet the client expectations<br />
(Dell’Isola, 1997 cited in Olanrewaju, 2010; Kirk et al., 1995; Mohd. Mazlan, 2010). VM takes account<br />
all the criteria requirements within the client value system. In the VM process, LCC is employed to<br />
select an alternative that has the lowest cost; whilst the other performance criteria like aesthetic<br />
(inspiring <strong>and</strong> harmonious), images (reputable <strong>and</strong> progressive), fitness for purpose, sustainability,<br />
buildability, maintainability, technology, quality, safety, reliability are evaluated through VM process<br />
(Olanrewaju, 2010).<br />
In spite of the m<strong>and</strong>atory requirement by many agencies to exercise VM in the projects, there is<br />
unclear <strong>and</strong> ambiguous whether LCC was employed in the context of VM practice. It was observed<br />
that there is no st<strong>and</strong>ard approach or proper guidance of how LCC is employed in computing project<br />
cost for VM study in achieving a better value for money. It was contended by Aini et al. (2006), Aini<br />
<strong>and</strong> Torrance (2005) whether VM should be considered as a “cost cutting” tool as it could perhaps limit<br />
creativity <strong>and</strong> innovative thinking of designer to express state of art in a specific project. Nevertheless,<br />
several authors assert VM is not about a cutting cost as its main function is to enhance <strong>and</strong> improve<br />
value <strong>and</strong> function of the building designed in effective <strong>and</strong> efficient manner. As LCC is used to predict<br />
total cost of a building until the end of the service life, whilst VM acts for cost saving of the project up<br />
to the project completion stage, it is considerably essential to incorporate the functions of LCC <strong>and</strong> VM<br />
in eliminating unnecessary costs in the line with client objective to optimize the overall life cycle cost of<br />
the building, whilst at the same time to obtain the optimum function <strong>and</strong> value (Kelly et al., 1993;<br />
Nazzatul Shiha, 2009; Olanrewaju, 2010).<br />
Based on the observation from the literature review, there is no evidence to indicate the practice of<br />
LCC in the context of VM in the Malaysian construction industry. It was found the main focus of VM in<br />
local practice is to attain optimum value in asset by undertaking necessary functions or alternatives at<br />
the lowest cost rather than emphasize on the importance aim to optimise the total cost of the asset<br />
throughout its study life. Without the adoption of LCC technique as a systematic framework in the VM<br />
exercise, it is uncertain to ascertain whether the outputs produced from VM analysis are undoubtedly<br />
reliable <strong>and</strong> accurate for sustainable development of an asset throughout a study life in attaining value<br />
for money.<br />
3.2.1 LCC software for Value Management in Malaysia<br />
A local web based environment software, LCCsoftonline (Version 4.0) was developed by Mohd Mazlan<br />
supported by MCM Value Sdn. Bhd. LCCsoftonline is developed to improve the practical use of LCC in<br />
the VM application, <strong>and</strong> facilitates the practitioners in making comparison of building cost in a<br />
meaningful <strong>and</strong> simplified approach. It is observed the software can only be used to convert the cost<br />
inputs to produce LCC outputs for the use in VM process. However, it does not provide method of how<br />
to acquire reliable <strong>and</strong> updated cost inputs for conversion. Moreover, it was observed that the<br />
literature information <strong>and</strong> data on LCCsoftonline is inadequate <strong>and</strong> limited pertaining to its use,<br />
principle <strong>and</strong> methodology in the VM studies. It was explained by the founder, Mohd Mazlan that the<br />
software is relatively new, <strong>and</strong> moreover it has not been launched yet by the Construction Industry<br />
Development Board (CIDB) as an online tool for the use of practitioners in exercising VM in the<br />
construction industry (Source: Mohd Mazlan; MCM Value, 2010; http://value.mcm-associates.com;<br />
http://lcc-soft.com/Info_aboutus.php). Based on the observation, hence it can be recapitulated the<br />
application of LCC in the VM exercise has not been well established <strong>and</strong> the use of LCC to provide<br />
information for VM application was not widely used by the practitioners in the construction industry.
3.3 The application of LCC in Facility Management (FM)<br />
68<br />
International <strong>Building</strong> & <strong>Infrastructure</strong> Technology Conference<br />
7-8 June 2011, Vistana Hotel, Penang, Malaysia<br />
The Government has put high commitments by exp<strong>and</strong>ing huge amount of money into building<br />
management activities to ensure the potential use <strong>and</strong> performance of the buildings can be maximized<br />
throughout the entire service life span. Approximately RM1.08 billion in the Ninth Malaysia Plan budget<br />
(2005-2010) was expended for building management activities including maintenance works. The<br />
fundamental aims of the Government in preserving <strong>and</strong> maintaining the buildings are to enhance<br />
durability of the building performance, to deliver better return of investment <strong>and</strong> to increase cost saving<br />
through reduced life cycle costs (Puva et al., 2010; MBAM, 2007, Olanrewaju, 2008; NAFAM 2007;<br />
Utusan Malaysia, October 10, 2009; Azlan-Shah et al., 2010). The amount of money required for<br />
maintenance works increases in continuously regardless of size, type, location <strong>and</strong> ownership. The<br />
Government had attempted to reduce maintenance costs in the Budget 2008 by undertaking programs<br />
that were efficient <strong>and</strong> cost effectiveness in maintaining the building through reduced life cycle costs to<br />
meet the acceptable required performance (Azlan Shah et al., 2010; Mohd Sidek, 2007 cited in<br />
Olanrewaju, 2008; Puva et al., 2010; Ng, 2009).<br />
The Government has organized a national convention, the National Asset <strong>and</strong> Facility Management<br />
(NAFAM) which aimed to set objectives <strong>and</strong> strategies in implementing the best practices in the field of<br />
facility management. The convention provides a platform where the Government <strong>and</strong> industry players<br />
are collaborated to formulate sustainable integration of asset management practices incorporated with<br />
life cycle cost (LCC), monetization, performance monitoring, good governance, asset management<br />
policy, public-private partnerships (PPP), <strong>and</strong> private finance initiative (PFI) (Puva et al., 2010; NAFAM<br />
2007; Ng, 2009). The convention addresses several issues including LCC <strong>and</strong> proposes strategies to<br />
be formulated <strong>and</strong> executed to embark LCC as an integrated facility management approach technique<br />
in managing buildings <strong>and</strong> facilities in the Tenth Malaysia Plan (Shaziman, 2009; Ng, 2009).<br />
Based on the observation from the literature review, it can be encapsulated the application of LCC in<br />
the context of facility management in the country has been relatively new. In the Tenth Malaysia Plan<br />
(2011-2015), the Government encourages LCC technique to embark as a part of development culture<br />
in maintaining <strong>and</strong> preserving the asset in efficient <strong>and</strong> holistic manner. The fundamental reason is the<br />
buildings in Malaysia that require maintenance are many <strong>and</strong> everlasting (Olanrewaju, 2008; Puva et<br />
al., 2010; NAFAM 2007; Utusan Malaysia Online, 2009; Shaziman, 2009; Ng, 2009; Judin, 2009;).<br />
Unfortunately, no research has been carried out to identify appropriate methodology for monitoring life<br />
cycle cost of the building, in order to prevent from being constructed for cheap <strong>and</strong> costly to maintain<br />
over the life span. A comprehensive assessment in the life cycle cost of the assets should be executed<br />
as part of facility management approaches to ensure the buildings <strong>and</strong> facilities can be operated with<br />
optimum maintenance <strong>and</strong> replacement costs, which can therefore facilitate the Government to attain<br />
the best value for money.<br />
3.3.1 LCC software for Facility Management in Malaysia<br />
A comprehensive engineering software application, the Life Cycle Cost for Multi-Storey Housing<br />
(LICCOMS) is developed to estimate life cycle cost of multi-storey low cost housing throughout the life<br />
span by performing the calculation through the Life Cycle Cost Analysis module incorporated with<br />
other features that accommodates by LICCOMS. LICCOMS is designed as a multifunction tool<br />
composes of several modules which include Life Cycle Cost Analysis, Module Builder, Service Life<br />
Prediction <strong>and</strong> <strong>Sustainable</strong> Rating (Siti Hamisah et al., 2005; Masoud, 2009, Masoud et al., 2010;<br />
MBAM, 2007; Business Times October 3, 2001; Berita Harian October 3, 2001). LICCOMS takes into<br />
account economic effects, the type of project, design factor, inflation rate, the service life of building<br />
<strong>and</strong> its components, operation costs, maintenance costs, occupancy costs, furnishings, energy costs,<br />
site cost, professional fees <strong>and</strong> capital cost, insurance, cleaning costs, replacement costs. (Zin et al.,<br />
2002 cited in Masoud, 2010; MBAM, 2007; Berita Harian October 3, 2001). LICCOMS facilitates users<br />
to compute the construction costs <strong>and</strong> operating costs of the building incorporated with two or more<br />
dimension of drawings (2d or 3D). LICCOMS converts the data which are procured from the<br />
environmental loads or performance rating, that produce from the past building assessments of more<br />
than 400 buildings <strong>and</strong> 7400 building components around Malaysia (Siti Hamisah et al., 2005;<br />
Business Times, 2001).<br />
Despite of its multifunction, there are several setbacks. It was identified by Masoud et al. (2010) that<br />
LICCOMS may not provide accurate <strong>and</strong> reliable outputs for decision making as it is heavily depended<br />
on out of date data that were collected throughout 6 years research by <strong>Sustainable</strong> Construction<br />
Research Group (SCRG) of University Teknologi Malaysia. Real time data collections are important
69<br />
International <strong>Building</strong> & <strong>Infrastructure</strong> Technology Conference<br />
7-8 June 2011, Vistana Hotel, Penang, Malaysia<br />
inputs of LICCOMS to ensure reliable <strong>and</strong> accurate outputs could be produced on the predicted cost.<br />
Unfortunately, the limitation of LICCOMS as a st<strong>and</strong>alone software does not allow the system to be<br />
frequently updated with a real time data (Masoud et al., 2010; Olanrewaju, 2008; Berita Harian<br />
October 3, 2001). The availability of its use in the building industry is limited as the price of LICCOMS<br />
is considerably expensive to be purchased by the private building owners <strong>and</strong> individual users. To<br />
rectify these problems, Masoud (2009, et al., 2010) has proposed an efficient solution by shifting the<br />
LCC st<strong>and</strong>alone paradigm to a web based environment that can allow the use of real-time databases.<br />
Hence, it could perhaps facilitate the users to easily update the data anytime <strong>and</strong> anywhere from<br />
appropriate resources. Based on the observation, it can be recapitulated the development of a webbased<br />
LCC tool will lead practitioners, users <strong>and</strong> analysts in Malaysia to practice LCC through an<br />
online calculation for making economic decision, <strong>and</strong> also facilitate them to procure data of reliable,<br />
accessible, updated <strong>and</strong> available from suitable resources within Malaysia. This obviously shows the<br />
availability of reliable data as input to a web-based LCC tool is essential in order to ensure an accurate<br />
LCC analysis can be produced.<br />
3.4 The application of LCC in sustainable building<br />
A “sustainable building” is defined as a building that is “designed, constructed <strong>and</strong> effectively managed<br />
by the users where the service life of the building they inhabit exceeding the design life, preserves the<br />
environment, meets ecological performance requirement, <strong>and</strong> notwithst<strong>and</strong>ing surrounding<br />
environment <strong>and</strong> development the building able to meet the capabilities <strong>and</strong> needs of future<br />
generation” (Siti Hamisah et al., 2007). The benefits of a sustainable building are it can increases<br />
energy saving, encourages the use of recycled materials, <strong>and</strong> minimises the emission of toxic<br />
substances throughout the building life cycle. The Government through the prime minister had<br />
announced in the United Nation Climate Change Conference (COP 15) 2009 to execute effective<br />
strategies in reducing the emissions of greenhouses (carbon dioxide, CO 2 ) up to 40 percent by 2020<br />
as compared with 2005 levels (The Star Online July 31, 2010). The LCC has been a major agenda of<br />
the Government as it will emphasize on sustainable development strategies in every aspect of a<br />
project development, energy efficiency in existing government buildings, managing solid waste<br />
production <strong>and</strong> renewable energy, in order to reduce 50 million tons of carbon dioxide per year (Judin,<br />
2010). Public Works Department (PWD) was given important roles in monitoring <strong>and</strong> reducing carbon<br />
emission in the area of energy efficiency by fostering <strong>and</strong> formulating sustainable development<br />
strategies in the construction of Government buildings <strong>and</strong> facilities (Kannan, 2006).<br />
In spite of the advancement progresses of the sustainable building <strong>and</strong> its essential to balance total<br />
economic cost, social life <strong>and</strong> ecological performance in Malaysia, there is no st<strong>and</strong>ard method has<br />
been formulated to quantify life cycle cost of a sustainable building (Shaziman, 2009). A consistent<br />
approach or st<strong>and</strong>ard procedure should be formulated <strong>and</strong> executed to break down the cost<br />
components <strong>and</strong> other cost parameters of the sustainable building to the life cycle cost estimation.<br />
This to ensure the procedures <strong>and</strong> methodology of the LCC analysis applied in the sustainable<br />
building development strategies will be well understood <strong>and</strong> comprehended by the practitioners, which<br />
can therefore be executed in producing reliable <strong>and</strong> accurate outputs (Kelly et al., 2009). Other major<br />
setbacks of LCC pertaining to sustainable building design are limited data inputs, unavailability of real<br />
time data, inadequate knowledge to predict total life cycle cost of a sustainable building, <strong>and</strong> etc. (Aun,<br />
2010).<br />
Although Malaysia St<strong>and</strong>ard, MS 1525 has been produced to represent the minimum st<strong>and</strong>ards for<br />
energy efficiency in the design of new buildings <strong>and</strong> retrofitting of existing buildings, but it is observed<br />
that the st<strong>and</strong>ard does not demonstrate LCC as an economic decision making tool for energy<br />
efficiency <strong>and</strong> economic cost of the buildings. The st<strong>and</strong>ard mainly focuses on non-monetary factors,<br />
especially the design, operation <strong>and</strong> maintenance of the building envelop, lighting, electric power,<br />
mechanical ventilation, etc. (Kannan, 2006). As compared to other countries like Hong Kong, it owns a<br />
st<strong>and</strong>ard procedure or methodology that give emphasis to the employment of LCC technique in<br />
determining long term benefits of sustainable building designs <strong>and</strong> the items (Leong, 2009).<br />
4. CONCLUSIONS<br />
This paper explored the state <strong>and</strong> application of LCC in Malaysia, exclusively the adoption of LCC as a<br />
tactical tool for strategic advancement issues in the Malaysian construction industry. The application of<br />
LCC in the strategic advancement issues which include the Public Private Partnership (PPP), Value
70<br />
International <strong>Building</strong> & <strong>Infrastructure</strong> Technology Conference<br />
7-8 June 2011, Vistana Hotel, Penang, Malaysia<br />
Management (VM), facilities management (FM), <strong>and</strong> sustainable building were reviewed. The LCC<br />
technique has been considered as a useful tool to provide crucial information in advising the<br />
Government <strong>and</strong> clients to make the most cost-effectiveness decision on the investment <strong>and</strong> to attain<br />
the best value for money. Nevertheless, it was observed that most literatures put emphasis to<br />
conversion rather than the data inputs <strong>and</strong> outputs of LCC analysis. Therefore, it can be encapsulated<br />
the use of LCC in Malaysia is still at its infancy stage. To embark LCC as an effective tool in facilitating<br />
the Government <strong>and</strong> clients to attain the best value of money over the investment, the setbacks that<br />
hinder the application of LCC in the strategic advancement issues should be rectified effectively. The<br />
review is limited to the reported LCC applications only in the Malaysian construction industry. The<br />
research is on-going <strong>and</strong> further research is encouraged on the current level of data input<br />
requirements of availability, reliability, updated <strong>and</strong> accessibility in the effort towards producing an<br />
accurate LCC analysis.<br />
REFERENCES<br />
Ahmad Zamri Khairuddin (2010). PPP Guidelines: A Conceptual Framework. In Malaysia’s Public-<br />
Private Partnership Seminar (2010). Organised by Procurement & Project Delivery, System Research<br />
Unit, Kulliyah of Architecture <strong>and</strong> Environmental Design, International Islamic University Malaysia in<br />
collaboration with Public-Private Partnership Unit, Prime Minister Department. (August 5, 2010).<br />
Crystal Crown Hotel, Petaling Jaya<br />
Aini Jaapar, Intan Rohani Endut, Nor Azmi Ahmad Bari & Roshana Takim (2009), The Impact of Value<br />
Management Implementation in Malaysia, Journal of <strong>Sustainable</strong> Development, Canadian Centre of<br />
Science <strong>and</strong> Education, Vol 2 No 2.<br />
Aini Jaapar, Roshana Takim, Intan Rohani Endut & Nor Azmi Ahmad Bari (2008), Value Management<br />
Guidelines for the Malaysian Construction Industry, ALAM CIPTA International Journal on <strong>Sustainable</strong><br />
Tropical Design Research & Practice, Vol 3 (Issue 1). Retrieved January 5, 2011 from<br />
http://psasir.upm.edu.my/2507/1/10-Aini.pdf<br />
Aun, C. S. (2009). Preview of green building index Malaysia (residential). Paper presented at the<br />
Green Design Forum, Kuala Lumpur Convention Centre, January 3, 2009. Retrieved December 15,<br />
2010 from: www.slideshare.net/arkam_slideshare/green-building<br />
Azlan Shah, A., Syahrul Nizam, K., Raha, S., Peng, Y. C. (2010). Factors affecting housing<br />
maintenance cost in Malaysia. Journal of Facilities Management, Vol. 8, No.4 (p285-298). Retrieved<br />
December 18, 2010 from: www.emeraldinsight.com/1472-5967.htm.<br />
Barringer, P. E. H. (2003). A Life Cycle Cost Summary. Retrieved May 4, 2010, from International<br />
Conference of Maintenance Societies (ICOMS-2003). Website:<br />
http://www.barringer1.com/pdf/LifeCycleCostSummary.pdf<br />
Boussabaine, H. A., Kirkham, R. L. (2006). Whole life-cycle costing: risk <strong>and</strong> responses (page 3-81).<br />
Oxford, UK: Blackwell Publishing Ltd.<br />
BS ISO 15686-5 (2008). International St<strong>and</strong>ard: <strong>Building</strong>s <strong>and</strong> constructed assets-Service Life<br />
Planning. Part 5: Life Cycle Costing (page 1-40). St<strong>and</strong>ards Policy <strong>and</strong> Strategy Committee. Retrieved<br />
Jun 9, 2010 from University of Bradford database.<br />
Economy Planning Unit (EPU) (2009). Value management guideline. Prime Minister Department.<br />
Putrajaya, Malaysia.<br />
Jallendran, T. (2010). The green building index way to a green construction industry for Malaysia:<br />
Benefits of a green economy. Paper was presented at the iGreat Session PAM, Cyberjaya, Jun 21,<br />
2010. Retrieved December 15, 2010 from http:// www. cyberview.com.my/iGREET/GBI_info<br />
Economic%20Benefits_TJ_24 0610.pdf<br />
Judin Abdul Karim (August 22, 2009). Turning to Total Asset Management. The Star Online. Retrieved<br />
May 17, 2010, from http://thestar.com.my/news/ story.asp?file=/2009/8/22/columnists<br />
/atyourservice/4536544&sec=atyourservice<br />
Judin Abdul Karim (2010, July 31). <strong>Building</strong> green for a better tomorrow. The Star Online. Retrieved<br />
December 20, 2010 from<br />
http://thestar.com.my/news/story.asp?file=/2010/7/31/focus/6667733&sec=focus<br />
Kannan, K. S. (2006). Implementing energy efficiency in buildings. SIRIM: st<strong>and</strong>ard <strong>and</strong> quality news,
71<br />
International <strong>Building</strong> & <strong>Infrastructure</strong> Technology Conference<br />
7-8 June 2011, Vistana Hotel, Penang, Malaysia<br />
vol.13, no. 3/2006, pg. 15-17. Retrieved January 11, 2011 from http://www.sirim.my/f_corp/energy.pdf<br />
Kelly, J. R. <strong>and</strong> Hunter, K. (2009). Life Cycle Costing of <strong>Sustainable</strong> Design. London: RICS. Retrieved<br />
Jun 14, 2010 from http://www.rics.org/site/scripts/download_info.aspx?downloadID=4529 - 24k<br />
Khairani Ahmad (2009). Construction Economics (page 1-12, 319-333). Selangor, Malaysia: Prentice<br />
Hall.<br />
Khairuddin Abdul Rashid (2009). Underst<strong>and</strong>ing Private Finance Initiative (PFI) (page 45-91).<br />
Selangor: Scholarmind Publishing.<br />
Khairuddin Abdul Rashid (2010a). PPP Within the Context of the Procurement Paradigm. In<br />
Malaysia’s Public-Private Partneship Seminar (2010). Organised by Procurement & Project Delivery,<br />
System Research Unit, Kulliyah of Arcitecture <strong>and</strong> Environmental Design, International Islamic<br />
University Malaysia in collaboration with Public-Private Partnership Unit, Prime Minister Department.<br />
(August 5, 2010). Crystal Crown Hotel, Petaling Jaya<br />
Khairuddin Abdul Rashid (2010b). PPP-Are the Key Players of the Construction Industry Ready?. In<br />
Malaysia’s Public-Private Partneship Seminar (2010). Organised by Procurement & Project Delivery,<br />
System Research Unit, Kulliyah of Arcitecture <strong>and</strong> Environmental Design, International Islamic<br />
University Malaysia in collaboration with Public-Private Partnership Unit, Prime Minister Department.<br />
(August 5, 2010). Crystal Crown Hotel, Petaling Jaya<br />
Lev<strong>and</strong>er, E., Schade, J., Stehn, L. (2009). Life cycle costing for buildings: Theory <strong>and</strong> suitability for<br />
addressing uncertainties about Timber Housing. Retrieved November 30, 2010 from http://www.inproproject-eu/media/LCC_for_buildings_Lev<strong>and</strong>er_Schade_Stehn-pdf<br />
Mariyam Ismail (2010). Implementation of Value Management in the Public Sector. In Seminar<br />
Achieving Better Value in Construction Industry Through Value Management & Life Cycle Costing<br />
(April 20, 2010). Putrajaya: CIDB<br />
Masoud, G., Arham, A., Irizarry, J., <strong>and</strong> Pillai, C., (2010) “A Web-Based Environment for <strong>Building</strong>s’ Life<br />
Cycle Cost Analysis,” Proceedings of the 6th International Conference on Innovation in Architecture,<br />
Engineering <strong>and</strong> Construction (AEC), Pennsylvania State University, USA, June 9-11, 2010, Anumba,<br />
C.J., Bouchlaghem, N.M., Messner, J.I., <strong>and</strong> Parfitt, M.K., editors, pp. 262-270<br />
MBAM (2007). JPN workshop on building maintenance. Master Builders 2 nd quarter 2007 magazine,<br />
pg. 22. Retrieved January 5, 2011 from<br />
http://www.mbam.org.my/mbam/images/MBAM%20SECTION%20%286-38%29.pdf<br />
Mohd Azmi Abd Ghani (2004). Value management practice in Malaysia: the principles <strong>and</strong> method.<br />
Unpublished master dissertation, International Islamic University Malaysia, Kuala Lumpur<br />
Mohd Mazlan Che Mat (2010). Application of Value Management: Value Management-the way<br />
forward. In Seminar Achieving Better Value in Construction Industry Through Value Management &<br />
Life Cycle Costing (April 20, 2010). Putrajaya: CIDB<br />
Mohammed Kishk, Assem Al-Hajj <strong>and</strong> Pollock, R. (2003a). Whole life costing in construction: A state<br />
of the art review. The RICS Foundation Paper Series, Volume 4, Number 18. Retrieved May 25, 2010<br />
from www.rics.org.<br />
Mohammed Kishk, Assem Al-Hajj <strong>and</strong> Pollock, R. (2003b). Whole-Life Management of <strong>Building</strong>s:<br />
Towards Closing The Feedback Loop. London: The RICS Foundation. Retrieved May 25, 2010 from<br />
www.rics.org.<br />
NAFAM (2007).Executive Summary, National Asset <strong>and</strong> Facility Management Convention 2007.<br />
Retrieved December 15, 2010 from<br />
http://www.nafam.com.my/2007/NAFAM2007_ExecutiveSummary.pdf<br />
Nazzatul Shiha Nasrudin (2009). A study of cost optimization from the application of value<br />
management. Unpublished thesis for Bachelor of Quantity Surveying, Kulliyah of Architecture <strong>and</strong><br />
Environmental Design, International Islamic University, Malaysia.<br />
Ng, F. (October 8, 2009). NAFAM 2009 to address issues on life cycle costing. The Star Online.<br />
Retrieved Jun 2, 2010 from http://biz.thestar.com.my/news<br />
/story.asp?file=/2009/10/8/business/4861773&sec=business<br />
Nik Nasir Majid (2010). An Overview of PPP <strong>and</strong> the Malaysian Experience. In Malaysia’s Public-
72<br />
International <strong>Building</strong> & <strong>Infrastructure</strong> Technology Conference<br />
7-8 June 2011, Vistana Hotel, Penang, Malaysia<br />
Private Partneship Seminar (2010). Organised by Procurement & Project Delivery, System Research<br />
Unit, Kulliyah of Arcitecture <strong>and</strong> Environmental Design, International Islamic University Malaysia in<br />
collaboration with Public-Private Partnership Unit, Prime Minister Department. (August 5, 2010).<br />
Crystal Crown Hotel, Petaling Jaya<br />
Olanrewaju Abdul Lateef (2008). <strong>Building</strong> maintenance management in Malaysia. Journal of <strong>Building</strong><br />
Appraisal 2009, Vol 4: pg 207-214. Retrieved January 11, 2011 from http://www.palgravejournals.com/jba/journal/v4/n3/full/jba200827.html<br />
Olanrewaju, A.L.A, Mohd Faris, K, Arazi, I., Kafayat, S. (2010). “A comparative analysis of value<br />
engineering <strong>and</strong> life cycle costing techniques: A literature review Proceedings of the 4 th International<br />
Conference On Built Environment in Developing Countries: a better tomorrow begins with a greener<br />
today (ICBEDC 2010), volume 1: page 44-53. Universiti Sains Malaysia, December 1 to 2, 2010<br />
Puva, Hishamuddin, M. A., Shazlializa, Amin Uddin H.R.Khan, Fatin Aziz, Jibril D. Jibril (2010).<br />
Stochastic life cycle costing model of cost effectiveness in facilities management. Proceedings of the<br />
4 th International Conference On Built Environment in Developing Countries: a better tomorrow begins<br />
with a greener today (ICBEDC 2010), volume 1: page 244-254. Universiti Sains Malaysia, December 1<br />
to 2, 2010<br />
RTO-SAS-069 (2009). Code of Practice for Life Cycle Costing. RTO Publication. Retrieved May 25,<br />
2010 from www.rto.nato.int.<br />
Schade, J. (2007). Life Cycle Cost Calculation Models For <strong>Building</strong>s. Retrieved May 25, 2010 from<br />
www.rics.org.<br />
Shaziman Abu Mansor (2009). Keynote address: launch of the green building index (GBI). Kuala<br />
Lumpur Convention Centre. Retrieved December 15, 2010 from<br />
http://www.kkr.gov.my/files/teks%20Ucapan%20Green%20<strong>Building</strong>%20Index.pdf<br />
Siti Hamisah Tapsir, Fathoni.Usman, Yatim, J. M (2005). Towards Better Housing Management:<br />
Service Life Planning in Achieving Sustainability for Affordable Housing. In the Tenth International<br />
Conference on Civil, Structural <strong>and</strong> Environmental Engineering Computing, Rome, Italy. August 30-<br />
September 2, 2005, Civil-Comp Press, 2005: ISBN 1-905088-05-1. Retrieved August 2, 2010 from<br />
http://eprints.utm.my/2871/1/SHTapsir2005_towards_better_housing_management.<br />
Zainal Abidin Akasah, Nor Azizah Mohammed Rum, (2010) “Integrating life cycle costing model: A<br />
literature review.” Proceedings of the Management in Construction Researchers Association 9 th<br />
Annual Conference <strong>and</strong> Meeting (MiCRA 2010), Universiti Teknologi Mara, Malaysia, December 1 st to<br />
2nd, 2010<br />
3PU (2009a). Public Private Partnership (PPP) Guideline. Putrajaya: Public-Private Partnership Unit,<br />
Prime Minister Department. Retrieved August 15, 2010 from http://www.3pu.gov.my/html/themes/miu/<br />
content/ppp_bi_131109.<br />
3PU (2009b). Garis P<strong>and</strong>uan Kerjasama Awam-Swasta (Public Private Partnership-PPP). Putrajaya:<br />
Unit Kerjasama Awam-Swasta, Jabatan Perdana Menteri. Retrieved August 15, 2010 from<br />
http://www.3pu.gov.my/html/themes/miu/content/GP_PPP_agensi_web.pdf<br />
3PU (2010a). Public Private Partnership Unit Prime Minister’s Department: Background. In Malaysia’s<br />
Public-Private Partneship Seminar (2010). Organised by Procurement & Project Delivery, System<br />
Research Unit, Kulliyah of Arcitecture <strong>and</strong> Environmental Design, International Islamic University<br />
Malaysia in collaboration with Public-Private Partnership Unit, Prime Minister Department. (August 5,<br />
2010). Crystal Crown Hotel, Petaling Jaya
T118<br />
73<br />
International <strong>Building</strong> & <strong>Infrastructure</strong> Technology Conference<br />
7-8 June 2011, Vistana Hotel, Penang, Malaysia<br />
SUSTAINABLE HOUSING USING AN INNOVATIVE MORTARLESS<br />
INTERLOCKING BLOCKWORK SYSTEM – THE EFFECT OF PALM OIL FLY ASH<br />
(POFA) AS AN AGGREGATE REPLACEMENT<br />
Nasly M.A 1 , Abu Azam Md Yassin 2 , Norhaiza Nordin 3 ,<br />
Khairunisa Abdullah 4 , Noram Irwan Ramli 5<br />
1, 3, 4, 5 Universiti Malaysia Pahang, Kuantan, Malaysia<br />
2 CCA <strong>Systems</strong> Sdn Bhd, Johor, Malaysia<br />
1 nasly.ccas@gmail.com, 2 abuazam@gmail.com, 3 norhaiza@ump.edu.my<br />
ABSTRACT: With the increase in material costs in the construction industry, there is a need to find<br />
more cost saving alternatives material so as to maintain the cost of constructing houses at prices<br />
affordable to clients. Universiti Malaysia Pahang in collaboration with industry partner, CCA <strong>Systems</strong><br />
Sdn Bhd, has developed a building system which incorporates the interlocking load bearing block as<br />
its main feature, which consists of three different block types for the frame <strong>and</strong> wall system.<br />
Sustainability can be achieved by using Palm Oil Fly Ash (POFA) <strong>and</strong> recycled concrete <strong>and</strong><br />
aggregate related construction waste as aggregates replacement in the interlocking load bearing<br />
block.This paper describes POFA as a replacement material in the production of the interlocking load<br />
bearing block. A number of mix proportions were tested <strong>and</strong> the compressive strength of the cube<br />
blocks on the 7th day <strong>and</strong> 28th day showed that POFA at the mix ratio of 1:6:2 <strong>and</strong> 1:5:3 (cement:<br />
s<strong>and</strong>: POFA) give optimum value of the compressive strength as replacing aggregates that satisfy the<br />
required strength to be used for construction of buildings. Using the formulated mixture, interlocking<br />
load bearing block is made using the CCA press, the resultant block is tested <strong>and</strong> the compressive<br />
strength is within the required specification for house construction. The design constraints <strong>and</strong><br />
construction of a cafeteria building using the load bearing interlocking block is also presented.<br />
Keywords: POFA, sustainability, aggregates replacement, load bearing interlocking block<br />
1. INTRODUCTION<br />
The most essential item to be considered in construction to realize the building structure is the<br />
materials for construction, together with other factors such as budget, site safety, tender documents<br />
preparation <strong>and</strong> so on. Construction materials including bricks, timber, cement, <strong>and</strong> steel are<br />
increasing in dem<strong>and</strong> due to the rapid expansion of construction activities for housing, <strong>and</strong> other<br />
buildings. The current unrest in the middle eastern countries is causing rise in oil <strong>and</strong> petrol which will<br />
add to the world economic <strong>and</strong> financial upheaval resulting in the rising cost of construction materials.<br />
Hence there is the need to search alternative materials in order to fulfill the construction dem<strong>and</strong> while<br />
maintaining cost at a reasonable level.<br />
Concrete being one of the important materials in construction is produced from the mixture of cement<br />
<strong>and</strong> aggregates. Much innovation is being produced globally to face the growing dem<strong>and</strong>s of housing<br />
construction which involves new construction techniques <strong>and</strong> utilisation of waste materials for<br />
aggregate <strong>and</strong> cement replacement. POFA, a waste by product of the palm oil mill, could also be an<br />
alternative of aggregate replacement. The POFA usage in bricks material as aggregates replacement<br />
will reduce the cost of producing bricks. Achieving strength <strong>and</strong> durability are the targets in any<br />
concrete mix design. This paper will present the results of some experimental studies on obtaining the<br />
optimum mix ratio of compressed concrete using POFA as aggregate replacement with respect to the<br />
compressive strength for 7 <strong>and</strong> 28 days.
74<br />
International <strong>Building</strong> & <strong>Infrastructure</strong> Technology Conference<br />
7-8 June 2011, Vistana Hotel, Penang, Malaysia<br />
2. THE INTERLOCKING BLOCK TECHNIQUE<br />
The construction method of using conventional bricks has been revolutionised by the development <strong>and</strong><br />
usage of interlocking concrete masonry units (CMU) <strong>and</strong> lightweight concrete blocks. The tedious <strong>and</strong><br />
time-consuming traditional brick-laying tasks are greatly simplified by the usage of these effective<br />
alternative solutions.<br />
The interlocking blocks are different from conventional bricks since they do not require mortar for<br />
bricklaying work. Because of this characteristic, the process of building walls is faster <strong>and</strong> requires<br />
less skilled labour as the blocks are laid dry <strong>and</strong> lock into place.<br />
Figure 1. Aligning blocks<br />
Concrete blocks may be produced with hollow centres to reduce weight, avoid seepages or improve<br />
insulation. The holes inside the concrete block allow rebar <strong>and</strong> concreting (creating reinforced<br />
concrete) to run vertically through the block to compensate for the lack of tensile strength. Mild steel<br />
rebar can be used instead of the usual higher grade steel. Once a section of wall is built, grout holes<br />
are filled with a lean cement mixture to seal the wall <strong>and</strong> solid. The amount of grout used was<br />
calculated to be less than 7.5% of the mortar used in conventional masonry.<br />
2.1 Production of Interlocking Blocks<br />
Interlocking blocks were produced in special moulds, in which compaction is done mechanically,<br />
depending on the type of block, material used, required quality <strong>and</strong> available resources. The blocks<br />
can be made directly at the building site, or on a larger scale in a production yard.<br />
Concrete blocks are the common manufactured interlocking load bearing blocks that require high<br />
compression strength. After opening the lid <strong>and</strong> ejecting the block, it was removed <strong>and</strong> flipped before<br />
stacking in a shaded place for curing <strong>and</strong> hardening. Moist conditions is maintained to ensure uniform<br />
curing <strong>and</strong> hardening. After demoulding, the blocks are carried away on pallets for curing.<br />
A typical compressive strength of concrete blocks is 7N/mm 2 .
Figure 2. Hydraulic powered block press<br />
75<br />
International <strong>Building</strong> & <strong>Infrastructure</strong> Technology Conference<br />
7-8 June 2011, Vistana Hotel, Penang, Malaysia<br />
3. PALM OIL FUEL ASH (POFA) AS AGGREGATE REPLACEMENT<br />
Malaysia is the world’s leading producer <strong>and</strong> exporter of palm oil products with a reputation for quality<br />
<strong>and</strong> consistency. To date, there are more than two hundred palm oil mill plants operating in the<br />
country that are self sufficient industry as far as energy utilisation is concerned. Palm Oil Fuel Ash<br />
(POFA) is a waste material obtained by burning of palm oil husk <strong>and</strong> shell as fuel in palm oil mill<br />
boilers. For now, thous<strong>and</strong>s of tons of ash are produced annually <strong>and</strong> are simply disposed without<br />
any profitable <strong>and</strong> commercial return. Like other fly ashes, palm oil fuel ash is grayish black in colour,<br />
becoming darker with increasing proportions of unburnt carbon. The palm oil ash that had been<br />
considered worthless can actually be used in construction industry specifically in concrete technology.<br />
Both physical properties <strong>and</strong> chemical analysis indicated that POFA is a pozzolanic material. This<br />
pozzolanic material is grouped in between Class C <strong>and</strong> Class F as specified in ASTMC618-92a (Awal<br />
& Hussin, 1996). Meanwhile, POFA is much influenced by the operating system in palm oil factory. It<br />
also has been found that POFA could produce a more durable concrete.<br />
Since our country is continuously increasing the production of palm oil, therefore more ashes will be<br />
produced <strong>and</strong> failure to find any solution will result in potential disposal problem. Thus, by utilizing this<br />
type of waste material we can cut down the number of l<strong>and</strong>fill areas required for disposing the ash<br />
hence averting potential future environmental problem.<br />
3.1 Experimental Methodology<br />
Compressed concrete cubes from eight different mix ratios were produced by using a special steel<br />
mould to produce cubes of sized 100mm x 100mm x 100mm. The mixture are filled up into the mould<br />
then compacted to the size required by a hydraulic machine. The cube samples produced then went<br />
through the curing processes which are either air dried curing method or covered with wet gunny<br />
sacks for 7 days <strong>and</strong> 28 days. The strength of the compressed concrete cubes on 7 days <strong>and</strong> 28 days<br />
curing age were determined by the normal cube compression till destructive test. The density of the<br />
cubes was also recorded.
3.2 POFA Concrete Cube Strength<br />
3.2.1 Compressive strength on mix ratios<br />
Figure 3. Compaction by hydraulic power<br />
Figure 4. Curing of POFA concrete cubes<br />
76<br />
International <strong>Building</strong> & <strong>Infrastructure</strong> Technology Conference<br />
7-8 June 2011, Vistana Hotel, Penang, Malaysia<br />
Materials prepared using mix ratios of cement:s<strong>and</strong>:POFA range from 1:0:8 to 1:6:2. From the results<br />
of compressive strength of the cubes obtained, the graphs were plotted as shown below. The<br />
percentage of POFA used (1:6:2) is 22.2 % which gives the highest value of compressive strength<br />
which was 5.43 N/mm2 for 7days <strong>and</strong> 6.96 N/mm2 for 28 days. Then followed by 33.3 % of POFA<br />
(1:5:3) used in mixture. These area the only cubes that attained the 5.4 N/mm 2 minimum value for<br />
load bearing blocks.
77<br />
International <strong>Building</strong> & <strong>Infrastructure</strong> Technology Conference<br />
7-8 June 2011, Vistana Hotel, Penang, Malaysia<br />
Table 1. Test Results Compressive Strength from each mix ratio<br />
Average Compressive Strength (N/mm 2 Cement/s<strong>and</strong>/POFA POFA<br />
)<br />
ratio<br />
(%) 7-day 7-day<br />
1:0:8 88.9 1.23 1.77<br />
1:2:6 66.7 1.47 1.60<br />
1:3:5 55.6 2.32 3.18<br />
1:4:4 50.0 2.73 3.66<br />
1:5:3 33.3 4.99 6.42<br />
1:6:2 22.2 5.43 6.96<br />
Figure 5. Compressive strength by percentage of POFA for 1 part cement to 8 parts aggregate<br />
3.2.2 Compressive strength by different curing methods<br />
A series of tests were carried out to examine the strength of the POFA concrete cubes against the<br />
curing method or exposure after production. These cubes of different mix ratios were cured by either<br />
air dried curing or moist gunny sack curing. The results of compressive strength from both curing<br />
methods were then compared as shown in Figure 6.<br />
Table 2. Compressive strength due to differenct curing methods.<br />
Average Compressive Strength<br />
(N/mm 2 Cement/S<strong>and</strong>/POFA<br />
Ratio<br />
POFA<br />
(%)<br />
)<br />
Air dried Covered curing<br />
1:00:08 88.9 1.27 1.57<br />
1:02:06 66.7 1.53 1.67<br />
1:03:05 55.6 3.1 3.26<br />
1:04:04 50 3.38 3.93<br />
1:05:03 33.3 5.6496 6.42<br />
1:06:02 22.2 5.916 6.96
78<br />
International <strong>Building</strong> & <strong>Infrastructure</strong> Technology Conference<br />
7-8 June 2011, Vistana Hotel, Penang, Malaysia<br />
Figure 6. Compressive Strength on 28 days cube age by different curing methods applied on each<br />
mix ratio.<br />
From Figure 6, we can see that the compressive strength of the POFA concrete cubes obtained by<br />
covered curing method have higher values than those that underwent air dried curing.<br />
3.2.3 Compressive strength between POFA <strong>and</strong> Quarry Dust concrete cubes<br />
The normal compressed concrete blocks produced in the industry is using cement:s<strong>and</strong> or<br />
cement:s<strong>and</strong>:quary dust. Two mix ratios that are being compared in this section are ratio of 1:5:3 <strong>and</strong><br />
ratio of 1:6:2, since these ratio mixes gave cube compressive strength exceeded the minimum<br />
required of 5.4N/mm2.<br />
Table 3. Compressive strength of POFA <strong>and</strong> Quarry Dust concrete cubes<br />
Ratio (cement:s<strong>and</strong>:POFA/QD) Compressive Strength (N/mm 2 )<br />
Cube Age (days) 7 28<br />
Materials POFA QD POFA QD<br />
1:5:3 4.99 8.00 6.42 8.91<br />
1:6:2 5.43 8.29 6.96 10.23<br />
Figure 7. Compressive Strength of Concrete Cubes using POFA or Quarry Dust as aggregate
79<br />
International <strong>Building</strong> & <strong>Infrastructure</strong> Technology Conference<br />
7-8 June 2011, Vistana Hotel, Penang, Malaysia<br />
From the data obtained, as shown in Figure 7, the compressed concrete using Quarry Dust has higher<br />
compressive strength than the concrete cubes using POFA. The compressive strength of QD concrete<br />
is greater than 7 N/mm 2 , the normal value used by most concrete block producers, it can be used to<br />
build as load-bearing <strong>and</strong> non load-bearing structures. As for the compressed concrete using POFA, it<br />
is recommended for use in external works as non load-bearing structures since the compressive<br />
strengths exceed the required 5.4 N/mm 2 st<strong>and</strong>ard.<br />
4. DESIGN AND CONSTRUCTION OF BUILDING<br />
4.1 Construction Concepts Using Load Bearing Blocks<br />
The cavity holes of the interlocking blocks permit the introduction of vertical reinforcement embedded<br />
in concrete without the need for any formwork thus eliminating the use of wood in form work.<br />
Reinforcement can be introduced to make the building withst<strong>and</strong> earthquakes <strong>and</strong> heavy wind loads.<br />
Because of the size <strong>and</strong> resistance of the blocks, load bearing walls can be constructed.<br />
Before placing the first course in a mortar bed, the blocks must be laid dry on the foundation around<br />
the entire building, in order to ensure that they fit exactly next to each other (leaving no gaps), <strong>and</strong> that<br />
an exact number of full blocks are used, otherwise the system will not function. When laying the first<br />
course in the mortar bed, care must be taken that the blocks are perfectly horizontal, <strong>and</strong> in a straight<br />
line, <strong>and</strong> at right angles at corners.<br />
Once the base course is properly hardened, the blocks are stacked dry, with the help of a wooden or<br />
rubber hammer to tap the blocks gently into place. Up to 10 layers can be placed at a time, before the<br />
grout holes are filled with a liquid mortar - 1 part cement to 3 parts s<strong>and</strong> to 1 part water.<br />
Interlocking blocks are ideally suited for load-bearing wall constructions, even for two or more storey<br />
buildings, provided that the height of the wall does not exceed 20 times its thickness, <strong>and</strong> wall sections<br />
without buttresses or cross walls do not exceed 4.5 m length (to prevent buckling).<br />
4.2 <strong>Building</strong> design using load bearing blocks<br />
Almost any type of building can be constructed with interlocking blocks, the main design constraints<br />
being that the plan should be rectangular <strong>and</strong> all wall dimensions <strong>and</strong> openings must be multiples of<br />
the width of the block type used. All other principles of design <strong>and</strong> construction, such as dimensioning<br />
of foundations, protection against rain <strong>and</strong> ground moisture, construction of ceilings <strong>and</strong> roofs, <strong>and</strong> the<br />
like, are the same as for other st<strong>and</strong>ard building types.<br />
It is advisable to place channel blocks around the building, at window sill height, to install a ring beam.<br />
They should also be placed directly above doors <strong>and</strong> windows to install lintels, <strong>and</strong> directly below the<br />
roof to finish the walls with a ring beam. To increase structural stability, especially in earthquake<br />
regions, steel rods or treated kenaf should be inserted in the vertical grout holes, especially at corners,<br />
wall junctions <strong>and</strong> on either sides of openings.<br />
4.3 MTDC Cafeteria building using load bearing interlocking block system<br />
Initially the foundation, ground beam <strong>and</strong> ground slab is laid with the appropriate vertical steel<br />
implanted. It takes normally a week for the foundation to set, then the first layer of interlocking load<br />
bearing blocks is arranged to ensure that the wall is straight <strong>and</strong> right angled at the corners as shown<br />
in Figure 8a.<br />
After that the crew of four workers can independently stack up the blocks to the required height.<br />
Horizontal bars are placed for the construction of ring beam around the house for added stiffness as<br />
shown in Figure 8b <strong>and</strong> 9a.
80<br />
International <strong>Building</strong> & <strong>Infrastructure</strong> Technology Conference<br />
7-8 June 2011, Vistana Hotel, Penang, Malaysia<br />
(a) First layer of blocks (b) Below window sill layer<br />
Figure 8. Typical construction site of an interlocking load bearing concrete block building<br />
(a) Below window level with water piping (b) roof ring beams<br />
Figure 9. Typical construction of ring beams<br />
Figure 10. Final touches <strong>and</strong> the completed building<br />
5. CONCLUSIONS<br />
The conclusions that can be drawn in this study are as follows:<br />
1. The mix ratio of 1:6:2 <strong>and</strong> 1:5:3 (cement: s<strong>and</strong>: POFA) achieved the required compressive<br />
strength st<strong>and</strong>ard of 5.4kN/mm 2 for external walls construction.<br />
2. The cubes need to be cured using moist covering to obtain higher compressive strength as<br />
compared to cubes that had free air exposure even under shades.<br />
3. From the observation, the cubes that have high % POFA e.g. 1:2:6 (cement: s<strong>and</strong>: POFA), the<br />
cubes are more brittle especially on the surface of the cubes.<br />
4. The interlocking load bearing block using POFA as a partial replacement to quarry dust satisfy the<br />
required specification for the construction of a single storey building.
81<br />
International <strong>Building</strong> & <strong>Infrastructure</strong> Technology Conference<br />
7-8 June 2011, Vistana Hotel, Penang, Malaysia<br />
ACKNOWLEGEMENTS<br />
The authors acknowledge the Malaysia Technology Development Corporation (MTDC) for grant<br />
provided that has resulted in this article. The authors also wish to acknowledge cooperation given by<br />
the CCA <strong>Systems</strong> Sdn Bhd for sharing the research works <strong>and</strong> the contractor Teras Maju Dinamik for<br />
actual construction using the blocks.<br />
REFERENCES<br />
British St<strong>and</strong>ards Institution. Specification for clay bricks. BS3921: 1985.<br />
British St<strong>and</strong>ards Institution. Testing concrete. London. BS 1881. 1983<br />
Christine Beall (1997). “Masonry Design <strong>and</strong> Detailing”. 4 th<br />
edition. McGraw-Hill.<br />
Arnold W. Hendry, B. P. Sinha, S. R. Davies (1981). “An Introduction To Load Bearing Brickwork<br />
Design”. Ellis Horwood Limited.<br />
M. W. Hussin, A.S.M. Abdul Awal (1996) “Influence of Palm Oil Fuel Ash on Strength <strong>and</strong> Durability of<br />
Concrete”. Proceedings of the 7th<br />
International Conference on Durability of <strong>Building</strong> materials <strong>and</strong><br />
Components, Stockholm, Sweden, pp. 291 – 298, 19 -23 May, 2006.<br />
Nasly M.A. , A.A.M. Yassin et al, (2010) Compressed Stabilised Earth as Load Bearing Interlocking<br />
Block, International Journal of Civil Engineering & Geo-Environmental , ISSN 21802742, vol 1, Issue<br />
1.<br />
D. F. Orchard (1963). “Concrete Technology, Volume 2 Practice”. John Wiley & Sons INC, New York.<br />
Abdul Hafidz bin A Rahman (2010). Compressed Concrete Uing Palm Oil Fuel Ash. Skudai: Universiti<br />
Teknologi Malaysia, Undergraduate Thesis.<br />
Shan Somayaji (2001). “Civil Engineering Materials”. 2 nd<br />
edition. Prentice-Hall, Inc.Upper Saddle<br />
River, New Jersey.
T121<br />
82<br />
International <strong>Building</strong> & <strong>Infrastructure</strong> Technology Conference<br />
7-8 June 2011, Vistana Hotel, Penang, Malaysia<br />
CIVIL ENGINEERING AND ARCHITECTURAL BUILDING FEATURES DISPARITY<br />
AND PRESERVATION OF STRUCTURAL AND FABRICS INTEGRITY IN<br />
HERITAGE BUILDING: A REVIEW<br />
Siti Nor Fatimah Zuraidi 1 , Zainal Abidin Akasah 2<br />
<strong>and</strong> Mohammad Ashraf Abdul Rahman 3<br />
1,2,3 Universiti Tun Hussein Onn Malaysia, Johor, Malaysia<br />
1 timi-gee@yahoo.com , 2 zainal59@uthm.edu.my , 3 ashrafr@uthm.edu.my<br />
ABSTRACT: This paper will be presents a review of the literature pertinent to the life-cycle<br />
preservation, operation, <strong>and</strong> maintenance aspects of buildings features disparity are rarely considered<br />
at the initial design <strong>and</strong> construction stages. This is due to the facts that mainly in the disconnections<br />
within built facilities life-cycle, from their initial creation processes, through use to obsolescence. There<br />
is also a dearth of knowledge of the specific impact of upstream design <strong>and</strong> construction decisions <strong>and</strong><br />
choices on the downstream preservation, operation, <strong>and</strong> maintenance of building structures <strong>and</strong><br />
fabrics. Hence, in order to bridge this knowledge gap <strong>and</strong> forge a connection between design <strong>and</strong> lifecycle<br />
use <strong>and</strong> maintenance of buildings, this study aims to identify design defect which affect building<br />
maintenance <strong>and</strong> to identify the systematic framework for selecting a suitable maintenance strategy for<br />
each individual item in a building. The investigation for this study will be undertaken in two phases.<br />
The first phase involved a literature search on the identification of some of the relative defect factors in<br />
design stage that affect maintenance. The second phase involved gathering data through site visits,<br />
interviews <strong>and</strong> discussions with owners, architectural/engineering firms <strong>and</strong> contractors. The scope of<br />
this research will be limited to civil <strong>and</strong> architectural defects in building design that affect maintenance<br />
only in the Museum Adat Istiadat Melayu Kelantan (Muzium Islam). It will be observed that the<br />
different of structural <strong>and</strong> fabrics integrity of these buildings to their different defect styles <strong>and</strong> features.<br />
This finding will underscores the importance of designing architectural features of buildings with their<br />
operation, maintainability, <strong>and</strong> life-cycle preservation in mind, if structural <strong>and</strong> fabrics integrity must be<br />
maintained, <strong>and</strong> a greater sustainability achieved, while restoration ringgit are saved.<br />
Keywords: construction, architectural, building, maintenance, life-cycle, preservation, defects<br />
1. INTRODUCTION<br />
Malaysia is a fast developing country <strong>and</strong> new building are being erected every to accommodate the<br />
needs of public <strong>and</strong> private sectors. Many building construction projects have been built due to the<br />
dem<strong>and</strong> of both the public <strong>and</strong> private sectors. In order to meet the high dem<strong>and</strong> of both the public<br />
<strong>and</strong> private sectors in new building constructions in a short space of time, it is anticipated that many<br />
defects will arise especially during design <strong>and</strong> construction phase. This will inevitably resulting in high<br />
maintenance costs. Maintenance costs of a building during their functional lifetime could easily<br />
surpass the initial outlay of a new building. Therefore it's important to consider maintenance aspects at<br />
the very outset of the life cycle of a building because decisions made at planning, design <strong>and</strong><br />
construction stages have a large<br />
effect on the maintenance costs <strong>and</strong> works incur later in the life cycle of a building. Aged building<br />
doesn't necessary have to be associated with high maintenance cost as a new building with numerous<br />
defects from faulty design <strong>and</strong> construction could easily equal or surpass the maintenance cost of an<br />
aged building (Ahmad Ramly et al, 2007).<br />
Under normal condition all building begins to deteriorate the moment after they are constructed, <strong>and</strong> of<br />
course maintenance is needed. One research conducted in United Kingdom revealed about 20% of<br />
the average annual expenditure on repairs in building arises from defects (Sadi Assaf et al, 1996). As<br />
consequences if the number of defects could be reduce it would reduce the maintenance<br />
expenditures.
83<br />
International <strong>Building</strong> & <strong>Infrastructure</strong> Technology Conference<br />
7-8 June 2011, Vistana Hotel, Penang, Malaysia<br />
It is obvious that the need of maintenance is very important <strong>and</strong> needed for all sectors including<br />
properties sectors. Regard to the highly cost of maintenance it is important to study maintenance<br />
problem so that an effective maintenance can be carried out.<br />
Maintenance is defined as the required processes <strong>and</strong> services undertaken to preserve, protect,<br />
enhance <strong>and</strong> care for the university buildings’ fabrics <strong>and</strong> services after completion, in accordance<br />
with the prevailing st<strong>and</strong>ards to enable the building <strong>and</strong> services to serve their intended functions<br />
throughout their entire life span without drastically upsetting their basic features <strong>and</strong> uses (Lateef,<br />
2010).<br />
<strong>Building</strong> maintenance is defined as “work undertaken in order to keep, restore or improve every part of<br />
a building, its services <strong>and</strong> surrounds, to a currently accepted st<strong>and</strong>ard, <strong>and</strong> to sustain the utility <strong>and</strong><br />
value of the building”. The objectives of building maintenance are therefore (Alner, 1990):<br />
a. To ensure that the buildings <strong>and</strong> their associated services are in a safe condition;<br />
b. To ensure that the buildings are fit for use;<br />
c. To ensure that the condition of the building meets all statutory requirements;<br />
d. To carry out the maintenance work necessary to maintain the value of the physical assets of the<br />
building stock; <strong>and</strong><br />
e. To carry out the work necessary to maintain the quality of the building.<br />
1.1 Problem Statement<br />
The Malaysia is a rich developing country with huge capital resources. It is developing very fast in<br />
every area including building construction. Public <strong>and</strong> private sectors have initiated the need for large<br />
<strong>and</strong> complex construction projects. Meeting the high dem<strong>and</strong> of both parties in a short time, it is<br />
expected that many errors <strong>and</strong> defects have occurred during the design <strong>and</strong> construction stages which<br />
will result later in high maintenance costs. <strong>Building</strong> maintenance is a major activity in most countries.<br />
The researcher believes that the neglect of building maintenance in Malaysia is serious that<br />
intervention at national level must be done. Since maintenance problems in building facilities are<br />
heavily attributed to many factors, whereby the most important ones are design limitations <strong>and</strong><br />
construction knowledge, owners must be made aware that insufficient funding of design <strong>and</strong><br />
construction will impact future maintenance capabilities. Owners will continually be challenged to meet<br />
greater dem<strong>and</strong> for improved maintenance st<strong>and</strong>ard with less staff, less capital <strong>and</strong> in less time than<br />
ever before if nothing is to be done (Chong, 2004).<br />
Problems in buildings can be broadly categorized as defects or deterioration. Defects arise due to<br />
errors or omission or negligence by the designers or contractors. Deterioration on the other h<strong>and</strong>, is<br />
the natural process which is unavoidable, although maybe minimized by exercising care in design,<br />
material selection <strong>and</strong> proper construction method. A research by Gibson (1979) found that while most<br />
building defects are associated with the structure, others are associated with unsightly patterns of<br />
soiling of the elevations <strong>and</strong> lack of accessibility to services. Whereas, for a building not more than 25<br />
years old, Ranson (1981) showed that design faults <strong>and</strong> specifications comes the second after the<br />
wear <strong>and</strong> tear factor.<br />
Accordingly, any reduction in resources applied to building maintenance will have a visible effect on<br />
the national economy. The easiest way to cut maintenance costs is to stop doing maintenance. This<br />
approach is simple, but the long-term results are usually very costly. Thus, the goal of the new<br />
approach is to carry out as little maintenance as possible as infrequently as possible while at the same<br />
time preserving the availability of the services facilities, the building elements <strong>and</strong> the whole building.<br />
In other words, maintenance should be carried out only when necessary to ensure the continued, safe<br />
<strong>and</strong> profitable use of the building at acceptable levels of satisfaction or when there is the possibility of<br />
extending the useful life of the elements of the building.<br />
1.2 Objective of Study<br />
The relative objectives to achieve the aim of study are as follows:<br />
a. To identify design defect which affect building maintenance.<br />
b. To identify the systematic framework for selecting a suitable maintenance strategy for each<br />
individual item in a building.
84<br />
International <strong>Building</strong> & <strong>Infrastructure</strong> Technology Conference<br />
7-8 June 2011, Vistana Hotel, Penang, Malaysia<br />
1.3 Scope of Study<br />
The scope of this study will be limited to civil engineering <strong>and</strong> architectural building features<br />
associated with certain faults <strong>and</strong> defects, <strong>and</strong> by implication, impact preservation of buildings’<br />
structural <strong>and</strong> fabrics integrity design that affect maintenance. The Museum Adat Istiadat Melayu<br />
Kelantan (Muzium Islam) will be investigated to illustrate the problem related in this study.<br />
2. LITERATURE REVIEW<br />
A research by Arditi <strong>and</strong> Nawakorawit (1999) has shown that design plays a major role in determining<br />
the condition of buildings after completion, especially in the aspects of defects <strong>and</strong> maintenance.<br />
Indirectly, design influences the performance <strong>and</strong> physical characteristics of the building <strong>and</strong> its<br />
durability to st<strong>and</strong> against environmental elements, noise <strong>and</strong> social interferences such as graffiti <strong>and</strong><br />
v<strong>and</strong>alism. Therefore, the link between design <strong>and</strong> maintenance should not only be seen from the<br />
point of increasing number of repair works or cost involve, but it needs to consider also the impact of a<br />
design on structure <strong>and</strong> materials installed as well as the life cycle for each of the components or<br />
elements of the building.<br />
Arditi <strong>and</strong> Nawakorawit (1999) have listed 22 sources of the major maintenance related complaints on<br />
building defects that designers <strong>and</strong> property owners each, reported receiving from clients. The<br />
complaints are categorized in 5 groups:<br />
a. Safety<br />
b. Design quality<br />
c. Maintenance<br />
d. User comfort<br />
e. <strong>Building</strong> services<br />
Results from the survey show that complaints on user comfort become the clients‟ number one<br />
concern followed by maintenance. Design quality category was almost not in their list as most clients<br />
(<strong>and</strong> designers themselves) believe building design <strong>and</strong> building operation/maintenance are entirely<br />
separated <strong>and</strong> both building owners <strong>and</strong> designers did not consider serious enough.<br />
Assaf et al 1996 identified 11 major groups of faults; they are, the defects in civil design, architectural<br />
defects in design, design defects in maintenance practicality <strong>and</strong> adequacy, defects due to consultant<br />
firm administration <strong>and</strong> staff, defects due to construction drawings, defects due to construction<br />
inspections, defects due to civil construction, defects due to contractor administration, defects due to<br />
construction equipment, defects due to construction materials <strong>and</strong> defects due to specifications.<br />
Through literatures, the author had identified six dominant variables that are associated with the<br />
decision making of building cost. The variables are:<br />
a. Existing building condition<br />
The existing conditions of buildings were assessed through several ways. One of the easiest methods<br />
is by using visual survey. The exterior of each building structure was viewed from the ground level <strong>and</strong><br />
all important information would be documented <strong>and</strong> some areas of deterioration are noted through<br />
annotated sketches <strong>and</strong> plans.<br />
b. <strong>Building</strong> age<br />
Age of building provides important indication on level of maintenance service required. The important<br />
elements that need to be considered in allocation of maintenance resources is the building’s age. In<br />
order to know the future image of building, building manager needs to offer right service so that the<br />
building has competitive advantage (Lateef, 2010). Services given must meet expectation in response<br />
to time, delivery schedules <strong>and</strong> within the agreed performance indicator.<br />
c. Complaint received regarding building performance<br />
Inefficient maintenance works could invite complaints by the building users. Users are normally looking<br />
for a comfortable space in a building. This includes well functions of building equipments, clean<br />
environment, <strong>and</strong> safe. If buildings do not fulfil the user’s needs, complaints with regards to<br />
maintenance performance would be made by the users.
85<br />
International <strong>Building</strong> & <strong>Infrastructure</strong> Technology Conference<br />
7-8 June 2011, Vistana Hotel, Penang, Malaysia<br />
d. Client’s request<br />
Client refers to the owner of a building. The client is the one who provides maintenance finance <strong>and</strong> a<br />
project brief in the early stage of maintenance works. Quality of client’s brief would influence the<br />
building performance. The key successful of design is rests much with the clients besides others such<br />
as a good budget.<br />
e. Availability of funding<br />
A most trying constraint from the design point of view is the budget allocation. That most important<br />
factor contributing to successful maintenance work was a sufficient budget allocated for a project. The<br />
project fund must be sufficient to ensure the maintenance works could run smoothly (Gibson, 1979).<br />
f. Safety <strong>and</strong> health requirements<br />
Safety <strong>and</strong> health are comm<strong>and</strong> factors influenced in the decision making of maintenance works (Lee,<br />
2009). This is because building maintenance works can lead a risk to maintenance personnel <strong>and</strong><br />
building users. It is the responsibility of building stakeholders particularly the manager to ensure that<br />
health <strong>and</strong> safety assessments <strong>and</strong> safety work procedure are documented.<br />
2.1 <strong>Building</strong> Maintenance<br />
<strong>Building</strong> maintenance is a major activity in most countries. Any reduction in resources applied to<br />
building maintenance will have a visible effect on the economy. Few years ago, a rapid growth of<br />
housing construction clearly appears as a part of the country development. The number of modern<br />
houses increases <strong>and</strong> more houses are being constructed. As a result, more maintenance work is<br />
required in order to cope with this type of construction.<br />
In maintaining a building, there are usually several strategic options available to management, <strong>and</strong><br />
many alternative decisions to be considered. There is, for example, the possibility of reducing the<br />
dem<strong>and</strong> for maintenance by addressing the actual cause of failure <strong>and</strong> identifying its consequences.<br />
For instance, it may be necessary to decide whether to repair or replace an item, <strong>and</strong> whether to carry<br />
out periodic maintenance at fixed intervals or simply to respond to the requests of the users. Thus,<br />
building maintenance can be divided into three strategies:<br />
a. Corrective<br />
Corrective maintenance is the simplest type of maintenance strategy, where an element in a building<br />
is used until it breaks down. It covers all activities, including replacement or repair of an element that<br />
has failed to a point at which it cannot perform its required function. Corrective maintenance is<br />
sometimes referred to as failure-based or unplanned maintenance.<br />
b. Preventive<br />
Preventive maintenance was introduced to overcome the disadvantages of corrective maintenance, by<br />
reducing the probability of occurrence of failure <strong>and</strong> avoiding sudden failure. This strategy is referred<br />
to as time-based maintenance, planned maintenance or cyclic maintenance. Preventive maintenance<br />
tasks are performed in accordance with a predetermined plan at regular, fixed intervals, which may be<br />
based for example on operating time. Such a strategy is frequently applied to external or internal paint<br />
work.<br />
c. Condition-based<br />
Condition-based maintenance is defined as: “Maintenance carried out in response to a significant<br />
deterioration in a unit as indicated by a change in monitored parameter of the unit condition or<br />
performance” (Kelly <strong>and</strong> Harris, 1978). The condition-based maintenance concept recognizes that a<br />
change in condition <strong>and</strong>/or performance of an item is the principal reason for carrying out<br />
maintenance. Thus, the optimal time to perform maintenance is determined from a condition survey<br />
used to determine the actual state of each constituent item in a building.
86<br />
International <strong>Building</strong> & <strong>Infrastructure</strong> Technology Conference<br />
7-8 June 2011, Vistana Hotel, Penang, Malaysia<br />
2.2 <strong>Building</strong> Defect<br />
Defects within new buildings are areas of non-compliance with the <strong>Building</strong> Code of Practice <strong>and</strong><br />
published acceptable tolerances <strong>and</strong> st<strong>and</strong>ards. Older buildings, or buildings out of warranty period,<br />
may not comply with these st<strong>and</strong>ards but must be judged against the st<strong>and</strong>ard at the time of<br />
construction or refurbishment. <strong>Building</strong> maintenance can be broadly as the application of scientific<br />
principles to the care <strong>and</strong> preservation of building assets. A building, product or application can<br />
become defective through age <strong>and</strong> lack of maintenance <strong>and</strong> professional advice should be obtained to<br />
ensure that replacement or works undertaken are using materials <strong>and</strong> current systems of application<br />
that are appropriate to the building. Examples of building defects are where structural settlement<br />
cracks are occurring to brickwork, excessive structural sagging to a roof, ill-fitting windows <strong>and</strong> doors,<br />
leaking showers <strong>and</strong> sagging ceilings. <strong>Building</strong> maintenance is therefore concerned with the technical<br />
requirements of investigating <strong>and</strong> diagnosing faults to assess condition; with the organizational needs<br />
to specify, select, implement <strong>and</strong> supervise remedial works <strong>and</strong> with the management operations to<br />
plan, preventive <strong>and</strong> corrective programmers (Rozita Aris, 2006).<br />
2.2.1 Failure of buildings<br />
<strong>Building</strong>s may fail for a number of reasons. Figure 1 shows a breakdown of the most common reasons<br />
for this.<br />
Figure 1. Breakdown of the most common reasons (Ahmad, 2006).<br />
2.2.1.1 Faulty Design<br />
Faults in building design place a heavy burden on the building for rest of its life <strong>and</strong> there is no<br />
compensation for it. In such situations, the responsibility falls on the shoulders of the designer in that<br />
they must think carefully with full concentration <strong>and</strong> consideration towards completion of their design<br />
project. Explaining the link between maintenance <strong>and</strong> building design, suggests that four sectors of<br />
building design should be considered <strong>and</strong> regarded as important if one is to avoid the need for<br />
unplanned maintenance at the post-occupation stage (Ramly, 2006). These sectors are:<br />
a. The main fabric which includes walls, floors, roofs, doors <strong>and</strong> windows;<br />
b. Internal finishes which includes ceiling <strong>and</strong> wall finishes as well as floors;<br />
c. Special design features such as decorative elements for the doors, windows, glass, air vents <strong>and</strong><br />
special brick <strong>and</strong> stone work;<br />
d. The fourth <strong>and</strong> the last sector is cleaning <strong>and</strong> house keeping of all building components.<br />
This study identified deterioration in these sectors that resulted from design faults, which subsequently<br />
imposed a heavy financial burden on the occupier or owner. Based on the outline of causes derived
87<br />
International <strong>Building</strong> & <strong>Infrastructure</strong> Technology Conference<br />
7-8 June 2011, Vistana Hotel, Penang, Malaysia<br />
from the work of the implication of design fault on maintenance in building has resulted from the<br />
following (Gibson, 1979):<br />
a. The consequence of thermal movement;<br />
b. The consequence of inefficient detailing;<br />
c. The consequence of improper material selection; <strong>and</strong><br />
d. The consequence of poor design for access for maintenance measures.<br />
Faulty design decisions are the most common faults which may be grouped as follows: failure to follow<br />
well-established design criteria in the choice of structural system <strong>and</strong> selection of materials; ignorance<br />
of the basic physical properties of the materials; use of new materials or innovative forms of<br />
construction which have not been properly tested for use; misjudgement of climatic conditions under<br />
which the material has to perform; <strong>and</strong> poor communication between different members of the design<br />
<strong>and</strong> construction teams (Lee, 1987).<br />
In most of the literature reviewed by Boyle (2003), Ramly (2006), Reason (1990), Melchers (1989)<br />
<strong>and</strong> Porteous (1992) the words “fault,” “failure” <strong>and</strong> “defect” were used interchangeably to describe<br />
imperfections in constructed buildings. A building defect or fault may be considered to be a failing or<br />
shortcoming in the function, performance, statutory or user requirements of a building, <strong>and</strong> manifests<br />
itself within the structure, fabric, services or other facilities of the elected building (Watt, 1999). The<br />
term “defect” or “fault” is preferred in this paper, but not in the sense of the building or components<br />
failing to full intended functions (Allen, 1971).<br />
<strong>Building</strong> faults, failures or defects are emotive terms <strong>and</strong> mean various things to deferent people, but<br />
always suggest that the client involved has had an unsatisfactory solution (Campbell, 2001). The vast<br />
majority of building faults <strong>and</strong> failures are not dramatic collapses, but far less newsworthy structural or<br />
mechanical problems <strong>and</strong> issues of serviceability such as minor cracking <strong>and</strong> water ingress (Holtham,<br />
2001). Other signicant factors included inadequate design information <strong>and</strong> poor site practices. The<br />
detailed results of the research, summarized in <strong>Building</strong> Research Establishment (<strong>Building</strong> Research<br />
Establishment, 1988) provide a useful attribution of fault to particular building elements (see Table 1).<br />
Another research, conducted by the BRE Advisory Service <strong>and</strong> based on its database of building<br />
defects (Watt, 1999), identified the ten main types of defect shown in Table 2.<br />
Table 1. <strong>Building</strong> elements <strong>and</strong> fault attribution<br />
S/No <strong>Building</strong> element Fault attribution (%)<br />
1 External walls 20<br />
2 Roofs 19<br />
3 Windows <strong>and</strong> doors 13<br />
4 Floors 11<br />
5 Services 9<br />
6 Sub-structure 7<br />
7 Internal partitions 4<br />
8 Separating walls 4<br />
9 Stairs 4<br />
10 Planning <strong>and</strong> layout 4<br />
11 General <strong>and</strong> external works 4<br />
Note: Adapted from Watt (1999).
Table 2. Main defect types<br />
88<br />
International <strong>Building</strong> & <strong>Infrastructure</strong> Technology Conference<br />
7-8 June 2011, Vistana Hotel, Penang, Malaysia<br />
S/No Defect types Magnitude (%)<br />
1 Rain penetration 22<br />
2 Condensation 17<br />
3 Cracking 16<br />
4 Detachment 13<br />
5 Entrapped water 6<br />
6 Sound transmission 5<br />
7 Rising damp 5<br />
8 Floor (not involving moisture) 3<br />
9 Indoor air quality/ventilation 3<br />
10 Appearance/discoloration/surface defects 2<br />
11 Other 8<br />
Note: Adapted from Watt (1999).<br />
2.2.1.2 Faulty construction<br />
Faulty construction is one of the most common causes of early deterioration. Common construction<br />
faults include inadequate compaction <strong>and</strong> failure to position the reinforcement so that it has adequate<br />
concrete cover. Under almost any exposure conditions these faults will eventually reduce the service<br />
life of the structure as a result of reinforcement rusting after the concrete has become carbonated,<br />
(Seeley, 1987).<br />
Faulty construction accounts for many building failures <strong>and</strong> this can be linked to the above. If a new<br />
system has not been specified or used previously, then the builder will have no experience of this<br />
system <strong>and</strong> may build it incorrectly. Sometimes lack of suitably qualified supervision can lead to this<br />
problem, as can the lack of testing that is carried out during construction work, such as concrete tests.<br />
An example of using systems that have not been used before creating this problem is that of the use<br />
of precast concrete structural frames. During the 1950s, in order to increase the amount of housing the<br />
development of high-rise blocks of flats became endemic.<br />
2.2.1.3 Faulty maintenance<br />
Faulty maintenance accounts for a similar number of building failures, <strong>and</strong> this can be broken down<br />
into two parts: maintenance that has been carried out incorrectly, or more commonly where no<br />
maintenance has been carried out during the life of the building. A large section of this book is<br />
dedicated to building maintenance, <strong>and</strong> how it can lead to the improved performance of buildings over<br />
their lifespan. If the procedures specified in this book are adopted then this figure should be reduced.<br />
However, maintaining buildings costs money, <strong>and</strong> therefore although building maintenance can be<br />
planned <strong>and</strong> specified correctly, if the funding available is not adequate this will ultimately lead to<br />
building failure (Ahmad, 2006).<br />
2.2.1.4 Faulty materials<br />
Faulty materials account for fewer, but still substantial, amounts of building failures, <strong>and</strong> the reasons<br />
for this are to a certain extent the same as for faulty design. We cannot test all materials for 60 years<br />
before they are used for construction, <strong>and</strong> we cannot test all materials in conjunction with all of the<br />
materials that they may potentially come into contact with. However, as a general rule, materials that<br />
are manufactured in factories will be of better quality than materials manufactured on site (in situ).<br />
More prefabrication should reduce this problem, but it can be argued that prefabrication reduces<br />
design flair <strong>and</strong> flexibility (Ahmad, 2006).<br />
2.2.1.5 Faulty use<br />
Faulty use accounts for some building failures, <strong>and</strong> this generally occurs where the building is not<br />
being used for the purpose for which it was designed. For example, occupiers may wish to create<br />
more space <strong>and</strong> therefore knock down walls without the advice of the designer, which can have major<br />
implications <strong>and</strong> possibly cause a collapse (Ahmad, 2006).
3. METHODOLOGY<br />
89<br />
International <strong>Building</strong> & <strong>Infrastructure</strong> Technology Conference<br />
7-8 June 2011, Vistana Hotel, Penang, Malaysia<br />
To achieve the objectives of this research, the following steps were carried out:<br />
a. A literature search was made on the factors that affect maintenance.<br />
b. Site visit, interviews <strong>and</strong> discussions with owners, designers <strong>and</strong> contractors. They helped to get<br />
the data <strong>and</strong> to know the design <strong>and</strong> construction factors that affect maintenance.<br />
c. From the preliminary interviews <strong>and</strong> the literature review, a questionnaire was formulated.<br />
d. A pilot study was performed before distribute the final questionnaire draft to the respondents. This<br />
pilot study was served to:<br />
i. Test the adequacy of the questions <strong>and</strong> review the adequacy of provided space for each<br />
question.<br />
ii. Estimate the time needed to fill out the questionnaire.<br />
iii. Review the more possible answers <strong>and</strong> increase the lists of choices.<br />
e. Then questionnaire was distributed by post, h<strong>and</strong> or email to the concerned respondents<br />
(evaluators).<br />
f. The questionnaire was collected but the uncompleted questionnaire will exclude.<br />
g. Examining the questionnaire collected from evaluators <strong>and</strong> obtaining the weighted overall factors<br />
affecting building maintenance. The flow chart shows the methodology for the research.<br />
The investigation for this study will be undertaken in two phases. The first phase will involved a<br />
literature search on the identification of some of the relative certain faults <strong>and</strong> defects, <strong>and</strong> by<br />
implication, impact preservation of buildings’ structural <strong>and</strong> fabrics integrity in design stage that affects<br />
maintenance. The second phase will involved gathering data through site visits, interviews <strong>and</strong><br />
discussions with owners, architectural/engineering firms (A/Es) <strong>and</strong> contractors.<br />
3.1 Research population / sample<br />
In this study, a questionnaire will be distributed to owners of the building, A/Es <strong>and</strong> contractors to<br />
facilitate input in a more st<strong>and</strong>ardized manner <strong>and</strong> will be design later.<br />
3.2 Proposed data collection method<br />
The interviews will be conducted with the questionnaire form highly supported by visual photographs<br />
<strong>and</strong> illustrations. Site survey will be conducted after each interview for further detailed investigations.<br />
The questionnaire will be divided into three main sections under the categories of certain faults <strong>and</strong><br />
defects, <strong>and</strong> by implication, impact preservation of buildings’ structural <strong>and</strong> fabrics integrity. In the all<br />
sections of the questionnaires, the respondents will be asked to select the relevant answer from the<br />
choices provided. Figure 2 show the methodology flow chart.
First Phase: Literature search on<br />
the identification that affect<br />
i t<br />
Second Phase: Site Visit, interview<br />
, discussion <strong>and</strong> Questionnaire<br />
Identified Objective <strong>and</strong> Scope of<br />
Study.<br />
Literature Review<br />
Methodology<br />
Collect the Data<br />
Analysis the Data<br />
Result<br />
Discussion <strong>and</strong> Conclusion<br />
Figure 2. Methodology Flow Chart<br />
90<br />
International <strong>Building</strong> & <strong>Infrastructure</strong> Technology Conference<br />
7-8 June 2011, Vistana Hotel, Penang, Malaysia<br />
Identify the Problem Statement<br />
3.3 Data analysis<br />
The collected data will be analyzed quantitatively using the severity index. The aim of formula is to<br />
determine the ranking of parameters or factors given for each answer of the questions. For every<br />
question there are five parameters that should be used by the respondents as an option to answer the<br />
questionnaire. The five options given are extremely affect, strongly affect, moderately affect, slightly<br />
affect <strong>and</strong> does not affect responses.<br />
The severity index is computed by the following equation (Al-Hazmi, 1987):<br />
4<br />
I = [ ∑ (ai * Xi) / 3] x 100%<br />
i =1<br />
(1)<br />
Where:<br />
I = Severity index<br />
ai = Constant, expressing the weight given to ήh response, i = 1,2,3,4<br />
Xi = Frequency of the ήh response given as a percentage of<br />
the total responses for each defect<br />
i = Response category index where i=1,2,3,4<br />
The severity indexes for all design defects <strong>and</strong> the groups of defects were calculated using the above<br />
formula (1). These indexes were ranked for owners, contractors <strong>and</strong> A/Es.
91<br />
International <strong>Building</strong> & <strong>Infrastructure</strong> Technology Conference<br />
7-8 June 2011, Vistana Hotel, Penang, Malaysia<br />
4. EXPECTED OUTCOMES<br />
It is expected that the result will show an importance of selection <strong>and</strong> design features of buildings with<br />
their operation, <strong>and</strong> maintainability. A suggestion of guideline model will be developed <strong>and</strong> used by<br />
conservation contractors related to structural <strong>and</strong> fabrics integrity in order to maintain <strong>and</strong> sustain<br />
while restoration costs are saved.<br />
5. CONCLUSIONS<br />
For the conclusion, the objective of this study can be achieved if all questionnaire are done<br />
accordingly to its proper procedures <strong>and</strong> hopefully at the end of this study few designs will be<br />
indentified <strong>and</strong> a feed back to upstream creation stages of the building, in order to achieve<br />
downstream less defective buildings <strong>and</strong> better preservation through their life-cycle.<br />
ACKNOWLEDGMENT<br />
The authors would like to thank to Mr Dr Zainal Abidin Bin Akasah as supervisor <strong>and</strong> the UTHM for<br />
supporting this study.<br />
REFERENCES<br />
Ahmad Ramly, Afaq Hyder Chohan & Nor Haniza Ishak. (2007). Implications of design deficiency on<br />
building maintenance at post- occupational stage.<br />
Ahmad Ramly, Nur Azfahani Ahmad <strong>and</strong> Nur Haniza Ishak, (2006). The effects of<br />
design on the maintenance of public housing buildings in Malaysia , part one.<br />
Al-Hazmi, M., (1987). Causes of delay in large building construction projects. MSc thesis, King Fahd<br />
University of Petroleum <strong>and</strong> Minerals, Dhahran, Saudi Arabia<br />
Alner, G.R. & Fellows, R.F., (1990). Maintenance of local authority school building in UK: a case study.<br />
Proceedings of the International<br />
Arditi, D. & Nawakorawit, M., (1999). Designing <strong>Building</strong>s for Maintenance : Designers’ Perspective.<br />
Journal of Architectural Engineering, US<br />
Assaf, S., Al-Hammad, A.M & Al-Shihah, M., (1996). Effects of Faulty Design<br />
Bickerdike Allen & Partners(1971), O’Brien T. <strong>Building</strong> failures. <strong>Building</strong>; 221:107–8.<br />
Boyle, G. (2003), Design Project Management, Ashgate, Burlington, NC<br />
<strong>Building</strong> Research Establishment (BRE) (1988). Common defects in low-rise traditional housing.<br />
Garston: Digest 268, BRE.<br />
Campbell P., (2001). Learning from construction failures. UK: Whittles Publishing. Construction on<br />
<strong>Building</strong> Maintenance. Journal of Performance of Constructed Facilities. 23(3), pp. 175-181.<br />
Gibson, E.J., (1979). Developments in <strong>Building</strong> Maintenance-1. Applied Science Publishers, London<br />
Holtham D., (2001). Risk management from the lawyer’s point of view. In: Campbell P, editor. Learning<br />
from construction failures, UK: Whittles Publishing, pp. 102–19.<br />
Kelly, A. <strong>and</strong> Harris, M.J. (1978), Management of Industrial Maintenance, Butterworth’s, London.<br />
Lateef, O.A. Khamidi, M.F. & Idrus, A., (2010). <strong>Building</strong> maintenance management in a Malaysian<br />
university campuses: a case study. Australasian Journal of Construction Economics <strong>and</strong> <strong>Building</strong>, 10<br />
(1/2), pp. 76 89.<br />
Lee, H.H.Y. & Scott, D., (2009). Overview of maintenance strategy, acceptable maintenance st<strong>and</strong>ard<br />
<strong>and</strong> resources from a building maintenance operation perspective. Journal of <strong>Building</strong> Appraisal, Vol. 4<br />
No. 4, pp. 269-78. <strong>Building</strong> maintenance practice 305.<br />
Lee, M., (1987). <strong>Building</strong> Maintenance Management, 3 rd ed., Collins, London
92<br />
International <strong>Building</strong> & <strong>Infrastructure</strong> Technology Conference<br />
7-8 June 2011, Vistana Hotel, Penang, Malaysia<br />
Low, S.P. & Chong, W.K., (2004). Construction quality evaluation <strong>and</strong> design parameters for<br />
preventing latent defects in buildings. Proc., Joint Int. Sympo. of CIB Working Commissions,<br />
Singapore, 554-566.<br />
Melchers, R.E,. (1982). Human error in structural design tasks. ASCE Journal of Structural Engineers<br />
1989;115(7).<br />
Porteous WA. (1982). <strong>Building</strong> failures. The Chartered Builder, Australian Institute of <strong>Building</strong><br />
1982;35:53–6.<br />
Porteous, W.A., (1992). Identification, evaluation <strong>and</strong> classification of building failures. Ph.D. thesis,<br />
Victoria University of Wellington, New Zeal<strong>and</strong>, 1992.<br />
Porteous, W.A., (1985). Perceived characteristics of building failure ± a survey of the recent literature.<br />
Architectural Science Review, Vol. 28, June.<br />
Ramly, A., (2006). Prinsip dan praktis pengurusan penyelenggaraan bangunan. Pustaka Ilmi, Batu<br />
Cave.<br />
Ransom, W.H., (1981). <strong>Building</strong> Failures Diagnosis And Avoidance. E & F. N. Spon-2nd Edition.<br />
Reason J., (1990). Human error. UK Cambridge University Press<br />
Rozita Aris., (2006). Maintenance factors in building design. University Technology Malaysia.<br />
Seeley, I.H., (2000). <strong>Building</strong> Maintenance, 2nd ed., Macmillan Education, London.<br />
Trotman, P. (1994). An examination of the BRE Advisory Service database compiled from property<br />
inspections. Paper presented at the Dealing with Defects in <strong>Building</strong>s Symposium, CIB/ICITE-<br />
CNR/DISET, 27–30 September, Varenna, Italy.<br />
Watt, D.S., (1999). <strong>Building</strong> pathology: principles & practice. Blackwell Science, UK
T122<br />
93<br />
International <strong>Building</strong> & <strong>Infrastructure</strong> Technology Conference<br />
7-8 June 2011, Vistana Hotel, Penang, Malaysia<br />
PROBLEMS OF CONSTRUCTION QUALITY IN SARAWAK, MALAYSIA<br />
Ibrahim, S. H.¹, Baharun, A.² <strong>and</strong> Ayagi, K. M.³<br />
1, 2,3 Universiti Malaysia Sarawak, Sarawak, Malaysia<br />
3 kabiruayagi@yahoo.com<br />
ABSTRACT: Housing is a major concern for all people in every corner of the world as the wellbeing of<br />
a country is reflected in its people enjoying a certain st<strong>and</strong>ard of living. Residential <strong>and</strong> neighbourhood<br />
satisfaction is an important indicator of housing quality <strong>and</strong> condition, which effects individuals’ quality<br />
of life. The housing industry in Malaysia is regarded as one of the major industries contributing to the<br />
economic <strong>and</strong> social development of the country. The industry regulated by several set of rules <strong>and</strong><br />
the imposition of regulations, guidelines <strong>and</strong> st<strong>and</strong>ards to ensure that all categories of houses will be<br />
constructed according to the acceptable st<strong>and</strong>ard. Despite the existence of these regulatory<br />
measures, yet, there are many problems faced by house-buyers in Sarawak with regards to less<br />
quality construction of houses. There is a st<strong>and</strong>ard form of sale <strong>and</strong> purchase agreement (SPA)<br />
stipulated under the Housing Development (Control <strong>and</strong> Licensing) Regulations 1989 (HD Regulation<br />
1989) but as far as the problem of sub-st<strong>and</strong>ard construction of houses is concerned, Sarawak housebuyers<br />
are not well protected. In general, there is no benchmark in Sarawak to measure the st<strong>and</strong>ard<br />
of quality of houses constructed by developers. The aims of this paper is to look into some recent<br />
amendments to the legal provisions (<strong>and</strong> its loopholes) concerning the statutory duties imposed on the<br />
three most important institutions related to building of quality houses, namely: the local authorities, the<br />
Ministry of Housing <strong>and</strong> Local Government (MHLG) <strong>and</strong> the Construction Industry Development Board<br />
(CIDB).<br />
Keywords: House-buyers, local authority, developer, house <strong>and</strong> construction.<br />
1. INTRODUCTION<br />
Malaysia is known as a country having a very wide set of rules <strong>and</strong> procedures relating to housing<br />
development. In spite of this legal environment <strong>and</strong> controls, the housing industry is facing with<br />
consumers or purchasers dem<strong>and</strong> for quality housing from their developers. In this paper the meaning<br />
of ‘quality housing’ is referred to as housing that free from defects i.e. house with good quality of<br />
workmanship <strong>and</strong> materials. Literally the term ‘defective’ may not accurately be used in the context of<br />
a building, but it is common in the construction industry that the term ‘defective’ be used<br />
interchangeably with the term ‘less quality’.<br />
Housing property <strong>and</strong> its outlook:<br />
Housing property in Malaysia hopefully would continue to register growth especially fuelled by the<br />
growing popularity of the low mortgage rate, the continuing of the government’s Malaysia my second<br />
home program in promoting home ownership by the foreigners <strong>and</strong> the government’s success in<br />
managing the performance of the overall economy have contributed to the industry’s encouraging<br />
performance so far. These factors have contributed to propel the property purchase activity, resulting<br />
in good performance of new sales in choice locations. Moreover, Malaysia high saving rate coupled<br />
with young demographic profile, declining average household size <strong>and</strong> urban migration would provide<br />
a consistent <strong>and</strong> sustainable stream of house buyers.<br />
Most of the housing developers were generally still positive of the industry’s performance in the year<br />
2006 although concern over escalating of oil prices, the performance of the stock market <strong>and</strong> potential<br />
interest rate hikes are viewed with some degree of apprehension. They also agreed that the present<br />
situation was a buyers’ market where supply exceeds dem<strong>and</strong> which resulted to ab<strong>and</strong>oned houses<br />
<strong>and</strong> buyers had the luxury choice <strong>and</strong> time to decide on a property they intend to purchase.
94<br />
International <strong>Building</strong> & <strong>Infrastructure</strong> Technology Conference<br />
7-8 June 2011, Vistana Hotel, Penang, Malaysia<br />
With competition building up, industry players are now more proactive <strong>and</strong> resort to more coordinated<br />
planning, including research <strong>and</strong> feasibility studies, before embarking on any new projects, follow by<br />
adopting means of attracting buyers to promote sales.<br />
Population <strong>and</strong> dem<strong>and</strong> of Housing:<br />
The population in Sarawak has increased tremendously every year due to the facts that people use to<br />
migrate to the area as it provides a lot of job opportunities. Table 1 showed the population of Sarawak<br />
for the year 1980- 2000 according to the department of statistics Malaysia.<br />
Table Density of population<br />
Table 1. Population of Sarawak for the year 1980-2000<br />
State<br />
Size of population<br />
1980 1991 2000<br />
Sarawak 1,235,553 1,642,771 2,009,893<br />
The Capital city <strong>and</strong> its surrounding areas registered the highest growth of population with Kuching<br />
having an average annual growth rate of 3.24% from 1991-2000 (494,109 people in 2000) as against<br />
3.11% from 1980-1991.<br />
The 2000 census showed that the second most populace administrative district 10years ago was Miri<br />
(221,055) followed by Sibu (210,118) <strong>and</strong> Bintulu (139,012).<br />
Kuching had 369,065 people in 1991 as per the census taken that year while the census taken in 1980<br />
showed its population then at 262,085.<br />
The 2000 census revealed that out of the 2million people in Sarawak, 52% are living in the rural areas.<br />
Out of the 29 administrative districts in Sarawak, only four have more people living in urban areas –<br />
Kuching (85.5%), Sibu (79.7%), Bintulu (74.6%) <strong>and</strong> Miri (76.5%).<br />
Based on the growth rate 3.24% per annum, the dem<strong>and</strong> for houses would quite substantial. Rapid<br />
urbanization <strong>and</strong> the country’s demographic profile with its sizeable population of young people offer<br />
tremendous opportunities for developers of medium priced houses. 60% of the Malaysian population is<br />
below 30 years old. In addition 17% of this category are potential first time house buying c<strong>and</strong>idates.<br />
Also reported in the Kajian Rancangan Struktur Negari Selangor (2002), during the year 1995-1999,<br />
average monthly income in Malaysia was RM2, 020 in 1995 <strong>and</strong> had increased to RM2, 472 in 1999<br />
with the average growth rate of 5.2% per annum.<br />
Sarawak basic economic indicators:<br />
� Sarawak population - 2.4 million (2007e)*<br />
� Number of household – 480,000<br />
� Urbanization – 2007- approx. 50% (1970 – 20%)<br />
� New housing requirement – 15,000 units per year **<br />
� Sarawak GDP Growth rate – 9.3% (2007a) (5.0% in 2008e) (4.0% in 2009f)<br />
� Construction contribution to state GDP Growth – 3% (2008)*<br />
� Percentage of employment in construction – 88% (114,000) of the total 1.3 million work force<br />
(2007)*<br />
Note: * means State planning unit. ** Estimated by C.H. Williams Talhar Wong &Yeo<br />
(a) Actual (e) estimated (f) forecasted (Keli, B. A.,2008).<br />
Statistic of houses built in Sarawak (2006 – 2008):<br />
� Total number of houses built in Sarawak 2006 – 2008 are 13,056 units<br />
� Average number of houses per year is 4,352units
95<br />
International <strong>Building</strong> & <strong>Infrastructure</strong> Technology Conference<br />
7-8 June 2011, Vistana Hotel, Penang, Malaysia<br />
� Kuching has the highest number of houses built at 6,862 units, while Samarahan second<br />
highest at 2,071 units <strong>and</strong> Miri the third highest at 1,894 units followed by Sibu at 1,607 units.<br />
Sriaman has the least number of houses built at 56 units.<br />
� Double <strong>and</strong> single storey terrace houses are the most built: 7,142 units or 54.7%.<br />
� Double storey detached are the least built: 19units or 0.15%<br />
� Apartment <strong>and</strong> condominium: at 881 units or 6.8%.<br />
� Low cost houses: 871 units or 6.7%.<br />
� Low cost plus houses: 912 units or 7%.<br />
� Double storey semi – detached: 1386 units or 10.6%<br />
� Single storey semi – detached: 450 units or 3.44%.<br />
Figure 1. Statistic of Houses Sales in Sarawak<br />
2. THE PROBLEMS OF UNQUALITATIVE CONSTRUCTION OF HOUSES IN SARAWAK<br />
There are three categories of developers involved in housing development in Malaysia: Private<br />
developers, statutory bodies <strong>and</strong> co-operative societies. All these developers are governed by the<br />
housing development (Control <strong>and</strong> Licensing) Act 1966 (HDA) when they undertake housing<br />
development involving the construction of more than four units of housing accommodation. In Malaysia<br />
the practice is ‘sell then build’ i.e. houses are offered for sale prior to its construction or completion or<br />
even prior to the cleaning of l<strong>and</strong>. The payment of the purchase price of houses is made progressively<br />
according to the stages of completion of construction as regulated by the housing development<br />
(Control <strong>and</strong> Licensing) Regulation 1989 (HD Regulation 1989). The system does not allow housebuyers<br />
to view the houses they purchase while having to accept the delivery of houses irrespective of<br />
their quality. Despite the common practice of ‘sell then build’, the Malaysian government is actually<br />
encouraging developers who are willing to implement the ‘build then sell’ in their housing development.<br />
Consequently effective from 1 st December 2007 the HD Regulation 1989 has been amended in which<br />
the new Schedules of I <strong>and</strong> J have been inserted in order to accommodate such practice. However it<br />
is still debatable whether the practice of ‘build then sell’ will solve the problem of quality building. The<br />
only clear advantage as regard to quality of building is that to give opportunities to interested<br />
purchaser to view the house <strong>and</strong> detect any defects which are visible at the time of viewing the house.<br />
Thus how about the latest defects?<br />
The right purchaser for quality houses in terms of good workmanship <strong>and</strong> quality materials is derived<br />
from the st<strong>and</strong>ard Sale <strong>and</strong> Purchase Agreement (SPA) (Schedule G <strong>and</strong> H of the HD Regulation
96<br />
International <strong>Building</strong> & <strong>Infrastructure</strong> Technology Conference<br />
7-8 June 2011, Vistana Hotel, Penang, Malaysia<br />
1989). Clause 14 uses the phrase ‘the building shall be constructed in a good <strong>and</strong> workmanlike<br />
manner’. This clause requires a developer to construct houses in good <strong>and</strong> workmanlike manner<br />
where the workmanship <strong>and</strong> materials used must conform to description. In other words there are two<br />
express terms in this clause; materials <strong>and</strong> workmanship must conform to description; <strong>and</strong><br />
construction must be done in a good <strong>and</strong> workmanlike manner. Base on this clause any purchaser<br />
having a problem of sub-st<strong>and</strong>ard construction of house may claim remedies against the respective<br />
developers.<br />
Generally, there are two kinds of remedies; first the remedies under the law of contract <strong>and</strong> second,<br />
the statutory remedies available during the statutory warranty period. The statutory remedies are<br />
derived from the st<strong>and</strong>ard SPA under the HD Regulation, 1989. Under the recent amendment of the<br />
HD Regulations (which came into force on the 1 st December 2007), the defect liability period is valid<br />
for twenty four months from the date of h<strong>and</strong>ing over vacant possession of the completed unit. Since<br />
the defect liability period is quite long, this may give quite comfortable protection to purchasers.<br />
However there would be a problem of latent defect which may occur only after some time <strong>and</strong> may not<br />
show any sign during this liability period. Hence the effected purchaser still will have to take the hassle<br />
of remedying the defect at their own expenses.<br />
2.1 Typical complains from the buyers<br />
The star (2001) had reported that most common complaints received from the buyers are: late delivery<br />
of the houses; houses delivered without certificate of fitness for occupying; poor workmanship;<br />
misleading advertisement <strong>and</strong> houses h<strong>and</strong> over without water or electricity power supply. The<br />
complaint would surely affect the reputation of the developer <strong>and</strong> its property sales. Therefore it is<br />
another important aspect requires attention by the developer. Less or no complaint from the customers<br />
reflects good quality of houses have been delivered to the buyer. This would have direct or indirect<br />
effect in boosting the future launch or sales of properties by developers.<br />
2.2 Late delivery of houses<br />
This is where the houses are not being able to deliver to the purchasers within the timeframe<br />
stipulated in the Sales <strong>and</strong> Purchase Agreement. In accordance to the clause as stated in the Sales<br />
<strong>and</strong> Purchase Agreement, the purchases are entitle to claim for late delivery of the houses at the rate<br />
of 10% per annum or the purchased price from the developer. But very often, most of the purchasers<br />
are not able to recover the full sum or in some cases, not only at all as the developer claimed that they<br />
are in financial difficulty. Hence, even when the purchasers take legal action against the developer <strong>and</strong><br />
has a favourable judgement, they may still facing difficulty to realize their full amount of claim as the<br />
developer has no money. Sometime the purchasers are faced with more legal problems <strong>and</strong> cost<br />
incurred during the legal process. However, with the underst<strong>and</strong>ing of the government, the Ministry of<br />
Housing has set up Tribunal in 2002.<br />
2.3 Poor quality of the Houses been delivered<br />
There are many complaints from the house buyers that their houses delivered are of poor quality or<br />
with a lot of defects. Some of the more common defects have been highlighted such as roof leaking,<br />
wall crack; bathroom leak <strong>and</strong> the material used are of the poor quality type. Even though there is a<br />
clause in the Sales <strong>and</strong> Purchase Agreement spelt out that the developer would have to rectify the<br />
defects at his own cost <strong>and</strong> expense, but again, most of the developers would delay it <strong>and</strong> only rectify<br />
the defect at a very late stage or after received many complaints. Worse still, when the defect rectified<br />
has reoccurred at the same place. Other problems are such as about the recovery of costs from the<br />
developer if the buyers themselves rectify the defects or the defect showing up after the expiry of the<br />
defect liability period.<br />
Fighting the case in court would definitely involve a very long drawn legal battle which is also financial<br />
taxing. However, for those cases that pass all the conditions set by the Ministry of Housing, the buyer<br />
could bring the cases to the Tribunal set by the ministry for assisting the claim against the developer.<br />
The only set back was that most of the buyers are not very familiar or aware of the term <strong>and</strong> conditions<br />
of the claim or worst still the available of the assistance.
97<br />
International <strong>Building</strong> & <strong>Infrastructure</strong> Technology Conference<br />
7-8 June 2011, Vistana Hotel, Penang, Malaysia<br />
2.4 Houses been delivered without certificate of fitness for occupation<br />
This is where architect or engineers work h<strong>and</strong> in glove with the developer in issuing the certificate of<br />
completion even before the actual completion of the houses. The developer has the intention to h<strong>and</strong><br />
over vacant possession of the houses to the purchasers without applying for certificate of fitness for<br />
occupying. More often than not, this goes unnoticed because most of the financial institutions only<br />
depend on the architect’s certificate when releasing money from the purchaser’s loan. In this case, the<br />
purchasers would surely suffer, sometimes to the extent of the purchaser been summoned by the<br />
financial institutions because they are not able to service their loan regularly due to other<br />
commitments.<br />
2.5 Houses been delivered without Water <strong>and</strong> Electricity Supply<br />
The houses have been constructed <strong>and</strong> h<strong>and</strong> over to the buyers but without the water or electricity<br />
supply been connected. No doubt, the responsibility of the developer end with the term that all internal<br />
works has been constructed <strong>and</strong> ready for the external supply’s connection, it could still be the<br />
developer’s fault due to developer failed to contribute the amount of money required by the authority<br />
concerned.<br />
2.6 Misleading Advertisement<br />
This is where the developer has mislead the customers by not providing the same quality or<br />
specifications as promised or advertised in the brochure, newspaper or actual specifications, design or<br />
building material used were differed from the show unit.<br />
How to solve the problems of sub-st<strong>and</strong>ard construction in Sarawak:<br />
There are three (3) main authorities in Malaysia having power to control building quality i.e. Local<br />
authority, the Ministry of House <strong>and</strong> Local government (MHLG) <strong>and</strong> the Construction Industry<br />
Development Board Malaysia (CIDB).<br />
3. LOCAL AUTHORITY<br />
3.1 Approval of building plan:<br />
The approval of building plan is vested with the local authority where the local authority shall ensure<br />
that the applicant-developer has complied with all necessary rules <strong>and</strong> regulations, in particular the<br />
UBBL.<br />
If the housing development involves construction of low-cost units, the local authority will have to<br />
check if the building plans submitted for approval are in compliance with the CIS 1 or CIS 2. It is within<br />
the power of the local authority to ascertain that the building plan submitted by a qualified person. Bylaw<br />
5 of the UBBL provides that the responsibility to supervise the construction works until its<br />
completion lies on the qualified person who has submitted <strong>and</strong> certified the plans <strong>and</strong> specifications for<br />
building approval, <strong>and</strong> issued the certificate of completion <strong>and</strong> compliance (CCC). Generally<br />
Malaysian context, the qualified person would be an architect. Thus in cases of defective houses, a<br />
local authority has power to act against an architect.<br />
3.2 Issuance of certificate of completion <strong>and</strong> certification:<br />
A new method of processing the issuance of Certificate of Fitness (CF) has been introduced <strong>and</strong> now<br />
it is known as the CCC. Prior to the amendment of several statutes governing the housing industry the<br />
process of issuance the CF was under the jurisdiction <strong>and</strong> duty of the respective local authority. Under<br />
the CCC, the certificate of fitness is issued by any architect or building draughtsman or engineer upon<br />
completion of the construction of a house according to its plan <strong>and</strong> specifications as approved by the<br />
local authority. Under the CCC, the responsibility of the local authority is transferred to the<br />
professionals. The main issue here would be on the extent of independency of the professional<br />
involved. This CCC seems to be a move towards self-certification, which may remedy the problem of<br />
delay in issuance of the CF, but it may not be an answer to the problem of defective houses (Azlinor<br />
Sufian, 2001).
3.3 Supervision or inspection of construction work:<br />
98<br />
International <strong>Building</strong> & <strong>Infrastructure</strong> Technology Conference<br />
7-8 June 2011, Vistana Hotel, Penang, Malaysia<br />
The SDBA <strong>and</strong> UBBL do not impose any specific duty on the local authority to inspect the construction<br />
work done by a contractor. As mentioned earlier this duty rest solely on the shoulder of a qualified<br />
person who submitted the plan. The local authority will only conduct an inspection if there is a report<br />
on failure of building (section 70B, SDBA). A failure of building refers to defective building which may<br />
affect health <strong>and</strong> safety of the occupants, such as failure of the structure. Therefore mere defect such<br />
as sub-st<strong>and</strong>ard quality of paint or uneven flooring may not fall within the meaning of building failure.<br />
4. MINISTRY OF HOUSING AND LOCAL GOVERNMENT:<br />
4.1 Licensing of developers:<br />
Housing development in Malaysia falls within the purview of the MHLG. No housing development may<br />
be under taking without licensing granted by the MHLG. The main law governing housing development<br />
in Peninsular Malaysia is the HDA. In Sarawak the applicable law is the Housing developers (Control<br />
<strong>and</strong> Licensing) Ordinance 1993 (No. 5) <strong>and</strong> in Sabah, the Housing Developers (Control <strong>and</strong> Licensing)<br />
Ordinance 1978 (No. 24).<br />
Under the HDA no housing development may be carried on, undertaking or caused to be undertaking<br />
except by a housing developer in possession of a license issued under the Act (section 5(1). It is an<br />
offence to carry on a business of housing development without a license, as decided in the case of<br />
Kheng Soon Finance Bhd. V MK Retnam Holding Sdn. Bhd. & Anor. [1989] 1 MLJ 457; ‘............to<br />
carry on a business of housing development without license is a serious offence........’ The controller of<br />
housing has a power to revoke or suspend the license if he is satisfied that the license housing<br />
developer is carrying on his business in a manner detrimental to the interest of the purchasers or to<br />
any member of the public, or has insufficient assets to cover his liabilities, or is contravening any of the<br />
provision of the HDA or has ceased to carry on housing development in West Malaysia. Generally<br />
through the licensing system, the MHLG can control the activities of the developers.<br />
The imposition of HDA on the license developers will enable the authority to utilize its provisions to<br />
promote serious commitment from the licensed housing developers to delivered quality houses to their<br />
purchasers, particularly through the enforcement of section 6A, 6B, 7A <strong>and</strong> 11 of the HDA. Section 6A<br />
of the HDA may be used by the MHLG to make developers comply with the obligations imposed on<br />
them through the st<strong>and</strong>ard sale <strong>and</strong> purchase agreement. Section 6A stated that the controller has the<br />
power, subject to any direction of the Ministry, to keep the deposit made under paragraph 6(1) (a) <strong>and</strong><br />
(b) until the expiry of the defect liability period of the housing development. If the MHLG finds that a<br />
particular developer has not taken proper action in relation to complains of purchasers on defects of<br />
workmanship or materials, the MHLG may use the power under this section to withhold the return of<br />
deposit until the rectification is completed.<br />
Similarly section 6B (a) of the HDA may be invoked by the authority in which the section empowers the<br />
controller to forfeit the whole or part of the deposit if any licensed housing developer is carrying on his<br />
business, in the opinion of the controller, in a manner detrimental to the interest of purchasers<br />
[emphasis added] or to any member of the public. This section may be considered as one of the<br />
methods to make developers comply with the terms <strong>and</strong> conditions of the sale <strong>and</strong> purchase<br />
agreement. Nevertheless under this section, the controller must be satisfied that non-compliance on<br />
the part of the developer with the terms of sale <strong>and</strong> purchase agreement has really been detrimental to<br />
the interest of purchasers. This may be possible in cases of serious defects such as defect of<br />
workmanship for substructure works or in cases where the whole units of houses in the project are<br />
suffering from poor quality of workmanship <strong>and</strong> /or materials.<br />
The concept of withholding <strong>and</strong> forfeiting the deposit above may be applied also towards the monies in<br />
the Housing Development Account. Section 7A of the HDA requires a developer to open <strong>and</strong> maintain<br />
Housing Development Account for his housing project. The management of the Housing Development<br />
Account is specifically laid down in the Housing Development (Account) Regulation, 1991. It is<br />
provided in the regulations that all monies in the Housing Development Account may be withdrawn<br />
when the housing development has been completed; <strong>and</strong> the solicitor for the developer has satisfied<br />
that the obligations of the developer in respect of transfer of all titles under the sale <strong>and</strong> purchase<br />
agreement in that housing development have been fulfilled (Regulation 11). This regulation is to be
99<br />
International <strong>Building</strong> & <strong>Infrastructure</strong> Technology Conference<br />
7-8 June 2011, Vistana Hotel, Penang, Malaysia<br />
read together with section 7A of the parent Act where all monies receive by the developer from the<br />
sale of the housing accommodation in the housing development shall be paid into the Housing<br />
Development Account (Regulation 7A(3)). Money in the account therefore includes the purchasers’<br />
monies (Regulation 4). Rectification of defects of houses is part of the developer’s obligation towards<br />
purchasers in carrying out his duties as a licensed housing developer. Thus, if a developer does not<br />
discharge this obligation, it is possible for the controller to withhold the release of all monies in the<br />
Housing Development Account. Apart from that, the existing section 11 of the HDA that vests powers<br />
in the Ministry to give directions for the purpose of safeguarding the interest of purchasers should<br />
properly be enforced. The power of the Minister under this section is very wide where if the controller<br />
is of the opinion that the licensed housing developer becomes unable to meet his obligation to his<br />
purchasers, the Minister may give direction under Section 12 for the purpose of safeguarding the<br />
interest of the purchasers. These powers of the Minister may include giving directions to the licensed<br />
housing developer in question to take such steps as he may consider necessary to rectify any matter<br />
or circumstance (section 11(1)(a)), direct that a person be appointed or himself appointed a person to<br />
advice the licensed housing developer in the conduct of his business (section 11(1)(b)) or to take such<br />
actions as the Minister may consider necessary in the circumstances of the case for carrying into<br />
effect the provisions of the HDA. It is highly desirable that the Minister shall use his power under this<br />
section if consumers are encountering critical problem of poor workmanship <strong>and</strong> materials.<br />
Nevertheless in order to utilize the benefit of this section the consumers must present cogent evidence<br />
that a particular problem is really detrimental to their interest as purchasers. Therefore a minor<br />
problem of quality of finishing of houses may not be a good enough reason for the use of this power by<br />
the Minister.<br />
4.2 Supervision of project<br />
Being a ministry having power to issue the license for housing development, it is the duty of the MHLG<br />
to ensure that purchasers would be delivered the houses as prescribed by the sale <strong>and</strong> purchase<br />
agreement as well as to settle complaints on matters concerning housing. Currently there are three<br />
mechanisms used to supervise progress of housing development. It consists of supervision through<br />
documents (files), visit program <strong>and</strong> investigation (based on complaints). These methods seemed to<br />
be sufficient to monitor the project undertaking by developer. However due to lack of manpower, the<br />
site inspection will be conducted only upon receiving specific complaint from the purchasers. This<br />
normally happens when purchasers noticed that claims for progressive payments are issued by<br />
developers do not correspond with the stages of completion of work.<br />
The new provision of the HDA on the power of supervision <strong>and</strong> enforcement are more concerned with<br />
offences committed under the HDA <strong>and</strong> the Regulations there under. As for the problems related to<br />
the rights <strong>and</strong> obligations derived under the sale <strong>and</strong> purchase agreement, the Ministry does not have<br />
direct power to take any action against the developer. Thus as far as the right for quality workmanship<br />
<strong>and</strong> materials of building are concerned, the MHLG does not have direct power to act except for giving<br />
advice to the developers.<br />
5. CONSTRUCTION INDUSTRY DEVELOPMENT BOARD<br />
5.1 Licensing of contractors<br />
The licensing of contractor is done under the Construction Industry Development Board Act 1993<br />
(CIDBA). The duties <strong>and</strong> function of the CIDB are stipulated in the CIDBA. Generally the Act provides<br />
for the licensing of contractors <strong>and</strong> accreditation <strong>and</strong> certification of building materials. Even though<br />
the CIDBA is not comprehensive enough to regulate the activities of contractors, the CIDBA has<br />
engage administrative mechanisms to promote the growth of the construction industry.<br />
5.2 Training of skilled workers<br />
The CIDB has no direct control over housing development in Malaysia as compared to the local<br />
authorities <strong>and</strong> the MHLG. Nevertheless as far as quality of building in the construction industry is<br />
concerned, the CIDB is the main authority which control activities of contractors. It was contended that<br />
reliance on the unskilled labour to do manual work is one of the causes for shoddy workmanship<br />
(Viswanathan Mukaya et.al 1995). In Malaysia the availability of skilled workers is very important to<br />
ensure the quality of building since Malaysia is still using the conventional building system labour-
100<br />
International <strong>Building</strong> & <strong>Infrastructure</strong> Technology Conference<br />
7-8 June 2011, Vistana Hotel, Penang, Malaysia<br />
intensive [8]. Under the CIDB skilled workers are described as concreter, bar-bender, carpenter,<br />
bricklayer, mason, plasterer, paver, tiller, painter, jointer, metal worker, drain layer, glazier, welder,<br />
construction plant operator, plumber, <strong>and</strong> electrician (Section 32(2). Being a paymaster to the<br />
contractors, a developer may indirectly be responsible to ensure that their contractors engage skilled<br />
workers since it would have significant impact on the quality of the workmanship of the houses<br />
constructed. If developer could not care less on the engagement of skilled workers by its contractors<br />
but look for tenders with the lowest quotation, all these would contribute to the poor commitment of<br />
contractors to the quality of work of his workers.<br />
6. CONCLUSIONS<br />
Since the problem of Sub-st<strong>and</strong>ard quality housing in Sarawak is so rampant, it is timely for the<br />
government to consider immediate steps to remedy the situation. It seems that the statutory provisions<br />
have conferred sufficient powers to the Ministry to monitor <strong>and</strong> supervise the performance of licensed<br />
housing developers. Nevertheless how far these powers are practically enforced by the MHLG still<br />
remains in doubt. The local authorities, the MHLG <strong>and</strong> the CIDB, these institutions should properly<br />
enforce the powers vested on them <strong>and</strong> take necessary steps to prevent non committed developers<br />
<strong>and</strong> contractors from entering into the business of housing development <strong>and</strong> construction industry.<br />
In order to achieve government aims in providing adequate <strong>and</strong> decent housing for all as stated in<br />
Ninth Malaysia Plan, something needs to be done especially at the implementation level. Special<br />
attention must be given to low cost housing since majority of this country population are in this<br />
category. The need for National Housing Policy then become more crucial since the government<br />
should provide clear direction for housing development in this country in order to achieve develop<br />
nation status by the year 2020.<br />
REFERENCES<br />
Azlinor Sufian (2001) Certificate of Completion <strong>and</strong> Compliance: Towards self certification in the<br />
Malaysian Housing Industry, the Law Review, 199-211<br />
Construction Industry Development Board (1998) Construction, Vol. 10 No. 6 (Nov-Dec), CIDB,<br />
Singapore, p8<br />
Construction Industry Development Board Malaysia (CIDB) (1998) St<strong>and</strong>ard for construction industry<br />
catalogue, CIDB, Kuala Lumpur.<br />
Jabatan Perancangan B<strong>and</strong>ur dan Desa Negari Selangor (2002). Laporan Permerikson Rancangan<br />
Struktur Negeri Selangor (2000-2020). Negeri Selangor: Jabantan Perancangan B<strong>and</strong>ar dan Desa.<br />
Keli, B. A. (2008) “Towards sustainable development for continued prosperity <strong>and</strong> stability” Sarawak<br />
Business Summit, Malaysia.<br />
Rozana, Ab. Rahman (2007) Contractor’s liability as occupier of promise to trespasser in safety at<br />
work cases, Master Builders Journal, 2 nd Quarter, pp 72-74.<br />
Viswanathan Mukaya & Shuici Matsumara (1995) ‘The need to Industrialised Malaysian’s Housing<br />
Industry <strong>and</strong> an insight in how to do it ‘proceeding of the congress on the World Housing Congress,<br />
Excellence in Housing: Prospect <strong>and</strong> challenges in pacific century, Suntec City, Singapore.<br />
Waleed A. Thanoon, Mohd. Peter Davis, Abdul Aziz Abdul Samad, Mohd Razali Ab. Kadir, Abang Ali<br />
(1997) Industrialised <strong>Building</strong> System, Seminar on Affordable Quality housing, Housing research<br />
centre, University Putra Malaysia Serdang Selangor.
T123<br />
101<br />
International <strong>Building</strong> & <strong>Infrastructure</strong> Technology Conference<br />
7-8 June 2011, Vistana Hotel, Penang, Malaysia<br />
AN INVESTIGATION INTO ABANDONED HOUSING PROJECTS IN SARAWAK,<br />
MALAYSIA<br />
Ibrahim, S. H.¹, Baharun, A.² <strong>and</strong> Ayagi, K. M.³<br />
1, 2, 3 Universiti Malaysia Sarawak, Sarawak, Malaysia<br />
3 kabiruayagi@yahoo.com<br />
ABSTRACT: Construction industry has always been one of the major contributors to the national<br />
growth, many companies jumped into the property b<strong>and</strong>wagon to build <strong>and</strong> build. This research work<br />
aims at investigating ab<strong>and</strong>oned developed housing in Sarawak Malaysia, with special reference to a<br />
number of areas Kuching, Kota Samarahan <strong>and</strong> Betong. The completed housing that has been<br />
ab<strong>and</strong>oned may be imposed by structural disintegration of the building over the years. Ab<strong>and</strong>oned<br />
housing also does indeed have a negative impact on the value of houses in close proximity.<br />
Ab<strong>and</strong>oned developed housing is also a threat to the environment because are ideal hide outs for<br />
criminals, drug addicts <strong>and</strong> vice activities. This research will identify the kind of problems faced with<br />
ab<strong>and</strong>oned developed housing <strong>and</strong> discusses the challenges facing case study areas in addressing<br />
the problem. The problems <strong>and</strong> information will be generated through questionnaire <strong>and</strong> personal<br />
interview with developers, an analysis of reports <strong>and</strong> plan prepared by public agencies <strong>and</strong> community<br />
development corporation involved in revitalization effort in case study areas.<br />
Key words: Ab<strong>and</strong>onment, housing, developers, effect <strong>and</strong> causes<br />
1. INTRODUCTION<br />
Housing development is one of the important agendas in Malaysia since independence. It has been<br />
placed in the list of the top Government’s priorities in the Malaysian Plan. After Independence, one of<br />
the most important objectives of the Government is to restructure the society <strong>and</strong> eradicate poverty ,<br />
through the means of the various Malaysian plans, the pre-emptive new Economic policy (NEP) <strong>and</strong><br />
the National Development policy (NDP) adopted by the Government. One of the approaches<br />
contained in these programmes <strong>and</strong> means, is to provide sufficient <strong>and</strong> suitable housing<br />
accommodation to its citizens Malaysian. However, due to the high dem<strong>and</strong> of housing, the<br />
government couldn’t afford to build totally on their own; therefore, private developers were jointed to<br />
construct housing accommodation, subject to the rules <strong>and</strong> regulations imposed by them. Although<br />
housing industry has served as the development, economic <strong>and</strong> social catalyst <strong>and</strong> has brought many<br />
benefits to the nation, yet, one of the spill-over problems which are carries is the problem of<br />
ab<strong>and</strong>oned developed housing.<br />
2. Housing system in Malaysia<br />
The Government of Malaysia recognizes housing as a basic human need <strong>and</strong> important component of<br />
the urban economy. This has led to the formulation of policies <strong>and</strong> programmed aimed at ensuring that<br />
all Malaysian have access to adequate shelter <strong>and</strong> related housing facilities. In Malaysia housing<br />
development programmed are carried out by the public <strong>and</strong> private sector. The public sector<br />
concentrate mainly on low cost housing programmed while the private sector (housing developers) a<br />
part from complying on the 30 percent low cost housing units, concentrate on medium <strong>and</strong> high cost<br />
housing programmed. The Malaysian Government has also formulated a housing policy which aims to<br />
strengthen the involvement of private sector in housing production <strong>and</strong> delivery especially in housing<br />
schemes development (Asiah Othman,1999).
2.1 Industrialized <strong>Building</strong> System (IBS)<br />
102<br />
International <strong>Building</strong> & <strong>Infrastructure</strong> Technology Conference<br />
7-8 June 2011, Vistana Hotel, Penang, Malaysia<br />
Industrialization in construction industry is part of a process in change <strong>and</strong> improvement management.<br />
The degree of industrialization <strong>and</strong> its characteristics carried out the different underst<strong>and</strong>ing in its<br />
terminology <strong>and</strong> definitions. Industrialized building system (IBS) can be defined as a construction<br />
system that is built using pre-fabricated components the manufacturing of the components are<br />
systematically done using machine, formworks <strong>and</strong> other form of mechanical equipment. The<br />
components are manufactured offsite <strong>and</strong> onsite completed will be delivered to construction site for<br />
assembling <strong>and</strong> erection (Abdullahi, M. R. et.al 2009). IBS is also defined as an integrated<br />
manufacturing <strong>and</strong> construction process with well planned organization for efficient management,<br />
preparation <strong>and</strong> control over resources used, activities <strong>and</strong> results supported by the used of highly<br />
developed components (Abdullahi, M. R. et.al 2009). Perhaps the most comprehensive definition of<br />
IBS was clarified by Junid, (1986), started that, an IBS in the construction industry includes the<br />
industrialized process by which components of a building are conceived, planned, fabricated,<br />
transported <strong>and</strong> erected on site. The system includes a balanced combination between the software<br />
<strong>and</strong> hardware components. The software components includes system design, which is a complex<br />
process of studying the requirement of the end user, market analysis, development of st<strong>and</strong>ardized<br />
components, establishment of manufacturing <strong>and</strong> assembly layout <strong>and</strong> prices, allocation of resources,<br />
materials <strong>and</strong> definition of building designer’s conceptual frame work. The software elements provide a<br />
pre-requisite to create conducive environment for industrialized to exp<strong>and</strong>.<br />
Meanwhile, the hardware elements are categorized into three major groups. This includes frame or<br />
post <strong>and</strong> beam system, panel system <strong>and</strong> box system. The frame structures are defined as those<br />
structures that carry the loads through their beams <strong>and</strong> girders to column <strong>and</strong> to the ground whilst in<br />
panel system load, three dimensional modules (or boxes) for fabrication or habitable units are capable<br />
of with st<strong>and</strong>ing load from various direction due to their internal stability.<br />
2.2 Modern <strong>Building</strong> in Sarawak:<br />
The modern building in Sarawak (low-income housing) has not followed the traditional designs, in an<br />
eagerness to appear ‘modern’ many designers in the low-income housing field have ab<strong>and</strong>oned the<br />
tradition “tested <strong>and</strong> proved” solution to the housing problems presented by the local climate <strong>and</strong> this<br />
has resulted in unacceptable discomfort problems (Ibrahim, S.H,2004). The government of Malaysia<br />
has been focused more on low medium cost housing during the seventh Malaysian plan with a total of<br />
350,000 units or 44% from the total 800,000 units planned (refer figure 1 & 2.). During the Seventh<br />
Malaysia plan the construction of medium <strong>and</strong> high cost housing by private sector has achieved 187%<br />
<strong>and</strong> 435% respectively of the targeted units. The situation created the over supply of housing stock for<br />
both categories during 1997- 2000. The Asian economic crisis worsened the properties scenario in<br />
Malaysia with many ab<strong>and</strong>oned developed housing including medium <strong>and</strong> high cost housing.<br />
In modern low-income housing design, ventilation is provided only through windows <strong>and</strong> doors <strong>and</strong> the<br />
glazed window areas allow heat to be transmitted in to the house. Most of the low-income houses are<br />
constructed using relatively heavyweight materials which absorb heat; the absorbed heat is lettered<br />
emitted into internal spaces of the houses making them more uncomfortable. The roof design of these<br />
types of houses are built with a short roof overhang which offers little solar shading or protection to the<br />
walls. These factors all contributed to an uncomfortable internal environment in the modern house but<br />
this can be remedies by air insulation mechanical cooling system such as air conditioners.<br />
Unfortunately these can not be afforded by low-income groups. The modern low-income houses also<br />
are built with a minimal area <strong>and</strong> the occupants are forced to adapt to the layout specifications, any<br />
extension or renovation must seek the approval from the authority before its build. This process is not<br />
only time consuming but incurs extra expenditure for the design process <strong>and</strong> approval which is not<br />
easily affordable by many low income families.
103<br />
International <strong>Building</strong> & <strong>Infrastructure</strong> Technology Conference<br />
7-8 June 2011, Vistana Hotel, Penang, Malaysia<br />
Figure 1. planned <strong>and</strong> completed housing units by private sector during sixth <strong>and</strong> seventh<br />
Malaysian plan<br />
Figure 2. planned <strong>and</strong> completed housing units by private sector during sixth <strong>and</strong> seventh<br />
Malaysian plan<br />
Source: Eighth Malaysia plan 2001<br />
2.3 Traditional <strong>Building</strong> in Sarawak<br />
Traditional Malay house is well ventilated by large doors <strong>and</strong> large body height windows which have<br />
perforated panel or louvers to remote air movement to reduce high temperatures. Also the house is<br />
built on stilts <strong>and</strong> has floor boards which are spaced with 5mm gaps to allow air to circulate from<br />
beneath to the building. Cool air from the ground passes through the floor gaps to replace the warmer<br />
air in the house. The traditional Malay house has a pitched roof with large overhangs. The over<br />
hanging roofing system plays beneficial role in preventing the rain water from entering the house <strong>and</strong> it<br />
also protect the walls from direct solar radiation. The roof is often built from Nypa or Palm leaves <strong>and</strong><br />
these materials are good thermal insulator so that little heat is radiated to the interior of the house.<br />
Most the houses start with a core house which basically consists of areas for sleeping, cooking <strong>and</strong><br />
dining. Malay people tend to live in extended families <strong>and</strong> as such, as the size of the family grows, the<br />
size of the house also has to be increased. Due to this reason, most of the traditional houses are<br />
easily extended. Distance between the houses are maintained so as to promote good ventilation <strong>and</strong><br />
since the houses are generally self built, the members of the family have sense of belonging towards<br />
their property.
104<br />
International <strong>Building</strong> & <strong>Infrastructure</strong> Technology Conference<br />
7-8 June 2011, Vistana Hotel, Penang, Malaysia<br />
The statistic of the Ministry of housing Sarawak 2006, 2007 <strong>and</strong> 2008, indicated the number of houses<br />
to be developed, houses sold <strong>and</strong> houses pending to be sold (refer figure 3.)<br />
Figure 3. statistic of houses sales in Sarawak<br />
Development of 8 units <strong>and</strong> below is not included.<br />
� Average numbers of units to be built by private developers are 6,065 compare to 15,000<br />
requirements per year.<br />
� Average no of units unsold – 36% per year (Nash, W.W. & M.L. Colens,1959).<br />
3. CONCEPT OF ABANDONED DEVELOPED HOUSING:<br />
Data for studies regarding ab<strong>and</strong>oned structures suffers from inconsistencies with the definition of<br />
“ab<strong>and</strong>oned” (Pagano, M.A. & Bowman, A.,2000). Survey designers must contend with the many<br />
different interpretation of “ab<strong>and</strong>oned” that each city uses in it own audits Cities criterion includes<br />
length of vacancy, structural condition <strong>and</strong> other subjective factors such as “eminent danger” to the<br />
community or threatens a city “health <strong>and</strong> safety” (Pagano, M.A. & Bowman, A.,2000), some cities use<br />
all the above in making determinations on structures.<br />
Ab<strong>and</strong>onment has often been conceived of as an “on-or-off’’ state, but it is actually a multidimensional<br />
process, with functional, physical <strong>and</strong> financial aspects. Sarawak or Malaysia in general has relatively<br />
few physically ab<strong>and</strong>oned (vacant) buildings. A large problem is functionally ab<strong>and</strong>onment, some of<br />
the low-cost, medium low-cost, medium cost, high medium cost, high cost etc have vacancy rates<br />
higher than 50 percent. Financial ab<strong>and</strong>onment is not a problem in Sarawak or Malaysia in general per<br />
se, but may be a useful area indicator of other ab<strong>and</strong>oned issues.<br />
Housing ab<strong>and</strong>onment is difficult to describe precisely as mentioned above, but there are nearly as<br />
many definitions of ab<strong>and</strong>onment as there are municipal governments tracking the issue <strong>and</strong> scholars<br />
writing about it. The broad contours of the phenomenon <strong>and</strong> its most extreme manifestation are<br />
uncontroversial, but obtaining a definition is important for academics <strong>and</strong> policy makers.<br />
According to Mallach, 2006, the definition of ab<strong>and</strong>oned housing in the state of New Jersey, that<br />
property be legally unoccupied for at least six months <strong>and</strong> fulfil one of the number of the criteria, such<br />
as being in need of rehabilitation, Sarawak or Malaysia in general likely has hundreds of ab<strong>and</strong>oned
105<br />
International <strong>Building</strong> & <strong>Infrastructure</strong> Technology Conference<br />
7-8 June 2011, Vistana Hotel, Penang, Malaysia<br />
structures. According to the definition used by Hillier, 2003: that property is neglected functionally,<br />
financially, or physically <strong>and</strong> further more is deemed to be imminently dangerous (Hillier, A.,2003).<br />
3.1 Three different types of ab<strong>and</strong>onment<br />
3.1. Physical ab<strong>and</strong>onment: occurs when owner neglect the interior or exterior upkeep of a property.<br />
This could include minor violations of the housing code that relate to the safety <strong>and</strong> comfort of<br />
the occupants or more serious structural problems. When it’s often unsafe for people to live in<br />
these structures, vacancy is not a necessary precondition of physical ab<strong>and</strong>onment, particularly<br />
when squatters or peoples with limited housing option may view these as viable sources of<br />
shelter.<br />
3.2. Financially ab<strong>and</strong>onment: occurs when an owner stop meeting their minimum financial<br />
responsibilities <strong>and</strong> property begin accumulating dept in excess of equity. Property tax<br />
arrearages, defaulted mortgages, <strong>and</strong> liens are all indicators of financial ab<strong>and</strong>onment.<br />
3.3. Functional ab<strong>and</strong>onment: occurs when a building ceases to be used: a row house in good<br />
repair, on which all property taxes are being paid, but which is boarded off <strong>and</strong> vacant, is<br />
functionally ab<strong>and</strong>oned. A building that is still occupied but no longer has mail service or utilities<br />
is like wise functionally ab<strong>and</strong>oned to certain extent.<br />
These three aspects of ab<strong>and</strong>onment are interconnected <strong>and</strong> often occur simultaneously, but they are<br />
sufficient distinct analytically to justify treating them distinctly (see figure 4. below)<br />
Physical<br />
ab<strong>and</strong>onment<br />
4. Causes of ab<strong>and</strong>onment<br />
Functional<br />
Ab<strong>and</strong>onment<br />
Financial<br />
ab<strong>and</strong>onmen<br />
Figure 4. Ab<strong>and</strong>onment has three distinct but related aspects<br />
The basic causes of ab<strong>and</strong>onment is an owner decide to ab<strong>and</strong>oned his or her property (Mallach,<br />
A.,2006) this most often occur when an owner concludes rightly or wrongly, that the potential loses<br />
from continuing to occupy or maintain the property exceed the potential benefits. Different types of<br />
property are ab<strong>and</strong>oned for different reasons:<br />
� The normal functioning of housing market: According to Accordino <strong>and</strong> Johnson, 2000 When the<br />
rent do not keep up with up keep cost in the low-end rental market, either because housing<br />
dem<strong>and</strong> falls (<strong>and</strong> with it, rents) or because maintenance cost increase (due to increase in labour<br />
cost or property taxes).<br />
� Nature of materials used for building: The modern houses are constructed using relatively heavy<br />
weight materials which absorb heat; the absorbed heat lettered omitted into internal spaces of the<br />
house making them more uncomfortable. The roof design of this type of house are built with a<br />
short roof over hang which offers little solar shading or protection to the walls.<br />
� Types of building: The traditional Malay houses start with core house which basically consist of<br />
area for sleeping, cooking <strong>and</strong> dining. Malay people tend to live in extended family <strong>and</strong> as such,<br />
as the size of the family grows, the size of the house also has to be increase (Ibrahim, S.H.,2004).<br />
While the modern low-cost houses are built with minimal area <strong>and</strong> the occupants are forced to<br />
adapt to the layout specification, any extension or renovation must seek the approval from the<br />
authority before it’s built.
106<br />
International <strong>Building</strong> & <strong>Infrastructure</strong> Technology Conference<br />
7-8 June 2011, Vistana Hotel, Penang, Malaysia<br />
� Cost of the houses: The modern housing in Malaysia are expensive therefore, deny the majority of<br />
the population, who are poor, access to housing by concentrating the housing resources in the<br />
h<strong>and</strong>s of a few, Malaysians (Choon, T. M. 2003), One of the declared objectives of the national<br />
housing policy is to provide all Malaysians, particularly those in low-income categories,<br />
accessibility to adequate <strong>and</strong> affordable housing (Choon, T. M. 2003).<br />
4.1 Effect of ab<strong>and</strong>oned developed Housing:<br />
As intimated in the introduction, it takes little by way of imagination to begin to underst<strong>and</strong> the<br />
problems created by ab<strong>and</strong>oned buildings, or how these problems are exacerbated as ab<strong>and</strong>oned<br />
buildings within Sarawak <strong>and</strong> Malaysia in general. More systematic studies of ab<strong>and</strong>onment confirm<br />
the intuition that ab<strong>and</strong>oned buildings are associated with a variety of social, economic <strong>and</strong><br />
environmental ills. The chief amongst these problems are:<br />
� Wasted resources <strong>and</strong> lost tax revenues: Ab<strong>and</strong>oned houses are a waste of resources. This<br />
waste is particularly cruel when the scarcity of affordable housing is an important issue for some<br />
sections of the community, as it is in the case of groups such as the homeless. At the same time,<br />
ab<strong>and</strong>onment involves lost tax revenues for the community as a whole<br />
� Declining property values: Economic losses, both private <strong>and</strong> public, are not confined to<br />
ab<strong>and</strong>oned houses themselves. Ab<strong>and</strong>onment affects other properties by lowering property<br />
values (Greenberg,et.al 1993). The importance of this issue is attested by the fact that, in the past,<br />
whole studies have been devoted to the economics of rehabilitating building so as to increase the<br />
value of rents <strong>and</strong> property selling prices (Nash, W.W. & M.L. Colens,1959).<br />
� Effects on community within the area: Ab<strong>and</strong>oned building have a negative impact upon social as<br />
well as purely economic aspects of well being. First, ab<strong>and</strong>oned buildings are often unattractive.<br />
At worst, ab<strong>and</strong>oned buildings are eyesores. Their grounds become unkempt <strong>and</strong> overgrown,<br />
while the building themselves become dilapidated through lack of maintenance.<br />
4.2. Solution of the problems:<br />
Ab<strong>and</strong>oned housing <strong>and</strong> lots represent decline, neglect <strong>and</strong> devaluation of properties. Malaysia, like<br />
many countries face a significant challenge in dealing with vacant <strong>and</strong> ab<strong>and</strong>oned properties. This<br />
challenges is exacerbated both by weakness in the local <strong>and</strong> regional housing markets including an<br />
over supply of housing related to dem<strong>and</strong>. Therefore, to address housing ab<strong>and</strong>onment, the following<br />
should be considered:<br />
� Housing design: Most of the houses built for low income groups neglect the importance of<br />
ventilation to cool the occupant of the house <strong>and</strong> other favourable design features which are<br />
desirable to promote a thermally comfortable environment. The environmental quality of the low<br />
income housing indicated that in terms of thermal comfort due to the lack of underst<strong>and</strong>ing of<br />
climatic factors in design, many occupant experience high temperature in their houses, especially<br />
just after mid day <strong>and</strong> concluded that one of the main drawback in most of the housing is the poor<br />
internal layout. This often fails to relate to the basic social <strong>and</strong> cultural structure of Malaysian<br />
people. To achieve <strong>and</strong> maintain comfortable living condition in the houses in hot <strong>and</strong> humid<br />
climate, the design should promote continues internal air movement <strong>and</strong> avoid excessive solar<br />
gain through the building envelop. To control the solar gain, consideration should be given to<br />
specific building elements such as the roof, roof overhangs, walls, doors <strong>and</strong> windows <strong>and</strong> how<br />
the interact with the external environment. Traditional design principle has shown that good<br />
ventilation promote good living condition, natural ventilation should be utilized to the best<br />
advantages.<br />
� Housing location: The shortage <strong>and</strong> arising cost of urban l<strong>and</strong> has discourage developers from<br />
building low income housing in or near the cities, although the generally aim is to built houses to<br />
accommodate low income families, the main purpose is been defeated by their location been too<br />
far from the location where employment is available. This scenario has happened in B<strong>and</strong>ar Bukit<br />
Beruntung in Selangor (near Kuala Lumpur) where many houses remain unsold due to their in<br />
accessibility location (Ibrahim, S.H.,2004). One of the main reason, the housing has failed to<br />
attract buyers is, the difficulty faced by them when having a commute to their place of work due to
107<br />
International <strong>Building</strong> & <strong>Infrastructure</strong> Technology Conference<br />
7-8 June 2011, Vistana Hotel, Penang, Malaysia<br />
the lack of public transportation. Poorly located low income housing project place a huge burden<br />
on the house hold economy when the people have pay for transportation. Therefore, the house<br />
should be strategically located where the occupants will have proximity to their work places <strong>and</strong><br />
the degree of traffic is controlled apart from all the necessary facilities.<br />
� Dedicated housing code: The consolidation of all property related cases into dedicated housing<br />
court has been effected in several cities. Specialized housing courts have been particularly<br />
effective where judges a specially elected or appointed to that court. A specialized court allows<br />
matters such as code enforcement to be a priority, rather than falling to the bottom of the judicial<br />
docket (Mallach, A.,2006) Judges from this court can be active champions of healthy <strong>and</strong> safe<br />
environment. The court wills h<strong>and</strong>les property related actions, including a special urban<br />
rehabilitation docket, demolition <strong>and</strong> repair of extremely dilapidated house <strong>and</strong> so fourth.<br />
5. CONCLUSIONS<br />
The proceeding discussion clearly shows that the unsold, overhang <strong>and</strong> oversupply of housing are the<br />
factors contributed to ab<strong>and</strong>onment of housing in Malaysia. To overcome these issues, it requires a<br />
profound underst<strong>and</strong>ing of numerous internal <strong>and</strong> external factors <strong>and</strong> their inter-relationship. Besides<br />
looking at the imperfections <strong>and</strong> failure of the operation of housing market which is commonly argued<br />
contributes to that issue, identification of weakness in the l<strong>and</strong> use planning system as clarified by the<br />
NEAC, the Ministry of housing <strong>and</strong> local government <strong>and</strong> by the Department of Town <strong>and</strong> Country<br />
planning should also need to be explored in detail.<br />
Ab<strong>and</strong>oned buildings can be associated with a wide variety of socio-economic problems. They are<br />
magnets for criminal activity, including the consumption <strong>and</strong> trade of drugs, prostitution, <strong>and</strong> crime<br />
against property. Ab<strong>and</strong>oned buildings cause property values in surrounding areas to decline, <strong>and</strong><br />
represent a waste of resources that is cruelly ironic in areas plagued by homelessness <strong>and</strong> a lack of<br />
affordable housing. To reduce the rate of housing ab<strong>and</strong>onment in Malaysia element such as an<br />
effective dem<strong>and</strong> (population’s affordability <strong>and</strong> household willingness to pay for housing), the housing<br />
choice (choice by housing tenure, dwelling type, form of housing <strong>and</strong> method of new houses to be<br />
developed) <strong>and</strong> the market criteria (condition of local housing market <strong>and</strong> buyers preference in terms<br />
of price, location, type of housing etc) should be incorporated in the overall housing planning process,<br />
particularly in the preparation of development plans <strong>and</strong> at the stage of development control by the<br />
local planning authority.<br />
REFERENCES<br />
Asiah, Othman (1999) the effect of the planning system on housing development: A study of<br />
development: A study of the developer’s behaviour in Kuala Lumpur <strong>and</strong> Johor Bahrun, Malaysia.<br />
Ph.D. Thesis, University of Aberdeen.<br />
Accordino, J. & Johnson, G. T. (2000) Addressing the vacant <strong>and</strong> ab<strong>and</strong>oned property problem.<br />
Journal of urban affairs, 22(3), 301<br />
Abdullahi, M. R., Mohd, K., Mohd, M., Harun, A. T. And Arif, M. (2009) “Industrialised building system:<br />
definition <strong>and</strong> concept”. Paper proceedings in ARCOM conference 2009, Nottingham, United Kingdom<br />
7-9 September, 2009.<br />
Choon, T. M. (2003) National housing policy in Malaysia (1967- 2000): An impact assessment. Master<br />
degree thesis, Kulliyah of Islamic Revealed knowledge <strong>and</strong> human science International Islamic<br />
Universiti Malaysia.<br />
Greenberg, M.R., F.J.Propper, D.Schnieder <strong>and</strong> B.M.West (1993) “Community organizing to prevent<br />
TOADS in the United State” Community development journal 28:55-65.<br />
Hillier, A. (2003)” Predicting housing ab<strong>and</strong>onment with the Philadelphia Neighbourhood information<br />
system”, Journal of urban affairs.
108<br />
International <strong>Building</strong> & <strong>Infrastructure</strong> Technology Conference<br />
7-8 June 2011, Vistana Hotel, Penang, Malaysia<br />
Ibrahim, S.H. (2004) thermal comfort in modern low income housing in Malaysia Ph.D. Thesis,<br />
University of Leeds UK<br />
Junid, S M S (1986) Industrialised building system. Proceeding of a UNESCO/FEISEAP Regional<br />
work shop, UPM Serdang.<br />
Malaysian Government, (1996) Seventh Malaysia plan, Percetaken Nasional Berhad, Kuala Lumpur.<br />
Malaysian Government, (2001) Eighth Malaysia plan, Percetaken Nasional Berhad, Kuala Lumpur.<br />
Mallach, A. (2006) Bringing building back: from ab<strong>and</strong>oned properties to community Assets, New<br />
Brunswick New Jersey: National housing institute.<br />
Nash, W.W. <strong>and</strong> M.L. Colens (1959) Residential rehabilitation: private profit <strong>and</strong> public properties.<br />
New York: MC Graw-Hill.<br />
Pagano, M.A. & Bowman, A. (2000) vacant l<strong>and</strong> in cities: An urban Resource: Brooking Institute<br />
survey series.
T127<br />
109<br />
International <strong>Building</strong> & <strong>Infrastructure</strong> Technology Conference<br />
7-8 June 2011, Vistana Hotel, Penang, Malaysia<br />
RECYCLED COARSE AGGREGATES (RCA) AS NATURAL COARSE<br />
AGGREGATES REPLACEMENT IN CONCRETE DESIGN; THE BETTER<br />
ALTERNATIVE<br />
Kam Kenn Jhun 1 , Mohd Zailan Sulieman 2 <strong>and</strong> Roslan Talib 3<br />
1,2,3 Universiti Sains Malaysia, Pulau Pinang, Malaysia<br />
2 mzailan@usm.my<br />
ABSTRACT: This paper introduces the potential use of recycled coarse aggregates (RCA) as natural<br />
coarse aggregates replacement in concrete design. RCA is obtained from the demolition <strong>and</strong> waste of<br />
old building. RCA is suggested to be used as substitution for natural coarse aggregates in new<br />
concrete mixture in order to reduce the consumption of natural resources. In the pass research<br />
towards RCA suggested that by replacing natural coarse aggregates by RCA can be more<br />
environmental friendly <strong>and</strong> reducing the consumption of natural resources. This paper will be pointed<br />
on the further study on the various relative range of RCA replacement in concrete design. In this study,<br />
the percentage of replacement is undertaken by specimens 0% (control specimens), 15%, 30%, 60%<br />
<strong>and</strong> 80% by weight. Compressive strength test, flexural strength test, density test, ultrasonic pulse<br />
velocity test will be carried according to British St<strong>and</strong>ards.<br />
Keywords: recycled coarse aggregates, natural coarse aggregates replacement, environmental<br />
friendly, consumption of natural resources.<br />
1. ENVIRONMENTAL ASPECT<br />
Nowadays, every country in our earth is looking into one of the most popular topic which is “the<br />
sustainability development for a better future”. The sustainable construction concept was introduced<br />
due to the growing concern about the future of our planet. This is due to construction industry is a<br />
massive consumer of natural resources <strong>and</strong> on the other h<strong>and</strong> a huge waste producer (Cachim, 2009).<br />
On the other h<strong>and</strong>, the cost of raw materials is increased while the natural resources are keeps on<br />
reduction. Thus, waste materials become a potential alternative in the construction industry. This<br />
waste material, when properly processed, it will be effective as natural construction materials <strong>and</strong><br />
readily meet the design specifications st<strong>and</strong>ard. (Mannan, Ganapathy, 2004). There are some kinds of<br />
study about concrete design to obtain the solutions in this construction industry. By implementing<br />
industrial waste such as recycled coarse aggregate (RCA) in concrete design may be contribute some<br />
recycling method on these industry wastes. In addition, we can decrease the usage of primary<br />
resources on casting concrete (Mehta, 2001). In Germany alone, there are 77millon tons of demolition<br />
waste per annum that produced in that country. Approximately 13 million tons estimated values of<br />
concretes are demolished in France every year <strong>and</strong> as well as Japan for a total quantity of concrete<br />
debris is in value of 10-15 million tons each year. On the other h<strong>and</strong>, Hong Kong generates about 20<br />
million tons demolition debris per year <strong>and</strong> facing serious problem for its disposal solution. Then,<br />
United State of America alone is utilizing approximately 2.7 billion tons of aggregate annually out of<br />
which 30 to 40% are used in road works <strong>and</strong> balance in structural concrete work (Singh, 2005). The<br />
massive quantities of demolished concrete waste are available at most of the construction sites due to<br />
the purpose of redevelopment of the cities. This situation leads to a serious problem of waste concrete<br />
disposal in urban areas. But in a conservative way, this can easily be recycled as aggregate <strong>and</strong> used<br />
in new fresh concrete. Research & Development activities have been carried on all over the world to<br />
prove its environment sustainability, economic viability, cost effectiveness <strong>and</strong> feasibility on this<br />
construction industry (Oikonomou, 2005).<br />
2. RECYCLED COARSE AGGREGATES<br />
RCA is those aggregates resulting from the processing of inorganic material previously used in<br />
concrete building. RCA is obtained from crushing of demolished concrete from the crushing plant.
110<br />
International <strong>Building</strong> & <strong>Infrastructure</strong> Technology Conference<br />
7-8 June 2011, Vistana Hotel, Penang, Malaysia<br />
Most of the waste product from building <strong>and</strong> demolition wastes can be used to produce recycled<br />
coarse aggregates. Nowadays building <strong>and</strong> demolition wastes can easily obtain due to there are<br />
country that rebuild <strong>and</strong> develop their cities for the purpose of revolution in a new mankind era (Marta<br />
& Pilar, 2009) RCA often contain a large amount of attached cements paste <strong>and</strong> mortar. The old<br />
mortar may contain up to 20-30% from the volume. This is mainly depends on the properties of the<br />
original concrete <strong>and</strong> the concrete crush production process. The main difference between RCA <strong>and</strong><br />
natural coarse aggregates is mainly accounts on the attached mortar <strong>and</strong> cement paste on the<br />
recycled coarse aggregates (Li, 2004).<br />
3. PREVIOUS STUDY ON RECYCLED COARSE AGGREGATES<br />
3.1 TENSILE STRENGTH OF RECYCLED COARSE AGGREGATES<br />
According to figure below, the tensile behavior of concrete is shown with different RCA contents<br />
according to direct tensile test which evaluated <strong>and</strong> tested by Liu et al. (2005), Xiao <strong>and</strong> Lan (2006).<br />
This figure shows that, as the RCA content in concrete design increases, the tensile strength will<br />
decreases.<br />
Figure 1. Influence of RCA content on the concrete uniaxial tensile strength (Li, 2008)<br />
(Sourcr: Liu et al, 2005)<br />
The tensile strengths can only be reached at 69% <strong>and</strong> 88% of the control concrete for the<br />
concrete that contain 100% of RCA content. According to the research, they also found that if the<br />
percentage of RCA contents when is not exceed 20%, the influence of RCA on a concrete design can<br />
be neglected as Figure 1. (Li, 2008).<br />
3.2 COMPRESSIVE STRENGTH OF RECYCLED COARSE AGGREGATES<br />
On the other h<strong>and</strong>, the compressive strength of the concrete will decrease as the RCA increase in the<br />
mixture. Figure 2 below show the decrease of compressive strength when RCA increased in a<br />
concrete design (Li, 2008).<br />
Figure 2. Influence of RCA content on the concrete compressive strength (Li, 2008)<br />
(Source: Li, 2008)
3.3 DENSITY OF RECYCLED COARSE AGGREGATES<br />
111<br />
International <strong>Building</strong> & <strong>Infrastructure</strong> Technology Conference<br />
7-8 June 2011, Vistana Hotel, Penang, Malaysia<br />
The density of dry surface recycled aggregate concrete (RAC) is in the range of 2340 kg/m³ with<br />
coarse aggregates size (4-8mm) <strong>and</strong> 2490 kg/m³ with coarse aggregate size (16-32mm) (Hansen &<br />
Narud, 1983).<br />
According to another researcher, he pointed out the density of waste concrete is 2510 kg/m³ with<br />
coarse aggregates size (15-30mm) when the outer surface is dried (Turanh, 1993). While for ordinary<br />
concretes, these values are between 2500 kg/m3 with coarse aggregates size (4-8mm) <strong>and</strong> 2610<br />
kg/m3 with coarse aggregates size between (16-32mm) (Hansen & Narud, 1983).<br />
4. RESEARCH DEVELOPMENTS<br />
4.1 COMPRESSIVE STRENGTH TEST<br />
Figure 3. Influence of RCA content on the concrete compressive strength<br />
(Source: Li, 2008)<br />
According to Figure 3 above, for the most basic underst<strong>and</strong>ing, the compressive strength of the<br />
concrete is directly proportional to the curing time. The longer the age of the concrete, the higher<br />
compressive strength of the concrete will be achieved. Among all the specimens, the normal concrete<br />
achieved the highest strength. Then, followed by 15%, 30%, 60% <strong>and</strong> 80% modified concretes. This is<br />
due to RCA contain attached mortar that attached to the RCA <strong>and</strong> the strength of attached mortars is<br />
very weak. Thus, this will affect the entire compressive strength of the RCA replacement concrete.<br />
The relationship between compressive strength <strong>and</strong> the percentage of RCA content in concrete is in<br />
inversely proportional in direction. The higher the RCA contents in a concrete, the lower compressive<br />
strength that can be achieved by the concrete.<br />
4.2 FLEXURAL STRENGTH TEST<br />
Figure 4. Graph of flexural strength test
112<br />
International <strong>Building</strong> & <strong>Infrastructure</strong> Technology Conference<br />
7-8 June 2011, Vistana Hotel, Penang, Malaysia<br />
The results in figure 4 show that the flexural strength at all specimens increases with the increasing<br />
age at curing. The normal specimen shows an increase from 3.967 N/mm2 at about 7 days to 4.322<br />
N/mm2 at the age at 56 days. The modified 15% concrete shows the highest flexural strength<br />
compare to others modified specimens at 3.896 N/mm2 at the 7 days age to 4.167 N/mm2 at the age<br />
of 56 days.<br />
The flexural strength of the concrete is decreasing while the percentage of RCA replacement in the<br />
concrete increase. Normal concrete achieved highest flexural strength reading which is <strong>and</strong> the<br />
flexural strength of the concrete decrease in percentage of RCA replacement. On the other h<strong>and</strong>, 80%<br />
RCA replacement concrete achieved the lowest flexural strength. The relationship between flexural<br />
strength <strong>and</strong> RCA content is inversely proportional. The higher quantity of RCA replacement in<br />
concrete design, the lower flexural strength will be achieved.<br />
4.3 DENSITY TEST<br />
Figure 5. Density of cube specimens<br />
The relationship between density <strong>and</strong> the age of concrete gives a directly proportional result. The<br />
results in figure 5 show that the density at all the specimens increases with the increasing age of<br />
curing. The increased in density of concrete when the age of concrete increased is due to the internal<br />
harden of concrete increased in time. The particle inside the concrete is hydrated in time while the void<br />
of the concrete will decrease. The concrete will become more <strong>and</strong> more compacted <strong>and</strong> the strength<br />
of the concrete will be increase in time as well. On the other h<strong>and</strong>, the density of the concrete<br />
achieved decreased when the percentage of RCA replacement in concrete increased. The highest<br />
density along the entire 7 days to 56 days curing age achieved which is normal concrete <strong>and</strong> followed<br />
by 15% modified concrete, 30% modified concrete, 60% modified concrete <strong>and</strong> the lowest 80%<br />
modified concrete. The relationship between density <strong>and</strong> percentages of RCA replacement in concrete<br />
design gives an inversely proportional result. In conclusion, we can conclude that the density of the<br />
concrete will affect the strength of concrete. While the higher the concrete density achieved, the higher<br />
the strength of the concrete harden.<br />
4.4 ULTRASONIC PULSE VELOCITY TEST<br />
Figure 6. Graph of ultrasonic pulse velocity test
113<br />
International <strong>Building</strong> & <strong>Infrastructure</strong> Technology Conference<br />
7-8 June 2011, Vistana Hotel, Penang, Malaysia<br />
According to figure 6 above, we can notice that the velocity of the ultrasonic pulse velocity test is in the<br />
range of 3100 m/s to 4500 m/s. The readings between the specimens are inversely proportional to the<br />
velocity achieved. The higher the RCA replacement in the concrete design, the lower velocity would be<br />
achieved. This is due to the RCA attached mortars that contain voids that affected the velocity of the<br />
test.<br />
When looking into the relationship between the velocity of the ultrasonic pulse velocity test towards the<br />
age of the concrete, we can clearly see that the velocity in directly proportional to the age of the<br />
concrete. The higher the age of the concrete, the velocity achieved will be higher. This is due to the<br />
internal particles of the concrete takes time to bind within each others. The hydration of the concrete<br />
takes time to achieve fully hydrated. The longer the time of hydrating process, the concrete will<br />
achieve stronger strength. When the binder between the particles of the concrete is fully harden <strong>and</strong><br />
there is lesser void in the concrete, the velocity from the ultrasonic pulse velocity test will be achieve<br />
higher reading. The higher the velocity of the concrete reading, the stronger strength will be achieved<br />
by the concrete.<br />
Table 1. Suggested pulse velocity ratings for concrete<br />
Source: Malhotra 1976<br />
According to table 1, we can know the rating for our concrete specimens. During the age of 56 days,<br />
all the concrete specimens achieved velocity on the range of 4100 m/s to 4400 m/s. The lowest<br />
reading 4108.33 m/s achieved which is modified 80% concrete <strong>and</strong> the highest reading 4418.33 m/s<br />
achieved by normal concrete. As a result, we can conclude that the general conditions on the<br />
specimens are good in rating.<br />
As a results, ultrasonic pulse velocity test can be use to underst<strong>and</strong> the characteristic of the internal<br />
particles of concrete for predicting the quality of the concrete, by underst<strong>and</strong>ing the relationship<br />
between velocity achieved toward the characteristic of internal particles of concrete.<br />
5. CONCLUSIONS<br />
The characteristic of RCA in concrete mixing design is determined <strong>and</strong> underst<strong>and</strong> in this paper. The<br />
percentage of RCA replacement in concrete design will affect the physical property <strong>and</strong> concrete<br />
characteristic of the concrete. The main concern is the strength of the concrete, the percentage of<br />
RCA replacement in concrete is inversely proportional to the strength of the concrete. The higher the<br />
percentage of RCA replacement in concrete design, the lower the strength achieved.<br />
As a conclusion, the knowledge on characteristic of the RAC is very important, for our future<br />
construction development. If RAC successfully implemented in a concrete design accordingly; it can<br />
fulfill our future environmental green <strong>and</strong> sustainable development concept which is towards the<br />
conservation of our natural resources.<br />
REFERENCES<br />
Pulse Velocity<br />
ft per sec m/s General condition<br />
Above 15000 4575 Excellent<br />
12000 to 15000 3660‐4575 Good<br />
10000 to 12000 3050‐3660 Questionable<br />
7000 to 10000 2135‐3050 Poor<br />
Below 7000 2135 Very poor<br />
American Concrete Institute Monograph No.9.<br />
British St<strong>and</strong>ards Institution, BS 882:1983. Specification for aggregates from natural coarse<br />
aggregates from natural sources for concrete. London<br />
BS 1881: Part 118, 1983: Method for Determination of Flexural Strength<br />
BS 1881: Part 119, 1983: Method for Determination of Compressive Strength
114<br />
International <strong>Building</strong> & <strong>Infrastructure</strong> Technology Conference<br />
7-8 June 2011, Vistana Hotel, Penang, Malaysia<br />
BS 812-103.1,1985: Methods for Determination of Particle Size Distribution<br />
Cachim, P.B. (2009). Mechanical Properties of Brick Aggregate Concrete. Construction <strong>and</strong> <strong>Building</strong><br />
Materials, 23(3), 1292-1297.<br />
Hansen , T.D., Narud, H. (1983). AC1 Concr. Int. Des. Const. 5, 79-83.<br />
Li, J. (2004). Study on Mechanical Behavior of Recycled Aggregate Concrete. Master thesis, Tongji<br />
University, Shanghai.<br />
Li, X.P. (2008). Material Behavior of Recycled Aggregate Concrete, Conservation <strong>and</strong> Recycling, 53(1-<br />
2), 36-44.<br />
Malhotra, V. M. (1976). Testing Hardened Concrete: Nondestructive Methods.<br />
Mannan, M. A., Ganapathy, C. (2004). Concrete from an agricultural waste-oil palm shell. <strong>Building</strong> <strong>and</strong><br />
Environment, 39( 4), 441-448.<br />
Marta, S.D.J, Pilar, A.G.B. (2009). Study on the Influence of Attached Mortar Content on the<br />
Properties of Recycled Concrete Aggregate. Construction <strong>and</strong> <strong>Building</strong> Materials, 23(2), 872-877.<br />
Mehta, PK. (2001). Reducing the Environmental Impact of Concrete. Concrete International 2001,<br />
23(10), 61-65.<br />
Oikonomou, N.D. (2005). Recycled Concrete Aggregates. Cement & Concrete Composites, 27, 315-<br />
318.<br />
Singh, S.K. (2005). Structural Engineering Division, Central <strong>Building</strong> Research Institute, Roorkee.<br />
Turanh, L. (1993). Technical Congress Declarations Book (in Turkish), Turkish Cham. of CE., 19-<br />
132.
T128<br />
115<br />
International <strong>Building</strong> & <strong>Infrastructure</strong> Technology Conference<br />
7-8 June 2011, Vistana Hotel, Penang, Malaysia<br />
MANAGING RISK CONSTRAINTS OF MULTIPLE DESIGN & BUILD PROJECTS<br />
S.P. Narayanan 1 , Arazi B. Idrus 2 <strong>and</strong> CT. Ramanathan 3<br />
1,2 Universiti Technologi PETRONAS, Perak, Malaysia.<br />
3 Kumpulan Liziz Sdn Bhd, 33-11-1, 1 Lorong Ruang Grace Square, Grace Square, 88000<br />
Kota Kinabalu, Sabah, Malaysia.<br />
1 narayanan_sambu@petronas.com.my , 2 arazi_idrus@petronas.com.my ,<br />
3 ramoo_ctr@yahoo.com<br />
ABSTRACT: The Design <strong>and</strong> Build (D&B) procurement method has gained popularity in recent times<br />
in the construction industry due to its attractive financial aspects. The development projects are<br />
implemented by D&B for its special nature, crucial time periods <strong>and</strong> size. The contractors have lack of<br />
knowledge on the other major constraints in this procurement method. Many of these D&B projects<br />
had ended in the h<strong>and</strong>s of contractors who were unable to complete the projects within agreed time<br />
<strong>and</strong> price. Even some of those who completed the projects had committed to begin implementation<br />
without carrying any analysis of the risks involved. They were basically committed by judgement <strong>and</strong><br />
inadequate experience. The risk is more while committing to multiple simultaneous projects. Even<br />
though there were studies conducted for risk management of projects <strong>and</strong> studies on contractors’ view<br />
of D&B projects, so far no studies were conducted on the time <strong>and</strong> cost risks of D&B projects. This is<br />
also extended further to study on multiple projects. The aim of this study is to identify elements,<br />
procedures to analyse <strong>and</strong> overcome the risks of the important components of time <strong>and</strong> cost in<br />
management of multiple D&B bridge projects. The final outcome of this research will be of practical<br />
use for the industry.<br />
Keywords: Design <strong>and</strong> Build, Multiple projects, Project Management, Time <strong>and</strong> cost risk<br />
1. INTRODUCTION<br />
Due to increased competition in construction industry, companies procure many projects which have<br />
to be managed simultaneously. The execution of multiple projects requires high quality project plans<br />
<strong>and</strong> controls. This also holds true for multiple D&B projects where the design also had to be done by<br />
the company. Not only is on-time delivery important, it translates directly into whether the contractor<br />
will meet the client requirement, quality <strong>and</strong> provide a return on investment. Delivering a project on<br />
time does not occur by hoping that the required completion date will be met. Majority of D&B projects<br />
encounter events <strong>and</strong>/or changes that affect the original plan of executing a project. Further, resources<br />
such as labour, material, <strong>and</strong> equipment may be scarce, in high dem<strong>and</strong> <strong>and</strong> as a result may hamper<br />
project execution. Attempting to solve these unforeseen issues during a project without a plan in place<br />
to determine the immediate impact is a major risk which can often lead to delayed projects <strong>and</strong><br />
disputes between the parties (Galloway, 2006). The situation is more complicated for projects having<br />
differing starting <strong>and</strong> completion date. Multi-project management is not simply the management of a<br />
list of individual projects, rather a complex operation with a given capacity <strong>and</strong> workload. Sharing<br />
common human resources <strong>and</strong> construction machinery effectively with no idle time need proper<br />
planning. The prerequisites of planning <strong>and</strong> control for one project are impaired by another project.<br />
2. Background of Design <strong>and</strong> Build (D&B)<br />
Types of contract procurement used in Malaysia.<br />
Generally construction projects are procured in Malaysia through Traditional contract, Design <strong>and</strong><br />
build contract, Management contract, Construction management contract, hybrid <strong>and</strong> miscellaneous<br />
contract (Jatarona, 2007).
116<br />
International <strong>Building</strong> & <strong>Infrastructure</strong> Technology Conference<br />
7-8 June 2011, Vistana Hotel, Penang, Malaysia<br />
1. Traditional contract – The client has separate contractual undertaking with both Design<br />
Consultant <strong>and</strong> Contractor/builder.<br />
2. Design <strong>and</strong> build contract - Known as ‘package deal’ or ‘turnkey contract’ undertake both<br />
designing <strong>and</strong> constructing works. The milestones of D&B contractor’s performance are<br />
shown in Figure1.<br />
3. Management contract – Role to manage, coordinate <strong>and</strong> supervise the work.<br />
4. Construction management – Provide managerial <strong>and</strong> supervisory service for the project.<br />
5. Hybrid<br />
a. Develop <strong>and</strong> construct – concept design by independent professional.<br />
b. Design <strong>and</strong> Manage – contractor responsible to manage design process.<br />
c. Design <strong>and</strong> Construction Management<br />
6. Miscellaneous Contracts<br />
a. Build, Operate <strong>and</strong> Transfer Contract – Privately financed, operated <strong>and</strong> transferred to<br />
the employer after concession period.<br />
b. Serial Contract – more than one project in accordance with the tender submitted for<br />
the initial project <strong>and</strong> in series.<br />
c. Continuation contract – Scope of the original contract extended beyond the contract<br />
domain.<br />
d. Periodic contract – execution of works is required in intervals.<br />
e. Partnering contract – Receives all contracts from employer payment in reference to<br />
initial agreed formula.<br />
f. Independent contract – undertaking stipulated tasks for an agreed consideration.<br />
Design <strong>and</strong> build is an arrangement where contracting organization takes sole responsibility, normally<br />
on a lump sum fixed price basis, for the bespoke design <strong>and</strong> construction of a client’s project<br />
(Masterman, 1992). Design <strong>and</strong> build is a procurement method where one entity or consortium is<br />
contractually responsible for both the design <strong>and</strong> construction of a project (Murdoch & Hughes, 2000).<br />
In contract to the lump sum method, design <strong>and</strong> build has two concurrent phases. The clients enter<br />
into one contract with a design <strong>and</strong> build company that is responsible for project development <strong>and</strong><br />
construction. The contractual arrangement is the simplest of the other contractual arrangement like<br />
management contracting (MC) <strong>and</strong> construction management (CM). There is one contract <strong>and</strong> one<br />
line of communication for the client. The designer-builder may be a single company that employs both<br />
the design <strong>and</strong> construction staff (known as D&B) or the design-builder may be a partnership of two or<br />
more design <strong>and</strong> construction companies (known as joint venture D&B). The objectives of this study<br />
are two-folds: to identify Time <strong>and</strong> Cost risks associated with design <strong>and</strong> build method <strong>and</strong> to make<br />
recommendation in order to mitigate the risks (Adnan, H et.al. 2008 ).<br />
Feasibi<br />
l-ity<br />
study<br />
Design<br />
Brief<br />
CONCEPTUAL<br />
3. PROBLEM STATEMENT AND MOTIVATION FOR STUDY<br />
Problem Statement<br />
Consul<br />
tants &<br />
design<br />
Cost<br />
plan &<br />
Budget<br />
Authorities<br />
approval<br />
Docum<br />
entatio<br />
n<br />
A Project is successful when it is completed on time, within budget, specified quality <strong>and</strong> to<br />
stakeholders satisfaction. Unfortunately, due to many reasons, high project performance <strong>and</strong> project<br />
success are not commonplace in the construction industry, especially in developing countries.<br />
Therefore, professionals <strong>and</strong> scholars have been motivated to take extensive efforts to meet this<br />
challenge.<br />
Ten<br />
deri<br />
ng<br />
Construc<br />
-tion<br />
DEFINITION PLANNING IMPLEMENTATION<br />
Figure 1. Milestones of D&B Contractor<br />
C<br />
P<br />
C<br />
Mainte<br />
nance<br />
Start End<br />
CLOSE<br />
OUT
117<br />
International <strong>Building</strong> & <strong>Infrastructure</strong> Technology Conference<br />
7-8 June 2011, Vistana Hotel, Penang, Malaysia<br />
� There is no additional time or cost given for D&B projects which has fixed contract sum <strong>and</strong><br />
contract period. Many D&B projects are carried out without proper checking of risks involved <strong>and</strong><br />
are ending up in variation orders which are not considered for contracts procured in this method.<br />
This is because so far there are no proper guidelines or st<strong>and</strong>ards set because there were no<br />
studies conducted on these aspects. Because of which there are many disputes between<br />
consultants <strong>and</strong> contractors or clients <strong>and</strong> contractors. This is the problem that this research<br />
intends to solve by conducting research in the Malaysian perspective.<br />
� Time delays, cost overruns <strong>and</strong> change orders are generally due to factors such as design errors,<br />
unexpected site conditions, increase in project scope, weather conditions <strong>and</strong> other project<br />
changes. A study to analyse the uncertainties of cost overrun <strong>and</strong> time delay problem is required<br />
to address the problem with appropriate recommendations.<br />
� There are evidences that contractors who are able to perform <strong>and</strong> deliver their earlier projects<br />
successfully are not producing consistence results. The recorded failures of the same contractor<br />
to deliver similar upcoming projects by facing time <strong>and</strong> cost overrun, is an alarm to the industry for<br />
both client as well as contractor. This is due to the gap in lack of studies related to time <strong>and</strong> cost<br />
risk in project management.<br />
� It is concluded that a separate study is required for identifying <strong>and</strong> analyzing the factors of delay<br />
causers for projects operated in Sabah, East Malaysia.<br />
Scope of Research:<br />
To create risk modelling assessment to evaluate a project’s risk factors before proposed project<br />
commencement by performing statistical modelling of uncertainty related to time <strong>and</strong> cost through<br />
questionnaire surveys. Record <strong>and</strong> monitor the real time project performance in Sabah. Comparing<br />
the qualitative <strong>and</strong> quantitative results from the responses (of questionnaire response with the<br />
practical case study project’s observation) to analyse <strong>and</strong> prepare a useful Risk Response Plan.<br />
Analyse also extended to derive results of influential factors causing time <strong>and</strong> cost uncertainties in<br />
multiple projects.<br />
The Objective of the study<br />
� Study on the management of known uncertainties of time <strong>and</strong> cost in Multiple D&B bridge<br />
projects.<br />
� To identify the risk of time <strong>and</strong> cost factors for multiple D&B projects from the view point of<br />
employer, consultants <strong>and</strong> contractors through questionnaire.<br />
� To study <strong>and</strong> identify the recurring time <strong>and</strong> cost factors influencing the project case study from<br />
the data collected in the ongoing multiple bridge projects.<br />
� Risk modelling with comparative analysis of case study data with the questionnaire survey of<br />
respondents on the risk of time on cost in multiple bridge projects.<br />
4. LITERATURE REVIEW<br />
Michael Latham – 1994 the report to this government sponsored examination that the construction<br />
industry in the United Kingdom was inherently ineffiencient <strong>and</strong> excessively costly. The report<br />
identified many of the key failings of the traditional approach to procuring the managing contracts such<br />
as: the emphasis on lowest price rather than value for money; an adversarial culture throughout the<br />
supply chain; <strong>and</strong> the lack of a client focus. It made detailed recommendation including: the need to<br />
bring together client, design consultants, contractors <strong>and</strong> subcontractors as an integrated team; a<br />
partnership approach to working with an emphasis on teamwork, openness <strong>and</strong> continuous<br />
improvement; <strong>and</strong> a move away from awarding tenders solely on the basis of lowest price. It<br />
emphasised the role of the client in bringing about the necessary changes within the industry <strong>and</strong><br />
recommended that Government commit to becoming a best practice client. The report estimated that<br />
if the recommended improvements were implemented there was potential to achieve efficiency saving<br />
of 30% of construction costs over five years.<br />
Sir Peter Levene – 1995 subsequent to the Latham report, the Government commissioned this<br />
Efficiency Unit Scrutiny to examine its performance as a construction client. The report concluded that<br />
the performance of departments was poor <strong>and</strong> that this was contributing in a significant way to the<br />
poor performance of the industry. It criticised: poor communication with contractors; lack of<br />
underst<strong>and</strong>ing of risk <strong>and</strong> how to manage it; unrealistically optimistic budgets <strong>and</strong> timetables; <strong>and</strong> over<br />
simplistic view of competition with emphasis on long tender lists <strong>and</strong> initial price rather than quantity
118<br />
International <strong>Building</strong> & <strong>Infrastructure</strong> Technology Conference<br />
7-8 June 2011, Vistana Hotel, Penang, Malaysia<br />
<strong>and</strong> long term costs. The report made detailed recommendations to improve performance by:<br />
encouraging team working <strong>and</strong> partnering; improved forms of contract; training for staff; <strong>and</strong><br />
improvement of best practice guidance.<br />
Sir John Egan – 1998 despite implementation of many of the recommendations of Latham <strong>and</strong><br />
Levene, progress in improving performance on construction projects was perceived to be slow. A<br />
Construction Task Force was set up to advise the Deputy Prime Minster from the client’s perspective<br />
on the opportunities to improve the efficiency <strong>and</strong> quality of delivery of construction, to reinforce the<br />
impetus for change <strong>and</strong> to make industry more responsive to customer needs. The Task Force<br />
produced the report Rethinking Construction which indentified five “drivers” which needed to be in<br />
place to secure improvement; four key processes which had to be significantly enhanced; <strong>and</strong> seven<br />
quantified targets for the level of improvement to be achieved.<br />
Despite involvement of UK government from Higher level to study to overcome the cost <strong>and</strong> time risk<br />
posed to the project implementation, it has difficulties in improving or to follow the recommendations<br />
made in the reports since 1994. Hence it is highly required to have a practical study in Malaysia to<br />
manage the risk of time <strong>and</strong> cost in projects.<br />
5. RESEARCH METHODOLOGY<br />
The Research involves multiple infrastructure projects involving construction of Bridges undertaken in<br />
Design <strong>and</strong> Build concept.<br />
Real time project case study:<br />
Forty Five bridges have been constructed in this concept of D&B <strong>and</strong> delivered to JKR. The data of<br />
risks involved in time <strong>and</strong> costs are collected <strong>and</strong> analysis of the causes will be carried out. Further,<br />
structured questionnaire related to these parameters of time <strong>and</strong> cost will be given to clients,<br />
consultants <strong>and</strong> contracts h<strong>and</strong>ling projects of similar nature. Their personal feedbacks on the<br />
previous projects data are compared <strong>and</strong> solutions for the risks are derived. The results of the studies<br />
will be applied <strong>and</strong> tested in the upcoming project of 12 bridges (duration of 20 months) for the<br />
confirmation of the study results. Any correction after practical checking will be reported with final<br />
conclusions on management of risk on time <strong>and</strong> cost of multiple D&B bridge projects in Malaysia.<br />
Questionnaire survey:<br />
This Research Study is focused on the paramount important constraints of Time <strong>and</strong> Cost effects in<br />
project management in multi-project setup. The different activities for the questionnaire survey are<br />
listed below. The questionnaires are distributed to PWD, Project owners, Design Consultants,<br />
General Contractors. The responses are compiled. The questionnaires covers 6 aspects of Time<br />
Management, 3 aspects of Cost management <strong>and</strong> 6 aspects of risk modelling, listed under sections C,<br />
D <strong>and</strong> E. The integrated study will be conducted on Time risks <strong>and</strong> Cost risks with the following<br />
aspects as established in PMBOK of PMI.<br />
Time Management<br />
� Define Activities - Planning Process<br />
� Sequence Activities - Planning Process<br />
� Estimate Activity resources - Planning Process<br />
� Estimate Activity duration - Planning Process<br />
� Develop schedule - Planning Process<br />
� Control Schedule - Monitoring <strong>and</strong> Controlling Process<br />
Cost Management<br />
� Estimating cost - Planning Process<br />
� Determine Budget - Planning Process<br />
� Control Costs - Monitoring <strong>and</strong> Controlling Process<br />
Risk Modeling<br />
� Plan Risk Management - Planning Process<br />
� Identify Risks - Planning Process<br />
� Perform Qualitative Risk Analysis - Planning Process<br />
� Perform Quantitative Risk Analysis - Planning Process
119<br />
International <strong>Building</strong> & <strong>Infrastructure</strong> Technology Conference<br />
7-8 June 2011, Vistana Hotel, Penang, Malaysia<br />
� Plan Risk Response - Planning Process<br />
� Monitor <strong>and</strong> Control Risk. - Monitoring <strong>and</strong> Controlling Process<br />
The questionnaire was divided into three parts. The first part requested background information about<br />
the respondents. The second part of the questionnaire focused on time <strong>and</strong> cost management. The<br />
respondents were asked to highlight their recommendations to improve the performance of Malaysian<br />
construction industry through an open-ended question at the end of second part of the questionnaire.<br />
Third part of the questionnaire focused on the risk factors influencing time <strong>and</strong> cost in Malaysian<br />
construction industry. A five-point Likert scale ranging from 1 (not important) to 5 (extremely<br />
important) was adopted to capture the risks of time <strong>and</strong> cost in multiple design <strong>and</strong> build bridge<br />
projects.<br />
� The case study has been used for practical examples to identify Known unknowns <strong>and</strong> Unknown<br />
unknowns.<br />
� Plan for risk responses <strong>and</strong> methods of planning <strong>and</strong> h<strong>and</strong>ling risks are being studied on Negative<br />
Risks as Threats <strong>and</strong> Positive Risks as Opportunities.<br />
6. REAL LIFE PROJECT - A Case Study<br />
Completed Multiple Bridge Projects<br />
As D&B is the fastest way to begin <strong>and</strong> implement various development projects across the country<br />
(Malaysia), the case study Multiple D&B Bridge projects was also proposed <strong>and</strong> implemented<br />
successfully in Sabah. The research on this case study has highlighted the complexity while<br />
implementation <strong>and</strong> presented Project Management studies used to solve problems from beginning of<br />
the life cycle of this projects. Overview of this multiple project setup in this case study is shown in<br />
Table 1.<br />
Project<br />
Number<br />
1<br />
2<br />
3<br />
4<br />
5<br />
Table 1. Overview of Multiple Projects completed in Sabah<br />
No. of Bridges No. of district<br />
Project Duration<br />
Locations Months Period<br />
12<br />
3<br />
18<br />
Jul 03 – Jan 05<br />
5<br />
3<br />
18<br />
Jan 05 – Jul 06<br />
8<br />
3<br />
18<br />
Jul 05 – Jan 07<br />
13<br />
3<br />
20<br />
Oct 05 – Jun 07<br />
7<br />
3<br />
20<br />
Oct 05 – Jun 07<br />
Total 45 12 48 Jul 03 – Jun 07<br />
Presently ongoing Multiple Bridge Projects<br />
The details of Multiple Bridge projects currently in progress are shown in table 2:<br />
Project<br />
Number<br />
1<br />
2<br />
Table 2. Overview of Multiple Projects currently ongoing in Sabah (Project VI & VIII)<br />
No. of<br />
Bridges<br />
8<br />
4<br />
No. of district<br />
Project Duration<br />
Locations Months Period<br />
4<br />
2<br />
20<br />
20<br />
March 09 – Nov 10<br />
July 09 – Feb 11<br />
Total 12 5 23 March 09 – Feb 11<br />
7. SUMMARY<br />
� The research has currently reached to the stage of completing Literature review <strong>and</strong> finalised<br />
Research Methodology to achieve the research objectives.<br />
� The risk modelling in the aspect of Time delays <strong>and</strong> Cost overruns factors are being identified.<br />
� Data collection patterns for the ongoing projects are in progress.
120<br />
International <strong>Building</strong> & <strong>Infrastructure</strong> Technology Conference<br />
7-8 June 2011, Vistana Hotel, Penang, Malaysia<br />
� Simultaneously the data compilation from the completed real time multiple bridge projects (as<br />
stated in the case study) are in progress.<br />
� Questionnaire are prepared <strong>and</strong> scheduled to distribute to clients, consultants, contractors <strong>and</strong><br />
various experts in the field to have comprehensive data for analysis.<br />
� Before starting the real survey a pilot study is planned to obtain field experts’ opinion on the<br />
questionnaire items.<br />
REFERENCES<br />
Abd Majid, M.Z.A <strong>and</strong> Mccaffer, R. (1998). Factors of Non-Excusable Delays that Influence<br />
Contractors' Performance. Journal of Management in Engineering, 14, No 3 May/June 1998. pp 42-48.<br />
Bennett, J. <strong>and</strong> Grice, T. (1990). Procurement systems for building. In: Br<strong>and</strong>on, P. (ed) Quantity<br />
Surveying Techniques: New Directions, Blackwell Scientific Publications, Oxford.<br />
Bordat.C., McCullouch. B. & Sinha. K. (2004). An Analysis of Cost Overruns <strong>and</strong> Time Delays of<br />
INDOT Projects. Joint Transportation Research Program. Indiana Department of Transportation <strong>and</strong><br />
U.S. Deparment of Transportation. Purdue University, Indiana.<br />
Boskers, N.D. & AbouRizk, S. M. (2005). Modelling Scheduling Uncertainty in Capital Construction<br />
Projects. Proceedings of the 2005 Winter simulation conference. Canada.<br />
Bowen, P.A., Hall, K.A., Edwards, P.J., Pearl, R.G.& Cattell, K.S. (2002). Perceptions of Time, Cost<br />
<strong>and</strong> Quality Management on <strong>Building</strong> Projects. The Australian Journal of Construction Economics <strong>and</strong><br />
<strong>Building</strong>. 2(2), pp 48-56.<br />
Charles, T.J. <strong>and</strong> Andrew, M.A. (1990). Predictors of cost-overrun rates. Journal of Construction<br />
Engineering <strong>and</strong> Management, ASCE, 116, pp 548–552.<br />
Chartered Institute of <strong>Building</strong>. (2003). Code of Practice for Project Management for Construction <strong>and</strong><br />
Development. Chartered Institute of <strong>Building</strong>. London: Blackwell.<br />
Ellis, R.D. & Thomas, H.R. (2002). The Root Causes of Delays in Highway Construction. 82nd Annual<br />
Meeting of the Transportation Research Board. Washington, D.C.<br />
Herbsman, Z. <strong>and</strong> Ellis, R.D. (1991). The cost/time/quality integrated bidding system— an innovation<br />
in contract administration. In: Bezelega, A. <strong>and</strong> Br<strong>and</strong>on, P. (eds) Management, Quality <strong>and</strong><br />
Economics in <strong>Building</strong>. E. & F.N. Spon Ltd., London.<br />
Hughes, T. <strong>and</strong> Williams, T. (1991). Quality Assurance. BSP Professional Books, Oxford.<br />
Irel<strong>and</strong>, V. (1983). The Role of Managerial Actions in the Cost Time <strong>and</strong> Quality Performance of High<br />
Rise Commercial <strong>Building</strong> Projects. Unpublished PhD Thesis, University of Sydney, Sydney.<br />
Jahren, C. & Ashe, A. (1990). Predictors of Cost overruns. Journal of Construction Engineering <strong>and</strong><br />
Management. 116,pp 548-51.<br />
Lansley, P. (1993). Towards improved managerial effectiveness. In: Proceedings of the CIB W-65<br />
International Symposium on Organisation <strong>and</strong> Management of Construction, pp 671–679. Trinidad.<br />
Long, N.D, Ogunlana, S, Quang, T <strong>and</strong> Lam, C, K. (2004). Large construction projects in developing<br />
countries: a case study from Vietnam. International Journal of Project Management. 22, pp 553-561<br />
.<br />
Matheu, F. N. & Casanova, M. C. (2005). Life Cycle document management system for construction.<br />
Doctoral Thesis. Terrassa: Universitat Politecnica De Catalynya.<br />
National Economic Development Office (N.E.D.O.). (1983). Faster <strong>Building</strong> for Industry. Her Majesty’s<br />
Stationery Office, London.<br />
Newcombe, R., Langford, D. <strong>and</strong> Fellows, R. (1990). Construction Management 2. Mitchell, London.
121<br />
International <strong>Building</strong> & <strong>Infrastructure</strong> Technology Conference<br />
7-8 June 2011, Vistana Hotel, Penang, Malaysia<br />
Peters, G. (1981). Project Management <strong>and</strong> construction control. New York: Construction press.<br />
Project Management Institute (PMI). (2000). A guide to the Project Management Body of Knowledge.<br />
(2000 ed.). Pennsylvania: PMBOK.<br />
Project Management Institute (PMI). (2008). Fourth Edition. A guide to the Project Management Body<br />
of Knowledge. Atlanta: PMBOK.<br />
Royal Institute of British Architects (RIBA). (2000). Architect’s Plan of work. London: RIBA<br />
Rwelamila, P.D. <strong>and</strong> Hall, K.A. (1995) Total <strong>Systems</strong> Intervention: an integrated approach to time,<br />
cost <strong>and</strong> quality management. Construction Management <strong>and</strong> Economics, 13, pp 235–241.<br />
Thomas,A.V., Kalidindi, S.A. & Ganesh, L.S. 2006. Modelling <strong>and</strong> assessment of critical risks in BOT<br />
road projects. Construction Management <strong>and</strong> Economics. 24, pp 407-424.<br />
Walker. (1984). Project Management in Construction. London: Granada.
T129<br />
122<br />
International <strong>Building</strong> & <strong>Infrastructure</strong> Technology Conference<br />
7-8 June 2011, Vistana Hotel, Penang, Malaysia<br />
FULLY UTILISATION OF FINE BOTTOM ASH AGGREGATE (FBAA) AS<br />
REPLACEMENT AGGREGATE IN CONCRETE BLOCK<br />
Mohd Syahrul Hisyam bin Mohd Sani 1 , Fadhluhartini bt Muftah 2 , Zulkifli Muda 3<br />
1,2,3 Faculty of Civil Engineering, Universiti Teknologi MARA Pahang, Malaysia<br />
1 msyahrul210@pahang.uitm.edu.my, 2 fadhlu@pahang.uitm.edu.my<br />
ABSTRACT: This paper presents the use of bottom ash as fine aggregate in producing concrete<br />
block. The fine bottom ash aggregate (FBAA) is a waste material that is taken from electric power<br />
plant. FBAA is by product of electric generator by coal material. The objective of the study is to<br />
investigate the feasibility <strong>and</strong> potential use of FBAA in concrete <strong>and</strong> concrete application especially<br />
block. It is essential to use waste material due to a scarce of natural material, shortage area for dump,<br />
high cost <strong>and</strong> environmental problem. FBAA used to replace the fine aggregate is passed through 5<br />
mm sieve. The chemical, physical <strong>and</strong> mechanical properties of FBAA were discussed. Chemical<br />
composition of FBAA was determined by using X-Ray Fluorescence (XRF) <strong>and</strong> physical properties of<br />
FBAA was analysed. Different concrete mixes that depend on different proportion of FBAA with<br />
constant water cement ratio were prepared. Mechanical results indicate that all proportion percentage<br />
replacement by FBAA is illustrated lower compare to control mix. The compressive strength of<br />
concrete with 80% FBAA replacement by weight of natural s<strong>and</strong> is found to be an optimum usage in<br />
concrete. Therefore, 80% FBAA replacement can be used as an alternative of natural fine aggregate<br />
in concrete block production.<br />
Keywords: Bottom ash, fine Aggregate, concrete, properties<br />
1. INTRODUCTION<br />
A main source of Fine Bottom Ash Aggregate (FBAA) is a waste product of coal electric power plant.<br />
Waste product known as bottom ash is estimated to increase in the develop country such as China,<br />
Korea, Malaysia <strong>and</strong> other countries where l<strong>and</strong>fill for dumped is limited. In the Peninsula Malaysia,<br />
there are 4 famous coal electric power plants that use a coal (coal-fired) as a power material for<br />
generates electricity. There are at Perak, Johor, Selangor <strong>and</strong> Negeri Sembilan. TNB’s electric power<br />
plant in Perak by using coal to the burning began operations in September 2002 with a capacity of<br />
2100 MW (3 X 700 MW). This coal was taken directly from Sarawak or import high quality coal from<br />
Indonesia, Australia, the United States, Canada <strong>and</strong> also China. TNB will use 1.5 million tons of coal<br />
each year. There are two types of waste product (fly ash <strong>and</strong> bottom ash) were produced. To control<br />
waste product hovering in the atmosphere, recipients electrostatics was built <strong>and</strong> used for trapping<br />
99% of ash <strong>and</strong> dust. While another waste product that disposed after process of electicity <strong>and</strong><br />
collected from the bottom of furnaces that burn coal or the bottom of combustion chamber. This coal<br />
bottom ash is physically coarse, porous, glassy, granular, greyish <strong>and</strong> incombustible materials. The<br />
type of bottom ash produced depends on the type of furnace <strong>and</strong> also the sources of coal. From the<br />
burning process of coal, 80% of product will become fly ash <strong>and</strong> remain 20% of product is bottom ash.<br />
Bottom ash is collected at the bottom of the combustion chamber in a water-filled hopper, is removed<br />
by means of high-pressure water jets <strong>and</strong> conveyed by sluiceways to a decanting basin for dewatering<br />
followed by stockpiling <strong>and</strong> possibly crushing (Steam, 1978). Figure 1 show the typical steam<br />
generating system that illustrated the bottom ash dispose at the bottom furnace <strong>and</strong> fly ash is dispose<br />
to atmosphere by very tall chimney. Table 1 presents the physical properties of bottom ash.
123<br />
International <strong>Building</strong> & <strong>Infrastructure</strong> Technology Conference<br />
7-8 June 2011, Vistana Hotel, Penang, Malaysia<br />
Figure 1. The production of coal combustion byproducts in steam generating system (NETL, 2006).<br />
Table 1. The typical physical properties of bottom ash (Majizadeh et al., 1979)<br />
Property Bottom Ash<br />
Specific Gravity 2.1 -2.7<br />
Dry Unit Weight 7.07 - 15.72 kN/m 3 (45 - 100 lb/ft 3 )<br />
Plasticity None<br />
Absorption 0.8 - 2.0%<br />
The problem to find additional dumped sites is also becoming more difficult due to acute shortage of<br />
l<strong>and</strong> as the pace of development. Apart from that, conventional construction material depends on<br />
natural resources, which are now becoming scarce <strong>and</strong> give a lot of environmental effect (l<strong>and</strong>slide<br />
<strong>and</strong> water pollution). The use of bottom ash as filler <strong>and</strong> aggregate of suitable size in concretes would<br />
save a million tons per year of natural materials <strong>and</strong> would reduce l<strong>and</strong>fill-related problems (Ferraris et<br />
al, 2009). In order to overcome both of these problems, there is a need to provide viable solution by<br />
reducing the use of natural resources <strong>and</strong> by reusing waste material. From the observation of physical<br />
properties <strong>and</strong> physical appearance, bottom ash can be replaced or substituted in concrete mix. The<br />
physical shape <strong>and</strong> geometry of bottom ash had similar to fine aggregate or s<strong>and</strong>. Besides that with a<br />
lot of problem of waste product to environment <strong>and</strong> due to shortage of fine aggregate material, bottom<br />
ash could be a great material to replace of s<strong>and</strong>.<br />
According to 2006 statistics, 45% bottom ash is used in transportation applications such as Asphalt<br />
Concrete Aggregate, road base material, Embankment or Backfill Material <strong>and</strong> structural fill (American<br />
Coal Ash Association (ACAA, 2006). Hjelmar et al (2006) said that bottom ash or municipal solid<br />
waste incinerator (MSWI) bottom ash in Denmark is utilisation for back-filling (l<strong>and</strong>fill) <strong>and</strong> as subbased<br />
in road construction purposes. Besides that, bottom ash is also used as fine aggregate in<br />
producing lightweight concrete masonry <strong>and</strong> as cement replacement in structural <strong>and</strong> masonry<br />
purpose (Saikia et al, 2008), (Jaturapitakkul <strong>and</strong> Cheerarot, 2003). Many investigation found that the<br />
bottom ash has some cementaneous properties in which may increasing the strength <strong>and</strong> long-term<br />
than concrete with natural s<strong>and</strong>. Siddique (2003) carried out strength properties test <strong>and</strong> indicate<br />
significant improvement in the strength of concrete by the addition of class F fly ash as partial<br />
replacement <strong>and</strong> can be effectively used in structural concrete. The physical properties of fine<br />
aggregate that carried out as shown in Table 2. Figure 2 illustrates the common applications of coal<br />
bottom ash. The strength <strong>and</strong> drying shrinkage of concretes with furnace bottom ash (FBA) as s<strong>and</strong><br />
replacement at 0%, 30%, 50%,70% <strong>and</strong> 100% by mass, were studied at fixed water–cement ratios<br />
(W/C) <strong>and</strong> fixed slump ranges (Bai et al, 2005). The results showed that, at fixed water–cement ratios,<br />
the compressive strength <strong>and</strong> the drying shrinkage decreased with the increase of the FBA s<strong>and</strong><br />
content.
124<br />
International <strong>Building</strong> & <strong>Infrastructure</strong> Technology Conference<br />
7-8 June 2011, Vistana Hotel, Penang, Malaysia<br />
Table 2. Physical properties of aggregates (Siddique, 2003)<br />
Property Fine aggregate Coarse aggregate<br />
Specific gravity (SG) 2.63 2.61<br />
Fineness modulus 2.25 6.61<br />
SSD absorption (%) 0.86 1.12<br />
Void (%) 36.2 39.6<br />
Unit weight (kg/m3) 1690 1615<br />
Figure 2. Bottom ash applications as a percentage of totals reused. (ACAA, 2006)<br />
Besides that, many researchers have explored for utilizing bottom ash in special concrete application<br />
such as roller compacted concrete <strong>and</strong> self-compacting concrete. Ghafoori et al. (1997) carried out<br />
investigations on a series of laboratory-made roller compacted concretes (RCC) containing highcalcium<br />
dry bottom ash as a fine aggregate. Kasemchaisiri et al. (2008) presented the test results of<br />
mechanical properties of self-compacting concrete (SCC) incorporating bottom ash as partial s<strong>and</strong><br />
replacement of 10%, 20% <strong>and</strong> 30% by weight. 10% replacement by weight of total fine aggregate<br />
showed a better durability, chloride penetration, carbonation depth <strong>and</strong> drying shrinkage compare to<br />
control SCC mix.<br />
Concrete block is normally utilised as a building material in the construction as a wall or retaining units.<br />
A concrete block is form in solid or hollow shape <strong>and</strong> their surface cast in smooth condition. The<br />
concrete raw materials commonly used to produce concrete blocks is a mixture of cement, water, fine<br />
aggregate (s<strong>and</strong>) <strong>and</strong> coarse aggregate (gravel). Evaluation of compressive strength of processed<br />
bottom ash for use as lightweight aggregate in the production of concrete masonry units (8” x 8” x 16”)<br />
has done by Phillips et al (2005). Concrete with incinerator ash were show no gain in the compressive<br />
strength <strong>and</strong> the leaching of elements from ash block sample did not show significant variation in the<br />
pH of the contact water (D’Souza & Shrihari, 2007). This study explores the possibility <strong>and</strong> prospect of<br />
fully replacing of fine bottom ash aggregate (FBAA) as a way of incorporating significant amount of<br />
FBAA. Next, this paper also reports on the properties of hardened concrete with bottom ash as<br />
substitute for natural s<strong>and</strong>.<br />
2. MATERIAL AND EXPERIMENTAL WORK<br />
Bottom ash used was collected from the bottom of furnaces of TNB Electric power plant (Coal Power<br />
Station) in Perak. The bottom ash is then dried at normal temperature for 24 hours <strong>and</strong> sieved around<br />
5 mm <strong>and</strong> below 5mm as to be a FBAA. This FBAA is of Q – DEJ + 10% Lati Coal type. Q – DEJ <strong>and</strong><br />
Lati are noted as the origin of the coal located in Indonesia. Ash content in Q – DEJ <strong>and</strong> Lati was 10 –<br />
13 % <strong>and</strong> 4% respectively. The Q – DEJ contain high fly ash <strong>and</strong> bottom ash while Lati contain low fly<br />
ash <strong>and</strong> high bottom ash. This BA has 9.76 pH concentrations. The discharging method of bottom ash<br />
was by circulating water <strong>and</strong> it is free from salt <strong>and</strong> chloride.
125<br />
International <strong>Building</strong> & <strong>Infrastructure</strong> Technology Conference<br />
7-8 June 2011, Vistana Hotel, Penang, Malaysia<br />
After 24 hours, the FBAA were taken <strong>and</strong> sieve analysis is then carried out to get the particle size<br />
distribution accordance to BS 812-103.1: 1985. The FBAA was also applied as partially s<strong>and</strong><br />
replacement by weight in concrete mix to produce cube concrete for crushing test accordance to BS<br />
1881: Part 116: 1983 . The FBAA was substitute into concrete with its natural water to cement content<br />
of 0.55. The Portl<strong>and</strong> cement used was a single source of Portl<strong>and</strong> cement. Concreting activity also<br />
utilized a 20 mm coarse aggregate of granite origin <strong>and</strong> clean tap water free from material deleterious<br />
to concrete.<br />
3. CHEMICAL AND PHYSICAL PROPERTIES OF WASHED BOTTOM ASH<br />
3.1 Chemical Properties<br />
Chemical composition of the FBAA was determined by using by XRF method on 500g coal. It was<br />
results as tabulated in Table 3. In general the FBAA is composed of 39.4% <strong>and</strong> 34.3% of silica <strong>and</strong><br />
alumina respectively. The lost of ignition of 0.63. The chemical properties are almost same as<br />
Ordinary Portl<strong>and</strong> Cement (OPC) hence it is suitable used in concrete.<br />
3.2 Sieve Analysis<br />
Table 3. Chemical properties of bottom ash <strong>and</strong> OPC<br />
Chemical composition<br />
Bottom ash<br />
Weight percent%<br />
Cement*<br />
(OPC)<br />
Silica, SiO2 39.4 20.6<br />
Alumina, Al2O3 34.3 6.3<br />
Iron Oxide, Fe2O3 15 3.6<br />
Titania, TiO2 3.08 -<br />
Magnesia, MgO 1.57 -<br />
Calcium Oxide, CaO 6.13 63<br />
LOI at 1000⁰C 0.63 -<br />
* (Bai, Ibrahim <strong>and</strong> Basheer, 2010)<br />
Aggregate grading is very important in relation to the plastic properties <strong>and</strong> might effects the properties<br />
in harden state. Physical properties analysis conducted for FBAA sample was sieve analysed <strong>and</strong><br />
fineness modulus was determined. FBAA used to replace the fine aggregate is passed through 5 mm<br />
sieve. Sieve analyses of the natural s<strong>and</strong> <strong>and</strong> FBAA sample were carried out as per British St<strong>and</strong>ard<br />
(BS 410: 2000). The sample was initially sieved through 5mm in order to identify the fine particles in<br />
the bottom ash. The sieve grading is done by dry sieving using in-house method <strong>and</strong> the results are<br />
tabulated in Table 4.<br />
BS sieve size Mass (kg)<br />
Table 4. Sieve analysis of FBAA<br />
Cumulative Mass<br />
retained<br />
(kg)<br />
Cumulative<br />
percentage<br />
retained<br />
(%)<br />
Cumulative<br />
percentage<br />
passing<br />
(%)<br />
10 mm 0 0 0 100<br />
5.00mm 0.5096 0.5096 12.56 87.44<br />
3.35mm 0.4942 1.0038 24.74 75.26<br />
2.00mm 0.4645 1.4683 36.18 63.82<br />
1.18mm 0.4278 1.8961 46.72 53.28<br />
600μm 0.4095 2.3056 56.81 43.19<br />
425μm 0.3696 2.6752 65.92 34.08<br />
300μm 0.3669 3.0421 74.96 25.04<br />
212μm 0.3438 3.3859 83.43 16.57<br />
150μm 0.3391 3.7250 91.79 8.21<br />
63μm 0.3272 4.0522 99.85 0.15<br />
0 0.0060 4.0582 - -<br />
Total 4.0582 - 493.12 -
BS sieve<br />
size<br />
126<br />
International <strong>Building</strong> & <strong>Infrastructure</strong> Technology Conference<br />
7-8 June 2011, Vistana Hotel, Penang, Malaysia<br />
Table 5. Grading limit for Fine Aggregate (Derived from BS 882)<br />
Overall<br />
Additional limits<br />
limit C M F<br />
Percentage by weight passing BS sieve (%)<br />
Zone 1 Zone 2 Zone 3 Zone 4<br />
10 mm 100 - - - 100 100 100 100<br />
5 mm 89-100 - - - 90-100<br />
90 –<br />
100<br />
90-100 95-100<br />
2.36 mm 60-100 60-100 65-100 80-100 60-95 75-100 85-100 95-100<br />
1.18 mm 30-100 30-90 45-100 70-100 30-70 55-90 75-100 90-100<br />
600 μm 15-100 15-54 25-80 55-100 15-34 35-59 60-79 80-100<br />
300 μm 5-70 5-40 5-48 5-70 5-20 8-30 12-40 15-50<br />
150 μm 0 - - - 0-10 0-10 0-10 0-15<br />
Aggregate grading zone 2 <strong>and</strong> 3 is often described as concreting s<strong>and</strong> which is derived from BS 882:<br />
1992. Table 5 show the grading limit for fine aggregates for overall limit, additional limits <strong>and</strong> grading<br />
zone 1 to zone 4. The bottom ash s<strong>and</strong> is not fully compliance to grading any limit specified four<br />
grading zones.<br />
Nevertheless the FBAA samples are almost complied with grading zone 1 <strong>and</strong> zone 2 of the fine<br />
aggregate as shown in Figure 3 <strong>and</strong> Figure 4. The FBAA is not compliance only for sieve size of 212<br />
µm up to 600 µm for specified grading Zone 1. This non-compliance was mainly due to the large<br />
percentage of fine particle in FBAA <strong>and</strong> may be considered as too fine. In contrast, the bottom ash<br />
sample is not compliance to the large particle of specified grading Zone 2 for sieve size of 1.18 mm up<br />
to 5 mm. It was happened due to small percentage of large particles in FBAA samples <strong>and</strong> indicates<br />
that the sample is too coarse. The higher the zone number indicates a finer material. Therefore, the<br />
FBAA is considered as coarse to medium s<strong>and</strong> which is almost applicable in any concrete application<br />
that specified to Zone 1 <strong>and</strong> Zone 2.<br />
Figure 3. Grading curve of FBAA for Zone 1
Figure 4. Grading curve of FBAA for Zone 2<br />
127<br />
International <strong>Building</strong> & <strong>Infrastructure</strong> Technology Conference<br />
7-8 June 2011, Vistana Hotel, Penang, Malaysia<br />
In Figure 5, the gradation curve of FBAA sample clearly shows that the percentage passing are<br />
distributed more towards the lower limit <strong>and</strong> the percentage passing for 5 mm size is almost approach<br />
to the lower limits hence considered as coarser sample. However the FBAA sample was fully comply<br />
with overall limits as given in BS 882 (1992). Therefore the FBAA is suitable for general concrete<br />
application. Considering the additional limits for grading s<strong>and</strong>, the FBAA is also fully comply with the<br />
grading C <strong>and</strong> M except F as shown in Figure 6. Therefore the FBAA is applicable for heavy duty<br />
concrete floor finishes as stated in BS 882 (1992). It was clearly shows that the process of limiting the<br />
size of bottom ash to maximum of 5 mm is more applicable to mortar rather that concreting s<strong>and</strong>.<br />
Figure 5. Grading curve of FBAA for Overall zone
Figure 6. Grading curve of FBAA for C <strong>and</strong> M grading<br />
128<br />
International <strong>Building</strong> & <strong>Infrastructure</strong> Technology Conference<br />
7-8 June 2011, Vistana Hotel, Penang, Malaysia<br />
The results of sieve analysis of FBAA samples tabulated in Table 4 directly obtained the fineness<br />
modules of the FBAA. The fineness modulus is the summation of the cumulative percentage retained<br />
on the sieve st<strong>and</strong>ard series of 150, 300 <strong>and</strong> 600 µm, 1.18, 2.36, 5.0 mm up to the larges sieve size<br />
used. The calculated of fineness modulus of FBAA is 4.93 which are more than 3.5 <strong>and</strong> it is<br />
considered very coarse. The categorization given in BS 822:1992 based on percentage passing the<br />
600μm sieve which is 43.19%. Therefore, the bottom ash s<strong>and</strong> is considered as course to medium<br />
s<strong>and</strong> (Alex<strong>and</strong>er & Mindess, 2005).<br />
4. SPECIFIC GRAVITY AND WATER ABSORPTION<br />
Specific gravity of FBAA was determined by in-house method <strong>and</strong> results an average specific gravity<br />
is 1.84 while natural s<strong>and</strong> has higher specific gravity of 2.66. It was shows that the FBAA is 30%<br />
lighter than natural s<strong>and</strong> <strong>and</strong> may producing lighter concrete. However the FBAA has higher water<br />
absorption of 26.6% while natural s<strong>and</strong> is only 1.3%. Higher water absorption indicates that the bottom<br />
ash has high porosity. The pores at the surface particle of bottom ash affect the bond between the<br />
aggregate <strong>and</strong> cement paste <strong>and</strong> may reducing the strength of concrete. Besides that, FBAA has<br />
water absorption higher than 2-3%, therefore it may need to be treated as suspect <strong>and</strong> may influence<br />
to concrete performance such as higher dry shrinkage (Alex<strong>and</strong>er & Mindess, 2005).<br />
5. MECHANICAL PROPERTIES OF CONCRETE<br />
5.1 Mixtures <strong>and</strong> dosage<br />
Five types of concrete were produced with the substitution of FBAA by weight into natural s<strong>and</strong> in a<br />
various percentage of 60%, 70%, 80%, 90% <strong>and</strong> 100% <strong>and</strong> noted as M60, M70, M80, M90, <strong>and</strong> M100<br />
respectively. Control mix concrete using 100% natural s<strong>and</strong> was produced for comparing its relative<br />
strength. Material for control mix as follows:<br />
Free water = 210 kg/m 3<br />
Cement = 403.85 kg/m 3<br />
S<strong>and</strong> = 686.34 kg/m 3<br />
Gravel = 1119.81 kg/m 3<br />
The compositions of concrete <strong>and</strong> FBAA content as s<strong>and</strong> replacement are shown in Table 6.
Table 6. Mix detail of FBAA concrete<br />
129<br />
International <strong>Building</strong> & <strong>Infrastructure</strong> Technology Conference<br />
7-8 June 2011, Vistana Hotel, Penang, Malaysia<br />
Concrete Mix<br />
Cement<br />
(kg)<br />
FBAA<br />
(kg)<br />
Natural S<strong>and</strong><br />
(kg)<br />
Gravel<br />
(kg)<br />
Water<br />
(kg)<br />
Control mix 28.62 0 48.64 79.37 14.88<br />
M60 28.62 29.18 19.46 79.37 14.88<br />
M70 28.62 34.05 14.59 79.37 14.88<br />
M80 28.62 38.91 9.73 79.37 14.88<br />
M90 28.62 43.78 4.86 79.37 14.88<br />
M100 28.62 48.64 0 79.37 14.88<br />
5.2 Sample Preparation <strong>and</strong> Testing<br />
The study of FBAA as s<strong>and</strong> replacement involves mechanical properties analysis i.e. compressive<br />
strength evaluation. The compressive strengths were obtained for all concrete at 3, 7, 28, <strong>and</strong> 60 days<br />
of curing with three samples per age of testing to obtain the average value. St<strong>and</strong>ard cube specimen<br />
sizes of 150 mm x 150 mm x 150 mm were used in confirmative with BS 1881-108:1983. The sample<br />
were exposed to constant temperature (24 ± 2 ºC) <strong>and</strong> constant relative humidity (95 ± 5 ºC)<br />
environment inside curing tank until the tested ages. At 24 hours after the concrete casting, the<br />
moulds were removing <strong>and</strong> the samples were kept into the curing tank until tested day. The weights of<br />
samples were recorded to measure amount of water absorption by capillary <strong>and</strong> determining the mass<br />
difference during the time interval of 1 day to 28 days.<br />
6. FRESH CONCRETE TESTING<br />
6.1 Slump test<br />
Table 7. The value of slump <strong>and</strong> description of workability<br />
Concrete Mix Slump (cm) Description of workability<br />
Control Mix 6 cm Medium<br />
M60 2 cm Low<br />
M70 3 cm Low<br />
M80 5 cm Medium<br />
M90 8 cm High<br />
M100 10 cm High<br />
6.2 Compacting Factor test<br />
Table 8. The value of compacting factor <strong>and</strong> description of workability<br />
Concrete Mix Compacting factor (%) Description of Workability<br />
Control Mix 98.50% High<br />
M60 90.74% Medium<br />
M70 91.84% Medium<br />
M80 87.26% Low<br />
M90 88.45% Low<br />
M100 96.54% High
6.3 Slump flow test<br />
Table 9. The value of slump diameter<br />
130<br />
International <strong>Building</strong> & <strong>Infrastructure</strong> Technology Conference<br />
7-8 June 2011, Vistana Hotel, Penang, Malaysia<br />
Concrete Mix Slump diameter (cm)<br />
Control Mix 35cm x 33cm<br />
M60 35cm x 36cm<br />
M70 37cm x 38 cm<br />
M80 40cm x 43cm<br />
M90 42cm x 46cm<br />
M100 58cm x 57cm<br />
Table 7, 8 <strong>and</strong> 9 were explained the relation between five concrete mixes with the workability of the<br />
FBAA mixes. From the result in Table 7, show that the M100 <strong>and</strong> M90 gave high condition of<br />
workability when compare with control mix. This is because of the physical of FBAA show its porous<br />
<strong>and</strong> low density. While in compacting factor test, FBAA with 100% replacement also show the high<br />
workability. Besides that, compacting factor of M100 illustrate low surround of air void in mix <strong>and</strong><br />
achieve to meet control mix percentage. M80 show the high containing the air void in concrete around<br />
87%. Table 9 prove the M100 are high workability <strong>and</strong> more flowable compare with other percentage<br />
of replacement. High value of workability was not recorded high strength value.<br />
7. COMPRESSIVE STRENGTH OF FBAA CONCRETE<br />
The compressive strength of concrete mixes made with various percentage of FBAA as s<strong>and</strong><br />
replacement inclusive of control mix (fully natural s<strong>and</strong>) was determined at 3, 7, 28, <strong>and</strong> 60 days of<br />
curing. It can be seen that the compressive strength of concrete mixes of s<strong>and</strong> replacement is lower<br />
than control sample at all tested day. The summary test results for all concrete are provided in Table<br />
10 <strong>and</strong> presented in Figure 7. Generally, all concrete with FBAA replacement has decrease in strength<br />
until long term duration i.e. at 60 days. M100 results in increasing in compressive strength at 7 day;<br />
however the strength is not achieving the target of control mix. The used of FBAA has revealed lower<br />
strength concrete compared to control sample strength. From the Figure 7, show that all FBAA mixes<br />
far from the control mix average compressive strength. It was found that the compressive strength at<br />
day 3 for M60 <strong>and</strong> M80 is the highest compared to other FBAA concretes. Starting at 28 days, M80<br />
recorded the highest strength until age 60 days of 20.33N/mm 2 . For 3 days <strong>and</strong> 7 days, M60<br />
determined the highest strength compare with other FBAA mixes.<br />
Table 6. Compressive strength of concrete with FBAA<br />
Curing 3 Days 7 Days 28 Days 60 Days<br />
MIX Average Compressive strength (N/mm 2 )<br />
0% (control mix) 28.07 34.21 39.52 43.52<br />
M60 12.98 15.20 16.53 18.56<br />
M70 11.14 13.22 16.23 18.82<br />
M80 12.23 13.93 18.06 20.33<br />
M90 10.63 12.82 15.76 18.77<br />
M100 7.04 9.45 9.96 13.11
Figure 7. Behaviour of concrete strength with FBAA<br />
131<br />
International <strong>Building</strong> & <strong>Infrastructure</strong> Technology Conference<br />
7-8 June 2011, Vistana Hotel, Penang, Malaysia<br />
Therefore, it can be concluded that 80% of FBAA as s<strong>and</strong> replacement in concrete is the optimum<br />
amount in order to get favourable strength to producing concrete block. Other FBAA mixes recorded<br />
lower strength <strong>and</strong> lastly not suitable to use in concrete application.<br />
8. CONCLUSIONS<br />
The following conclusion may be drawn from this study:<br />
1. Sieve analysis conducted on FBAA from Electric Power Station, TNB Perak is more suitable<br />
used for mortar <strong>and</strong> brick masonry rather than concreting s<strong>and</strong> <strong>and</strong> concrete block.<br />
2. FBAA of 100% <strong>and</strong> 90% s<strong>and</strong> replacement by weight is not suitable for concrete because it has<br />
produced a lower strength concrete at the early ages which can results in ruptures during<br />
construction.<br />
3. 80% FBAA replacement is found to be the optimum amount in order to get a favourable strength<br />
<strong>and</strong> good strength development pattern over the increment ages.<br />
The following recommendation may be use in the future study:<br />
1. Change the mix design by using volume in calculation of FBAA amount in concrete.<br />
2. Study of the self-compacting concrete (SCC) by using FBAA. This is because the FBAA in<br />
porous condition <strong>and</strong> ready to meet requirement of workability <strong>and</strong> flowablity.<br />
REFERENCES<br />
ACAA (2006) (American Coal Ash Association) coal combustion product (CCP) production <strong>and</strong> use.<br />
Aurora, CO: American Coal Ash Association; 2007.<br />
Alex<strong>and</strong>er, M. & Mindess, S. (2005). Aggregates in concrete. Taylor & Francis.<br />
Bai Y., Darcy F. & Basheer P.A.M. (2005), ‘Strength <strong>and</strong> drying shrinkage properties of concrete<br />
containing furnace bottom ash as fine aggregate.’, Construction <strong>and</strong> <strong>Building</strong><br />
Materials 19. pp 691–697.<br />
Bai, Y., Ibrahim, R. & Basheer, M. (2010) Properties of lightweight concrete manufactured with fly ash,<br />
furnace bottom ash, <strong>and</strong> lytag. International workshop on sustainable development <strong>and</strong> concrete<br />
technology. Available online cptechcenter.org/publications/sustainable/bailightweight.pdf. accessed on<br />
April 12, 2010).<br />
BS 1881: Part 116: 1983. Testing concrete. Method for determination of compressive strength of<br />
concrete cubes.<br />
BS 1881-108:1983. Testing concrete. Method for making test cubes from fresh concrete
132<br />
International <strong>Building</strong> & <strong>Infrastructure</strong> Technology Conference<br />
7-8 June 2011, Vistana Hotel, Penang, Malaysia<br />
BS 410: 2000. Test sieves. Technical requirements <strong>and</strong> testing. Test sieves of metal wire cloth.<br />
BS 812-103.1: 1985. Testing aggregates. Method for determination of particle size distribution. Sieve<br />
tests.<br />
BS 882:1992. Specification for aggregates from natural sources for concrete<br />
D’Souza, R.G. & Shrihari, S. (2007). Disposal of Incinerator Ash by Adding to Concrete. Procedings of<br />
the International Conference on <strong>Sustainable</strong> Solid Waste Management. Sept, 5-7, Chennai, India. pp<br />
398-405.<br />
Ferraris, M., Salvo, M., Ventrella, A., Buzzi, L. & Veglia, M. (2009).’Use of Vitrified MSWI Bottom<br />
Ashes for Concrete Production’. Waste Management 29. pp 1041 – 1047.<br />
Ghafoori, N., Cai, Y., <strong>and</strong> Ahmadi, B. (1997), Use of dry bottom ash as a fine aggregate in roller<br />
compacted concrete, ACI Spec. Publ. (SP-171) pp 487– 507.<br />
Hjelmar, O., Holm, J., & Crillesen, K. (2006), ‘Utilisation of MSWI bottom ash as sub-base in road<br />
construction: First results from a large-scale test site’, Journal of Hazardous Materials. pp 10 – 20.<br />
Jaturapitakkul, C. & Cheerarot, R (2003). Development of Bottom Ash as Pozzolonic Material. Journal<br />
Material in Civil Engineering. 15(1), pp 48-53.<br />
Kasemchaisiri, R. <strong>and</strong> Tangtermsirikul, S. (2008),’ Properties of Self- Compacting Concrete in<br />
Corporating Bottom Ash as a Partial Replacement of Fine Aggregate.’ ScienceAsia 34. pp 87-95.<br />
Majizadeh, K., Bokowsk, G., El-Mitiny R. (1979).‘Material characteristics of power plant bottom ashes<br />
<strong>and</strong> their performance in bituminous mixtures: A laboratory investigation’. In: Proceedings of the fifth<br />
international ash utilization symposium. Morgantown, West Virginia: Department of Energy.<br />
NETL (National Energy Technology Laboratory). (2006). ‘Clean coal technology Coal utilization byproducts.<br />
Washington, DC: Department of Energy Office of Fossil Energy; Topical report no. 24.<br />
Phillips, B.L., Groppo, J. & Perrone, R. (2005). Evaluation of Processed Bottom Ash for Use as<br />
Lightweight Aggregate in the Production of Concrete Masonry Units. World of Coal Ash (WOCA), April,<br />
11-15, Lexington, Kentucky, U.S.A.<br />
Saikia, N., Cornelis, G., Mertens, G., Elsen, J., Van Balen, K., Van Gerven, T., V<strong>and</strong>ecasteele, C.<br />
(2008).’ Assessment of Pb-slag, MSWI bottom ash <strong>and</strong> boiler <strong>and</strong> fly ash for using as a fine aggregate<br />
in cement mortar.’ Journal of Hazardous Materials .Volume 154, Issue 1-3, pp 766-777.<br />
Siddique, R. (2003),’ Effect of fine aggregate replacement with Class F fly ash on the mechanical<br />
properties of concrete’. Cement <strong>and</strong> Concrete Research 33. pp 539–547.<br />
Steam (1978). Its generation <strong>and</strong> use. 39th ed. New York: Babcock & Wilcox.
T130<br />
133<br />
International <strong>Building</strong> & <strong>Infrastructure</strong> Technology Conference<br />
7-8 June 2011, Vistana Hotel, Penang, Malaysia<br />
STRENGTH AND PERMEABILITY OF FIBRE REINFORCED POOR FINES HIGH<br />
STRENGTH CONCRETE<br />
Kwan Wai 1 Hoe <strong>and</strong> Mahyuddin Ramli 2<br />
1, 2 University Sains Malaysia, Pulau Pinang, Malaysia<br />
1 kwanwaihoe@hotmail.com , 2 mahyudin@usm.my<br />
ABSTRACT: Fibre has remarkable effects in overcoming the brittleness of the high strength concrete<br />
(HSC) especially when silica fume is incorporated as partial cement replacement for high strength<br />
achievement. However, inconsistent <strong>and</strong> confusing of the past results diminish the confidence level of<br />
the user in the construction industry. The properties of the fibre <strong>and</strong> its sensitivity in the variations of<br />
contents towards its performance must be identified. This study explored the influences of newly<br />
engineered Barchip fibre (BF) in poor fines HSC, for three important parameters, which are<br />
permeability, compressive <strong>and</strong> flexural strength. In addition, the performance was also compared with<br />
HSC reinforced by coconut fibre (CF) <strong>and</strong> glass fibre (GF). Statistical analysis (Boxplot <strong>and</strong> line plot of<br />
mean) was employed to study the achievements of the specimens <strong>and</strong> indentified the sensitivity in<br />
variations of fibre content. Fibre has significantly increased the flexural strength of HSC than<br />
compressive strength. However, the permeability of HSC was affected by incorporation by short<br />
discrete fibres. The BF specimen has achieved the highest compressive <strong>and</strong> flexure strength, while<br />
intrinsic permeability was as good as GF specimens, slightly higher than normal. CF series were not<br />
sensitive in variations of fibre content in compressive strength parameter. The same situation<br />
happened to BF <strong>and</strong> GF in permeability parameter. In short, BF was appeared to be the best choice to<br />
incorporate into HSC for better performance.<br />
Key words: high strength concrete (HSC), poor fines, barchip fibres, coconut fibres, glass<br />
fibres, permeability, boxplot, line plot of mean<br />
1. INTRODUCTION<br />
Fibre Reinforced Concrete (FRC) is the concrete mixed in the conventional way which containing short<br />
discrete <strong>and</strong> r<strong>and</strong>omly distributed in the mixture. Typically, these fibres have a well-known effect in<br />
improving structural performance <strong>and</strong> integrity, increasing ductility, shear strength, energy absorption<br />
capacity <strong>and</strong> damage tolerance in flexural <strong>and</strong> shear-critical members under reversed cyclic loading.<br />
(Parra-Montesinos, 2005) (Ko¨ksal, Altun, Yig˘it, & Sahin, 2008). A study by Ramli <strong>and</strong> Dawood also<br />
came out with the same conclusions as other researcher whereby both fibre <strong>and</strong> hybrid fibre system<br />
has brought encouraging effects to the performance of concrete. (Ramli & Dawood, 2010; Dawood &<br />
Ramli, 2010) Apart of the numerable advantages has brought by fibres, there is also some risk to<br />
introduce fibres into concrete. The universal finding was that the workablilty of fresh concrete greatly<br />
affected by incorporation of fibres. (ACI Committee 309, 2008). Especially when high volume of fibre<br />
has been mixed into the concrete, the significant level of reducing effects in workability has<br />
substantially increased the risk of air entrapped in the concrete <strong>and</strong> hence affecting its rigidity <strong>and</strong><br />
followed by durability. (Tatnall, 2006). However, each types of fibre <strong>and</strong> its composition gives different<br />
effects to the performance of FRC. Besides that, even though there are tons of researches have been<br />
done in this field, but the data recorded were inconsistent <strong>and</strong> therefore diminishing the confidence of<br />
potential user in the construction industry. For instance, the influence of fibre on permeability remains<br />
as the most arguable parameter. A study by Toutanji, McNeil, <strong>and</strong> Bayasi (1998) concluded that<br />
polypropelyne fibre resulted increases in permeability of conventional concrete. However, Bhargava<br />
(2006) found that fibres showed positive effects in controlling permeability of FRC. Under both<br />
stressed <strong>and</strong> unstressed conditions, the FRC showed the similar behaviour in reducing the<br />
permeability of concrete. The increase dosage of fibre in FRC can also improve the durability of<br />
concrete as well. In this study, the idea is to explore on the influences newly engineered fibre (Barchip<br />
fibre) on the strength <strong>and</strong> permeability properties of poor fine high strength concrete (HSC) <strong>and</strong> also<br />
compare its performance with the well studied fibre which is coconut fibre <strong>and</strong> glass fibre.
2. MATERIALS<br />
134<br />
International <strong>Building</strong> & <strong>Infrastructure</strong> Technology Conference<br />
7-8 June 2011, Vistana Hotel, Penang, Malaysia<br />
Type I Portl<strong>and</strong> cement <strong>and</strong> condensed silica fume used as partial replacement to the binder content<br />
during the experiment. The chemical compositions of both cementations materials were showed in<br />
Table 1. River s<strong>and</strong> with specific gravity 2.51 <strong>and</strong> fineness modulus 3.98 used as fine aggregate. The<br />
undersize particles (below 600 micron) were eliminated. Crushed granite with specific gravity 2.7 <strong>and</strong><br />
nominal size 19 mm used as coarse aggregate. Conplast SP 1000, a chloride free super plasticizing<br />
admixture based on sulphonated naphthalene polymers which complying BS 5075 used to established<br />
a workable fibre reinforced high strength concrete. Coconut fiber, Barchip fiber <strong>and</strong> Glass fiber with<br />
specifications are shown in Table 2 to Table 4 respectively. Mixture proportions of all thirteen mixes<br />
was showed Table 5.<br />
Table 1. Chemical composition of ordinary Portl<strong>and</strong> cement <strong>and</strong> Silica fume<br />
Percentage by weight<br />
------------------------------------------------<br />
Constituent Ordinary portl<strong>and</strong> cement Silica fume<br />
Lime (CaO) 64.64 1.0% (max)<br />
Silica (SiO2) 21.28 90% (max)<br />
Alumina (Al2O3) 5.60 1.2 % (max)<br />
Iron Oxide (Fe2O3) 3.36 2.0% (max)<br />
Magnesia (MgO) 2.06 0.6% (max)<br />
Sulphur trioxode (SO3) 2.14 0.5% (max)<br />
N2O 0.05 0.8% (max)<br />
Loss of ignition 0.64 6% (max)<br />
Lime saturation factor 0.92 -<br />
C3S 52.82 -<br />
C2S 21.45 -<br />
C3A 9.16 -<br />
C4AF 10.20 -<br />
Table 2. Specifications of coconut fibre<br />
Item Unit Test value<br />
Diameter mm 0.32<br />
Length mm 20-30<br />
Tensile strength mpa 176<br />
Elastic modulus GPa 22.4<br />
Specific gravity - 1.13<br />
Table 3. Specifications of Barchip fibre provided by Elastro Plastic Concrete Inc<br />
Characteristic Unit Material property<br />
Base resin - Modified Olefin<br />
Length mm 24±2<br />
Tensile strength MPa 640<br />
Surface texture - Continuously embossed<br />
No. fibers per kg Nos 37, 000<br />
Specific gravity - 0.95<br />
Young’s modulus GPa 10<br />
Melting point °C 159-179<br />
Ignition point °C >450
135<br />
International <strong>Building</strong> & <strong>Infrastructure</strong> Technology Conference<br />
7-8 June 2011, Vistana Hotel, Penang, Malaysia<br />
Table 4. Specifications of alkaline resistance glass fibre provided by Berjaya Bintang Timur (M) Sdn.<br />
Bhd<br />
Item Unit St<strong>and</strong>ard Test value<br />
Diameter �m 15.0+2.3 15.70<br />
Length mm 24+1.5 24.40<br />
Moisture content % < 0.2 0.18<br />
Combustible matter content % 1.9÷0.3 1.83<br />
Elastic modulus GPa 71.7-80.0 72.00<br />
Specific gravity - 2.6-2.8 2.70<br />
ZrO² % 16.8+0.5/0.3 16.57<br />
TiO² % 5.5+0.5 5.45<br />
Index<br />
Normal<br />
0.6BF<br />
1.2BF<br />
1.8BF<br />
2.4BF<br />
0.6CF<br />
1.2CF<br />
1.8CF<br />
2.4CF<br />
0.6GF<br />
1.2GF<br />
1.8GF<br />
2.4GF<br />
Cement<br />
(kg/m3)<br />
435.6<br />
435.6<br />
435.6<br />
435.6<br />
435.6<br />
435.6<br />
435.6<br />
435.6<br />
435.6<br />
435.6<br />
435.6<br />
435.6<br />
435.6<br />
Silica fume<br />
(kg/m3)<br />
59.4<br />
59.4<br />
59.4<br />
59.4<br />
59.4<br />
59.4<br />
59.4<br />
59.4<br />
59.4<br />
59.4<br />
59.4<br />
59.4<br />
59.4<br />
3. EXPERIMENTAL PROGRAM<br />
Table 5. Mixture proportions of control mix<br />
Water<br />
(kg/m3)<br />
183<br />
183<br />
183<br />
183<br />
183<br />
183<br />
183<br />
183<br />
183<br />
183<br />
183<br />
183<br />
183<br />
SP<br />
(kg/m3)<br />
9.9<br />
9.9<br />
9.9<br />
9.9<br />
9.9<br />
9.9<br />
9.9<br />
9.9<br />
9.9<br />
9.9<br />
9.9<br />
9.9<br />
9.9<br />
S<strong>and</strong><br />
(kg/m3)<br />
689<br />
689<br />
689<br />
689<br />
689<br />
689<br />
689<br />
689<br />
689<br />
689<br />
689<br />
689<br />
689<br />
Coarse<br />
aggregate<br />
(kg/m3)<br />
1033<br />
1033<br />
1033<br />
1033<br />
1033<br />
1033<br />
1033<br />
1033<br />
1033<br />
1033<br />
1033<br />
1033<br />
1033<br />
Fibre by binder<br />
volume<br />
Thirteen mixes were prepared with the mixture compositions as shown in Table 5. The fresh<br />
specimens were kept in the room conditions ± 20 °C <strong>and</strong> relative humidity at ±65%. Then, the<br />
specimens were demoulded after 24 hours <strong>and</strong> subjected to water curing at temperature 23±2°C until<br />
the age of testing. For each kind of specimens, three 100 x 100 x 100 mm cubes <strong>and</strong> 100 x 100 x 500<br />
mm prisms were prepared for compressive <strong>and</strong> flexural strength test. Both tests were implemented in<br />
accordance to BS EN 12390-3:2009 <strong>and</strong> BS EN 12390-5:2009 respectively. The permeability test was<br />
achieved by the samples cored from prisms right after flexural strength test, using Leeds cell<br />
permeameter. The procedures are as follows (Cabrera & Lynsdale, 1988):-<br />
� Six cylinders with dimension of 45 mm Ø x 40 mm were cored from three different prisms of<br />
each mixes <strong>and</strong> put into ventilated oven at temperature 105 ± 5 °C for 72 ± 2 hours. All<br />
cylinders were then kept in desiccators for another 24 ± 2 hours.<br />
� The cylinder was took out from desiccators <strong>and</strong> housed in the silicone rubber located inside a<br />
stainless steel ring cylinder. Then, it capped tightly with a stainless steel cap. Any leakage was<br />
strictly prohibited in order to force the nitrogen gas travel through the sample in uniaxial<br />
direction only.<br />
� The system was left for 15 minutes to achieve steady state prior to data recording.<br />
� Travel period of the bubble in the flow meter was recorded at five consecutive points, each at<br />
10 cm distance. These data was used to calculate the flow rate.<br />
� The intrinsic permeability was determined by the expression below:-<br />
(1)<br />
(%)<br />
0.0<br />
0.6<br />
1.2<br />
1.8<br />
2.4<br />
0.6<br />
1.2<br />
1.8<br />
2.4<br />
0.6<br />
1.2<br />
1.8<br />
2.4
136<br />
International <strong>Building</strong> & <strong>Infrastructure</strong> Technology Conference<br />
7-8 June 2011, Vistana Hotel, Penang, Malaysia<br />
Where,<br />
K is intrinsic permeability, m 2<br />
P1 is absolute applied pressure bars [pressure used + atmosphere pressure] usually 2 bars<br />
P2<br />
A<br />
is pressure at which the flow rate is measured [atmosphere pressure] usually 1 bar<br />
is cross section areas of specimen, m 2<br />
L is thickness of specimen, m<br />
V is the flow rate, cm 3 / sec<br />
Followed by the testing, the experimental results were interpreted in Boxplot summarize the<br />
distributions of the samples <strong>and</strong> variability <strong>and</strong> line of mean plot to illustrate the mean score of the<br />
samples. Below is the structure of boxplot (Minitab Inc., 2007):-<br />
*<br />
4. RESULTS AND DISCUSSIONS<br />
Compressive Strength (MPa)<br />
80<br />
70<br />
60<br />
50<br />
Outliers (*) – Extreme values that is beyond the upper <strong>and</strong> lower whisker<br />
Upper whisker - Extends to the maximum data point within 1.5 box<br />
heights from the third quartile line<br />
Third quartile – 75% of the data are less than or equal to this value<br />
Median – 50% of the data are less than or equal to this value<br />
First quartile – 25% of the data are less than or equal to this value<br />
Lower whisker - Extends to the minimum data point within 1.5 box<br />
heights from the first quartile line<br />
Boxplot of Compressive Strength of Different Type of Fibre<br />
40<br />
7 Days 28 Days 7 Days 28 Days 7 Days 28 Days 7 Days 28 Days<br />
Mix BF<br />
CF<br />
GF<br />
Normal<br />
Mix<br />
BF<br />
CF<br />
GF<br />
Normal<br />
Figure 1. Boxplot of compressive strength of different type of fibre at 7 <strong>and</strong> 28 days<br />
In a single boxplot, it consisted of fibres at four different contents, which were 0.6%, 1.2%, 1.8% <strong>and</strong><br />
2.4% while the two respective boxplots at two different ages (7 <strong>and</strong> 28 days) were connected by the<br />
mean line. From this statistical interpretation, the HSC reinforced by BF <strong>and</strong> CF have obtained higher
137<br />
International <strong>Building</strong> & <strong>Infrastructure</strong> Technology Conference<br />
7-8 June 2011, Vistana Hotel, Penang, Malaysia<br />
compressive strength than the plain HSC at both ages. Except for specimens with GF, they obtained<br />
lower average strength compared to normal HSC at 28 days. This was because the GF specimens<br />
were only showed enhancement in strength at high fibre content, i.e. 2.4% of fibre. It was clearly<br />
understood from line plot of mean at different fibre content which presented in the following section. In<br />
BF series specimens, there was two outliers were found in the boxplot at 28 days. The highest outlier<br />
was represented the compressive strength result of the cube at 1.8% of BF content, obtained 83.2<br />
MPa. While for the CF series specimens, the outlier was showed by the cube at 0.6% of CF content,<br />
obtained 79.7 MPa. The dispersion of compressive strength at different fibre content could be<br />
understood by the length of the boxplot. Therefore, it could be concluded that the CF series<br />
specimens have the least sensitivity in varying the fibre content towards the achievement of<br />
compressive strength at 28 days, followed by BF series <strong>and</strong> GF series specimens.<br />
Compressive Strength (MPa)<br />
80<br />
75<br />
70<br />
65<br />
60<br />
0.0<br />
Line Plot of Mean for Compressive Strengths at 28 Days<br />
0.6<br />
1.2<br />
Fiber Content (% )<br />
1.8<br />
2.4<br />
71.97<br />
Mix<br />
BF<br />
CF<br />
GF<br />
Normal<br />
Figure 2. Line plot of mean for compressive strength of various series of specimens at respective fibre<br />
content at 28 days<br />
As subsequence from the data interpretation <strong>and</strong> discussions above, Figure 2 showed the mean<br />
compressive strengths attained by HSC specimens reinforced by three different types of fibres with<br />
different content at 28 days. Plain HSC had showed compressive strength of 71.97 MPa, plotted as<br />
reference line for comparisons. The highest average compressive strength of 79.07 MPa was<br />
registered by HSC reinforced by 1.8% of Barchip fibre. The high quality of the fibre with very high<br />
tensile strength (640 MPa) enhanced the toughness of the concrete matrix. In addition, the fibre was<br />
also designed specifically to have contour surface in order to optimize the reinforcing effects in the<br />
concrete matrices. The CF series showed improvement in compressive strength in all level of fibre<br />
content. However, it was in a decreasing trend when the fibre content increases. This was<br />
contradicted with GF series specimens. Although compressive strength decreases from 0.6GF to<br />
1.2GF, however it showed an increasing trend as the fibre content increases. Short discrete fibres are<br />
very effective in arresting cracks. They would reduce the formation <strong>and</strong> propagations of cracks under<br />
axial loading as well as plastic shrinkage during hydration process. The properties of the fibres such<br />
as embossed treatment to have contour surface <strong>and</strong> high tensile strength as in Barchip fibre <strong>and</strong> high<br />
specific area of reinforcing posses by monofilament glass fibre, rough surface on the tough coconut<br />
fibre govern the bonding forces at the interfacial zone between fibre <strong>and</strong> concrete matrices <strong>and</strong> the<br />
bridging effects across the cracks during loading stage. All of this resulted higher efficiency of load<br />
transfer within the microstructure under loading <strong>and</strong> therefore contribute to the enhancements of<br />
strength achievement as proven by the results. (Sivakumar & Snathanam, 2007; Topcu <strong>and</strong> Canbaz,<br />
2007; Br<strong>and</strong>t, 2008).
Flexural Strength (MPa)<br />
7.0<br />
6.5<br />
6.0<br />
5.5<br />
5.0<br />
4.5<br />
4.0<br />
Boxplot of Flexural Strength of Different Type of Fibre<br />
7 Days 28 Days 7 Days 28 Days 7 Days 28 Days 7 Days 28 Days<br />
Mix BF<br />
CF<br />
GF<br />
Normal<br />
138<br />
International <strong>Building</strong> & <strong>Infrastructure</strong> Technology Conference<br />
7-8 June 2011, Vistana Hotel, Penang, Malaysia<br />
Mix<br />
BF<br />
CF<br />
GF<br />
Normal<br />
Figure 3. Boxplot of flexural strength of different type of fibre at 7 <strong>and</strong> 28 days<br />
Figure 3 presented that the HSC containing fibres exhibited higher flexural strength compared to that<br />
of plain HSC. Both BF series <strong>and</strong> GF series showed comparable results in flexural strength, but still<br />
the BF series attained higher mean flexural strength. In addition, the specimens from both series had<br />
already attained higher flexural strength in 7 days than normal HSC at the age of 28 days. The<br />
dispersion of the boxplot showed GF series has less sensitivity in the variation of fibre content after<br />
received water curing of 28 days. The statistical results of CF series indicated that coconut fibre seem<br />
did not help much in enhancing the flexural strength of HSC. However, since they were relatively<br />
sensitive in the variation of fibre content with respect to flexural strength, therefore the judgement of<br />
the degree of influencing have to refer to the following figure. This is because there was still a<br />
marginally improve in flexural strength at optimum fibre content.<br />
Flexural Strength (MPa)<br />
6.5<br />
6.0<br />
5.5<br />
5.0<br />
0.0<br />
Line Plot of Mean for Flexural Strength at 28 Days<br />
0.6<br />
1.2<br />
Fiber Content (% )<br />
1.8<br />
2.4<br />
5.209<br />
Mix<br />
BF<br />
CF<br />
GF<br />
Normal<br />
Figure 4. Line plot of mean for flexural strength of various series of specimens at respective fibre<br />
content at 28 days<br />
The normal specimen attained mean flexural strength of 5.209 MPa was plotted as reference line for<br />
comparison purpose. Except the 1.2CF specimens, all other specimens have obtained higher flexural<br />
strength than normal. Among them, BF series has the highest capability in this way, up to 1.8% of<br />
fibre, after that the performance was decrease drastically. GF series showed an increasing trend
139<br />
International <strong>Building</strong> & <strong>Infrastructure</strong> Technology Conference<br />
7-8 June 2011, Vistana Hotel, Penang, Malaysia<br />
towards the high fibre content. On the contrary, the CF series showed the results in the other way<br />
round. The flexural strength was decreases as the fibre content increases. It was also found that there<br />
is a sharp drop to below reference line at 1.2% of fibre content. Fibre has very negative effects in<br />
altering rheological behaviour of fresh mix. The frictions exist between fibres <strong>and</strong> paste increase the<br />
cohesiveness of the mix <strong>and</strong> therefore result an unworkable mix. (Tatnall, 2006) In this situation, the<br />
uniformity of the mix was affected <strong>and</strong> zone of weakness might probably formed, which resulted lower<br />
flexural strength. However, the reinforcing effects arise from the fibre is far greater than this. The<br />
reinforcing mechanisms could be elaborated in this way. When the specimens subjected to flexure<br />
load, cracking would initially happened at the weak zone <strong>and</strong> the bridging effects of the fibres across<br />
the cracks starts working to slow down the crack propagation process. If the fibre is low in tensile<br />
strength (coconut fibre <strong>and</strong> glass fibre), the fibre would ruptured <strong>and</strong> lead to ultimate failure of the<br />
specimens. While in BF series specimens, fibre was being pull-out instead of ruptured due to its high<br />
tensile strength properties. During the pull-out process, mechanical effects of the fibre also play an<br />
important role. The good bonding between the Barchip fibres <strong>and</strong> concrete matrices created large<br />
frictions when they were being pulled-out <strong>and</strong> hence further increased the peak load. Therefore, BF<br />
series could attain the highest flexural strength among other series specimens. (Reis, 2006;<br />
Hamoush, Abu-Lebdeh, Cummins <strong>and</strong> Brian Zornig, 2010).<br />
Intrinsic Permeability, K (x 10^-16 m^2)<br />
4<br />
3<br />
2<br />
1<br />
Boxplot of Intrinsic Permeability of Different Type of Fibre<br />
0<br />
7 Days 28 Days 7 Days 28 Days 7 Days 28 Days 7 Days 28 Days<br />
Mix BF<br />
CF<br />
GF<br />
Normal<br />
Mix<br />
BF<br />
CF<br />
GF<br />
Normal<br />
Figure 5. Boxplot of intrinsic permeability of different type of fibre at 7 <strong>and</strong> 28 days<br />
The results presented in Figure 5 illustrated that all of the fibre reinforced specimens attained higher<br />
permeability at both 7 <strong>and</strong> 28 days. The result obtained by BF series <strong>and</strong> GF series was comparable,<br />
<strong>and</strong> shared the similar profile with normal specimens where the intrinsic permeability was decreases<br />
over the age. This is because the micro structure of the concrete was refined by the calcium silicate<br />
hydrate (C-S-H) formed during the hydration process <strong>and</strong> the reaction between silica fume <strong>and</strong><br />
calcium hydroxide. (Caldarone, 2009). However, CF series specimens displayed the performance in<br />
opposite way. The intrinsic permeability increases over the age. In order for this situation to be<br />
happened, it was believed that the coconut fibre was degraded in the concrete as coconut fibres are<br />
alkaline sensitive. The fibres would complete lost its strength when immersed in alkaline solutions for<br />
300 days. Furthermore, the migration of hydration products especially calcium hydroxide from matrix<br />
to fibres would induce microcracks around the fibres <strong>and</strong> caused fibre embrittlement. (Filhoa,<br />
Scrivenerb, Engl<strong>and</strong>c, & Ghavami, 2000). All of these was happened over the age <strong>and</strong> increased the<br />
chances for gas molecules to pass through the concrete specimens. Besides, coconut fibre has a<br />
porous cellular structure. The nitrogen gas was also believed to be passed through the fibre itself<br />
during the testing. Hence, the intrinsic permeability of CF series was relatively high compared to other<br />
specimens. Permeability of coconut fibre reinforced HSC was also sensitive in variation of fibre<br />
content.
Intrinsic Permeability, K (x 10 ^-16 m^2)<br />
4<br />
3<br />
2<br />
1<br />
0<br />
0.0<br />
Line Plot of Mean for Intrinsic Permeability at 28 Days<br />
0.6<br />
1.2<br />
Fibre Content (% )<br />
140<br />
International <strong>Building</strong> & <strong>Infrastructure</strong> Technology Conference<br />
7-8 June 2011, Vistana Hotel, Penang, Malaysia<br />
1.8<br />
2.4<br />
0.311<br />
Mix<br />
BF<br />
CF<br />
GF<br />
Normal<br />
Figure 6. Line plot of mean for intrinsic permeability of various series of specimens at respective fibre<br />
content at 28 days<br />
As consequence to the above elaborations, the line plot of mean for CF series showed that the<br />
permeability of CF specimens increases drastically as the fibre content increases. BF series <strong>and</strong> GF<br />
series displayed a quite consistent result. Variation of fibre content did not result significant changes in<br />
permeability properties of the concrete. The BF series was even showed a slightly decreasing trend on<br />
permeability as the fibre content increases. Nevertheless, all of the curves was still been plotted above<br />
the reference line which represented the intrinsic permeability of normal specimen. This implied that<br />
the permeability of fibre concrete is higher compared to plain concrete. This was partly due to the fibre<br />
has high potential than conventional concrete in entrapping excessive air content into the mixes as<br />
fibre may arise difficulties which would cause incomplete consolidation. (Tatnall, 2006).<br />
5. CONCLUSIONS<br />
From this study, several findings <strong>and</strong> key results are summarized as follows:<br />
� Barchip fibre is the best among the fibres that have been studied in this research. It registered<br />
the highest compressive <strong>and</strong> flexural strength for the fibre reinforced HSC <strong>and</strong> showed<br />
consistency in permeability properties which is comparable to that of plain HSC.<br />
� Glass fibre is sensitive in changing of contents when the specimens examined for the<br />
compressive strength performance.<br />
� Coconut fibre has the worse effect in affecting durability properties of HSC.<br />
ACKNOWLEDGEMENT<br />
The authors would like to thank to Universiti Sains Malaysia providing fellowship <strong>and</strong> grant <strong>USM</strong>-RU-<br />
PGRS Grant No. 1001/PPBGN/843058 as financial support for this research work.<br />
REFERENCE<br />
ACI Committee 309, 2008. Behaviour of Fresh Concrete During Vibration (ACI 309.1R). Farmington<br />
Hills, MI: American Concrete Institute, pp: 1-18 ISBN: 978-0-87031-296-0<br />
Bhargava, A. (2006). Permeability of fiber reinforced concrete under stress. The University of British<br />
Colombia.<br />
Br<strong>and</strong>t, A. M. (2008). Fibre reinforced cement-based (FRC) composites after over 40 years of<br />
development in building <strong>and</strong> civil engineering. Composite Structures , 86 (1-3), 3-9.<br />
Cabrera, G., & Lynsdale, C. (1988). A new gas permeameter for measuring the permeability of mortar<br />
<strong>and</strong> concrete. Magazibe Concrete Research , 40 (144), 177-182.
141<br />
International <strong>Building</strong> & <strong>Infrastructure</strong> Technology Conference<br />
7-8 June 2011, Vistana Hotel, Penang, Malaysia<br />
Caldarone, M. A. (2009). High-Strength Concrete A practicval guide (First ed.). US & Canada: Taylor<br />
& Francis.<br />
Dawood, E. T., & Ramli, M. (2010). Development of high strength flowable mortar with hybrid fiber.<br />
Journal of Construction <strong>and</strong> <strong>Building</strong> Materials , 24 (6), 1043-1050.<br />
Filhoa, R. D., Scrivenerb, K., Engl<strong>and</strong>c, G. L., & Ghavami, K. (2000). Durability of alkali-sensitive sisal<br />
<strong>and</strong> coconut fibres in cement mortar composites. Cement <strong>and</strong> Concrete Composites , 22 (2), 127-143.<br />
Ko¨ksal, F., Altun, F., Yig˘it, I., & Sahin, Y. (2008). Combined effect of silica fume <strong>and</strong> steel fiber on the<br />
mechanical properties of high strength concretes. Construction <strong>and</strong> <strong>Building</strong> Materials , 22, 1874-<br />
1880.<br />
Minitab Inc. (2007). Boxplot. Meet Minitab 15. HYPERLINK "http://www.minitab.com/"<br />
www.minitab.com<br />
Parra-Montesinos, G. J. (2005). High-Performance Fiber-Reinforced Cement Composites:An<br />
Alternative for Seismic Design of Structures. ACI Structural Journal , 668-675.<br />
Ramli, M., & Dawood, E. T. (2010). Effects of palm fiber on the mechanical properties of lightweight<br />
concrete crushed brick. America Journal of Engineering <strong>and</strong> Applied Science , 489-493.<br />
Reis, J. M. (2006). Fracture <strong>and</strong> flexural characterization of natural fiber-reinforced polymer concrete.<br />
Construction <strong>and</strong> <strong>Building</strong> Materials , 20 (9), 673-678.<br />
Tatnall, P. C. (2006). Fiber-Reinforced Concrete. In J. Lamond, & J. Pielert, Significance of Tests <strong>and</strong><br />
Properties of Concrete & Concrete-Making Materials (pp. 578-594). USA: ASTM International.<br />
Topçu, İ. B., & Canbaz, M. (2007). Effect of different fibers on the mechanical properties of concrete<br />
containing fly ash. Constructions <strong>and</strong> <strong>Building</strong> Materrials , 21 (7), 1486-1491.<br />
Toutanji, H., McNeil, S., & Bayasi, Z. (1998). Chloride permeability <strong>and</strong> impact resistance of<br />
polypropylene-fiber-reinforced silica fume concrete. Cement <strong>and</strong> Concrete Research , 28 (7), 961-968.<br />
Sameer Hamoush, Taher Abu-Lebdeh, Toney Cummins <strong>and</strong> Brian Zornig, 2010. Pullout<br />
Characterizations of Various Steel Fibers Embedded in Very High-Strength Concrete. American<br />
Journal of Engineering <strong>and</strong> Applied Sciences, 3: 418-426. DOI: 10.3844/ajeassp.2010.418.426.
T132<br />
142<br />
International <strong>Building</strong> & <strong>Infrastructure</strong> Technology Conference<br />
7-8 June 2011, Vistana Hotel, Penang, Malaysia<br />
CHARACTERISATION OF HIGH CALCIUM WOOD ASH FOR USE AS MINERAL<br />
ADMIXTURE IN CONCRETE<br />
Cheah Chee Ban 1 <strong>and</strong> Mahyuddin Ramli 2<br />
1,2 Universiti Sains Malaysia, Pulau Pinang, Malaysia<br />
1 volrath15@hotmail.com, 2 mahyudin@usm.my<br />
ABSTRACT: Throughout the laboratory investigation, potential use of High Calcium Wood Ash<br />
(HCWA) as partial cement replacement material in production of mortar was investigated. Chemical<br />
composition <strong>and</strong> phases of HCWA were evaluated using X-Ray Fluorescence (XRF) <strong>and</strong> X-Ray<br />
Diffraction (XRD) analytical methods respectively. Physical properties of HCWA namely particle size<br />
distribution, average particle size d50 <strong>and</strong> specific surface area were assessed by laser particle size<br />
analyzer. In addition, mechanical strength of structural grade mortar mixtures produced by partial<br />
replacement of cement using HCWA were investigated as an assessment of the suitability of HCWA<br />
as supplementary binder in concrete. A total of 6 mortar mixtures including control mortar (containing<br />
only neat cement as binder) <strong>and</strong> HCWA mixtures with varying level of cement replacement using<br />
HCWA were produced. For the HCWA mortar, HCWA was used at partial cement replacement level of<br />
5, 10, 15, 20 <strong>and</strong> 25% by total binder weight. Water to binder ratio was held constant at 0.35 for all<br />
mortar mixtures to maintain desired strength level. Results indicated that the use of HCWA as partial<br />
cement replacement did not have significant adverse effect on workability of fresh mortar. Mortar<br />
mixture with 15% HCWA exhibited higher compressive strength relative to control mortar at the age of<br />
91days. Enhanced flexure strength was observed for mortar mixture with HCWA content of 5% <strong>and</strong><br />
10% at the same age.<br />
Keywords: cement replacement material, chemical composition, wood biomass ash, recycling,<br />
workability, mechanical strength, cement mortar.<br />
1. INTRODUCTION<br />
The incorporation of wood ash as partial cement replacement material in concrete reduces<br />
requirement of hydraulic cement in production of concrete [9]. As the production of cement requires<br />
both raw material (Limestone) <strong>and</strong> energy intensive coupled with massive emission of green house<br />
gasses, the reduction in consumption of cement in the manufacturing of concrete is beneficial towards<br />
environmental conservation. Besides, the use of wood ash as partial cement replacement material in<br />
production of concrete material will also contribute towards reduction in construction cost hence the<br />
cost of houses to a level which is affordable to a large segment of the population especially in the<br />
developing countries (Udoeyo, Inyang et al. 2006).<br />
Therefore, in recent years, several researchers (Elinwa <strong>and</strong> Mahmood 2002; Elinwa <strong>and</strong> Ejeh 2004;<br />
Elinwa, Ejeh et al. 2005; Abdullahi 2006; Udoeyo, Inyang et al. 2006; Elinwa, Ejeh et al. 2008;<br />
Rajamma, Ball et al. 2009) have investigated mechanical <strong>and</strong> durability properties of structural<br />
concrete <strong>and</strong> mortar produced by the incorporation of wood ash as partial cement replacement.<br />
Results of the studies indicated that inclusion of high silica wood biomass ash as partial cement<br />
replacement in structural concrete <strong>and</strong> mortar up to 20% by total binder weight produces concrete <strong>and</strong><br />
mortar with acceptable mechanical strength <strong>and</strong> durability performance.<br />
Some researchers (Elinwa <strong>and</strong> Mahmood 2002; Udoeyo <strong>and</strong> Dashibil 2002; Elinwa <strong>and</strong> Ejeh 2004)<br />
detected significant amount of silica in wood ash can be used as pozzolanic additive in concrete.<br />
Elinwa <strong>and</strong> Ejeh (2004) evaluated the pozzolanicity of high silica wood ash <strong>and</strong> concluded that the ash<br />
is highly pozzolanic with pozzolanic activity index (PAI) of 75.9% which exceed the minimum of 70%<br />
specified in ASTM St<strong>and</strong>ard C618 (ASTM 2003) for Class N fly ash.<br />
There have been a significant amount of studies on the use of high silica wood ash as pozzolan in<br />
concrete <strong>and</strong> mortar. However, there were few research performed to investigate the properties of
143<br />
International <strong>Building</strong> & <strong>Infrastructure</strong> Technology Conference<br />
7-8 June 2011, Vistana Hotel, Penang, Malaysia<br />
concrete or mortar containing high calcium wood biomass ash as partial cement replacement. As<br />
wood biomass ash is generally rich in calcium oxide content (Vassilev, Baxter et al. 2010), this<br />
necessitate research studies to be performed to assess mechanical <strong>and</strong> durability performance of<br />
concrete <strong>and</strong> mortar containing woody biomass ash with high calcium oxide content. Such studies are<br />
important to determine the viability of high calcium wood biomass ash inclusion as partial cement<br />
replacement in the production of structural concrete <strong>and</strong> mortar for application in the construction<br />
industry. The presence of laboratory data on the use of high lime wood biomass ash (which<br />
constitutes a large portion of wood biomass ash generated) as constituent material in concrete will<br />
enable widespread application of the ash material in the production of cement based material <strong>and</strong><br />
concrete.<br />
The present work aims to study the characteristics of high calcium wood ash (HCWA) <strong>and</strong> properties<br />
of mortar produced by partial replacement of cement binder by high calcium wood ash. Specific<br />
objectives of research were: (1) to characterize HCWA in terms of chemical composition <strong>and</strong><br />
mineralogical phases of chemical compound of the ash. (2) to study compressive strength of mortar<br />
containing HCWA at various level of cement replacement.<br />
2. METHODOLOGY<br />
2.1. MATERIALS<br />
a. Cement<br />
ASTM Type I Portl<strong>and</strong> cement (PC) with median particle size of 3.9µm, specific surface area of<br />
1.0432m 2 /g <strong>and</strong> specific gravity of 3.02 were used in this study. Both physical <strong>and</strong> chemical properties<br />
of cement used comply with specifications in ASTM St<strong>and</strong>ard C150 (ASTM 1997). The chemical<br />
composition of PC used is presented in Table 1.<br />
b. High Calcium Wood Ash (HCWA)<br />
HCWA is a by product acquired from a small scale fully automatic boiler unit (commercially known as<br />
Bio-Turbomax boiler) used in wood kiln drying factory, Amkawood K.D Sdn. Bhd., in Malaysia . The<br />
wood waste biomasses were derived from local timber species dominantly Shorea Parvifolia, Shorea<br />
Macroptera, Shorea Faguetiana, Shorea Multiflora, Dyera Costulata <strong>and</strong> Hevea Brasiliensis. The<br />
wood biomasses were incinerated under self sustained burning condition within an atmosphere with<br />
turbulence air flow supplied by an in-built air pump unit. Temperature of incineration was maintained<br />
within the range of 800±10ºC. Raw ash obtained from the boiler unit were sieved through laboratory<br />
sieve with opening size of 1.18mm to remove large agglomerated ash particles <strong>and</strong> unburned charred<br />
materials. Ash passing the 1.18mm sieve was then grinded in a ring mill to fineness whereby merely<br />
0.73% of the ash was retained on 150µm sieve upon dry sieving. The chemical compositions of<br />
HCWA are presented in Table 1.
144<br />
International <strong>Building</strong> & <strong>Infrastructure</strong> Technology Conference<br />
7-8 June 2011, Vistana Hotel, Penang, Malaysia<br />
Table 1. Chemical Compositions, Loss On Ignition (LOI) And Physical Properties Of Portl<strong>and</strong> Cement<br />
And HCWA.<br />
c. Aggregates<br />
Chemical Mass %<br />
Compound Cement Wood ash<br />
(AKW)<br />
MgO 1.500 10.000<br />
Al2O3 3.600 4.100<br />
SiO2 16.000 28.000<br />
P2O5 0.057 3.900<br />
SO3 3.100 1.000<br />
Cl n/d 0.050<br />
K2O 0.340 7.400<br />
CaO 72.000 39.000<br />
TiO2 0.170 0.130<br />
MnO 0.028 0.510<br />
Fe2O3 2.900 2.500<br />
NiO n/d 0.015<br />
ZnO trace 0.047<br />
SrO 0.035 0.130<br />
ZrO2 0.018 0.036<br />
PbO 0.012 n/d<br />
Rb2O trace 0.031<br />
C n/d 2.000<br />
Na2O n/d 1.000<br />
As2O3 n/d trace<br />
BaO n/d 0.077<br />
Loss on ignition (%)<br />
Specific Surface<br />
2.53 7.22<br />
Area (m 2 /kg) 1043.2 1087.1<br />
Specific gravity<br />
Median particle<br />
3.02 2.52<br />
diameter,d50 (µm) 3.90 5.16<br />
*n/d indicates that the given compound was not detected in the ash sample<br />
Fine aggregate used were locally sourced quartzitic natural river s<strong>and</strong> in uncrushed form with specific<br />
gravity of 2.83 <strong>and</strong> maximum aggregate size of 5mm. Fine aggregates were dried to saturated surface<br />
dry condition prior to use as constituent material in mortar mixes. Fine aggregates were graded in<br />
accordance to BS812: Part 102 (BSI 1989) <strong>and</strong> grading of fine aggregates used was in compliance<br />
with overall grading limits of BS 882 (BSI 1992) as shown in Figure. 1. Fineness modulus of the fine<br />
aggregates was determined to be 3.26.
Figure 1. Grading Of Fine Aggregates.<br />
145<br />
International <strong>Building</strong> & <strong>Infrastructure</strong> Technology Conference<br />
7-8 June 2011, Vistana Hotel, Penang, Malaysia<br />
d. Superplasticizer <strong>and</strong> mixing water<br />
Type F superplasticizer of sulfonated melamine formaldehyde condensates category with commercial<br />
designation of CONPLAST SP1000 supplied by Fosroc Sdn. Bhd. was used in the study. Potable<br />
water from local water supply network was used as mixing water.<br />
2.2. Experimental Programmes<br />
a. Characterisation of HCWA <strong>and</strong> cement<br />
Chemical compositions of HCWA <strong>and</strong> cement were determined by X-Ray Fluorescence analytical<br />
method using X-ray spectrometer with the commercial name of Rigaku RIX3000. Mineral phases of<br />
oxide compounds detected from X-Ray Fluorescence analysis were identified by X-Ray diffraction<br />
method using Bruker X-Ray diffractometer. Analysis of X-Ray diffraction pattern for determination of<br />
mineral phases was performed using fingerprint method (Whitfield <strong>and</strong> Mitchell 2008). Loss on ignition<br />
(LOI) of HCWA <strong>and</strong> cement was determined in accordance to procedures prescribed in ASTM<br />
St<strong>and</strong>ard C311 (ASTM 2004).<br />
Particle size distribution, median particle size diameter (d50) <strong>and</strong> specific surface area of both HCWA<br />
<strong>and</strong> cement were determined by laser diffraction analysis using Malvern laser particle size analyzer.<br />
Specific gravity values of the samples were determined using Le Chatelier Flask <strong>and</strong> procedures<br />
prescribed in ASTM St<strong>and</strong>ard C188 (ASTM 1995).<br />
b. Mixture proportioning <strong>and</strong> mixing<br />
The binder: s<strong>and</strong> <strong>and</strong> water/binder ratios were maintained constant at 1:2.25 <strong>and</strong> 0.35 respectively for<br />
all mortar mixtures cast. The Portl<strong>and</strong> cement binder was partially replaced using HCWA at<br />
substitution level of 5, 10, 15, 20 <strong>and</strong> 25 % by total binder’s weight. Superplasticizer was dosed at<br />
appropriate dosages to maintain desired mortar slump of 70±20mm, as prescribed in BS EN 206: Part<br />
1 (BSI 2000) as S2 (medium workability) slump range. The mix design of control mortar mixture (C)<br />
was performed using absolute volume method prescribed in design code ACI 211.1-91 (ACI 2000) to<br />
achieve compressive strength of 40MPa at the age of 28days. The composition of mortar mixtures are<br />
summarised in Table 2.<br />
c. Mortar mixing <strong>and</strong> curing<br />
Each batch of mortar was produced using an epicyclic type mechanical mixer complying with<br />
specifications in ASTM St<strong>and</strong>ard C305 (ASTM 1994). During mixing of mortar mixtures containing<br />
HWCA in partial substitution of Portl<strong>and</strong> cement, HCWA <strong>and</strong> Portl<strong>and</strong> cement were initially dry mixed<br />
at low mixing speed for duration of 3 minutes prior to addition of other constituent materials. Further<br />
mixing sequence <strong>and</strong> durations were performed in accordance to st<strong>and</strong>ard procedures prescribed in<br />
ASTM St<strong>and</strong>ard C305 (ASTM 1994).
146<br />
International <strong>Building</strong> & <strong>Infrastructure</strong> Technology Conference<br />
7-8 June 2011, Vistana Hotel, Penang, Malaysia<br />
d. Rheological properties<br />
ASTM Flow test was performed on fresh mortar mixtures using flow table complying with specifications<br />
prescribed in ASTM St<strong>and</strong>ard C230 (ASTM 1997) <strong>and</strong> st<strong>and</strong>ard testing procedures described in<br />
ASTM St<strong>and</strong>ard C109 (ASTM 1998). Besides, slump values of the mortar mixtures were determined<br />
by slump test performed in accordance to procedures prescribed in BS 1881: Part 102 (BSI 1983).<br />
Fresh mortar flow <strong>and</strong> slump values obtained are presented in Table 2.<br />
Table 2. Proportion Of Constituent Materials And Rheological Properties Of Mortar Mixtures.<br />
Batch % HCWA Cement HCWA S<strong>and</strong> Water SP w/c Mortar Slump<br />
Designation (kg/m 3 ) (kg/m 3 ) (kg/m 3 ) (kg/m 3 ) Dosage Flow (mm)<br />
(%) (%)<br />
Control (C) 0 684 0 1538 239 1.85 0.35 84 90<br />
A5 5 650 34 1538 239 1.85 0.35 68 70<br />
A10 10 616 68 1538 239 1.85 0.35 57 50<br />
A15 15 581 103 1538 239 1.98 0.35 62 50<br />
A20 20 547 137 1538 239 1.98 0.35 58 50<br />
A25 25 513 171 1538 239 1.98 0.35 54 50<br />
e. Compressive Strength, Ultrasonic Pulse Velocity (UPV) <strong>and</strong> bulk density tests<br />
Mortar cube specimens with edge dimensions of 50 mm were moulded, cured <strong>and</strong> tested in<br />
accordance to procedures described in ASTM St<strong>and</strong>ard C109 (ASTM 1998) for determination of<br />
compressive strength of hardened mortar mixtures produced. All mortar specimens fabricated were<br />
cured in lime saturated water for duration of 3, 7, 28 <strong>and</strong> 90 days prior being tested. The reported<br />
compressive strengths at given age of mortar are the average of three number of specimens tested.<br />
Propagation velocities of transmitted ultrasonic pulse through hardened mortar mixtures were<br />
determined using an electrical pulse generator <strong>and</strong> testing methods prescribed in BS EN 12504: Part<br />
4 (BSI 2004) on a representative mortar prism specimen with dimensions of 100x100x500mm.<br />
Transmission of ultrasonic pulse was performed by direct transmission method through constant path<br />
length of 100mm between transducers. Bulk densities of hardened mortar mixtures were determined<br />
in accordance to methods in BS 1881: Part 114 (BSI 1983).<br />
3. RESULTS AND DISCUSSIONS<br />
3.1. Characterisation of HCWA<br />
a. Chemical composition of HCWA<br />
The results of X-ray fluorescence analysis on HCWA are presented in Table 1. From the test results, it<br />
can be observed that the major oxide compounds present in HCWA are CaO, MgO, SO3, Al2O3, SiO2,<br />
P2O5, Na2O, K2O, <strong>and</strong> Fe2O3. Other substances namely Cl, TiO2, MnO, ZnO, SrO, ZrO2, Rb2O <strong>and</strong><br />
BaO was detected in minor composition. Apparently, CaO, SiO2 <strong>and</strong> MgO are the dominant<br />
compounds each comprising 39%, 28% <strong>and</strong> 10% of total mass of HCWA. Large composition of CaO<br />
of the ash indicates that the ash could be hydraulically reactive (Rajamma, Ball et al. 2009).<br />
The sum of composition of essential pozzolanic oxide namely SiO2, Al2O3 <strong>and</strong> Fe2O3 of HCFA was<br />
found to be merely 34.6%. Hence, HCFA does not satisfy the requirements prescribed in ASTM<br />
St<strong>and</strong>ard C618 (ASTM 2003) to be classified as Class N pozzolan. However, the SO3 compound<br />
which constitutes 1% by total mass of the ash is in good compliance with the upper limit of 4%<br />
prescribed in the st<strong>and</strong>ard.<br />
Loss on ignition of HCWA was found to be 7.22% which is significantly higher in comparison to<br />
Portl<strong>and</strong> cement (2.53%). The significant loss on ignition of HCWA is due to the fact that although the<br />
wood biomass was incinerated at high temperature of 800±10ºC within the boiler, there is always<br />
some inefficiency in carbon conversion due to kinetic <strong>and</strong> mass transfer limitations. As a result, some<br />
amount of organic residue is present within the ash (Rajamma, Ball et al. 2009).
147<br />
International <strong>Building</strong> & <strong>Infrastructure</strong> Technology Conference<br />
7-8 June 2011, Vistana Hotel, Penang, Malaysia<br />
b. X-ray diffraction analysis<br />
The X-Ray diffraction pattern of HCWA is shown in Figure 3. A careful analysis of X-Ray diffraction<br />
pattern indicated that the major chemical phases of the HCWA were Monticellite (CaMgSiO4),<br />
Akermanite (Ca2MgSi2O7), Pectolite (HNaCa2Si3O9), Calcium Potassium Hydrogen Phospahate<br />
(CaK3H(PO4)2) <strong>and</strong> Calcium Borate (Ca3(BO3)2). As natural timber does not usually contain Borate<br />
chemical constituent, the presence of Borate compound in HCWA is most probably due to the use of<br />
Boric acid in the treatment of raw timber during the timber product manufacturing process. The<br />
presence of Monticellite <strong>and</strong> Akermanite is in close agreement with the result of X-Ray Fluorescence<br />
analysis, Table 1, which indicates presence of significant quantities of CaO (39%), MgO (10%) <strong>and</strong><br />
SiO4 (28%) within HCWA. Broad diffuse b<strong>and</strong> between 24º <strong>and</strong> 37º on 2θ scale of the XRD pattern of<br />
HCWA is an indication that the silicate minerals were glassy in nature (Lin, Wang et al. 2003). Silicate<br />
mineral in glassy or amorphous state is highly reactive with Portl<strong>and</strong>ite produced from hydration of<br />
cement to form additional calcium silicate hydrate (CSH) gel. Additional CSH gel formed contributes<br />
towards reduction of Portl<strong>and</strong>ite amount <strong>and</strong> at the same time increases quantity of CSH gel hence<br />
resulting in overall enhancement in strength of hardened cement paste matrix.<br />
Lin (Counts)<br />
1200<br />
1100<br />
1000<br />
900<br />
800<br />
700<br />
600<br />
500<br />
400<br />
300<br />
200<br />
100<br />
0<br />
HCWA<br />
10 20 30 40 50 60 70 80 9<br />
2-Theta - Scale<br />
HCWA - File: AKW.RAW - Type: 2Th/Th locked - Start: 10.000 ° - End: 90.012 ° - Step: 0.034 ° - Step time: 71.6 s - Temp.: 25 °C (Room) - Time Started: 11 s - 2-Theta: 10.000 ° - Theta: 5.000 ° - Chi: 0.00 ° - Phi: 0.00<br />
Operations: Background 1.000,1.000 | Import<br />
01-075-1569 (C) - Monticellite - CaMgSiO4 - Y: 61.29 % - d x by: 1. - WL: 1.5406 - Orthorhombic - a 4.81500 - b 11.08000 - c 6.37000 - alpha 90.000 - beta 90.000 - gamma 90.000 - Primitive - Pbnm (62) - 4 - 339.841<br />
01-076-0841 (C) - Akermanite - Ca2Mg(Si2O7) - Y: 93.85 % - d x by: 1. - WL: 1.5406 - Tetragonal - a 7.78900 - b 7.78900 - c 5.01800 - alpha 90.000 - beta 90.000 - gamma 90.000 - Primitive - P-421m (113) - 2 - 304.4<br />
01-076-0841 (C) - Akermanite - Ca2Mg(Si2O7) - Y: 93.85 % - d x by: 1. - WL: 1.5406 - Tetragonal - a 7.78900 - b 7.78900 - c 5.01800 - alpha 90.000 - beta 90.000 - gamma 90.000 - Primitive - P-421m (113) - 2 - 304.4<br />
01-076-0951 (C) - Pectolite-1A - HNaCa2Si3O9 - Y: 56.42 % - d x by: 1. - WL: 1.5406 - Triclinic - a 7.98000 - b 7.02300 - c 7.01800 - alpha 90.540 - beta 95.140 - gamma 102.550 - Primitive - P-1 (2) - 2 - 382.203 - I/Ic<br />
01-076-1248 (C) - Calcium Potassium Hydrogen Phosphate - CaK3H(PO4)2 - Y: 58.01 % - d x by: 1. - WL: 1.5406 - Monoclinic - a 9.87800 - b 5.73500 - c 7.43600 - alpha 90.000 - beta 94.280 - gamma 90.000 - Base-<br />
01-070-0868 (C) - Calcium Borate - Ca3(BO3)2 - Y: 54.96 % - d x by: 1. - WL: 1.5406 - Rhombo.H.axes - a 8.63770 - b 8.63770 - c 11.84900 - alpha 90.000 - beta 90.000 - gamma 120.000 - Primitive - R-3c (167) - 6 -<br />
3.2. Compressive strength<br />
Figure 3. XRD patterns of HCWA.<br />
Compressive strength test results <strong>and</strong> bulk densities of hardened mortar are presented in Table 3<br />
Additionally, the compressive strength development of the hardened mortars containing various level<br />
of cement replacement by HCWA is presented in Figure. 4. Compressive strength test results indicate<br />
that target 28 days compressive strength of 40MPa was achieved by mortars containing various level<br />
of cement replacement with HCWA up to 20% of total binder weight. Generally, at early age of<br />
hydration up to 28 days, it was observed that the increase level of cement replacement from 0% to<br />
25% at stepped increment of 5% resulted in gradual decrease in compressive strength of mortars. A<br />
similar trend was observed by several other researchers (Elinwa <strong>and</strong> Mahmood 2002; Udoeyo <strong>and</strong><br />
Dashibil 2002; Udoeyo, Inyang et al. 2006; Wang, Baxter et al. 2008). However, under prolonged<br />
curing duration beyond 28 days, a convergence of compressive strength between mortar with HCWA<br />
<strong>and</strong> the control mortar could be observed. The higher rate of strength gain of mortar mixtures<br />
containing HCWA on prolonged curing duration of 7 days up to 90 days which contributed to the<br />
convergence in compressive strength is most probably due to presence of pozzolanic reaction<br />
between Portl<strong>and</strong>ite produced from hydration of Portl<strong>and</strong> cement with amorphous silica content of<br />
HCWA. At the age of 90 days, compressive strength of mortar with 15% HCWA was found to exceed
148<br />
International <strong>Building</strong> & <strong>Infrastructure</strong> Technology Conference<br />
7-8 June 2011, Vistana Hotel, Penang, Malaysia<br />
the compressive strength of the control mortar by 2.7% while other HCWA mortar with HCWA content<br />
up to 25% maintained a marginal difference in compressive strength relative to the control mortar.<br />
In the production of structural mortar, the optimum level of cement replacement with HCWA is 15%. At<br />
this level of cement replacement long term strength of mortar mixture at the age of 90 days was found<br />
to be higher than that of Portl<strong>and</strong> cement mortar. In addition, the correlation between compressive<br />
strength of mortar produced with propagation velocities of ultrasonic pulse transmitted through the<br />
hardened mortar is shown in Figure. 5. Regression analysis reveals the following relationship between<br />
ultrasonic pulse velocities with corresponding compressive strength of the mortar.<br />
where fcu = compressive strength of the mortar (MPa) ; <strong>and</strong> v = ultrasonic pulse velocity (km/s)<br />
Table 3. Compressive Strengths And Bulk Densities Of Hardened Mortar Mixtures.<br />
%Wood Bulk Compressive strength (MPa)-normalized<br />
waste Ash Density (kg/m 3 ) 3days 7days 28days 90days<br />
0 2266 34.89-100 38.15-100 44.90-100 48.25-100<br />
5 2281 31.89-91.4 37.04-97.1 44.39-98.9 46.81-97<br />
10 2274 31.61-90.6 36.54-95.8 42.98-95.7 47.26-97.9<br />
15 2258 27.01-77.4 31.85-83.5 41.77-93 49.55-102.7<br />
20 2268 27.03-77.4 33.61-88.1 40.06-89.2 44.64-92.5<br />
25 2273 26.52-76 33.34-87.4 38.99-86.9 43.77-90.7<br />
Figure 4. Compressive Strength Development Characteristics.<br />
(1)
149<br />
International <strong>Building</strong> & <strong>Infrastructure</strong> Technology Conference<br />
7-8 June 2011, Vistana Hotel, Penang, Malaysia<br />
Figure 5. Relationship Between Compressive Strength And Ultrasonic Pulse Velocity Of HCWA<br />
Mortar.<br />
4. CONCLUSIONS<br />
As referred to results acquired throughout the laboratory investigation, the following conclusions can<br />
be derived:<br />
� Median particle size (d50) <strong>and</strong> specific surface area of HCWA was found to be higher than that<br />
of ordinary portl<strong>and</strong> cement.<br />
� Major oxide compound present in HCWA is silica (28%) <strong>and</strong> calcium oxide (39%).<br />
� Silica mineral found in HCWA were glassy or amorphous in nature.<br />
� Incorporation of HCWA in the mortar mix as partial cement replacement material up to 10% by<br />
total binder weight did not incur additional dosage of superplasticizer to maintain constant level<br />
of workability. The use of HCWA at higher level of cement replacements (15%, 20% <strong>and</strong> 25%)<br />
raised superplasticizer dem<strong>and</strong> by 7% to achieve a specified level of workability.<br />
� Mortar containing 15% of HCWA by total binder weight exhibited higher compressive strength<br />
compared to that of the control mortar mix on prolonged curing duration of 90 days.<br />
Incorporation of HCWA at cement replacement level up to 25% produced mortar mix with<br />
compressive strength exceeding 90% of the control mortar.<br />
� The optimum level of cement replacement with HCWA with reference to compressive strength is<br />
15%. Higher level of cement replacement resulted in lower compressive strength.<br />
REFERENCES<br />
Abdullahi, M. (2006). Characteristics of wood ash/OPC Concrete. Leonardo Electronic Journal of<br />
Practical Technology: 9-16.<br />
ACI (2000). ACI 211.1. St<strong>and</strong>ard practice for selecting proportions for normal, heavyweight, <strong>and</strong> mass<br />
concrete, ACI manual of concrete practice, part 1: materials <strong>and</strong> general properties of concrete.<br />
ASTM (1994). ASTM C305-1994. Practice for mechanical mixing of hydraulic cement pastes <strong>and</strong><br />
mortars of plastic consistency, Annual Book of ASTM St<strong>and</strong>ards, vol. 04.01.<br />
ASTM (1995). ASTM C188-1995.Test method for density of hydraulic cement, Annual Book of ASTM<br />
St<strong>and</strong>ards, vol. 04.01.<br />
ASTM (1997). ASTM C150-1997. Specifications for Portl<strong>and</strong> cement, Annual Book of ASTM<br />
St<strong>and</strong>ards, vol. 4.01.
150<br />
International <strong>Building</strong> & <strong>Infrastructure</strong> Technology Conference<br />
7-8 June 2011, Vistana Hotel, Penang, Malaysia<br />
ASTM (1997). ASTM C230-1997. Specification for flow table for use in tests of hydraulic cement,<br />
Annual Book of ASTM St<strong>and</strong>ards, vol. 04.01.<br />
ASTM (1998). ASTM C109-1998. Test method for compressive strength of hydraulic cement mortars<br />
(Using 2-in. or [50-mm] cube specimens), Annual Book of ASTM St<strong>and</strong>ards, vol. 04.01.<br />
ASTM (2003). ASTM C618-2003. Specifications for coal fly ash <strong>and</strong> raw or calcined natural pozzolan<br />
for use in concrete.<br />
ASTM (2004). ASTM C311-2004. Test method for sampling <strong>and</strong> testing fly ash or natural pozzolans<br />
for use in Portl<strong>and</strong> cement concrete, Annual Book of ASTM St<strong>and</strong>ards, vol. 04.02.<br />
BSI (1983). BS 1881: Part 102. Testing concrete. Method for determination of slump, British<br />
St<strong>and</strong>ards Institution, London.<br />
BSI (1983). BS 1881: Part 114. Testing concrete. Methods for determination of density of hardened<br />
concrete, British St<strong>and</strong>ards Institution, London.<br />
BSI (1989). BS812:Part 102. Testing aggregates. Method for sampling, British St<strong>and</strong>ards Institution,<br />
London.<br />
BSI (1992). BS 882. Specification for aggregates from natural sources for concrete, British St<strong>and</strong>ards<br />
Institution, London.<br />
BSI (2000). BS EN 206: Part 1. Concrete. Specification, performance, production <strong>and</strong> conformity,<br />
British St<strong>and</strong>ards Institution, London.<br />
BSI (2004). BS EN 12504: Part 4. Testing concrete. Determination of ultrasonic pulse velocity, British<br />
St<strong>and</strong>ards Institution, London.<br />
Elinwa, A. U. <strong>and</strong> S. P. Ejeh (2004). Effects of incorporation of sawdust incineration fly ash in cement<br />
pastes <strong>and</strong> mortars. Journal of Asian Architecture <strong>Building</strong> Engineering 3(1): 1-7.<br />
Elinwa, A. U., S. P. Ejeh, et al. (2005). Using metakaolin to improve sawdust ash concrete. Concrete<br />
International.<br />
Elinwa, A. U., S. P. Ejeh, et al. (2008). Assessing of the fresh concrete properties of self-compacting<br />
concrete containing sawdust ash. Construction <strong>and</strong> <strong>Building</strong> Materials 22: 1178-1182.<br />
Elinwa, A. U. <strong>and</strong> Y. A. Mahmood (2002). Ash from timber waste as cement replacement material.<br />
Cement <strong>and</strong> Concrete Composites 24(219-222).<br />
Lin, K. L., K. S. Wang, et al. (2003). The reuse of municipal solid waste incinerator fly ash slag as a<br />
cement substitute. Resources, Conservation <strong>and</strong> Recycling 39(4): 315-324.<br />
Rajamma, R., R. J. Ball, et al. (2009). Characterisation <strong>and</strong> use of biomass fly ash in cement-based<br />
materials. Journal of Hazardous Materials 172(2-3): 1049-1060.<br />
Udoeyo, F. F. <strong>and</strong> P. U. Dashibil (2002). Sawdust ash as concrete material. Journal of Material in Civil<br />
Engineering 14(2): 173-176.<br />
Udoeyo, F. F., H. Inyang, et al. (2006). Potential of wood waste ash as an additive in concrete. Journal<br />
of Material in Civil Engineering 18: 605-611.<br />
Vassilev, S. V., D. Baxter, et al. (2010). An overview of the chemical composition of biomass. Fuel<br />
89(5): 913-933.<br />
Wang, S., L. Baxter, et al. (2008). Biomass fly ash in concrete: SEM, EDX <strong>and</strong> ESEM analysis. Fuel<br />
87(3): 372-379.<br />
Whitfield, B. <strong>and</strong> L. Mitchell, Eds. (2008). Phase identification <strong>and</strong> quantitative method. Principles <strong>and</strong><br />
applications of powder diffraction United Kingdom, John Wiley & Sons.
T133<br />
151<br />
International <strong>Building</strong> & <strong>Infrastructure</strong> Technology Conference<br />
7-8 June 2011, Vistana Hotel, Penang, Malaysia<br />
ILLUMINATING INDOOR SPACES FOR THE WELL BEING OF OCCUPANTS<br />
USING INNOVATIVE ROOFING SYSTEM<br />
Hazril Sherney b. Basher 1 , Abdul Malek Abdul Rahman 2 ,<br />
1,2 Universiti Sains Malaysia, Penang, Malaysia,<br />
1 hazril_skywalker@yahoo.com , 2 malik@usm.my<br />
ABSTRACT: Illuminating indoor spaces using natural or passive solution is the key of saving energy<br />
from burning fossil fuel <strong>and</strong> energy consumption. Its function is to illuminate the indoor spaces of all<br />
types of building design during broad daylight without excessive usage of artificial lighting. The<br />
creation of innovative roofing system consist of glazing roofing <strong>and</strong> hybrid turbine ventilator (HTV)<br />
which can reduce the building indoor temperature as well as giving independent free natural lighting to<br />
building occupants. Even though glazing roofing tend to create green house effect towards indoor<br />
spaces which lead to adverse heat <strong>and</strong> increasing indoor temperature, the HTV kicks in to extract heat<br />
from radiated roof top <strong>and</strong> building spaces. Thus it increases indoor air quality <strong>and</strong> occupants thermal<br />
comfort. Basic parameters of thermal comfort were measured: air temperature, relative humidity, air<br />
velocity <strong>and</strong> solar radiation. The parameters were measured using experimental scaled model which<br />
project accurate controlled empirical data for analysis before <strong>and</strong> after implement of the innovative<br />
roofing system. The findings from experimental <strong>and</strong> simulation measurement reveal that the innovative<br />
roofing system reduces the temperature of indoor spaces using single HTV on scaled model rooftop<br />
<strong>and</strong> giving the occupants clean <strong>and</strong> free lighting source. This reliable data will open new gateways for<br />
future recommendation to improve passive lighting <strong>and</strong> indoor air quality.<br />
Keywords: natural illumination, stack ventilation, turbine ventilator, indoor spaces, thermal<br />
comfort<br />
1. INTRODUCTION:<br />
Nowadays, the world population have consumed <strong>and</strong> depleted major resources all around the globe.<br />
Many sectors are seeking to restore <strong>and</strong> to find alternatives to energy depletion. In the year 1983<br />
sustainable development (SD) were introduce in the World Commission on Environment <strong>and</strong><br />
Development (WCED) to address the nation concerning human resources that will ultimately<br />
deteriorate nations social <strong>and</strong> economical development. In architecture background many form or<br />
solution have been introduce <strong>and</strong> implement in building sectors <strong>and</strong> design so that people will<br />
appreciate the fundamental of sustainable architecture. In Malaysia the Green <strong>Building</strong> Index (GBI)<br />
have been carried out <strong>and</strong> merely will formed as compulsory in later years to come an energy<br />
efficiency index to calculate building green performance( MS 1525 :2001 UBBL code).<br />
In this paper, the main issues regarding energy consumption is burning fossil fuel using air<br />
conditioning system (A/C) <strong>and</strong> also excessive usage of artificial lighting during broad daylight which<br />
will lead to many circumstances <strong>and</strong> increasing of annual electricity bills. Moreover, the continuity of<br />
using artificial lighting <strong>and</strong> air conditioning system in straight hours will lead to unhealthy living.<br />
Therefore, desperate measures have to be taken as a step to counter the problems that occur in<br />
illumination <strong>and</strong> ventilation. According to Gon Kim et al. (2009) to embody a healthy lifestyle or living,<br />
architectural design plays a very important role. The innovative roofing system is an alternative<br />
approach or green solution which combine both lighting <strong>and</strong> ventilation solution to solve the problem<br />
statement in order for occupants achieve thermal comfort <strong>and</strong> sustainable living. In previous research<br />
combination of both approach have been introduced such as the used of conventional ventilator <strong>and</strong><br />
light pipe by Zain-Ahmed et al (2007), it is also stated that by solving simultaneously illumination <strong>and</strong><br />
ventilation approach, problem of energy consumption will be solved without additional cost. By<br />
following this concept of both approach, a study consider unique due to the fact it investigates
152<br />
International <strong>Building</strong> & <strong>Infrastructure</strong> Technology Conference<br />
7-8 June 2011, Vistana Hotel, Penang, Malaysia<br />
occupants thermal comfort which is safer, greener <strong>and</strong> will not consume major electricity bills will be<br />
conducted.<br />
The innovative roofing system consists of a Hybrid Turbine Ventilator (HTV) <strong>and</strong> glazing roofing to<br />
allow day lighting penetration. The function of the glazing roofing is to enhance day lighting or<br />
illumination as a natural resource of lighting during broad daylight. Its function is considered to be an<br />
alternative to artificial lighting such as fluorescent light. Natural illumination is a free source of lighting<br />
which comes from sun rays. In this research the unit to calculate the intensity of light luminance is lux.<br />
To achieve certain amount of lighting in indoor spaces vertical approach such as the atrium system is<br />
remarkable compare to minimal source of lighting from windows opening which is horizontal. In<br />
building design, recommendation of light level is essential for occupants to perform activities. These<br />
activities rely mostly on certain amount of light level intensity.<br />
Table 1.Ttable of recommendation of light inside indoor spaces<br />
(Source www.engineringtoolbox.com)<br />
Activity Illumination (lux, lumen/m 2 )<br />
Warehouses, Homes, Theaters,<br />
Archives<br />
150<br />
Easy Office Work, Classes<br />
Normal Office Work, PC Work,<br />
250<br />
Study Library, Groceries, Show<br />
Rooms, Laboratories.<br />
500<br />
Table 1 indicates normal illumination or recommended light level for indoor spaces which rely mostly<br />
on types of activity performed (www.engineringtoolbox.com). Normal st<strong>and</strong>ard requirements for an<br />
effective lighting inside indoor space as shown for this paper are set from 500-1000 lux. Even though<br />
the st<strong>and</strong>ards shown are example readings of lux level using artificial lighting, the real natural<br />
illumination will definitely exceed the amount of lux level due to material chosen for method of data<br />
collection. The glazing roofing as mentioned act as a vertical source <strong>and</strong> projects atrium concept<br />
which allow day lighting penetrates from above. These natural lighting or illumination will bring along<br />
heat as well as sunlight inside an indoor space. The sunlight penetrates further until it reaches the<br />
floor level, <strong>and</strong> at the same time left a small amount of heat trapped on the attic space which is located<br />
above st<strong>and</strong>ard ceiling level. This glazing roofing system although brought beneficial to occupants, at<br />
instance it also creates green house effect inside indoor spaces. As agent of anti-thermal comfort, it<br />
tends to transfer the heat load downwards to occupants level using radiation concept. (HQ technology,<br />
2009). Therefore, secondcomponent or crucial part is needed to balance this natural approach.<br />
The second component is the hybrid turbine ventilator (HTV). It’s a component which combines a<br />
conventional turbine ventilator <strong>and</strong> powered by 40watts PV panel. The HTV component is also a<br />
hybrid powered system which not just relies on solar radiation but also wind driven when there are<br />
abundance of sunlight. These make the innovative roofing is efficient system which save energy by<br />
utilising both approach natural illumination <strong>and</strong> ventilation to achieve occupant’s thermal comfort. The<br />
HTV operates as to extract heat load that is trapped inside the attic space of a building design which<br />
consider as the main source of heat load inside a building.<br />
As mentioned from Ismail.M (2009) by placing the HTV device at attic space level compare to<br />
occupants level will diminish the temperature inside a building efficiently. During high intensity of solar<br />
radiation the HTV component will kick start <strong>and</strong> extract the heat inside the attic space. From 0 m/s in<br />
existing level, it subsequently reach until max 0.48m/s the amount of upward induce air which flows<br />
directly upon HTV extraction. The innovative roofing system relies mostly between two components<br />
mentioned. If using only one component, efficiency will not occur. The innovative roofing system is one<br />
of a kind. It implies by giving us free natural illumination using glazing roofing <strong>and</strong> yet induced indoor<br />
air quality.<br />
2. METHODOLOGY<br />
In this paper, method of research relies mostly in the usage of quantitative approach which is an<br />
experimental data. Experimentation was carried out using a scaled model that is specifically design for<br />
data measurement of thermal comfort parameters. The thermal comfort parameters that were
153<br />
International <strong>Building</strong> & <strong>Infrastructure</strong> Technology Conference<br />
7-8 June 2011, Vistana Hotel, Penang, Malaysia<br />
collected in this research are indoor temperature, ambient temperature, solar radiation, relative<br />
humidity, internal air velocity <strong>and</strong> lux intensity. The scaled model is made out of wooden framework<br />
material <strong>and</strong> plywood panels. The roof covering material is from profiled metal decking roofing<br />
attached with a 10mm Perspex clear sheet. It acts as glazing roofing in real condition. The materials<br />
that have been chosen definitely will create serious heat gain due to non insulation aspects. Its<br />
function is to determine or simulate on worst case scenario, to see any impact factor differential in<br />
thermal comfort parameters.<br />
The main data will be presented by experimental measurements. The instrumentation or equipment<br />
use in this paper is Data Acquisition System (DAQ). The DAQ system is connected via electrical cable<br />
<strong>and</strong> at the end of the cables probes or sensors is attached to measure readings of thermal comfort<br />
parameters. The HTV system which consists of a 450mm or 18” in diameter modified turbine ventilator<br />
is placed on top of the scaled model. This component is attached with PV panels that are tilt until it<br />
reaches 30° angle. The orientation of the model is set to east side orientation as mentioned by<br />
Ismail.M (2009), the HTV tend to start extraction when it is placed towards this orientation. The<br />
duration of this research measurements is about 1 month from Feb to Mac 2011 <strong>and</strong> data are taken<br />
9.00am till 5.00pm at every 5 minutes intervals. In this paper selected data are taken from 3 days of<br />
perfect clear weather condition.<br />
Measurements that have been done during these months are considered as the driest period of the<br />
year referred to Meteorological Department Bayan Lepas Penang. The data collection or<br />
measurements also will be conducted in 3 phase. Phase 1 is measurements on existing situation<br />
where as data will be collected on the scaled model existing condition. Only natural illumination will<br />
penetrate inside the indoor of the model itself. In Phase 2, application of the HTV system will be<br />
implement thus will see any differential data regarding thermal comfort parameters in enclosed<br />
situation. The last phase is considered measurement to induced stack ventilation by creating small<br />
opening on the side of the scaled model. P. Priyadarsini et al (2003) mentioned that by commencing<br />
this last phase of creating an opening, it will lead to internal air velocity fluctuations as it induces stack<br />
ventilation. However, in this paper, the only phase 1 &2 experimental programmes will be explained in<br />
detail.<br />
Figure 1 & 2. Prototype of scaled model to measure thermal comfort parameters.<br />
(Source author)<br />
2.1 Experimental Programmes<br />
a. Test 1: Existing Condition<br />
Data for phase 1 <strong>and</strong> phase 2 are included to see differential of thermal comfort parameters. Recent<br />
studies indicated that indoor air temperature was lower than ambient temperature. However for the<br />
scaled model existing condition, the indoor temperature presents higher than the ambient temperature<br />
or outside temperature. This is due to material selection which has no insulation of heat as to<br />
investigate worst case scenario. During the investigation, the internal temperature projects around<br />
maximum of 45°C.The internal air velocity presents a stagnant 0 m/s as there is no air movement<br />
occur inside the scaled model.
154<br />
International <strong>Building</strong> & <strong>Infrastructure</strong> Technology Conference<br />
7-8 June 2011, Vistana Hotel, Penang, Malaysia<br />
Table 2. indicates existing thermal comfort parameters from scaled model measurements (source<br />
author)<br />
Lux meter<br />
Solar<br />
radiation<br />
Outdoor<br />
temp.<br />
Indoor<br />
temp.<br />
Indoor air<br />
vel.<br />
Indoor<br />
Rhum<br />
(lux) (W/m2) ('C) ('C) (m/s) (%RH)<br />
Day 1 14335.64 953.06 35.33 43.76 0 78.58<br />
Day 2 12602.56 950.14 36.94 45.75 0 76.56<br />
Day 3 12766.5 1002.84 36 45.65 0 66.84<br />
Mean.max 13234.9 968.68 36.09 45.05 0 73.99<br />
Max 14335.64 1002.84 36.94 45.75 0 78.58<br />
Lux meter<br />
Solar<br />
radiation<br />
Outdoor<br />
temp.<br />
Indoor<br />
temp.<br />
Indoor air<br />
vel.<br />
Indoor<br />
Rhum<br />
(lux) (W/m2) ('C) ('C) (m/s) (%RH)<br />
Day 1 4218.2 115.66 26.33 28.82 0 34.68<br />
Day 2 3216.99 171.29 27.22 30.02 0 34.9<br />
Day 3 4505.09 363.07 29.61 33.08 0 34.68<br />
Mean min 3980 216.67 27.72 30.64 0 34.75<br />
Min 3216.99 115.66 26.33 28.82 0 34.68<br />
Lux meter<br />
Solar<br />
radiation<br />
Outdoor<br />
temp.<br />
Indoor<br />
temp.<br />
Indoor air<br />
vel.<br />
Indoor<br />
Rhum<br />
(lux) (W/m2) ('C) ('C) (m/s) (%RH)<br />
Day 1 10212.4 584.62 31.42 38.17 0 53.8<br />
Day 2 9866.3 584.62 32.96 40.76 0 48.8<br />
Day 3 8213.3 732.16 33.83 41.74 0 44.95<br />
Average 9430.7 633.8 32.73 40.22 0 49.18<br />
b. Test 2: Application Condition<br />
For phase 2, after existing measurements have been taken, the application of HTV system will be<br />
carried out for the scaled model. As observed in phase 2 for application condition for enclosed case,<br />
the readings illustrated slight lower or drop in internal temperature. While the internal air velocity<br />
increase gradually until max 0.48 m/s. This means when higher the air change rate (ACH) the lower<br />
the temperature will become. When sunlight penetrates through the glazing roofing <strong>and</strong> reaches to a<br />
certain amount of lux, it also brings along solar radiation. These intense solar radiations from 900-<br />
1000 W/m2 ignite the HTV to start rotate as well as extract the heat inside the scaled model.
155<br />
International <strong>Building</strong> & <strong>Infrastructure</strong> Technology Conference<br />
7-8 June 2011, Vistana Hotel, Penang, Malaysia<br />
Table 3. Indicates application of HTV system in thermal comfort parameters from scaled model<br />
measurements (source author)<br />
Lux meter<br />
Solar<br />
radiation<br />
Outdoor<br />
temp.<br />
Indoor<br />
temp.<br />
Indoor air<br />
vel.<br />
Indoor<br />
Rhum<br />
(lux) (W/m2) ('C) ('C) (m/s) (%RH)<br />
Day 1 10242.99 1002.84 36.78 41.47 0.37 72.5<br />
Day 2 16595.66 1020.41 34.91 38.93 0.35 73.32<br />
Day 3 60016.34 1045.3 36.18 41.25 0.48 66.22<br />
Mean.max 28951.7 1022.9 35.95 40.55 0.4 70.68<br />
Max 60016.34 1045.3 36.78 41.47 0.48 73.32<br />
Lux meter<br />
Solar<br />
radiation<br />
Outdoor<br />
temp.<br />
Indoor<br />
temp.<br />
Indoor air<br />
vel.<br />
Indoor<br />
Rhum<br />
(lux) (W/m2) ('C) ('C) (m/s) (%RH)<br />
Day 1 3158.44 102.48 27.14 29.37 0 35.86<br />
Day 2 3158.44 109.8 26.12 28.87 0 39.32<br />
Day 3 2526.1 84.91 29.76 33.64 0 40.34<br />
Mean min 2947.7 99.06 27.67 30.62 0 38.5<br />
Min 2526.1 84.91 26.12 28.87 0 35.86<br />
Lux meter<br />
Solar<br />
radiation<br />
Outdoor<br />
temp.<br />
Indoor<br />
temp.<br />
Indoor air<br />
vel.<br />
Indoor<br />
Rhum<br />
(lux) (W/m2) ('C) ('C) (m/s) (%RH)<br />
Day 1 7279 711.34 34.01 37.79 0.18 46.64<br />
Day 2 10978 550.3 31.76 35.67 0.13 52.64<br />
Day 3 26877 647.73 32.63 37.35 0.21 48.45<br />
Average 15044.7 636.45 32.8 36.93 0.17 49.24<br />
From the experimental tables observed above, it shows data comparison from existing to the<br />
application of the innovative roofing system. For existing condition in Table 2, the maximum lux<br />
penetrates inside the indoor spaces at 14335.6 lux. The average lux intensity is estimated 9430.7 lux.<br />
Therefore the lux intensity is efficient enough to replace artificial lighting fixtures in broad day light. The<br />
existing internal temperature reaches until maximum level of 45.75 °C while the average value is<br />
40.22°C. The internal air velocity projects a stagnant 0 m/s. This means that there are no air change<br />
rate (ACH) occurs inside the scaled model at existing level since there was no air infiltration. The<br />
different value between maximum indoor-outdoor temperatures for existing condition is around 8.81°C.<br />
With reference from the trend in table 3, it shows a list of parameters which present significant value<br />
after implement the HTV system onto the scaled model. The lux intensity reached until maximum level<br />
of 60016.34 lux considers being the highest lux during data measurements. The maximum indoor<br />
temperature fluctuates until 41.47 °C while average readings show 36.93°C. The average drop of<br />
indoor temperature after inserting the HTV system is 3.29°C or 8.18%.Further investigations presents<br />
an astonishing reading where as by using single HTV system it is capable of achieved a maximum<br />
drop of 4.28°C.
156<br />
International <strong>Building</strong> & <strong>Infrastructure</strong> Technology Conference<br />
7-8 June 2011, Vistana Hotel, Penang, Malaysia<br />
Figure 3. Comparison of internal temperature differences for existing <strong>and</strong> application of HTV situation.<br />
(Source author)<br />
The indoor air velocity increased from 0m/s (existing) to a maximum of 0.48 m/s (HTV) in day 3 when<br />
solar radiation reached 1045 W/m2. The mean average of fluctuation increase is about 0.17 m/s. This<br />
shows that the innovative roofing system has the potential to create exceptional occupants thermal<br />
comfort by induce the upward air velocity <strong>and</strong> also extract the heat load from the attic space before it<br />
reaches occupants level. Szokolay (1998) informed that the st<strong>and</strong>ard effective of velocity is 0.25m/s.<br />
Although the average presents a lower rate, still it is consider an effective approach since it is based<br />
on single HTV device. The average lux intensity projected from the scaled model is around 9000 lux –<br />
15000 lux. During observations, the innovative roofing system triggers itself <strong>and</strong> started to induced air<br />
velocity when solar radiation is set from 800-1000 w/m2.<br />
Figure 4. Internal velocity performance application using HTV situation.(Source author)<br />
3. CONCLUSIONS<br />
From experimental results, it was also found that by using the glazing roofing itself not only created a<br />
green house effect but also brings non exceptional thermal comfort inside an indoor space. The<br />
investigation proves that the system has the potential to reduce energy consumption by saving<br />
electricity from lighting fixtures <strong>and</strong> over usage of air conditioning system during office hour. The
157<br />
International <strong>Building</strong> & <strong>Infrastructure</strong> Technology Conference<br />
7-8 June 2011, Vistana Hotel, Penang, Malaysia<br />
innovative roofing system reduced the temperature in terms of internal attic space <strong>and</strong> induced good<br />
air velocity. The ability to induce upward air velocity up to a maximum of 0.48m/s <strong>and</strong> diminished heat<br />
load at estimated of 3-4°C are an astonishing findings due to enclosed situation <strong>and</strong> non insulation<br />
material wised. Even though the achievement of enhancing natural day lighting has been sort out but<br />
still lowering temperature until the occupants st<strong>and</strong>ard effective temperature (SET) has been an issue.<br />
The SET level of 28.5°C was introduced by Ismail M (2009) which contradicts with Abdul Rahman<br />
(1999) <strong>and</strong> Zain-Ahmed et al. It is said that people of Asian countries are more tolerable to<br />
acclimatization of hot humid conditions nowadays. The scaled model itself is a non insulation material<br />
which generally built up heat load quickly than conventional material such as brickwork. As mentioned<br />
it acts as a worst case situation to identify minimum <strong>and</strong> maximum requirements of parameters to<br />
achieve thermal comfort. Due to the small cubic size, the capacity of 1 nos HTV device is needed to<br />
balance the natural illumination that penetrates the glazing roofing. The application of using this<br />
system alone is considered minimal efficiency. The results shows that in future by adding multiple<br />
solutions such as improved material wised <strong>and</strong> quantity of HTV will possibly create an effective level<br />
for occupant’s thermal comfort <strong>and</strong> thus exceed the st<strong>and</strong>ard effective temperature (SET).<br />
REFERENCES<br />
Chi-Ming Lai (2006). Prototype development of the rooftop turbine ventilator powered by hybrid wind<br />
<strong>and</strong> photovoltaic energy. 38, pp 174 - 180.<br />
Chrenko, F. A. (1974). Bedford’s Basic Principles of Ventilation <strong>and</strong> Heating, Third Edition, London:<br />
H.K Lewis <strong>and</strong> Co.Ltd.<br />
Gon Kim, J. T. K. (2010). Healthy -daylighting design for the living environment in apartments in<br />
Korea. 45, pp 287-294.<br />
Ismail, M., <strong>and</strong> Abdul Rahman, A.M. (2009). Comparison of Different Hybrid Turbine Ventilator (HTV)<br />
Application Strategies to Improve the Indoor Thermal Comfort, pp 297 - 308.<br />
Moore, F. (1985). Concepts <strong>and</strong> Practice of Architectural Daylighting.<br />
Naghman Khan, Y. S., Saffa B. Riffat. (2008). A review on wind driven ventilation techniques. 40, pp<br />
1586-1604.<br />
Narasimhan, C. (1970). llumination Climate <strong>and</strong> The design of openings For Daylighting of School<br />
<strong>Building</strong>s in South East Asia & Ceylon.<br />
Pei-Chun Liu, H. T. L., Jung-Hua Chou (2009). Evaluation of buoyancy-driven ventilation in atrium<br />
buildings using computational fluid dynamics <strong>and</strong> reduced-scale model. 44, pp 1970-1979.<br />
Phillips, D. (2004). Daylighting Natural Light in Architecture.<br />
R.Priyadarsini, K. W. C., Wong, N. H. (2004). Enhancement of natural ventilation in high-rise<br />
residential buildings using stack system. 36, pp 61 - 71.<br />
S. Millet, M. (1996). Light Revealing Architecture.<br />
V. Garcia-Hansen, A. E., A. Pattini. (2002). Passive solar systems for heating, daylighting <strong>and</strong><br />
ventilation for rooms without an equator-facing facade. 26, pp 91 - 111.<br />
Yan, H.J, Y. I. J., LIM, S.H., Kim, W. W. & Chen, K (2010). New development in illumination, heating<br />
<strong>and</strong> cooling technologies for energy-efficient buildings. 35, pp 2647 - 2653.<br />
Zain Ahmed, A. (2009). Climate Change, Green Technology <strong>and</strong> <strong>Sustainable</strong> <strong>Building</strong>s, Universiti<br />
Publication Centre (UPENA), UiTM.
T134<br />
158<br />
International <strong>Building</strong> & <strong>Infrastructure</strong> Technology Conference<br />
7-8 June 2011, Vistana Hotel, Penang, Malaysia<br />
THE PERFORMANCE OF THREE DIFFERENT SOLAR PANELS FOR SOLAR<br />
ELECTRICITY APPLYING SOLAR TRACKING TIMER DEVICE UNDER THE<br />
MALAYSIAN CLIMATE CONDITION<br />
Azhar Ghazali. M 1 <strong>and</strong> Abdul Malek Abdul Rahman 2<br />
1, 2 Universiti Sains Malaysia, Penang, Malaysia<br />
1 azhar.dtyco@gmail.com , 2 malik@usm.my<br />
ABSTRACT: Excessive usages of fossil fuel as main energy source have become the main factor that<br />
contributes to the global warming. Carbon dioxide emissions from the combustion of fossil fuel<br />
increase the temperature of the atmosphere. Besides that, the depletion of this energy source also<br />
became a major factor to the world’s energy crisis. As Malaysia move towards a developed country,<br />
energy requirement will remain very intensive. To prevent future problems of world energy crisis,<br />
Malaysia has embarked into renewable energy by introducing it as the Fifth Fuel Policy. The<br />
government would help out in terms of incentives, enabling policies <strong>and</strong> tax cuts for energy saving <strong>and</strong><br />
efficient appliances <strong>and</strong> machinery. Since 2005 the Malaysian Energy Center (Pusat Tenaga Malaysia<br />
now known as the Green Tech Office) has been campaigning for the use of solar electricity with the<br />
help of the Danish Government via its implementation arm program known as DANIDA (from 2005 to<br />
2010). This paper focuses on the three common types of solar panels available in the Malaysian<br />
market <strong>and</strong> to identify the most efficient in term of power conversion using the timer-tracking system<br />
by optimizing the sunlight <strong>and</strong> also to compare the performance between static system <strong>and</strong> dynamic<br />
system. Primarily for the Engineers <strong>and</strong> Architects, this research will help them identify critical<br />
technical factors in maximizing the energy output of different types of PV technologies at the same<br />
time consider the engineering <strong>and</strong> aesthetic issues associated with the roof mounted grid-connect PV<br />
system.<br />
Keywords: photovoltaic system, building integrated photovoltaic (BiPV), tropical climate, solar<br />
tracker<br />
1. INTRODUCTION<br />
Excessive usages of fossil fuel as main energy source have become the main factor that contributes<br />
to the global warming. Carbon dioxide emissions from the combustion of fossil fuel increase the<br />
temperature of the atmosphere. As Malaysia move towards a developed country, energy requirement<br />
will remain very intensive. At present, almost half the energy consumption in the nation is consumed<br />
by the industrial, residential <strong>and</strong> commercial sector (APEC, 2006). This means Malaysia has a strong<br />
need to apply energy efficient strategies in lowering energy consumption in buildings.<br />
Solar energy has been acknowledged as a free <strong>and</strong> infinite source of energy <strong>and</strong> provides an<br />
alternative energy where there is no pollution of the environment <strong>and</strong> its use will decreases the rate of<br />
depletion of energy reserves (A.M. Sharan, 2008). As one of renewable energy, solar energy<br />
represents a massive energy potential greatly exceeding the fossil fuels. Malaysia lies in the tropical<br />
region between 1 o N <strong>and</strong> 7 o N, <strong>and</strong> 100 o E <strong>and</strong> 119 o E (Kamaruddin, R, el at, 2002). Its weather condition<br />
in Malaysia is very suitable for photovoltaic implementation, this is because the weather condition is<br />
almost predictable <strong>and</strong> the availability of sunlight for more than ten hours daily with almost six hours of<br />
direct sunlight with irradiation of between 800 W/m 2 <strong>and</strong> 1000 W/m 2 (N. Amin et al, 2009).<br />
According to Deo Prasad & Mark Snow (2005), photovoltaic are solid-state devices that simply make<br />
electricity out of sunlight, silently <strong>and</strong> with little to no maintenance, no pollution <strong>and</strong> no significant<br />
depletion of material resources. According to T. Markvart, (1994), the design of the photovoltaic<br />
system relies on the input of measured data close to the site of the installation which is the regular<br />
daily <strong>and</strong> yearly variation due to the apparent motion of the sun, irregular variations are caused by the<br />
climate condition (cloud cover), as well as by general composition of the atmosphere. Besides that,<br />
different materials <strong>and</strong> different structures of photovoltaic panels provide different efficiency in term of<br />
power conversion.
159<br />
International <strong>Building</strong> & <strong>Infrastructure</strong> Technology Conference<br />
7-8 June 2011, Vistana Hotel, Penang, Malaysia<br />
According to A.J. Carr, T.L. Pryor (2004), photovoltaic technologies have different seasonal patterns of<br />
behavior <strong>and</strong> these differences are due to the variations in spectral response. There is evidence that<br />
modules of differing technologies could be more suited to certain specific climates. Mieke (1998) for<br />
example, has reported that in this tropical climate, with high ambient temperatures <strong>and</strong> high humidity<br />
during the wet season, the a-Si array produces up to 20% more energy than the p-Si array. Akhmad et<br />
al. (1997) have also indicated that a-Si modules may be more suited to tropical climates. N. Amin et al,<br />
(2009), found that Amorphous silicon <strong>and</strong> Copper Indium Diselenide (CIS) solar cell have shown<br />
better performance ratio than mono- <strong>and</strong> multi-crystalline silicon solar cells in Malaysia climate<br />
condition.<br />
Commonly in Malaysia, PV panels were installed fix to the building either on the roof this installation<br />
considered as static system. These static systems only maximize sun availability at certain time during<br />
daytime. While a dynamic system use Solar Tracker; a device for orientating Photovoltaic Panel (PV)<br />
towards the sun. This is to ensure that the concentration sunlight is directed to the focal point of the<br />
PV <strong>and</strong> this will improve the amount of power produced by the system by enhancing morning <strong>and</strong><br />
afternoon performances. The use of tracking technology allowing solar modules to follow the course of<br />
the sun (<strong>and</strong> optimize the incident angle of sunlight on their surface) can increase electricity<br />
production by around a third, <strong>and</strong> some claim by as much as 40% in some region, compared with<br />
modules at a fixed angle (Appleyard, D. 2009).<br />
This research focuses on the three common types of solar panels available in the Malaysian market<br />
<strong>and</strong> to identify the most efficient in term of power conversion using single-axis time/date tracking<br />
system by optimizing the sunlight <strong>and</strong> also to compare the performance between static system <strong>and</strong><br />
dynamic system. Primarily for the Engineers <strong>and</strong> Architects, this research will help them identify critical<br />
technical factors in maximizing the energy output of different types of PV technologies.<br />
2. METHODOLOGY<br />
In Malaysia, the sun is always directly overhead <strong>and</strong> its solar intensity do not varies by season, <strong>and</strong> for<br />
this matter Single-axis time/date solar tracker is used based on method suggested by Abdallah et al<br />
(2008) <strong>and</strong> Francisco Duarte et al (2010). Therefore, the movements of the PV panels during daytime<br />
are perpendicularly toward the sun <strong>and</strong> followed it from east to west. This type of method was selected<br />
because it’s cheaper compare to the other method due to simpler mechanism (step motor <strong>and</strong> gear<br />
speed), low power consumption from the motor <strong>and</strong> electric system <strong>and</strong> as sensors are not advisable<br />
to be used in Malaysian climatic conditions because of the heavy cloud cover. Sudden change in sky<br />
condition might interrupt the signal to the sensor.<br />
The system in this experiment is design to support the three types of PV panels which allowed it to<br />
move with single degree of freedom (horizontally) according to the sun’s orientation (sunrise to sunset)<br />
from east to west. Studies on sun’s movement in equator countries have been conducted to indicate<br />
the sun‘s position on site (azimuth <strong>and</strong> altitude angle) using the Stereographic diagram. Figure 1<br />
show, the basic diagram of the panel’s movement according to sun’s position in morning, noon <strong>and</strong><br />
evening. This movement allowed the PV panels to set perpendicularly toward the sun insolation<br />
(incoming solar radiation) so that solar rays can be optimized from morning until evening.<br />
(a) (c)<br />
(b)<br />
Figure 1. (a) Panels oriented towards morning sun. (b) Panels oriented directly under mid<br />
afternoon sun. (c) Panels oriented towards afternoon sun
160<br />
International <strong>Building</strong> & <strong>Infrastructure</strong> Technology Conference<br />
7-8 June 2011, Vistana Hotel, Penang, Malaysia<br />
With the clock running, the electrical motors control the drives of the panel’s support structure to the<br />
desired position. The electrical motor run at every 30 minutes, in order to orientate the panel support<br />
structure to the position. The runtime of this process was done between 09:00 <strong>and</strong> 16:00 at local time<br />
(daylight saving) or in local time between 8:00 <strong>and</strong> 15:00. The st<strong>and</strong>ard position of the panel was<br />
programmed in the motor control mode, starting from 09:00 (local daylight saving) at 60 o East. At<br />
23:00 (daylight saving) of each day it comm<strong>and</strong>ed the panel’s structure to the st<strong>and</strong>ard position <strong>and</strong><br />
starting at 09:00 (local daylight saving) on the next day, the microcontroller sends the comm<strong>and</strong> every<br />
30 minutes to the motor, to move them in the desired position. With this control mechanism, the PV<br />
panels will be orientated toward the sun to maximize the insolation on the PV panels at every 30<br />
minutes between 09:00 <strong>and</strong> 16:00 every day. The three types of PV installed are exposed to condition<br />
which are exactly identical, which is during the same period, with identical st<strong>and</strong> <strong>and</strong> near to each<br />
other, so all the three type of PV panels received the same solar radiation, so readings can be<br />
compared to verify the efficiency of the panels under the northern region climatic conditions. All the<br />
reading or parameters produced by the installed photovoltaic panels was stored in data logger in the<br />
control room every 15 minutes. In this installation, the right three rows are installed with amorphous<br />
solar panels, the middle three rows are the mono-crystalline <strong>and</strong> the left three rows are installed with<br />
polycrystalline panels with its own specification as mention in Table 1.<br />
INSTALLED PANEL SPEC<br />
Table 1. Specification of three type of PV panels installed<br />
Detail Poly Crystalline Mono Crystalline Amorphous<br />
Module Efficiency (lab test) 12.11% 13.7% 8.10%<br />
Maximum Power Output 80 W 180 W 115 W<br />
Dimension (WxHxD) 545 x 1214 x 35 mm 1,318 x 994 x 46mm 1,009 x 1,409 x 46 mm<br />
Front Cover Material Low iron temperd glasses white tempered glass Cover glass‐less<br />
Type of Cell<br />
Square 126 mm, Poly Crystal<br />
Monocrystalline silicon solar<br />
cells, 155.5mm square<br />
a-Si/μc-Si (T<strong>and</strong>em)<br />
Weight 9 Kg 16.0kg 19kg<br />
Open Circuit Voltage : Voc 21.6 V 30 V 238 V<br />
Short Circuit Current : Isc 5.15 A 8.37 A 0.810 A<br />
Max Power Voltage : Vpm 17.3 V 23.7 V 174 V<br />
Max Power Current : lpm<br />
Price<br />
4.63 A 7.6 A 0.661 A<br />
Supplier SHARP (NE‐080T1J) SHARP (NUS0E3E) SHARP (NA‐F115A5)<br />
Maximum Power Output<br />
Installed<br />
160 W 180 W 230 W<br />
Area of Modul Installed, Pmp<br />
(m 2 )<br />
1.32m 2<br />
1.31m 2<br />
2.84m 2<br />
Number of Panel Installed 2 panel 1 panel 2 panel<br />
There are 4 parameters were collected from each of the photovoltaic module for each stage of this<br />
experiment, that is Current (A), Voltage (V), Module temperature ( o C) <strong>and</strong> Power (W). While<br />
parameters to determine the environmental condition that influences the performance of photovoltaic<br />
module is Solar Radiation (W/m 2 ) <strong>and</strong> Ambient Temperature ( o C). Power output efficiency, average<br />
daily module efficiency <strong>and</strong> performance ration have been used to measure the performance of each<br />
type of the panels installed by using the equation below:<br />
ŋp Power output efficiency (%)<br />
ŋp = (Pmea / Pmax) x 100%<br />
Pmea Average power output (W) measured on site in the given period.<br />
Pmax Maximum power output (W) of panel.
Peve.mea<br />
ŋeve = X 100%<br />
161<br />
International <strong>Building</strong> & <strong>Infrastructure</strong> Technology Conference<br />
7-8 June 2011, Vistana Hotel, Penang, Malaysia<br />
ŋeve Average module efficiency (%)<br />
Peve.mea Average power output (W) measured on site in the given period.<br />
H Average incident radiation (W/m2) on site in the given period.<br />
PVA Surface area (m 2 )<br />
PR =<br />
PVA.H<br />
Peve.mea H<br />
PR Performance Ratio<br />
Peve.mea Average power output (W) measured on site in the given period.<br />
Pmax Maximum power output (W) of panel.<br />
H Average incident radiation (W/m2) on site in the given period.<br />
GSTC Irradiance at STC (W/m 2 ) = 1000W/m 2<br />
Pmax GSTC<br />
3. RESULT AND DISCUSSION<br />
The performance of each solar module cannot be obtained by observing the power output of the<br />
module because each type of photovoltaic module has different efficiency, Therefore, the power<br />
output efficiency have to be normalize to the ratings of each module should be use in order to<br />
compare them. The output efficiency will show how much power is actually generate at a specific time<br />
over the installed capacity of the module. (N.Amin et al, 2009)<br />
Figure 2. Power Output Efficiency, Solar Radiation – Time for day 1.
162<br />
International <strong>Building</strong> & <strong>Infrastructure</strong> Technology Conference<br />
7-8 June 2011, Vistana Hotel, Penang, Malaysia<br />
Figure 3. Power Output Efficiency, Solar Radiation – Time for day 2.<br />
Figure 2 shows the normalized power output efficiency for day 1 with an average solar radiation<br />
796.16W/m 2 . With this amount of average solar radiation per day, it was consider a sunny day when<br />
most of the time the solar radiation are above 600W/m 2 . It can be seen that, poly-crystalline panel<br />
produced more power than mono-crystalline <strong>and</strong> amorphous panels in high insolation. Poly-crystalline<br />
<strong>and</strong> mono-crystalline power outputs are inclining almost at the same rate as solar radiation, while<br />
amorphous power output is at low level almost at the same level from 10:30 to 15:15. The average<br />
performances of poly-crystalline, mono-crystalline <strong>and</strong> amorphous on day 1 are 52.35%, 40.90% <strong>and</strong><br />
19.65% (respectively).<br />
Meanwhile in Figure 3, average solar radiation in day 2 was below 600W/m 2 <strong>and</strong> it was considered a<br />
cloudy day. By looking at the solar radiation trend line, the amount of solar radiation was fluctuated<br />
<strong>and</strong> slowly decreased between 11:30 to15:00. The result of power output efficiency in day 2 shows<br />
that amorphous silicon cell created more energy than poly-crystalline <strong>and</strong> mono-crystalline cell with<br />
average power output efficiency 14.63% for amorphous, 11.58% for poly-crystalline <strong>and</strong> only 8.09%<br />
for mono-crystalline panel.<br />
Figure 4. Power Output Efficiency, Solar Radiation – Time for day 3.
163<br />
International <strong>Building</strong> & <strong>Infrastructure</strong> Technology Conference<br />
7-8 June 2011, Vistana Hotel, Penang, Malaysia<br />
The same trends also occur in day 3 regarding the power output efficiency for each type of<br />
photovoltaic panels. Figure 4 shows, that amorphous panel (10.28% in average) produced higher<br />
power output compared to poly-crystalline (7.33%) <strong>and</strong> mono-crystalline panels (3.53%). The average<br />
of solar radiation is also below 600W/m 2 , which is considered a cloudy day. From the graph it can be<br />
seen that, in morning hour before 10:45, the power output of poly-crystalline was much higher than<br />
mono-crystalline <strong>and</strong> amorphous panel, but after 10:45 the trend was reversed. Amorphous power<br />
output increased gradually while poly-crystalline <strong>and</strong> mono-crystalline panels decreased slowly toward<br />
that evening.<br />
Figure 5. Power Output Efficiency, Solar Radiation – Time for day 4.<br />
By observing the graph in Figure 5, it can be seen that the solar radiation in day 4 were very high most<br />
of the time with average 807.49W/m 2 <strong>and</strong> it was increase gradually from 9:00 until 13:00, but after<br />
13:00 the solar radiation level was fluctuated until 16:00 due to the present of scattered cloud cover.<br />
The trend line of solar radiation also affected the power output efficiency for poly-crystalline <strong>and</strong> monocrystalline.<br />
During day 4, poly-crystalline panel produced higher power output with average efficiency<br />
of power output 50.08%, while mono-crystalline <strong>and</strong> amorphous (39.02% <strong>and</strong> 14.28% of average<br />
power output efficiency, respectively).<br />
Efficiency in photovoltaic solar panels is measured by the ability of a panel to convert sunlight into<br />
usable energy for human consumption. Knowing the efficiency of a panel is important in order to<br />
choose the correct panels for photovoltaic system. The panel efficiency determines the power output<br />
of a panel per unit of area. Figure 6 shows the bar graph for daily module efficiency for each type of<br />
solar panels by using single axis time/date solar tracker in 4 days period. It can be seen that, the daily<br />
module efficiency for poly-crystalline module is the highest compare to mono-crystalline <strong>and</strong><br />
amorphous solar module in 4 days period with efficiency 7.97% (day 1), 3.49% (day 2), 2.41% (day 3)<br />
<strong>and</strong> 7.52% (day 4). However there are differences in module efficiency between mono-crystalline <strong>and</strong><br />
amorphous solar module. As shows in graph, mono-crystalline module efficiency in day 1 (7.06%) <strong>and</strong><br />
day 4 (6.64%) shows a significant higher efficiency compared to amorphous, which is 2.00% <strong>and</strong><br />
1.43%, respectively. While in day 2 <strong>and</strong> day 3, amorphous solar module shows a slightly better<br />
efficiency than mono-crystalline solar module.
Figure 6. Module efficiency – Day.<br />
164<br />
International <strong>Building</strong> & <strong>Infrastructure</strong> Technology Conference<br />
7-8 June 2011, Vistana Hotel, Penang, Malaysia<br />
Figure 7. Performance ratio of each type of photovoltaic panel using single-axis time/date<br />
solar tracker.<br />
The performance ratio is one of the most important variables for evaluating the efficiency of a PV. The<br />
performance ratio is the ratio of the actual <strong>and</strong> theoretically possible energy outputs. It is largely<br />
independent of the location of a PV being measure <strong>and</strong> the incident solar irradiation on the PV. Figure<br />
7 shows the Performance Ratio of each type of photovoltaic panels in this experiment by using singleaxis<br />
time/date solar tracker. From the graph, it can be seen that, the Performance Ratio for polycrystalline<br />
solar module is 0.14 higher compare to mono-crystalline. While Performance Ratio for<br />
amorphous solar module is the lowest. From this experiment, it can be conclude that poly-crystalline<br />
solar module are most suitable type of photovoltaic module to be used under Malaysian climate<br />
condition when applying single-axis time/date solar tracker.<br />
4. CONCLUSIONS<br />
Developing a clean <strong>and</strong> renewable energy helps Malaysia safeguard its depleting energy resources.<br />
With the introduction of photovoltaic system <strong>and</strong> Malaysian climate condition which is almost<br />
predictable with the availability of 6 hours of direct sunlight per day with average solar radiation<br />
between 800 W/m 2 to 1000 W/m 2 , provide a suitable condition to consider solar power as a promising<br />
renewable energy for Malaysia. Poly-crystalline, mono-crystalline <strong>and</strong> amorphous are types of PV<br />
panels most commonly use in Malaysia with different characteristic <strong>and</strong> efficiency. In this research, a<br />
solar tracker device (single-axis time/date) are being used to maximize the usage of sunlight in<br />
morning <strong>and</strong> afternoon performance to create more efficient solar energy by oriented the PV panels<br />
towards the sun’s rays which incident on them from the normal direction. Poly-crystalline solar cell<br />
performed better in high level of solar radiation per day compared to amorphous <strong>and</strong> mono-crystalline.<br />
Meanwhile, during low intensity of solar radiation, amorphous solar cells efficiency is higher than the<br />
other two types of PV panel.
165<br />
International <strong>Building</strong> & <strong>Infrastructure</strong> Technology Conference<br />
7-8 June 2011, Vistana Hotel, Penang, Malaysia<br />
In built environment, by replacing the conventional type of solar installation with solar tracking<br />
installation, it’s not only increase the performance of the PV panels installed but also, it can be<br />
integrate to the overall building design as part of <strong>Building</strong> Integrated Photovoltaic (BiPV) to perform<br />
specific function to the building envelope (e.g., provide shades on top of parking lot, minimize direct<br />
heat from sun at roof top, minimize direct sunlight for natural lighting). Besides that, the quantity of PV<br />
panels installed at the building can be reduced by using the solar tracking installation compare to the<br />
conventional type of installation (fixed installation). Hence these will influence the cost of the overall<br />
construction of the building. The combination of new green technology <strong>and</strong> well-design building will<br />
provides opportunities for sustainable building that not only energy efficient but also create a better<br />
environment.<br />
REFERENCES<br />
A.J. Carr, T.L. Pryor (2004) A comparison of the performance of different PV module types in<br />
temperate climates. Solar Energy 76 (2004). P:285–294. Available from World Wide Web:<br />
www.sciencedirect.com<br />
Abdallah S, Badran OO (2008). Sun tracking system for productivity enhancement of solar still.<br />
Desalination 2008;220:669–76<br />
Akhmad, K., Kitamura, A., Yamamoto, F., Okamoto, H.,Takakura, H., Hamakawa, Y., (1997). Outdoor<br />
performance of a-Si <strong>and</strong> p-Si modules. Solar Energy Materials <strong>and</strong> Solar Cells 46, 209–218.<br />
An<strong>and</strong> M.Sharan. (2008) Efficiency enhancement of stationary solar energy based power conversion<br />
system in Canada.Applied Energy.[Online].86(2009).p.1. Available from World Wide Web:<br />
www.elsevier.com/locate/apenergy<br />
APEC Energy Dem<strong>and</strong> <strong>and</strong> Supply Outlook 2006<br />
Appleyard, D. (2009) Solar Tracker: Facing the Sun. Renewable energy World Magazine. London, UK.<br />
Vol. 12(13)<br />
Deo Prasad & Mark Snow. (2005) Designing With Solar Power: A Source Book For<br />
<strong>Building</strong> Integrated Photovoltaic (BiPV). London: Earthscan. P.23<br />
Francisco Duarte, Pedro Dinis Gaspar <strong>and</strong> Luís Carrilho Gonçalves,” Two axis solar tracker based on<br />
solar maps, controlled by a low-power Microcontroller”, International Conference on Renewable<br />
Energies <strong>and</strong> Power Quality (ICREPQ’10) Granada (Spain), 23rd to 25th March, 2010.<br />
Kamaruddin, R., B.J. Bailey <strong>and</strong> J.I. Montero, 2002. A naturally ventilation Greenhouse for temperate<br />
vegetable production in the tropics. Acta Horticulture, pp:578.<br />
Mieke, W., (1998). Hot climate performance comparison between poly-crystalline <strong>and</strong> amorphous<br />
silicon cells connected to an utility mini-grid. In: Proceedings of Solar 98, 36th Annual Conference of<br />
the Australian <strong>and</strong> New Zeal<strong>and</strong> Solar Energy Society, Christchurch, New Zeal<strong>and</strong>, pp. 464-470.<br />
Nowshad Amin, Chin Wen Lung, Kamaruzzaman Sopian. (2009) A practical field study of various solar<br />
cells on their performance in Malaysia. Renewable Energy.[Online]. 34(2009).<br />
Thomas Markvart. (1994) Solar Electricity. West Sussex: John Wiley & Sons. P.1
T135<br />
166<br />
International <strong>Building</strong> & <strong>Infrastructure</strong> Technology Conference<br />
7-8 June 2011, Vistana Hotel, Penang, Malaysia<br />
FINITE ELEMENT MODELLING OF RC BEAMS WITH LARGE OPENING AT<br />
CRITICAL FLEXURE AND SHEAR STRENGTHENED WITH CFRP LAMINATES<br />
Chin S.C 1 , Shafiq N. 2 <strong>and</strong> Nuruddin M.F. 3<br />
1, 2, 3 Universiti Teknologi Petronas, Perak, Malaysia<br />
1 brigitchin@gmail.com, 2 nasirshafiq@petronas.com.my, 3 fadhilnuruddin@petronas.com.my<br />
ABSTRACT: Pipes <strong>and</strong> ducts are provided to accommodate essential services that are required in a<br />
building, namely power supply, sewerage, air-conditioning, water supply, telephone cable <strong>and</strong><br />
computer network. Traditionally, pipes <strong>and</strong> ducts are usually hung below the beams <strong>and</strong> formed a<br />
“dead space” in a building. An option is to pass these pipes <strong>and</strong> ducts through openings in reinforced<br />
concrete (RC) beam. In the design stage, design engineers provide sufficient strength <strong>and</strong> ensure<br />
serviceability in beams with opening. However, M&E contractors usually request to drill an opening in<br />
order to simplify the pipe arrangements during construction stage which were not considered in the<br />
design. This causes problem to structural engineers especially when the required opening is located at<br />
critical section in an existing beam. This paper presents a two dimensional non-linear finite element<br />
analysis to study the behaviour of externally strengthened RC beams with large opening at section<br />
with critical flexure <strong>and</strong> shear using carbon fiber reinforced polymer (CFRP) laminates. The numerical<br />
results were validated with the experimental testing of nine beams which included a control beam, four<br />
un-strengthened <strong>and</strong> four strengthened beams. The numerical modelling was conducted using a nonlinear<br />
finite element (FE) program, ATENA. In this FE program, tensile behaviour of concrete is<br />
modelled by nonlinear fracture mechanics combined with the crack b<strong>and</strong> method in which smeared<br />
crack concept is adopted. All the beam specimens had a cross section of 120x300 mm with an<br />
effective span of 1800 mm. The beams were loaded to failure under four point bending. The<br />
parameters included the size, location <strong>and</strong> shape of opening. The crack patterns, load deflection<br />
curves at mid-span <strong>and</strong> ultimate load were compared with the experimental results. Generally, good<br />
agreement has been obtained between the numerical analysis <strong>and</strong> experimental results. The finite<br />
element analysis can be useful to design a suitable strengthening configuration for RC beams with<br />
large openings at critical location by optimal application of CFRP laminates.<br />
Keywords: CFRP Laminates, Finite Element Modelling, Large Opening, RC beams<br />
1. INTRODUCTION<br />
Utility pipes <strong>and</strong> ducts are provided to accommodate essential services in a building namely electricity<br />
cable, sewerage, air-conditioning, water supply, telephone cable <strong>and</strong> computer network. Openings are<br />
provided in RC beams to allow for the passage of pipes <strong>and</strong> ducts to eliminate dead space <strong>and</strong><br />
produce a more compact <strong>and</strong> economical design. However, providing openings in a RC beam<br />
changes the simple beam behaviour to a more complex behaviour. The presence of openings in the<br />
web of a RC beam reduces beam stiffness, cause excessive cracking <strong>and</strong> deflection <strong>and</strong> severely<br />
affects the strength of the beam (Mansur & Tan, 1999). Thus, sufficient strength <strong>and</strong> serviceability<br />
provision need to be ensured by design engineers during the design stage. In order to reduce cost <strong>and</strong><br />
time, M&E contractors often prefer to simplify the pipe <strong>and</strong> ducts arrangements during construction.<br />
Problems arise when M&E contractors request to create an opening at a location in the existing<br />
structure which is not considered in the design.<br />
External strengthening with fiber reinforced polymer (FRP) laminates is well known as external<br />
reinforcement for the strengthening or rehabilitation of reinforced concrete structures. Numerous<br />
experimental investigations have shown that externally bonded FRPs can be used to improve flexural<br />
<strong>and</strong> shear capacities, significantly increase the stiffness <strong>and</strong> load carrying capacity of a member<br />
(Wong & Vecchio, 2003). FRP laminates have many advantages including excellent corrosion<br />
resistance, high strength-to-weight ratio, good fatigue properties <strong>and</strong> low in weight which ease the<br />
installation process <strong>and</strong> time saving. The most common types of FRP available in the concrete
167<br />
International <strong>Building</strong> & <strong>Infrastructure</strong> Technology Conference<br />
7-8 June 2011, Vistana Hotel, Penang, Malaysia<br />
industry are made with carbon, aramid or glass fibers. The FRPs are usually in the form of sheets or<br />
laminates. These materials were applied by bonding it to the external surfaces of the beams with<br />
different configurations <strong>and</strong> layouts (Allam, 2005; Madkour, 2009).<br />
Various investigations ( Li et al., 2001; Allam & Ebeido, 2003; Islam et al., 2005) have been carried out<br />
by using FRP laminates as external strengthening at flexure <strong>and</strong> shear in reinforced concrete beams.<br />
However, very little research effort (Mansur et al., 1999; Abdalla et al., 2003; Allam, 2005; El<br />
Maaddawy & Sherif, 2009) focuses towards the study of strengthening of beams provided with<br />
openings. Also, little attention has been paid to web opening strengthening in beams in terms of<br />
numerical approach (Pimanmas, 2010). According to literature, it is essential to investigate <strong>and</strong> predict<br />
the complex behaviour of the strengthened reinforced concrete structure before <strong>and</strong> after using FRP<br />
with the usage of highly sophisticated numerical model (Madkour, 2009).<br />
In this paper, a two dimensional non-linear finite element analysis was conducted to study the<br />
behaviour of strengthened RC beams with large circular <strong>and</strong> square openings at critical flexure <strong>and</strong><br />
shear sections using carbon fiber reinforced polymer (CFRP) laminates. The crack patterns of the four<br />
un-strengthened beams were analyzed <strong>and</strong> a suitable strengthening configuration for each beams<br />
were designed <strong>and</strong> modelled in the numerical modelling. An experimental study was performed to<br />
validate the modelling results. The main investigated parameters were shape, size <strong>and</strong> location of<br />
opening.<br />
2. NONLINEAR FINITE ELEMENT ANALYSIS<br />
A two dimensional (2D) nonlinear FE analysis was carried out using ATENA, a nonlinear FE program<br />
developed by Červenka Consulting (V. Červenka et al., 2010). In the FE program, concrete was<br />
represented by the SBETA material model. The tensile behaviour of concrete is modelled by nonlinear<br />
fracture mechanics combined with the crack b<strong>and</strong> method, whereby the smeared crack concept is<br />
adopted. The rotated crack model was used in this study (Franca et al., 2007). The beam specimens<br />
were modelled in full scale mode. Stirrups, reinforcement bars <strong>and</strong> CFRP laminates were represented<br />
by bar reinforcement elements. Meshing was performed using quadrilateral “CCIsoQuad” element<br />
type. Newton-Raphson solution method was used to solve for the nonlinear behaviour of the full scale<br />
beams (V. Červenka, 1999; J. Červenka, 2001; V. Červenka et al., 2002; V. Červenka & J. Červenka,<br />
2006).<br />
2.1 Numerical Modelling<br />
The FE modelling was conducted on simply supported RC beams with dimensions of 120x300x2000<br />
mm. The reinforced concrete beams were comprised of (i) a control beam, (ii) four un-strengthened<br />
beams with large circular <strong>and</strong> square openings in flexure <strong>and</strong> shear location <strong>and</strong> (iii) four strengthened<br />
beams with large circular <strong>and</strong> square openings in flexure <strong>and</strong> shear location with CFRP laminates.<br />
The openings provided were circular <strong>and</strong> square with the size of ø230 mm <strong>and</strong> 210x210 mm<br />
respectively. The openings were placed at a critical location; zero distance from the support at both<br />
ends for shear. Meanwhile, the opening was placed at mid-span of the beam for flexure. The loads<br />
were applied to a spreader beam that distributed to two point loads which located symmetrically.<br />
3. RESULTS AND DISCUSSIONS<br />
Finite element modelling was conducted onto control beam <strong>and</strong> four un-strengthened reinforced<br />
concrete beams with large openings. The results of FEM were compared with the experimental<br />
results. Crack pattern results of un-strengthened beams with large openings at flexure <strong>and</strong> shear were<br />
presented <strong>and</strong> discussed. The un-strengthened beams with large circular <strong>and</strong> square openings at<br />
flexure respectively were known as “C-flexure” <strong>and</strong> “S-flexure” while beams with large circular <strong>and</strong><br />
square openings at shear respectively were “C-shear” <strong>and</strong> “S-shear”.<br />
3.1 Control beam<br />
The comparison of crack patterns is shown in Figure 1(a). A good match of crack patterns was<br />
observed. The analysis predicts several flexural cracks at the mid-span <strong>and</strong> large shear cracks were<br />
found at shear similar as the experiment result. The load deflection curve is illustrated in Figure 4(a). It<br />
was observed that the load deflection curve trend of FEM matches well with the experimental result.
3.2 Un-strengthened beams<br />
a. Beam C-flexure<br />
168<br />
International <strong>Building</strong> & <strong>Infrastructure</strong> Technology Conference<br />
7-8 June 2011, Vistana Hotel, Penang, Malaysia<br />
The crack patterns of beam C-flexure was compared in Figure 1(b). From the FEM simulated<br />
results, it was observed that stress was highly concentrated around the opening provided with<br />
concentrated flexural cracks formed at the bottom chord of the opening <strong>and</strong> along the midspan.<br />
The cracks eventually appeared as diagonal shear cracks formed from the point load<br />
towards the support. A good agreement with the experimental crack patterns was observed.<br />
b. Beam S-flexure<br />
The FEM crack pattern results of beam S-flexure were compared <strong>and</strong> shown in Figure 1(c).<br />
Concentrated stress were seen at the top chord above the square opening in FEM, between<br />
two point loads, similarly in the experimental result. Cracks were found at the bottom chord of<br />
the opening <strong>and</strong> eventually diagonal shear cracks were formed. The crack patterns in FEM<br />
matches well with the experimental results.<br />
c. Beam C-shear<br />
The crack pattern results of beam C-shear in FEM were compared to the experimental results<br />
as shown in Figure 1(d). It was observed that the FEM simulated cracks penetrated from an<br />
angle diagonally through the opening <strong>and</strong> to the support, at both the circular openings at<br />
shear. The crack pattern of FEM is in good agreement with the experimental results.<br />
d. Beam S-shear<br />
The crack pattern of FEM <strong>and</strong> experimental results of beam S-shear is shown in Figure 1(e).<br />
It was found that the FEM predicted cracks were first initiated at four corners of the square<br />
opening <strong>and</strong> propagated through the top <strong>and</strong> bottom chord. Similarly in the experimental<br />
results, the cracks caused crushing of concrete at the top <strong>and</strong> bottom chord of the opening.<br />
The crack pattern of FEM matches well with the experimental crack pattern.
169<br />
International <strong>Building</strong> & <strong>Infrastructure</strong> Technology Conference<br />
7-8 June 2011, Vistana Hotel, Penang, Malaysia<br />
Figure 1. Crack pattern results of un-strengthened beams in FEM <strong>and</strong> experiment<br />
3.3 Strengthened beams<br />
(a) Control beam (FEM) (a) Control beam (Exp.)<br />
(b) C-flexure (FEM) (b) C-flexure (Exp.)<br />
(c) S-flexure (FEM)<br />
(d) C-shear (FEM)<br />
(e) S-shear (FEM)<br />
(c) S-flexure (Exp.)<br />
(d) C-shear (Exp.)<br />
(e) S-shear (Exp.)<br />
Based on the crack pattern results, a suitable strengthening configuration was designed for “Cflexure”,<br />
“S-flexure”, “C-shear” <strong>and</strong> “S-shear”. The strengthening configuration for each beam is shown<br />
in Figure 2. In this paper, the strengthened RC beams with large circular <strong>and</strong> square openings in<br />
flexure using CFRP laminates were known as “C-flexure cfrp” <strong>and</strong> "S-flexure cfrp”; while the<br />
strengthened beams with large circular <strong>and</strong> square openings in shear were “C-shear cfrp” <strong>and</strong> “Sshear<br />
cfrp”. The results of crack pattern <strong>and</strong> load deflection curve of the strengthened beams with<br />
FEM <strong>and</strong> experiment were presented <strong>and</strong> discussed. The results of FEM were compared with the<br />
experimental results.
170<br />
International <strong>Building</strong> & <strong>Infrastructure</strong> Technology Conference<br />
7-8 June 2011, Vistana Hotel, Penang, Malaysia<br />
Figure 2. Strengthening configuration of beams with large openings in flexure <strong>and</strong> shear<br />
a. Beam C-flexure cfrp<br />
The beam C-flexure cfrp was strengthened externally by CFRP laminates around the opening<br />
with the design configuration shown in Figure 2(a). A comparison between FEM <strong>and</strong><br />
experimental crack patterns are shown in Figure 3(a). It was observed that the failure in the<br />
experiment was initiated from the point load penetrated diagonally towards the support away<br />
from CFRP laminates. Similar to the experiment, the FEM predicted that the diagonal cracks<br />
propagated from the point load towards the support. This is due to CFRP laminates disturb the<br />
path of crack propagation which required a higher energy to extend the crack in a diverted<br />
direction. The comparison of FEM <strong>and</strong> experimental load deflection curve is illustrated in Figure<br />
4(b). The load deflection curve of control beam is shown in Figure 4(a) for comparison<br />
purposes. With the strengthening configuration, both FEM <strong>and</strong> experimental beam have<br />
significantly restored the control beam original capacity. However, both ultimate load of FEM<br />
<strong>and</strong> experimental beam exceeded the original beam capacity, about 52% <strong>and</strong> 42% respectively.<br />
b. Beam S-flexure cfrp<br />
Beam S-flexure cfrp was strengthened by placing the CFRP laminates inside the square<br />
opening <strong>and</strong> at the tension zone of the beam. The strengthening configuration is shown in<br />
Figure 2(b). The comparison of crack pattern is shown in Figure 3(b). FEM predicted large<br />
diagonal shear cracks formed from the point load to the area without the existence of CFRP<br />
laminates <strong>and</strong> predicted wide cracks to appear at the edge of CFRP laminates located at the<br />
tension zone. Similarly, in the experimental results, the beam failed with wide diagonal cracks<br />
formed from the point load <strong>and</strong> peeling of concrete with CFRP at the tension zone was<br />
observed. The FEM also predicted that the stress were concentrated at the top chord above the<br />
opening which caused crushing of concrete in the experimental program. The crack pattern of<br />
FEM is in good agreement with the experimental results. The results of load deflection curve are<br />
compared in Figure 4(c). It was observed that the load deflection curve of FEM was almost<br />
similar to the load deflection curve of experiment, with a difference of 7%. Comparing to the load<br />
deflection curve of control beam in Figure 4(a), strengthening with the design configuration in<br />
the experiment was able to re-gain 74% of the control beam original capacity.<br />
c. Beam C-shear cfrp<br />
(a) C-flexure cfrp<br />
(b) S-flexure cfrp<br />
(c) C-shear cfrp<br />
(d) S-shear cfrp<br />
CFRP laminates were placed around both circular openings at shear location at the support<br />
according to the design strengthening configuration as shown in Figure 2(c). The comparison of<br />
FEM <strong>and</strong> experimental results is illustrated in Figure 3(c). As simulated by FEM, diagonal cracks<br />
appeared at the top chord above the circular opening <strong>and</strong> at the bottom chord near the support.<br />
Stress was concentrated at the diagonal cracks at the top <strong>and</strong> bottom of openings while<br />
concentrated flexural cracks were observed along the mid-span of the beam. As predicted in<br />
FEM, the failure of experimental beam was horizontal crack near the point load which<br />
propagated through the opening at the top chord <strong>and</strong> a diagonal crack was observed from the<br />
opening towards the support. The diagonal crack eventually turned into a horizontal crack due<br />
to the resistance of CFRP laminates at the top chord. The formation of diagonal crack at the
171<br />
International <strong>Building</strong> & <strong>Infrastructure</strong> Technology Conference<br />
7-8 June 2011, Vistana Hotel, Penang, Malaysia<br />
bottom chord caused peeling of CFRP laminates. The flexural cracks at the mid-span of the<br />
experimental beam were not significant. The comparison of FEM <strong>and</strong> experimental load<br />
deflection is shown in Figure 4(d). It was found that the ultimate load of FEM almost double the<br />
experimental result. The possible reason may due to the mix mode of shear <strong>and</strong> flexure failure<br />
in FEM as massive flexural cracks were observed, as shown in Figure 3(c). In the experiment,<br />
strengthening with the design configuration was only able to re-gain 35% of the control beam<br />
original capacity.<br />
d. Beam S-shear cfrp<br />
The strengthening configuration designed to strengthen beam with large square openings at<br />
shear located at the support is illustrated in Figure 2(d). The CFRP laminates were wrapped<br />
around both the square openings. The crack pattern results of FEM <strong>and</strong> experimental results<br />
were compared <strong>and</strong> illustrated in Figure 3(d). Based on the FEM results, horizontal cracks were<br />
seen internally at the top chord near the point load <strong>and</strong> at bottom chord near the support. It was<br />
observed that minor flexural cracks formed at the mid-span of the beam. In the experimental<br />
results, the beam failed in a different mode compared to the un-strengthened square opening,<br />
S-shear. With the presence of CFRP around the opening in this strengthening configuration, the<br />
beam failed at a weaker point at a connection between two CFRP laminates, as shown in Figure<br />
3(d) S-shear (Exp.). The beam failed with a diagonal crack penetrated near the point load to the<br />
corner of the square opening <strong>and</strong> crushing of concrete with CFRP laminates at the bottom chord<br />
of the same square opening at shear, as predicted by FEM. Similar in the FEM, minor cracks<br />
were observed in the mid-span of the beam. The comparison of FEM <strong>and</strong> experimental results<br />
of load deflection is illustrated in Figure 4(e). From the figure, it was observed that the curve<br />
trend of FEM was almost similar to the curve trend of experiment. With the design strengthening<br />
configuration, the simulated beam could achieve about 57% of the simulated control beam<br />
capacity while in experiment; the beam could only re-gain 33% of the control beam original<br />
capacity.<br />
In general, the load deflection curve of FEM in all the beams showed a higher stiffness<br />
compared to the load deflection curve of the experimental beam. The possible reasons may be<br />
due to the highly heterogeneous nature of the concrete <strong>and</strong> the inaccurate position of the steel<br />
reinforcement bars in the experimental program (Franca et al., 2007).
(a) C-flexure cfrp (FEM)<br />
(b) S-flexure cfrp (FEM)<br />
(c) C-shear cfrp (FEM)<br />
(d) S-shear cfrp (FEM)<br />
172<br />
International <strong>Building</strong> & <strong>Infrastructure</strong> Technology Conference<br />
7-8 June 2011, Vistana Hotel, Penang, Malaysia<br />
(a) C-flexure cfrp (Exp.)<br />
(b) S-flexure cfrp (Exp.)<br />
(c) C-shear cfrp (Exp.)<br />
(d) S-shear cfrp (Exp.)<br />
Figure 3. Crack pattern results of strengthened beams in FEM <strong>and</strong> experiment
173<br />
International <strong>Building</strong> & <strong>Infrastructure</strong> Technology Conference<br />
7-8 June 2011, Vistana Hotel, Penang, Malaysia<br />
Figure 4. Comparison of load deflection curves between finite element <strong>and</strong> experimental control <strong>and</strong><br />
strengthened beams<br />
4. CONCLUSIONS<br />
(b) C-flexure cfrp<br />
(d) C-shear cfrp<br />
(c) S-flexure cfrp<br />
Based on results <strong>and</strong> discussion, the following conclusions are made:<br />
1. The strengthening behaviour of RC beams with large opening at critical flexure <strong>and</strong> shear using<br />
CFRP laminates was modelled by a non-linear finite element programme, ATENA. The crack<br />
pattern results were found in good agreement with the experimental results.<br />
2. Strengthening of large circular <strong>and</strong> square openings in flexure zone could significantly restore 74-<br />
100% of the beam original capacity, while strengthening of large circular <strong>and</strong> square openings in<br />
shear zone could only re-gain the beam capacity to about 33-35% of the original beam strength.<br />
3. The beam with large circular opening in flexure zone with the design strengthening configuration<br />
could significantly restore 100% of the beam original capacity compared to beam with large<br />
square opening in flexure, which could only re-gain 74% of the control beam capacity.<br />
4. The strengthened beams with large circular <strong>and</strong> square openings located at both critical shear<br />
locations at the support could not restore the control beam original capacity.<br />
5. The load deflection curve of FEM simulated beams were almost similar as
load deflection curve of tested beams with a slightly higher in stiffness.<br />
174<br />
International <strong>Building</strong> & <strong>Infrastructure</strong> Technology Conference<br />
7-8 June 2011, Vistana Hotel, Penang, Malaysia<br />
6. Optimum strengthening can be designed using FE simulation to achieve a beam capacity similar<br />
to the control beam with the optimal usage of CFRP.<br />
7. The modelling that was simulated by ATENA non-linear finite element program can be useful as it<br />
is time saving <strong>and</strong> cost effective compared to experimental work. In addition, the errors during the<br />
testing can be prevented.<br />
REFERENCES<br />
Abdalla, H.A., Torkey, A.M., Haggag, H.A. & Abu-Amira, A.F. (2003). Design Against Cracking at<br />
Openings in Reinforced Concrete Beams Strengthened with Composite Sheets. Composite<br />
Structures, vol. 60, no. 2, pp 197-204.<br />
Allam, S.M. (2005). Strengthening of RC Beams with Large Openings in the Shear Zone. Alex<strong>and</strong>ria<br />
Engineering Journal, vol. 44, no. 1, pp 59-78.<br />
Allam, S.M. & Ebeido, T.I. (2003). Retrofitting of RC Beams Predamaged in Shear using CFRP<br />
Sheets. Alex<strong>and</strong>ria Engineering Journal, vol. 42, no. 1, pp 87-101.<br />
Červenka, J. (2001). ATENA Program Documentation Part 4-1 Tutorial for Program ATENA 2D.<br />
Červenka Consulting, May, pp 1-61.<br />
Červenka, V. (1999). Computer Simulation of Failure of Concrete Structures for Practice. (E-328), pp<br />
1-16.<br />
Červenka, V., Červenka, J., Pukl, R. (2002). ATENA – A Tool for Engineering Analysis of Fracture in<br />
Concrete. Sādhāna, vol. 27, part 4, pp 485-492.<br />
Červenka, V. & Červenka, J. (2006). ATENA Program Documentation Part 2-1 User ’ s Manual for<br />
ATENA 2D. Červenka Consulting, November, pp 1-139.<br />
Červenka, V., Jendele, L., Červenka, J., (2010). ATENA Program Documentation Part 1 Theory.<br />
Červenka Consulting, March, pp 1-248.<br />
El Maaddawy, T. & Sherif, S. (2009). FRP Composites for Shear Strengthening of Reinforced<br />
Concrete Deep Beams with Openings. Composite Structures, vol. 89, no. 1, pp 60-69.<br />
Franca, P., Costa, A., Appleton, J. (2007). Prestressed CFRP Laminates for Flexural Strengthening of<br />
Reinforced Concrete Beams. Structural Concrete, vol. 8, no. 4, pp 175-185.<br />
Islam, M.R., Mansur, M.A., Maalej, M. (2005). Shear Strengthening of RC Deep Beams Using<br />
Externally Bonded FRP <strong>Systems</strong>. Cement <strong>and</strong> Concrete Composites, vol. 27, no. 3, pp 413-420.<br />
Li, A., Assih, J., Delmas, Y. (2001). Shear Strengthening of RC Beams with Externally Bonded CFRP<br />
Sheets. Journal of Structural Engineering, vol. 127, no. 4, pp 374-380.<br />
Madkour, H. (2009). Non-linear Analysis of Strengthened RC Beams with Web Openings.<br />
Proceedings Of The Institution Of Civil Engineers, Structures <strong>and</strong> <strong>Building</strong>s, vol. 162, no. 2, pp 115-<br />
128.<br />
Mansur, M.A., Tan, K.H., Wei, W. (1999). Effects of Creating an Opening in Existing Beams. ACI<br />
Structural Journal, vol. 96, no. 6, pp 899-906.<br />
Mansur, M.A. & Tan, K.H. (1999). Concrete Beams with Openings: Analysis <strong>and</strong> Design, CRC Press.<br />
Pimanmas, A. (2010). Strengthening R/C beams with Opening by Externally Installed FRP Rods:<br />
Behavior <strong>and</strong> Analysis. Composite Structures, vol. 92, no. 8, pp 1957-1976.<br />
Wong, R.S.Y. & Vecchio, F.J. (2003). Towards Modeling of Reinforced Concrete Members with<br />
Externally Bonded Fiber-Reinforced Polymer Composites. ACI Structural Journal, vol. 100, no. 1, pp<br />
47-55.
T137<br />
175<br />
International <strong>Building</strong> & <strong>Infrastructure</strong> Technology Conference<br />
7-8 June 2011, Vistana Hotel, Penang, Malaysia<br />
PRELIMINARY STUDY ON STRUCTURAL BEHAVIOUR OF PRECAST<br />
LIGHTWEIGHT FOAMED CONCRETE SANDWICH PANEL<br />
N. Mohamad 1 , A.A.A Samad 2 , W. Adnan 3<br />
1,2,3 Faculty of Civil <strong>and</strong> Environmental Engineering, Universiti Tun Hussein Onn,<br />
Parit Raja, 86400 Batu Pahat, Johor.<br />
1 noridah@uthm.edu.my<br />
ABSTRACT: Affordable quality housing is vital in developing countries to meet its growing population<br />
<strong>and</strong> dem<strong>and</strong>s arising from migration of people to urban areas. Development of a new cost effective<br />
system is crucial to fulfill these dem<strong>and</strong>s. In view of this, a study is carried out to develop a Precast<br />
Lightweight Foamed Concrete S<strong>and</strong>wich Panel (PLFP), as a new affordable building system.<br />
Preliminary experimental investigation to study the structural behaviour of the PLFP panel under axial<br />
load is undertaken. Six number of panels (PLFP-1 to PLFP-6) consist of two lightweight concrete<br />
wythes <strong>and</strong> a polystyrene insulation layer in between the wythes are cast. Four panels are reinforced<br />
with 6 mm mild steel BRC with 200mm x200 mm openings <strong>and</strong> two panels are reinforced with 9mm<br />
diameter high yield steel bars. The reinforcements of both wythes in each panel are tied to each other<br />
through the insulation layer by shear connectors of 6mm <strong>and</strong> 9 mm mild steel bars bent to an angle of<br />
45º. Panels PLFP-5 <strong>and</strong> PLFP-6 are capped with normal concrete at its top <strong>and</strong> bottom end to avoid<br />
end crushing during axial loading. Axial load test was conducted <strong>and</strong> the results are presented here,<br />
which include the crack pattern <strong>and</strong> mode of failure, ultimate loads achieved, <strong>and</strong> load-deflection<br />
profiles. It is observed that the strength of the panels are affected by the compressive strength of the<br />
foamed concrete forming the wythes <strong>and</strong> the presence of concrete capping at panel ends. The<br />
results also indicate that wythes in panels with capping at both ends tend to deflect together in the<br />
same direction.<br />
Keyword: Shear connector, ultimate strength, load-deflection curve, strain distribution, crack<br />
pattern, compositeness<br />
1. Introduction<br />
Precast concrete s<strong>and</strong>wich panel technology has advanced gradually over the past four decades. This<br />
type of panels have been in use for more than 40 years in North America. Prior to 1960, s<strong>and</strong>wich<br />
technology had been confined almost entirely to aerospace applications. By 1960 increasing numbers<br />
of alternative uses were discovered, such as in the building, refrigerated storage, automobile <strong>and</strong><br />
shipbuilding industries. This period was also the beginning of a worldwide boom in prefabricated<br />
building elements for diverse applications. (Davies, 1997)<br />
The aim of this study is to develop a load bearing Precast Lightweight Foamed Concrete S<strong>and</strong>wich<br />
Panels (PLFP) for use as structural component in low-rise building construction. In order for this type<br />
of panel system to be viable as an Industrial <strong>Building</strong> System (IBS), it must satisfy all requirements<br />
such as strength <strong>and</strong> integrity under imposed loads for the intended storey heights such as its ultimate<br />
strength capacity <strong>and</strong> its composite action. Factors that contribute to the strength <strong>and</strong> composite<br />
action are investigated which include the wall slenderness ratio <strong>and</strong> the shear connector’s rigidity. The<br />
degree of compositeness achieved is determined from the capacity of the shear connectors to transfer<br />
the applied load which depends on the diameter of the connector used <strong>and</strong> its orientation.<br />
2. Precast Lightweight Foamed Concrete S<strong>and</strong>wich Panel (PLFP)<br />
The PLFP panels tested consist of two wythes which are made of foamed concrete <strong>and</strong> polystyrene as<br />
a core. The thickness of each concrete wythe is fixed at 40 mm for all panels. The gap between the<br />
concrete wythes had been varied from 20 mm to 70 mm to obtain a variation of overall wall thickness<br />
from 100 mm to 150 mm. Square welded mild steel BRC was used as the longitudinal <strong>and</strong> transverse
176<br />
International <strong>Building</strong> & <strong>Infrastructure</strong> Technology Conference<br />
7-8 June 2011, Vistana Hotel, Penang, Malaysia<br />
reinforcement for both wythes in all panels. Steel shear connectors are tied up to the BRC in each<br />
wythe to strengthen the panel. A typical PCSP with a truss type shear connectors is shown in Figure<br />
1. To take full advantage of the strength of the two wythes <strong>and</strong> to prevent individual wythe buckling,<br />
the shear connectors should be designed to provide for full shear transfer between the two concrete<br />
wythes. The test carried out on connector’s orientation by Pfeifer <strong>and</strong> Hanson (1964) showed that the<br />
diagonal orientation was the most efficient orientation of the shear connectors in taking up the applied<br />
load. Therefore, the diagonal orientation of the shear connectors is adopted in the experiment.<br />
Figure. 1. S<strong>and</strong>wich precast concrete with truss shaped connectors (Lee et al., 2006)<br />
Generally there are three types of PCSP panels. (Shutt ,1997). A non-composite s<strong>and</strong>wich panel is<br />
one in which each concrete wyhte acts independently to resist bending. Plane section behaviour is<br />
obtained in each wythe, but not through the entire panel depth. A fully composite s<strong>and</strong>wich panel is<br />
one in which the two concrete wythes act integrally to resist bending allowing the entire panel to<br />
perform as a single unit. In theory, a fully composite panel exhibits plane section behaviour throughout<br />
its entire depth at all locations along its span. Full composite action is achieved by providing sufficient<br />
horizontal shear transfer between the wythes.<br />
A partially composite s<strong>and</strong>wich panel is one in which concrete wyhtes act atleast partly together to<br />
resist bending. Thus, a partially composite panel resists bending to a degree between that of a fully<br />
composite panel <strong>and</strong> a non-composite panel. The degree of composite action exhibit by a panel may<br />
change throughout the loading history of the panel. The distribution of stress <strong>and</strong> strain for three<br />
types of s<strong>and</strong>wich wall panel is shown on Figure 2.<br />
3. Foamed Concrete<br />
Figure 2. Stress <strong>and</strong> Strain Distribution Of S<strong>and</strong>wich Panel (Shutt, 1997)<br />
Foam concrete is a lightweight material which has been widely used especially in the western<br />
countries. Nowadays, foam concrete technology has been used extensively in construction industries<br />
especially for non-structural building wall panels or as partitions. It is considered as an attractive<br />
material for its lightweight, better thermal properties <strong>and</strong> ease of construction. Based on research
177<br />
International <strong>Building</strong> & <strong>Infrastructure</strong> Technology Conference<br />
7-8 June 2011, Vistana Hotel, Penang, Malaysia<br />
carried out at British Cement Association, an indication on properties of foamed concrete at various<br />
dry densities is as shown in Table 1. The drying shrinkage for foamed concrete is higher than that of<br />
dense concrete. As Table 1 shows, the thermal conductivity is between 5% <strong>and</strong> 30% of that for dense<br />
concrete. The modulus of elasticity is also of a similar order when compared with dense concrete<br />
Dry Density<br />
3<br />
(kg/m )<br />
4. Experimental Programme<br />
Table 1. Properties of Foamed Concrete<br />
The experimental programme includes six PLFP specimens with various height <strong>and</strong> thickness under<br />
axial load. All panels tested consist of two wythes which are made of foamed concrete <strong>and</strong><br />
polystyrene as a core. The thickness of each concrete wythe is fixed at 40 mm for all panels. The gap<br />
between the concrete wythes had been varied from 20 mm to 70 mm to obtain a variation of overall<br />
wall thickness from 100 mm to 150 mm. Square welded mild steel BRC was used as the longitudinal<br />
<strong>and</strong> transverse reinforcement for both wythes in all panels. Steel shear connectors are tied up to the<br />
BRC in each wythe to strengthen the panel. The slenderness ratio, H/t, was in the range of 13.33 to<br />
20. Each specimen was designated by a name, i.e. PLFP-1 to PLFP-6. Further details of all the PLFP<br />
specimens with their designation, compressive strength <strong>and</strong> slenderness ratio are tabulated in Table 2<br />
Where<br />
Table 2. Dimension <strong>and</strong> Properties of Pilot Test Specimens<br />
W Panel’s width (mm)<br />
H Panel’s height (mm)<br />
t Total thickness of Panel (mm)<br />
t1 Thickness of wythe (mm)<br />
t2 Thickness of core layer (mm)<br />
c Concrete cover (mm)<br />
fcu Compressive strength of panel at 28 days (N/mm 2 )<br />
4.1 Materials<br />
Compressive<br />
Strength (N/mm 2<br />
)<br />
Thermal<br />
Conductivity<br />
(W/mK)<br />
Modulus of<br />
2<br />
Elasticity (kN/mm )<br />
Drying<br />
Shrinkage (%)<br />
400 0.5-1.0 0.10 0.8-1.0 0.30-0.35<br />
600 1.0-1.5 0.11 1.0-1.5 0.22-0.25<br />
800 1.5-2.0 0.17-0.23 2.0-2.5 0.20-0.22<br />
1000 2.5-3.0 0.23-0.30 2.5-3.0 0.18-0.15<br />
1200 4.5-5.5 0.38-0.42 3.5-4.0 0.11-0.09<br />
1400 6.0-8.0 0.50-0.55 5.0-6.0 0.09-0.07<br />
1600 7.5-10.0 0.62-0.66 10.0-12.0 0.07-0.06<br />
Specimen<br />
PLFP-1<br />
H x W x t<br />
2000x750x125<br />
fcu<br />
7<br />
H/t<br />
16<br />
t1<br />
40<br />
t2<br />
45<br />
c<br />
15<br />
Reinforcement<br />
6mmΦ@200mm (V i l d c/c<br />
Shear<br />
CR6<br />
PLFP-2 2000x750x150 6.5 13.33 40 70 15 6mmΦ@200mm c/c R6<br />
PLFP-3 2000x750x100 4 20 40 20 15 6mmΦ@200mm c/c R6<br />
PLFP-4 1800x750x100 5 18 40 20 15 6mmΦ@200mm c/c R6<br />
PLFP-5 2000 x 750 x 125 8 16 40 45 15 6mmΦ@200mm c/c R6<br />
PLFP-6 2000 x 750 x 125 9 16 40 45 15 6mmΦ@200mm c/c R6<br />
The materials described in this section include the materials used as the wythe, core, reinforcement<br />
bars <strong>and</strong> shear connectors of the panels. A description on each material is presented below.<br />
Wythe: Inner <strong>and</strong> outer wythe were made of foamed concrete with wet density from 1600 kg/mm 3 to<br />
1700 kg/m 3 to get the target compressive strength of 15 MPa to 17 MPa for panels PLFP-1 to PLFP-6<br />
as the preliminary test specimens.
178<br />
International <strong>Building</strong> & <strong>Infrastructure</strong> Technology Conference<br />
7-8 June 2011, Vistana Hotel, Penang, Malaysia<br />
Core: Polystyrene is used as the insulation material in the core as it is economical <strong>and</strong> readily<br />
available. The polystyrene sheet were cut into pieces <strong>and</strong> inserted between the inner <strong>and</strong> the outer<br />
wythes <strong>and</strong> between shear connectors.<br />
Reinforcement: A square welded mild steel BRC mesh of 6 mm diameter bars with 200 x 200 mm<br />
openings was used as the longitudinal <strong>and</strong> transverse reinforcement for both wythes in all panels.<br />
Shear connectors : Steel shear connectors in the shape of trusses of 6 mm diameter mild steel bar<br />
bent to an angle of 45º were used in both wythes so that load can be transferred from one wythe to<br />
the other. Four connectors were used over a width of 750 mm<br />
4.2 Foamed Concrete Mixing Process<br />
Before casting the full-scaled specimen of PLFP for pilot test, a trial mixture was first carried<br />
out to determine the characteristic properties of the foamed concrete <strong>and</strong> to get the right mixture for<br />
foamed concrete with strength 15 N/mm 2 to 17 N/mm 2 at the age of 28 days. The trial process of<br />
mixing was based on typical mix details for foamed concrete as given in British Cement Association<br />
(British Cement Association, 1994). Table 3 gives the ratio of materials used, the wet <strong>and</strong> dry density<br />
<strong>and</strong> the compressive strength at age 7, 14 <strong>and</strong> 28 days.<br />
Table 3. Ratio of material <strong>and</strong> characteristic properties for trial mixture<br />
For the preliminary test, the full-scaled specimens were cast using mixture M2 in order to get the dry<br />
density of 1600 kg/m 3 . In this mixture, 200 kg s<strong>and</strong> <strong>and</strong> 100 kg cement were used. The wet density<br />
was measured by taking out 1 liter of the foamed concrete from the mixer <strong>and</strong> weighed. The dry<br />
density will be measured after three days <strong>and</strong> it is expected to be slightly lower than the wet density.<br />
Therefore, the wet density looked for during the mixing was around 1650 kg/m 3 . The dry density of<br />
panels recorded for pilot test are in the range of 1433 kg/m 3 to 1590 kg/m 3 for panel PLFP-1 to PLFP-<br />
4 <strong>and</strong> from 1610 kg/m 3 to 1650 kg/m 3 for panel PLFP-5 <strong>and</strong> PLFP-6 as recorded in Table 4<br />
4.3 Material Properties<br />
Ratio of material<br />
Table 4. Foamed Concrete Properties for Panel PLFP-1 to PLFP-6<br />
Compressive<br />
strength<br />
(N/mm 2 )<br />
Mix S<strong>and</strong>: Foam: Water: Wet Dry 7 14 28<br />
Cement Cement Cement Density Density Days Days Days<br />
M1 2:1 0.6 0.6 1680 1570 9 11.9 12.3<br />
M2 2:1 0.7 0.6 1635 1520 6.8 9.7 10.9<br />
M3 2:1 0.8 0.6 1506 1437 4.9 5.6 8.2<br />
M4 2:1 0.9 0.6 1429 1363 3.8 4.98 5.6<br />
M5 2:1 1.0 0.6 1364 1244 2.8 3.6 3.8<br />
M6 2:1 1.1 0.6 1291 1200 1.95 3 3.2<br />
Foamed<br />
Concrete<br />
fcu (MPa) ft (MPa) Ec (kN/mm 2 ) Wet density<br />
(kg/mm 3 )<br />
Dry<br />
density<br />
(kg/mm 3 )<br />
PLFP-1 7 0.62 10.34 1590 1365<br />
PLFP-2 6.5 0.51 9.4 1483 1275<br />
PLFP-3 4 0.48 8.76 1433 1260<br />
PLFP-4 5 0.5 9.08 1479 1268<br />
PLFP-5 8 0.65 10.88 1610 1400<br />
PLFP-6 9 0.7 10.97 1650 1420<br />
Material properties of the foamed concrete were determined from the tests carried out in the<br />
laboratory. The compressive strength was determined from the compression test which was carried
179<br />
International <strong>Building</strong> & <strong>Infrastructure</strong> Technology Conference<br />
7-8 June 2011, Vistana Hotel, Penang, Malaysia<br />
out using Universal Testing Machine, UTM, based on BS 1881: Part 116: 1983. The tensile strength<br />
was determined from the split cylindrical test according to BS 1881: Part 117: 1983 <strong>and</strong> ASTM C496-<br />
90. The Young Modulus, E, was determined from the compression test on the foamed concrete<br />
cylinder using the Universal Testing Machine according to BS 1881: Part 121 <strong>and</strong> ASTM C39-86. The<br />
properties for steel used as reinforcement <strong>and</strong> shear truss connectors were also tested using UTM<br />
machine in the laboratory. The properties are as shown in Table 5 <strong>and</strong> Table 6 for foamed concrete<br />
<strong>and</strong> steel, respectively.<br />
Foamed<br />
Concrete<br />
4.4 Fabrication <strong>and</strong> Casting<br />
Table 5: Foamed Concrete Properties<br />
fcu (MPa) ft (MPa) Ec (kN/mm 2 ) Wet density<br />
(kg/mm 3 )<br />
Table 6: Properties of Steel<br />
Dry<br />
density<br />
(kg/mm 3 )<br />
PLFP-1 7 0.62 10.34 1590 1365<br />
PLFP-2 6.5 0.51 9.4 1483 1275<br />
PLFP-3 4 0.48 8.76 1433 1260<br />
PLFP-4 5 0.5 9.08 1479 1268<br />
Steel Yield Stress<br />
σy (MPa)<br />
Tensile<br />
Strength,σt<br />
(MPa)<br />
Strain at<br />
Failure<br />
Es<br />
(kN/mm 2 )<br />
6 mm truss connector bars 518 544.28 0.0478 197.8<br />
9 mm bar reinforcement 559 626.5 0.1934 203.68<br />
Figure 3 shows the fabrication <strong>and</strong> casting of panel specimens PLFP-1 to PLFP-4. The reinforcement<br />
was placed in the formwork before the concrete was poured. A BRC of 6 mm mild steel was tied to the<br />
6 mm steel truss connectors as in Figure 3(a). Another BRC was tied to the steel truss connectors at<br />
the top. The BRC <strong>and</strong> steel truss connectors were placed in the formwork. The foamed concrete was<br />
poured into the formwork until the required thickness of the lower wythe was achieved. The<br />
polystyrene was cut <strong>and</strong> placed on top of the lower wythe <strong>and</strong> in between the shear connectors to<br />
form the insulation core as in Figure 3(b). The foamed concrete was again poured onto the top of the<br />
polystyrene to construct the upper wythe as shown in Figure 3(c)
(a) (b)<br />
(c) (d)<br />
180<br />
International <strong>Building</strong> & <strong>Infrastructure</strong> Technology Conference<br />
7-8 June 2011, Vistana Hotel, Penang, Malaysia<br />
Figure 3. (a) BRC <strong>and</strong> Shear Connectors placed horizontally in the formwork ; (b) The polystyrene<br />
was cut <strong>and</strong> placed on top of the lower wythe; (c) Foamed concrete poured on the top of polystyrene<br />
layer as the upper wythe; (d) Finish of the PLFP panel specimen<br />
The results obtain from the preliminary test on PLFP panels PLFP-1 to PLFP-4 shows that the panels<br />
failed prematurely due to the lower compressive strength. It is also found that the panels did not<br />
behave compositely from the load-deflection curve which shows both wythe deflected apart from each<br />
other with the rear surface deflected more than the front surface. There are few possibilities that cause<br />
the premature failure other than the lower compressive strength such as the load was not evenly<br />
distributed <strong>and</strong> the inability of the reinforcement to take up <strong>and</strong> transfer the load. It was decided that<br />
the panels need capping at both ends. Therefore, panels PLFP-5 <strong>and</strong> PLFP-6 were cast with normal<br />
concrete capping of 100 mm thickness at both ends to prevent from premature cracking near loading<br />
<strong>and</strong> support areas. The compressive strength of the normal concrete used as capping is 30 MPa. The<br />
capping was strengthened by the horizontal bars of 9mm diameter which were bent at the ends <strong>and</strong><br />
links of 6 mm diameter. The panels were reinforced with 6 mm BRC top <strong>and</strong> bottom which were tied<br />
up to 6 mm shear trusses as shown in Figure 4.
181<br />
International <strong>Building</strong> & <strong>Infrastructure</strong> Technology Conference<br />
7-8 June 2011, Vistana Hotel, Penang, Malaysia<br />
(a) (b) (c)<br />
(d) (e)<br />
(f) (g) (h)<br />
Figure 4. Fabrication of Panel PLFP-5 <strong>and</strong> PLFP-6 (a) (b) <strong>and</strong> (c) : Bars <strong>and</strong> links for the end capping<br />
(d) <strong>and</strong> (e) : BRC <strong>and</strong> shear truss were placed in the formwork before foamed concrete for the bottom<br />
layer is poured (f) polystyrene were cut <strong>and</strong> placed on the bottom layer (g) top BRC was placed before<br />
the top concrete layer is pored (h) top layer of foamed concrete is poured<br />
4.5 Test procedure<br />
The testing on this panel under axial load was carried out using the 2000 kN capacity Magnus<br />
Frame. The support conditions were designed as pinned at the top <strong>and</strong> fixed at the bottom of the<br />
panel. A total of 12 strain gauges were used in each specimen for surface strain measurement. The<br />
strain gauges was glued to both panel’s surface at different locations <strong>and</strong> connected to the data<br />
logger which records the reading of the vertical strains. The horizontal displacement was measured by<br />
Linear Voltage Dislacement Transducer (LVDT) located at mid height <strong>and</strong> placed on opposite sides<br />
of the panel. The LVDT is also connected to the data logger to record the reading. The front <strong>and</strong> rear<br />
view of the panel are as shown in Figure 5
Strain<br />
Gauge<br />
1 4<br />
Figure 5. Front <strong>and</strong> rear view of the panel<br />
182<br />
International <strong>Building</strong> & <strong>Infrastructure</strong> Technology Conference<br />
7-8 June 2011, Vistana Hotel, Penang, Malaysia<br />
A small load of 1 kN was first applied to make sure that all the instruments were working. The load is<br />
then increased gradually with an increment of approximately 25 kN till the failure of the specimen. At<br />
each load stage, strains <strong>and</strong> deflection values were recorded automatically by a Data Logger which is<br />
connected to a computer. The crack pattern was also noted at each load stage. The general behaviour<br />
of the specimen was carefully observed during the load application.<br />
5. Discussion of Test Results<br />
Panels PLFP-1 to PLFP-4 for the pilot test was tested under axial load. The failure mode <strong>and</strong> crack<br />
pattern of the panels were observed <strong>and</strong> the ultimate strength achieved in each panel was recorded.<br />
The load-lateral deflection profiles were drawn based on the deflection measurements recorded. The<br />
results were studied before casting panels PLFP-5 <strong>and</strong> PLFP-6.<br />
(a) Failure Mode <strong>and</strong> Crack Pattern<br />
2<br />
5<br />
3<br />
6<br />
12 9<br />
Front Rear<br />
From the data gathered, it can be seen that the failure in panels PLFP-1 to PLFP-4 is controlled by the<br />
material failure as shown in Figure 6. The results show that these panels failed prematurely from local<br />
buckling near the supports. This is due to the lower compressive strength achieved by the panels.<br />
PLFP-3 <strong>and</strong> PLFP-4 with lowest compressive strength failed from crushing at the bottom edge.<br />
(a) (b)<br />
Figure 6. (a) Crushing <strong>and</strong> cracking at top part of panel PLFP-3; (b) Crushing <strong>and</strong> cracking at bottom<br />
part of panel PLFP-3<br />
Figure 7 shows the failure mode <strong>and</strong> cracking pattern of panels PLFP-5 <strong>and</strong> PLFP-6. It can be seen<br />
from the figure that cracks occurred at the lower part of top capping in panel PLFP-5. In panel PLFP-6,<br />
crack <strong>and</strong> crush was observed near its bottom edge.<br />
10<br />
11<br />
7<br />
8<br />
LVDT
183<br />
International <strong>Building</strong> & <strong>Infrastructure</strong> Technology Conference<br />
7-8 June 2011, Vistana Hotel, Penang, Malaysia<br />
(a) (b)<br />
Figure 7. Failure mode in panel PLFP-5 <strong>and</strong> PLFP-6 (a) Crack <strong>and</strong> crush at the lower part of top<br />
capping PLFP-5 (b) Crack near the bottom edge of PLFP-6<br />
(b) Ultimate Strength Capacity<br />
The ultimate strength achieved in panel specimens is shown in Table 7. It can be seen that the<br />
ultimate strength achieved is influenced by the compressive strength of foamed concrete <strong>and</strong> the<br />
slenderness ratio of the panel. Panel PLFP-4 with lower compressive strength of 5 MPa achieved<br />
lower ultimate strength of 136 kN. Meanwhile, panel PLFP-3 with lowest compressive strength of 4<br />
MPa achieved higher ultimate strength of 208 kN compared to panel PLFP-4. It is seen here that the<br />
results of ultimate strength of panels are quite scattered. Therefore, the results need to be studied<br />
further in term of the load-deflection curves of the panels. The ultimate strength achieved in panels<br />
PLFP-5 <strong>and</strong> PLFP-6 shows higher ultimate strength recorded.<br />
(c) Load-deflection Profiles<br />
Table 7. Ultimate Strength Results of Pilot Test Specimens<br />
Panel Slenderness Ratio, H/t Ultimate Strength, fcu<br />
(kN)<br />
PLFP-1 16 275<br />
PLFP-2 13.33 345<br />
PLFP-3 20 208<br />
PLFP-4 18 136<br />
PLFP-5 16 280<br />
PLFP-6 16 365<br />
The load-deflection profiles for panels PLFP-1 to PLFP-4 are shown in Figure 8. The trend of the<br />
deflection curve for panels PLFP-1 to PLFP-4 are similar where under initial loading, the out-of-plane<br />
displacement behaviour shows very small deflection. Upon reaching a load of 50kN, panels PLFP-1<br />
<strong>and</strong> PLFP-2 show some signs of cracking. As the load increases, the mid-depth displacement value<br />
also increases gradually. However, the curve for rear <strong>and</strong> front face of both panels tend to move<br />
farther apart from each other. For panel PLFP-3 <strong>and</strong> PLFP-4, both wythes started to move apart from<br />
each other even since the early loading stage.<br />
It is seen that the front <strong>and</strong> rear curve for PLFP-1 to PLFP-4 panels are all heading to the negative<br />
<strong>and</strong> positive direction. The overall trend shows that both wythe in the panels only deflected together<br />
until the first crack load occurred. After that the wythe deflected in different direction until maximum<br />
load was achieved. Figure 8 presents the load-deflection profiles for panels PLFP-1 to PLFP-4
Load (kN)<br />
Load (kN)<br />
300<br />
250<br />
200<br />
150<br />
Load vs Deflection<br />
100<br />
Front LVDT<br />
50<br />
0<br />
Rear LVDT<br />
-2 0 2<br />
Deflection (mm)<br />
4 6<br />
184<br />
Load (kN)<br />
International <strong>Building</strong> & <strong>Infrastructure</strong> Technology Conference<br />
7-8 June 2011, Vistana Hotel, Penang, Malaysia<br />
400<br />
350<br />
300<br />
250<br />
200<br />
150<br />
100<br />
Load vs Deflection<br />
50<br />
0<br />
Rear LVDT<br />
-5 0 5 10<br />
Deflection (mm)<br />
(a) PLFP-1 (b) PLFP-2<br />
Load vs Deflection<br />
250<br />
200<br />
150<br />
100<br />
50<br />
0<br />
Front LVDT<br />
Rear LVDT<br />
-10 -5 0 5<br />
Deflection (mm)<br />
10 15<br />
Load (kN)<br />
Load vs Deflection<br />
160<br />
140<br />
120<br />
100<br />
80<br />
60<br />
40<br />
20<br />
Front LVDT<br />
0<br />
-10 -5 0 5 10<br />
Deflection (mm)<br />
(c) PLFP-3 (d) PLFP-4<br />
Figure 8. Load-deflection profile for panels PLFP-1 to PLFP-4<br />
Front LVDT<br />
Rear LVDT<br />
Figure 9 shows the load-deflection profile of panels PLFP-5 <strong>and</strong> PLFP-6. From the figure, it is seen<br />
that the wythes in both panels recorded small deflection measurements at the early stage of loading.<br />
The wythes is noticed to move in the opposite direction. However, both panels tend to buckle at the<br />
later stage where the front LVDT indicates that the front wythe tend to move towards the same<br />
direction as the rear wythe <strong>and</strong> this trend remains unchanged until it reaches a maximum load. This<br />
proved that capping at both ends of panels has improved the performance of the PLFP panels where<br />
certain extent of compositeness has been achieved.<br />
Load (kN)<br />
300<br />
250<br />
200<br />
150<br />
100<br />
50<br />
Load vs Deflection<br />
Front LVDT<br />
Rear LVDT<br />
0<br />
-5 0 5 10 15 20<br />
Deflection (mm)<br />
400<br />
350<br />
300<br />
250<br />
Load (kN)<br />
200<br />
150<br />
100<br />
50<br />
0<br />
Load vs Deflection<br />
-5 0 5 10 15 20<br />
Deflection (mm)<br />
(a) PLFP-5 (b) PLFP-6<br />
Figure 9. Load-deflection profile for panels PLFP-5 <strong>and</strong> PLFP-6
6. CONCLUSIONS<br />
185<br />
International <strong>Building</strong> & <strong>Infrastructure</strong> Technology Conference<br />
7-8 June 2011, Vistana Hotel, Penang, Malaysia<br />
The findings from the preliminary experiment showed that the strength achieved in the panel<br />
specimens is much lower than expected. This was due to the imperfection during the mixing <strong>and</strong><br />
casting work. These findings have led to the mixture ratio proposed for foamed concrete wythe in<br />
PLFP panel with targeted strength of 12 MPa to 17.5 MPa. The mixture ratio which was used during<br />
the preliminary experiment need to be enhanced in the actual experimental work by reducing the<br />
foam:cement ratio from 0.7 to 0.65 <strong>and</strong> the water:cement ratio from 0.6 to 0.55. The reduction of<br />
foam:cement ratio is to get a more dense foamed concrete. Meanwhile, the water:cement ratio is<br />
reduced to take into consideration the amount of water used in the foaming process.<br />
The premature cracking near loading <strong>and</strong> support areas indicated that the applied load was not well<br />
distributed to the whole area of panel during the pilot testing. Therefore, asides from enhancing the<br />
mixture used for foamed concrete, it was decided to use capping at both ends of the panels to avoid<br />
the same type of failure mode from occurring in the panel specimens in the actual experiment. The<br />
capping was made of reinforced normal concrete of 100 mm thickness with strength of 30 N/mm 2 .<br />
From the load-deflection profiles of the panel specimens in the preliminary work, it was found that the<br />
wyhtse in panels with no capping at both ends tend to deflect in different direction far from each other<br />
especially at the later stage of loading. However, the trend was different with panels with capping at<br />
both ends where both wythes in the panels tend to deflect together in the same direction. This can be<br />
seen in panel PLFP-5 <strong>and</strong> PLFP-6.<br />
The proposed PLFP panel with capping at both ends is found to be practical either during casting <strong>and</strong><br />
fabrication work or during h<strong>and</strong>ling <strong>and</strong> placing work before testing. Two to three panels could be cast<br />
in one day depending on the weather condition. This panel is easy to h<strong>and</strong>le due to the reduction in its<br />
weight. The size makes it possible to be lifted <strong>and</strong> placed in the test frame using a forklift. The<br />
thickness <strong>and</strong> length of the PLFP panel chosen is similar to the usual size for wall panel. The width of<br />
750 mm is used to fit the testing frame. The size <strong>and</strong> design of the PLFP panel is chosen to suit the<br />
limitation of loading capacity of the hydraulic system which is up to 1000 kN<br />
ACKNOWLEDGEMENTS<br />
The author would like to thank Universiti Tun Hussein Onn Malaysia (UTHM), Batu Pahat, Johor for its<br />
continuous support in this research. The assistance from UTHM is gratefully acknowledged.<br />
REFERENCES:<br />
ACI 318-371, (1971). <strong>Building</strong> Code Requirements For Reinforced Concrete”, American Concrete<br />
Institution<br />
Benayoune, A., Samad A.A.A., Abang Ali A.A., Trikha D.N.T., (2005). Response of Precast<br />
Reinforced Composite S<strong>and</strong>wich Panels To Axial Loading, Journal of Construction <strong>and</strong> <strong>Building</strong><br />
Materials.<br />
Bush, T.D. <strong>and</strong> Stine, G.L., (1994). Flexural Behavior of Composite Prestressed S<strong>and</strong>wich Panels<br />
With Continuous Truss Connectors, PCI Journal , V.39, No. 2, 112-121<br />
Davies, J.M., (1997). Lightweight S<strong>and</strong>wich Construction, Oxford:Blackwell Science Ltd.<br />
Jeom, K.P., Anil, K.T., Kim, G.S., (1999). The strength characteristics of aluminium honeycomb<br />
s<strong>and</strong>wich panels, Elsevier, Journal of Thin-Walled Structures , V.35, pp. 205-231.<br />
Lee A. J., Kelly H., Jagoda R., Rosenfeld A., Stubee E., Colaco J., Gadgil A. Akbari H., Norford L.<br />
<strong>and</strong> Van<br />
Burik H.,(2006). Affordable, Safe Housing Based On Exp<strong>and</strong>ed Polystyrene (EPS) Foam <strong>and</strong><br />
Cementitious Coating, Journal of Material Science, V.41.<br />
.<br />
Rosenthal, (1984). Structural Behaviour Of Loaded Multilayer Wall Panels, Journal Of Materials <strong>and</strong><br />
Structures, V. 17, No. 4.<br />
Shutt, C. A., (1977). Report Codifies, Details S<strong>and</strong>wich Wall Panels, Journal of Structural Engineering<br />
Ascent: Springer, pp. 28- 33
T139<br />
186<br />
International <strong>Building</strong> & <strong>Infrastructure</strong> Technology Conference<br />
7-8 June 2011, Vistana Hotel, Penang, Malaysia<br />
DISTRIBUTION OF LIVE LOAD ON SKEWED MULTICELL BOX-GIRDER<br />
BRIDGES UDER TRUCK LOADS<br />
Mohseni, Iman 1 <strong>and</strong> Khalim A, R 2<br />
1 Department of Civil Engineering, Behbahan Branch, Islamic Azad University,Behbahan, Iran<br />
2 Universiti Kebangsaan Malaysia, Bangi, Selangor Malaysia<br />
1 mohseni1979@gmail.com , 2 khalim@vlsi.eng.ukm.my<br />
ABSTRACT: Current AASHTO LRFD Bridge Design Specifications provide several equations for<br />
distribution factor of moment <strong>and</strong> shear of multicell box- girder bridges. The equations do not account<br />
for changing in straining actions due to skew angle, continuity <strong>and</strong> effect of diaphragms. While these<br />
parameters greatly influence transverse distribution of live load on superstructure of bridges. The<br />
objective of this study is to evaluate the effects of the skew angles <strong>and</strong> continuity on the moment<br />
distribution factors of skewed multicell box- girder bridges. A parametric study is carried out on three<br />
equal span continuous bridges to determine the effective parameters on lateral distribution of loads. A<br />
total of 50 multicell box-girder bridges are modeled using finite element <strong>and</strong> grillage method. The<br />
prototype bridges are analyzed under four HS-20 design trucks. The trucks are positioned close the<br />
mid span <strong>and</strong> support to produce maximum bending moment <strong>and</strong> shear of each spans, respectively.<br />
The results are compared AASHTO Specifications <strong>and</strong> AASHTO LRFD (2008) procedures. The<br />
results indicates that live distribution factor obtained from equations of AASHTO St<strong>and</strong>ard <strong>and</strong><br />
AASHTO LRFD(2008) give very conservative results for moment distribution of exterior girder<br />
compare to grillage analysis <strong>and</strong> finite element methods. It also can be observe the grillage analysis<br />
determine rational results for skewed bridges with skew angle more than 30 degrees.<br />
Keyword: multicell box, girder, distribution factor, skews bridges, Grillage method, truck load<br />
1. Introduction<br />
The responses of a bridge under live load or live load distribution factor are important for both design<br />
<strong>and</strong> evaluation purposes, because they enable the engineer to find the strength <strong>and</strong> Serviceability of a<br />
given superstructure. However, determining the accurate maximum responses <strong>and</strong> load distributions is<br />
difficult because of the complexity of bridge structures. Because of the advances in computer<br />
technology <strong>and</strong> modern finite element (FE) programs with user-friendly graphical interfaces, the finite<br />
element method (FEM) is replacing other methods, such as grillage analysis, even for more<br />
straightforward bridge analyses. Recently, Several researches were conducted on the subject of load<br />
distribution in skew composite bridges. Khaleel <strong>and</strong> Itani(1990) revealed that for a skew angle of 60°,<br />
the maximum ending moment in the interior girders is approximately 71% of that in a normal bridge,<br />
whereas, the reduction in maximum bending moment is only 20% in the exterior girders. Ebeido <strong>and</strong><br />
Kennedy (1996) presented reaction <strong>and</strong> shear distribution factors for two-span continuous skew<br />
composite bridges subjected to AASHTO st<strong>and</strong>ard truck loading. The bridges were assigned partial<br />
loading in case of calculating maximum positive moment <strong>and</strong> full loading in case of calculating<br />
maximum negative moment. They revealed that the presence of the skew causes significant<br />
reductions in both girder span <strong>and</strong> support moments. They observed that the skew angle has<br />
insignificant effect on the distribution factors for angles less than 30°. However, the distribution factors<br />
changed significantly with skew angles over 30°. Moreover, it was concluded that the span length of<br />
the bridge had a major effect on its load distribution characteristics. Its effect was best reflected by the<br />
bridge aspect ratio defined by the span length/bridge width. Zokaie (1991) presented the research<br />
work on which the AASHTO LRFD (2007) distribution factors are based. The work assumed equal<br />
girder spacing, uniform girder cross sections, <strong>and</strong> constant angle of skew. The research did not<br />
incorporate the effect of cross diaphragms nor the continuity. Murat Dicleli (2009) determined the live<br />
load distribution formula for single span prestressd concrete integral abutment bridge girder. the
187<br />
International <strong>Building</strong> & <strong>Infrastructure</strong> Technology Conference<br />
7-8 June 2011, Vistana Hotel, Penang, Malaysia<br />
objective of the present study was investigation the behaviour of skew continuous multicell box<br />
bridges <strong>and</strong> a parametrical study on multicell box bridge with unequal span <strong>and</strong> determination<br />
accurate moment distribution factor used FEM <strong>and</strong> Grillage method <strong>and</strong> compare with AASHTO<br />
st<strong>and</strong>ard <strong>and</strong> LRFD Codes.<br />
2. METHODOLOGY<br />
This study presents a parametric study on two continuous skew MCB bridges. The varying parameters<br />
in this study included, skew angle, span length, number of box, number of lane. The effect of the<br />
skewness on live load distribution factor are evaluated. The modeling bridges are analysis using FEM<br />
<strong>and</strong> grillage method to determine moment distribution factor. Then analytical results are compare to<br />
AASHTO LRFD (2007) <strong>and</strong> AASHTO (2002) specification to investigate the accuracy of code<br />
specifications.<br />
3. LIVE LOAD DISTRIBUTION FACTOR AASHTO SPECIFICATION FOR MULTICELL<br />
BRIDGES<br />
3.1 AASHTO St<strong>and</strong>ard specification [2]<br />
The distribution factors for the interior beams of cast-in-place concrete multicell beam bridges are<br />
calculated using the S-over equations from the AASHTO(2002) Table 3.23.1<br />
For one lane loaded:<br />
For two or more traffic lanes loaded:<br />
Range of Applicability:<br />
3.2 AASHTO LRFD FOURMULS [3]<br />
For interior beams, Table 4.6.2.2.2b-1 lists the moment distribution factor equations <strong>and</strong> ranges of<br />
applicability for cast-in-place multicell beam bridges.<br />
For one design lane loaded:<br />
For two or more design lanes loaded:<br />
(1)<br />
(2)<br />
(3)<br />
(4)<br />
(5)
Range of Applicability:<br />
188<br />
International <strong>Building</strong> & <strong>Infrastructure</strong> Technology Conference<br />
7-8 June 2011, Vistana Hotel, Penang, Malaysia<br />
For exterior beams, Table 4.6.2.2.2d-1 lists the moment distribution factor equations <strong>and</strong><br />
ranges of applicability for cast-in-place multicell beam bridges. The equation is:<br />
Range of Applicability:<br />
Where is spacing of beams (ft), number of cells, span length <strong>and</strong> is equal to half<br />
the web spacing plus the total overhang <strong>and</strong> is measured in feet.<br />
For skew bridges, a reduction factor is then applied to the straight bridge distribution<br />
factors.<br />
Range of applicability:<br />
4. Description of Bridge Prototypes<br />
Two cast-in-place concrete multicell beam bridges were included in this study. The bridge consists of<br />
three varying span lengths of 91,119,140 feet. Each support is at a 26.23-degree angle from the<br />
vertical with the roadway as shown in Figure 1. The 50 ft wide bridge carrying three lanes of traffic is<br />
supported by a four-cell, cast-in-place box beam. Typical web thickness is 12 in spaced at 10.33 ft on<br />
center. Table 1 presents complete list of structural parameters for each bridges.<br />
Figure 1. Bridge No.3 multicell beam, plane view <strong>and</strong> cross section<br />
(6)<br />
(7)<br />
(8)<br />
(9)<br />
(10)<br />
(11)
5. Modelling<br />
189<br />
International <strong>Building</strong> & <strong>Infrastructure</strong> Technology Conference<br />
7-8 June 2011, Vistana Hotel, Penang, Malaysia<br />
5.1 Finite Element Model.<br />
Sap2000 structural analysis software was used to determine the response of the bridge structure due<br />
to vehicle live loads. Bridge superstructures were typically modelled with frame elements for<br />
longitudinal <strong>and</strong> shell element transverse members (diaphragms) to form an integrated superstructure.<br />
the frame element includes the effects of biaxial bending, torsion, axial deformation, <strong>and</strong> biaxial shear<br />
deformations.<br />
Table 1. Cast- in- place multicell beam bridge information<br />
Br. No. L ɵ No. cells Girder Slab Thickness Width<br />
No.<br />
span<br />
spacing<br />
(in)<br />
(ft)<br />
1 3 140.0 26.23 4 10.33 9.25 50<br />
2 2 110.0 10.60 3 9.50 8.00 36<br />
5.2 Grillage Model Geometric<br />
The cross section show in Figure 1 was modelled with a set of longitudinal <strong>and</strong> transverse beam<br />
element. Figure 2 shows the placement of transverse <strong>and</strong> longitudinal grillage members adopted in<br />
this paper. The grillage mesh is in the plane of the principal axis of bending of the deck as a whole<br />
with the longitudinal members coincident with longitudinal webs, <strong>and</strong> one longitudinal grillage<br />
members were placed for each girder, representing each web of gorder [1]. Grillage analysis requires<br />
the calculation of the moment of inertia, , torsional moment of inertia, , <strong>and</strong> equivalent shear area<br />
of a transverse grillage member,<br />
grillage member properties:<br />
. Hambly(1990) suggested following equations for multicell box<br />
unit width (14)<br />
Per unit length (12)<br />
Per unit length (13)<br />
Where: are the top <strong>and</strong> bottom slab <strong>and</strong> are distances from their centriod of<br />
deck. are web thickness , distance between two adjacent web <strong>and</strong> total depth of cells,<br />
respectively. For bridge No.3 grillage properties are .<br />
In both methods, support conditions were defined using hinges at the beginning of the bridge <strong>and</strong><br />
rollers at the other supports. The live load applied to the bridges was an HL-93 truck. The bridge was<br />
loaded with series 1, 2 <strong>and</strong> 3 trucks moving load respectively. The AASHTO(2002) St<strong>and</strong>ard intensity<br />
reduction factors were used for three <strong>and</strong> four truckload results (0.9 <strong>and</strong> 0.75 respectively). The<br />
maximum responses of interior <strong>and</strong> exterior girders were determined by moving the trucks on a bridge<br />
to various locations in the longitudinal <strong>and</strong> transverse directions until the maximum response was<br />
obtained.<br />
Per
190<br />
International <strong>Building</strong> & <strong>Infrastructure</strong> Technology Conference<br />
7-8 June 2011, Vistana Hotel, Penang, Malaysia<br />
6. RESULTS OF ANALYSIS AND COMPARISON<br />
The analytical results obtained include the maximum live load moment on the exterior <strong>and</strong> interior<br />
girders, as shown in table 2. Maximum distribution factors of moment at each girders were determined<br />
by dividing the maximum shear <strong>and</strong> moment from each bridges analysis by the maximum shear <strong>and</strong><br />
moment from a single beam line analysis at the corresponding location.<br />
Bridge<br />
No<br />
Skew<br />
angle<br />
Table 2. Max. Moment distribution factor for bridges 1 <strong>and</strong> 2<br />
Max. Beam DLF.m DLF.m FEA/ DLFm.<br />
Span<br />
length(ft)<br />
FEM LRFD LRFD AASHTO<br />
FEM/<br />
AASHTO<br />
1 26.23 140 Exterior 0.490 0.616 0.795 0.678 0.722<br />
1 26.23 140 Interior 0.689 0.670 1.020 0.678 1.010<br />
2 10.60 110 Exterior 0.570 0.616 0.920 0.678 0.841<br />
2 10.60 110 Interior 0.810 0.570 1.420 0.678 1.190<br />
6.1 EFFECT OF SPAN LENGTH ON MOMENT DISTRIBUTION FACTORS.<br />
Figures 2 <strong>and</strong> 3 show the moment distribution factor vs. span length for exterior <strong>and</strong> interior beam of<br />
bridges. That was seen that grillage method matches with that of FEA very well, but AASHTO,<br />
St<strong>and</strong>ard <strong>and</strong> LRFD were very conservative for interior <strong>and</strong> exterior beams. LRFD specification results<br />
were unconservative for exterior girder while span length exceeded of 170ft.<br />
Figure 2. Moment Distribution Factor vs. Span Length For exterior beam<br />
Figure 3. Moment Distribution Factor vs. Span length for interior beams
191<br />
International <strong>Building</strong> & <strong>Infrastructure</strong> Technology Conference<br />
7-8 June 2011, Vistana Hotel, Penang, Malaysia<br />
6.2 EFFECT OF SKEW ANGLE ON MOMENT DISTRIBUTION FACTORS<br />
Figures 4 <strong>and</strong> 5 show the moment distribution factors obtained for all four methods versus the skew<br />
angle. The skew angle for bridges in this study ranged from zero to 60 degrees. By comparing each<br />
method of calculation with FEM, it can be seen that all methods predicted moment distribution factors<br />
very conservative for exterior girders, but,for interior girders AASHTO-LRFD predicted moment<br />
distribution factors partly unconservative for skew angle more than 30 degree.<br />
Figure 4. Moment Distribution Factor vs. Skew for interior beams<br />
Figure 5. Moment distribution factor vs. Skew for exterior beams<br />
Figure 6 shown that the presence of skew causes significant reductions in both span <strong>and</strong> support<br />
girder moment. It should be noted that in the case of right bridge, , the span <strong>and</strong> support girder<br />
moments for an interior girder are higher than those for an exterior girder. However, the factor LDFm<br />
for an interior girder increases more significantly due to skew than in the case of an exterior girder.<br />
Figure 6. Moment distribution factor vs. transverse Location of beams
Figure 7. Moment distribution factor vs. number of cells<br />
192<br />
International <strong>Building</strong> & <strong>Infrastructure</strong> Technology Conference<br />
7-8 June 2011, Vistana Hotel, Penang, Malaysia<br />
6.3 EFFECT OF NUMBER OF CELLS ON MOMENT DISTRIBUTION FACTOR<br />
Figure 7 shows the influence of changes in the number of cells on the distribution factors for maximum<br />
positive moment distribution factor. It can be observed that as the number of cell becomes more, the<br />
distribution factors for maximum positive moment decreased. However, LRFD estimated higher<br />
values for LDF of interior girder, it estimated fairly close to values of DLF for exterior girders.<br />
7. CONCLUSIONS<br />
The load distribution in continuous multicell beam bridges was examined by carrying out an extensive<br />
parametric study on prototypes of such bridges. It was deduced that the main parameters affecting the<br />
load distribution are the span length, number of cells <strong>and</strong> skew angle of deck. A finite-element model<br />
was used in this study. The effect of continuity was compared with current practice using AASHTO<br />
(2002), LRFD (2007) <strong>and</strong> Grillage method. The comparison revealed that The AASHTO St<strong>and</strong>ard<br />
method for calculating live load moment distribution factors produces conservative results compare to<br />
FEM in nearly every case. When compare to each other, the AASHTO LRFD (2007) <strong>and</strong> Grillage<br />
methods produce very similar results.<br />
REFERENCES<br />
American Association of State Highway <strong>and</strong> Transportation Officials, “AASHTO St<strong>and</strong>ard<br />
Specifications for Highway Bridges”, Washington, D.C, 2002.<br />
American Association of State Highway <strong>and</strong> Transportation Officials. AASHTO LRFD Bridge Design<br />
Specifications, 4rd Edition, Washington, D.C. (2007).<br />
Chun, P <strong>and</strong> G. Fu, (2009). Derivation of governing equation of skewed thick plates <strong>and</strong> its closedform<br />
solution. JSCE Journal of Applied Mechanics, pp.15-25.<br />
Dicleli, M.; Erhan, S. (2009). Live Load Distribution Formulas for Single-Span Prestressed concrete<br />
Integral Abutment Bridge Girders. J. Bridge Eng., ASCE, 14(6): 472-486.<br />
Ebeido, T., <strong>and</strong> Kennedy, J. B. (1996). Girder moments in continuous skew composite bridges. J.<br />
Bridge Eng., 1(1), 37–45.<br />
Hambly, E. C. 1990. Bridge Deck Behaviour. Routledge Mot E.F. &N. Spon, Second Edition.US<br />
Khaleel, M. A., <strong>and</strong> Itani, R. Y. (1990). “Live-load moments for continuous skew bridges.” J. Struct.<br />
Eng., 116(9), 2361–2373.<br />
SAP2000 manual: A general finite-element program, version 14.<br />
Zokaie, T., Imbsen, R.A., <strong>and</strong> Osterkamp, T.A. (1991).Distribution of Wheel Loads on Highway<br />
Bridges. Transportation Research Record No. 1290, Transportation Research Board, Washington,<br />
D.C., pp. 119-126.
T140<br />
193<br />
International <strong>Building</strong> & <strong>Infrastructure</strong> Technology Conference<br />
7-8 June 2011, Vistana Hotel, Penang, Malaysia<br />
EXPERIMENTAL COMPARATIVE ANALYSIS OF SOLAR CHIMNEY HOUSE<br />
PERFORMANCE WITH ENERGY SAVING HOUSE AND GENERAL HOUSE IN<br />
THAILAND<br />
Jaran Ratanachotinun 1 , Jongjit Hirunlabh 2 , Nat Kasayapan<strong>and</strong> 3 , Sopa Visitsak 4 ,<br />
Sombat Teekasap 5 <strong>and</strong> Joseph Khedari 6<br />
1. 2 <strong>Building</strong> Scientific Research Center, Institute for Scientific <strong>and</strong> Technological Research<br />
<strong>and</strong> Services,<br />
3 Energy Technology Division, School of Energy Environment <strong>and</strong> Materials, King Mongkut’s<br />
University of Technology Thonburi, Thail<strong>and</strong><br />
4 Faculty of Architecture , Kasetsart University, Thail<strong>and</strong><br />
5 Faculty of Engineering , Eastern Asia University, Thail<strong>and</strong><br />
6 Rattanakosin College for <strong>Sustainable</strong> Energy Environment, Rajamangala University of<br />
Technology Rattanakosin, Thail<strong>and</strong><br />
jaran07@yahoo.com 1 , ijonlabh@kmutt.ac.th 2<br />
ABSTRACT: The objective of this research was to conduct field comparison of performance of Solar<br />
Chimney house (SCH) with Energy Saving house (ESH) <strong>and</strong> a regular general house (GH) used as a<br />
reference during the 3 seasons of Thail<strong>and</strong>: summer, rainy <strong>and</strong> winter. SCH designed by the <strong>Building</strong><br />
Scientific Research Center (BSRC) was composed mainly of a Modified Trombe Wall <strong>and</strong> a Roof<br />
Solar Collector built using common construction materials. Air gap in the wall <strong>and</strong> roof allow air flow<br />
from inside to outside. The Energy Saving House (ESH) was built with lightweight autoclave concrete<br />
blocks <strong>and</strong> well insulated roof. The General House (GH) was built as usual in Thail<strong>and</strong> by concrete<br />
blocks <strong>and</strong> concrete tiles. The dimensions of house models are 1.3x1.3x2.5 meters. Experimental<br />
observations indicated that SCH average indoor temperature has good performance in all seasons<br />
<strong>and</strong> thus confirmed past researches. In summer, the average diurnal <strong>and</strong> nocturnal ambient<br />
temperature were 31.9 C <strong>and</strong> 29.1 C respectively. When compared to ESH <strong>and</strong> GH houses, the<br />
average daily indoor temperature decrease was about 1 <strong>and</strong> 2 C respectively. During rainy season<br />
<strong>and</strong> winter, the average diurnal <strong>and</strong> nocturnal ambient temperature were 29.22, 26.04 C <strong>and</strong> 28.83,<br />
27.14 C respectively. The corresponding average daily indoor temperature decrease was about 1 C<br />
when compared to both ESH <strong>and</strong> GH for both seasons. Construction cost for the Modified Trombe<br />
wall <strong>and</strong> Roof solar collector (SCH) are 19.7 <strong>and</strong> 67 % higher than the cost of GH but 23 % lower than<br />
the wall cost of ESH <strong>and</strong> 15.5 % higher than the roof cost of ESH. However SCH still represents a<br />
good choice as the average daily electrical consumption of air conditioner will be reduced by 7-10%<br />
for every 1 C decrease of indoor temperature. Additionally solar chimney design has several practical<br />
advantages such installing electric wires <strong>and</strong> telephone cables in the air gap that would represent an<br />
additional saving too. The outcomes of this research will result into the development of a prototype of<br />
SCH for real construction in the future.<br />
Keywords: solar chimney, modified trombe wall, roof solar collector, indoor temperature,<br />
energy saving<br />
1. INTRODUCTION<br />
The trends in energy saving at the present time have gained a lot of attention due to the fact that<br />
energy from the natural resources is decreasing, that the energy cost is increasing <strong>and</strong> that the world<br />
is encountering global warming. House or domicile is the largest unit in the world, resulting in the<br />
consumption of large amount of energy.<br />
Published researches about solar chimney houses worldwide including those reported by our team<br />
(BSRC) showed that the temperature inside the solar chimney house when compared to general
194<br />
International <strong>Building</strong> & <strong>Infrastructure</strong> Technology Conference<br />
7-8 June 2011, Vistana Hotel, Penang, Malaysia<br />
house is lower <strong>and</strong> such it saves electrical energy for air-conditioner. However, few researches have<br />
been done for all seasons. Most of them were done in a specific season or at specific time <strong>and</strong> few of<br />
them considered simultaneous comparison with lightweight autoclave brick house <strong>and</strong> well insulated<br />
roof. This is being the main research objective of this work.<br />
The objective of this research was to conduct field comparison of performance of Solar Chimney<br />
house (SCH) with Energy Saving house (ESH) built with lightweight autoclave concrete blocks <strong>and</strong><br />
well insulated roof <strong>and</strong> a regular general house (GH) used as a reference during the 3 seasons of<br />
Thail<strong>and</strong>: summer, rainy <strong>and</strong> winter. SCH designed by the <strong>Building</strong> Scientific Research Center (BSRC)<br />
was composed mainly of a Modified Trombe Wall <strong>and</strong> a Roof Solar Collector built using common<br />
construction materials. For the experiment, 3 house models were built in Bangkok (Thail<strong>and</strong>) to<br />
compare the temperature inside the houses to prove that solar chimney house show good perfomance<br />
compared to other types of houses <strong>and</strong> that solar chimney house is suitable for all seasons or all year<br />
round. The outcomes of this research will be useful for the development of a prototype of an economic<br />
bioclimatic energy saving house which is suitable for real world in Thail<strong>and</strong> in the future.<br />
2. METHODOLOGY<br />
This research consists of 2 phases: data collection <strong>and</strong> analysis of temperature inside the houses from<br />
all seasons <strong>and</strong> a design layout of a general real bio-climatic energy saving houses.<br />
Based on past research works of the <strong>Building</strong> Scientific Research Center (BSRC) about inducing<br />
natural ventilation by the use of Solar Chimney (SC) concept (J. Khedari et al. (2003), B. Boonsri et al.<br />
(2000), C. Lertsatitthanakorn et al. (1997), J. Waewsak et al., 2003, S. Chaima et al., 1997, S.<br />
Wachirapuwadon et al., 2001, T. Bunnag et al., 1997)) Three house models (figures 1-3) were built<br />
with the same dimensions: 1.3x1.3x2.5 meters. The first house was (SCH) with modified double-layer<br />
Trombe wall facing south. The outer wall was brick <strong>and</strong> the inner wall was gypsum board. Air gap<br />
between walls was 10 centimeters <strong>and</strong> the air gap to allow air flow from inside to outside the house<br />
was 5 centimeters. The roof was made from concrete tiles (CPAC monier) <strong>and</strong> gypsum board, spaced<br />
10 centimeters. The second house was built using energy saving materials (ESH) with lightweight<br />
autoclave concrete blocks <strong>and</strong> gable-shaped well insulated roof. The third house was a general house<br />
(GH) with red bricks <strong>and</strong> concrete tiles, gable-shaped roof <strong>and</strong> cement boards as ceiling. Data<br />
collection was done in summer, rainy season, <strong>and</strong> winter. Data were collected for 7 days in each<br />
season, totaling 21 days. The average temperature for each house was analyzed for performance<br />
comparison.
Figure 1. Solar Chimney House (SCH)<br />
Figure 2. Energy Saving House (ESH)<br />
195<br />
International <strong>Building</strong> & <strong>Infrastructure</strong> Technology Conference<br />
7-8 June 2011, Vistana Hotel, Penang, Malaysia
Figure 3. General House (GH)<br />
196<br />
International <strong>Building</strong> & <strong>Infrastructure</strong> Technology Conference<br />
7-8 June 2011, Vistana Hotel, Penang, Malaysia<br />
3. CONCLUSIONS<br />
3.1 Comparison of average hourly indoor temperature during the measured period of SCH, ESH <strong>and</strong><br />
GH from all 3 seasons: summer, rainy season <strong>and</strong> winter is shown in figures 4 to 6.<br />
Temperature (C)<br />
40.00<br />
35.00<br />
30.00<br />
25.00<br />
20.00<br />
15.00<br />
10.00<br />
5.00<br />
0.00<br />
1:00:00<br />
3:00:00<br />
5:00:00<br />
7:00:00<br />
9:00:00<br />
S ummer (1-8 Apr 2010)<br />
11:00:00<br />
13:00:00<br />
Time<br />
15:00:00<br />
17:00:00<br />
19:00:00<br />
21:00:00<br />
23:00:00<br />
GH<br />
SCH<br />
ESH<br />
Ambient<br />
Figure 4. Comparison of average temperature inside 3 house models in summer<br />
(1-8 April 2010)
Temperature (C)<br />
40.00<br />
35.00<br />
30.00<br />
25.00<br />
20.00<br />
15.00<br />
10.00<br />
5.00<br />
0.00<br />
1:00:00<br />
3:00:00<br />
5:00:00<br />
Rain (2-9 Aug 2010)<br />
Time<br />
197<br />
International <strong>Building</strong> & <strong>Infrastructure</strong> Technology Conference<br />
7-8 June 2011, Vistana Hotel, Penang, Malaysia<br />
7:00:00<br />
9:00:00<br />
11:00:00<br />
13:00:00<br />
15:00:00<br />
17:00:00<br />
19:00:00<br />
21:00:00<br />
23:00:00<br />
GH<br />
SCH<br />
ESH<br />
Ambient<br />
Figure 5. Comparison of average temperature inside 3 house models in rainy season<br />
(2-9 August 2010)<br />
Temperature (C)<br />
40.00<br />
35.00<br />
30.00<br />
25.00<br />
20.00<br />
15.00<br />
10.00<br />
5.00<br />
0.00<br />
1:00:00<br />
3:00:00<br />
5:00:00<br />
7:00:00<br />
9:00:00<br />
Winter (7-14 J an 2010)<br />
11:00:00<br />
13:00:00<br />
Time<br />
15:00:00<br />
17:00:00<br />
19:00:00<br />
21:00:00<br />
23:00:00<br />
GH<br />
SCH<br />
ESH<br />
Ambient<br />
Figure 6. Comparison of temperature inside 3 house models in winter (7-14 January 2010)<br />
To simplify comparison, a summary of average indoor temperature inside the 3 house models <strong>and</strong><br />
ambient temperature is shown in the table 1 during daytime (6.00am-18.00pm) <strong>and</strong> nighttime periods<br />
(18.00pm-6.00am) separately.<br />
Table 1. Average indoor temperature of the house models <strong>and</strong> ambient temperature (AMB) during<br />
daytime <strong>and</strong> nighttime for 3 seasons (Celsius degree)<br />
SUMMER RAINY WINTER<br />
AMB SCH ESH GH AMB SCH ESH GH AMB SCH ESH GH<br />
day time 31.99 31.68 32.90 33.65 29.22 28.99 30.42 30.42 28.83 28.90 30.07 30.19<br />
night time 29.13 30.08 31.51 29.64 26.04 26.77 28.83 26.26 27.14 27.88 29.27 26.91<br />
Experimental observations indicated that SCH average indoor temperature has good performance in<br />
all seasons. In summer, the average diurnal <strong>and</strong> nocturnal ambient temperature were 31.9 C <strong>and</strong> 29.1<br />
C respectively. When compared to ESH <strong>and</strong> GH houses, the average daily indoor temperature<br />
decrease was about 1 <strong>and</strong> 2 C respectively. During rainy season <strong>and</strong> winter, the average diurnal <strong>and</strong><br />
nocturnal ambient temperature were 29.22, 26.04 C <strong>and</strong> 28.83, 27.14 C respectively. The<br />
corresponding average daily indoor temperature decrease was about 1 C when compared to both<br />
ESH <strong>and</strong> GH for both seasons.<br />
3.2 The cost for the construction of modified Trombe wall is 26.7 $/m2 approximately <strong>and</strong> the cost of<br />
Solar Collector roof is 54.7 $/m2 approximately. When compared to the construction of specific parts
198<br />
International <strong>Building</strong> & <strong>Infrastructure</strong> Technology Conference<br />
7-8 June 2011, Vistana Hotel, Penang, Malaysia<br />
in the general house, the cost increase is 19.7 <strong>and</strong> 67% respectively <strong>and</strong> 23 % lower than the wall<br />
cost of ESH <strong>and</strong> 15.5 % higher than the roof cost of ESH. However, the maximum temperature<br />
difference is about 2 Celsius. According to the research published by J. Khedari. et al. (2003) which is<br />
a field study of performance of solar chimney with air-conditioned building, solar chimney house could<br />
save electrical energy from air-conditioner by 7-10% when compared to general house when the<br />
indoor temperature decreases by 1 Celsius. In a previous research work (J. Ratanachotinun et al.<br />
2009), on the study of cost <strong>and</strong> economic feasibility for energy saving house in Thail<strong>and</strong>, we reported<br />
that 57.7% of the sampling group of house owners preferred solar chimney house due its various<br />
advantages.<br />
As a summary of the overall study on solar chimney house model, it can be claimed that SCH average<br />
indoor temperature has good performance in all seasons. SCH is practical in real world <strong>and</strong> could<br />
maintain the temperature to be suitable for living year round (except when ambient temperature<br />
exceeds human body temperature). The average indoor temperature difference is around 2 Celsius.<br />
This research could be useful for SCH performance confirmation <strong>and</strong> help to gain approval from<br />
general house owners who would like to live in solar chimney house. Besides solar chimney design<br />
has several practical advantages such as installing electric wires <strong>and</strong> telephone cables in the air gap<br />
that would represent an additional saving too <strong>and</strong> reduce the puncture in the wall as done in general<br />
house.<br />
3.3 The design of solar chimney house according to past research <strong>and</strong> the results from this research<br />
could be presented in formulation of real energy saving house for construction <strong>and</strong> living. The fixed<br />
model is 2-story single house with 180 m 2 area as shown in figure 7 to 10. The materials for<br />
construction are common ones. The wall is made of red bricks <strong>and</strong> the roof is made of concrete tiles.<br />
As for the wall facing south, it will be a double layer wall <strong>and</strong> the roof will have two layers.<br />
Figure 7. House plan of bio-climatic energy saving house prototype
199<br />
International <strong>Building</strong> & <strong>Infrastructure</strong> Technology Conference<br />
7-8 June 2011, Vistana Hotel, Penang, Malaysia<br />
Figure 8. Front section of the bio-climatic energy saving house prototype<br />
Figure 9. Side elevations of bio-climatic energy saving house prototype
200<br />
International <strong>Building</strong> & <strong>Infrastructure</strong> Technology Conference<br />
7-8 June 2011, Vistana Hotel, Penang, Malaysia<br />
Figure 10. Side elevations of bio-climatic energy saving house prototype<br />
The proposed house plan of solar chimney house will be useful for the real construction in order to<br />
study guideline the efficiency of the energy saving <strong>and</strong> economic value as well as the suitable<br />
technique for construction. The house plan may be adapted to suit the real performance <strong>and</strong> the<br />
dem<strong>and</strong>s of the house owners.<br />
ACKNOWLEDGEMENT<br />
The authors wish to express their thanks for the financial support of this work by the Energy Policy <strong>and</strong><br />
Planning Office, Ministry of Energy, Thail<strong>and</strong> <strong>and</strong> the Thail<strong>and</strong> National Research University Project of<br />
the Higher Education Commission.<br />
REFERENCES<br />
B. Boonsri et al. (2000). “Ventilation Impact of a Solar Chimney on Indoor Temperature Fluctuation<br />
<strong>and</strong> Air Change in a School <strong>Building</strong>”, Energy & <strong>Building</strong>s, Vol.32, pp.89-93.<br />
C. Lertsatitthanakorn et al. (1997). “The Modified Trombe Wall: A Simple Ventilation Means <strong>and</strong> an<br />
Efficient Insulating Materials”, The Int. J. of Ambient Energy, Vol.19 , No.2, pp.104-110.
201<br />
International <strong>Building</strong> & <strong>Infrastructure</strong> Technology Conference<br />
7-8 June 2011, Vistana Hotel, Penang, Malaysia<br />
J. Khedari et al. (2003). “Field study of performance of solar chimney with air-conditioned building”,<br />
Energy, Vol.28, pp.1099-1114.<br />
J. Ratanachotinun et al. (2009). “The study of cost <strong>and</strong> feasible economic for energy saving house in<br />
Thail<strong>and</strong>”, International conference INTA-SEGA2009, Bangkok , Thail<strong>and</strong>, pp.42.<br />
J. Waewsak et al., 2003, “Numerical Modeling of Thermal <strong>and</strong> daylighting Performance of the Thi<br />
Bioclimatic Roof”, East-West Journal of Mathematics, Special Volume, 71-79.<br />
S. Chaima et al., 1997, “Investigation of Performance of Roof Solar Collector”, Second Asean<br />
Renewable Energy Conference, Phuket, pp.448-451.<br />
S. Wachirapuwadon et al., 2001, “New configurations of roof solar collector maximizing natural<br />
ventilation”, <strong>Building</strong> <strong>and</strong> Environment, Vol.36, pp. 383-391.<br />
T. Bunnag et al., 1997, “Experimental Study of Roof Solar Collector Towards the Natural Ventilation of<br />
New Habitations”, Energy <strong>and</strong> <strong>Building</strong>s, Vol.26, No.2, pp.159-164.
T145<br />
202<br />
International <strong>Building</strong> & <strong>Infrastructure</strong> Technology Conference<br />
7-8 June 2011, Vistana Hotel, Penang, Malaysia<br />
THE POTENTIAL OF USING BOTTOM ASH (BA) ADDITIVES IN ROAD BASE<br />
Norazlan K. 1 , Norbaya S. 2 , Mohd Fadzil A. 3<br />
1,2,3 Faculty of Civil Engineering, UiTM Shah Alam<br />
1 aln_kh82@yahoo.com<br />
ABSTRACT: This paper presents the results of study on the potential of using bottom ash (BA) in road<br />
base crushed aggregate. The bottom ash used in this study from Jimah Power Plant. The bottom ash<br />
been tested <strong>and</strong> the sizes range from 0.075mm to 2mm, indicating s<strong>and</strong> size (about 90%). This<br />
sample of bottom ash also classified as type-F fly ash because bottom ash describe as siliceous <strong>and</strong><br />
aluminous materials that possess little or no cementatious value because the lime (CaO) content is<br />
relatively low. The road base aggregate been used in this study is based on gradation limits for<br />
crushed aggregate road base from JKR specification. This study examines the potential of using<br />
bottom ash (BA) as additives to the crushed aggregate for road base <strong>and</strong> substitution the s<strong>and</strong> size<br />
with bottom ash for the crushed aggregate for road base. The objective of this study is to determine<br />
the optimum concentration additives of bottom ash (BA) based on the CBR value <strong>and</strong> the CBR value<br />
for road base aggregate mixed with the optimum concentration of bottom ash (BA). The second<br />
objective is to determine the CBR value for the substitution of s<strong>and</strong> portion (from 0.075mm to 2mm) in<br />
road base crushed aggregate with the bottom ash. This study involved the California Bearing Ratio<br />
(CBR) test to determine the strength of CBR value for base course materials. The entire test involved<br />
for unsoaked test. The CBR results for all testing were compared to the control of CBR value for<br />
crushed road base aggregate. The laboratory result shows, the optimum concentration of using<br />
bottom ash (BA) as additives in road base aggregate is about 9%. The addition of 9% bottom ash (BA)<br />
to the road base crushed aggregate were improve the CBR value <strong>and</strong> gives the best result for CBR<br />
value compared to the control. The substitution of s<strong>and</strong> size from 0.075mm to 2mm of road base<br />
crushed aggregate with bottom ash were gives 11% higher for CBR value compared to the control.<br />
These study shows, bottom ash more effective used as additives to the road base aggregate to<br />
enhance the CBR value.<br />
Keywords: Bottom ash, California bearing ratio, road base<br />
1. INTRODUCTION<br />
Nowadays Malaysia promotes coal as a fuel of choice for power generation, to free up more natural<br />
gas for export. Coal was introduced as a raw material for power generation since 1988 in Malaysia.<br />
Coal consumption is expected to increase from 10 million tonne to 19 million tonne in year 2010<br />
(Joseph, 2005). Consequently, a large volume of coal ash produced is typically disposed of as a waste<br />
in utility disposal sites. Coal ash mostly consists of fly ash <strong>and</strong> bottom ash. According to the American<br />
Coal Ash Association (ACAA, 2006), in the US, the general production ration of fly ash <strong>and</strong> bottom ash<br />
is approximately 80:20. The heavier ash that drops through the bottom of the furnace where it is<br />
collected in a funnel is called as bottom ash.<br />
Some of the studies showed the engineering properties of bottom ash were more favorable than those<br />
of traditional highway material <strong>and</strong> has the capability to improve asphalt pavement performance when<br />
used to substitute a portion of the aggregate in asphalt mixes (Wei, 1990). The U.S. Environmental<br />
Protection Agency (EPA, 2005) encourage the use of coal combustion products in highway<br />
construction projects such as road base, embankments, flowable fill, <strong>and</strong> other beneficial applications.<br />
The increased use of these materials, would be discarded a waste <strong>and</strong> reduce greenhouse gases in<br />
the atmosphere, reduce energy consumption, <strong>and</strong> conserve natural resources.<br />
According to American Coal Ash Association (ACCA, 1996), in 1996 an approximately 0.6 million<br />
metric tonne of bottom ash were used as road base or sub base materials. Bottom ash could be used<br />
as a road materials as additives or replacing certain size of aggregate to its characteristic (Maria
203<br />
International <strong>Building</strong> & <strong>Infrastructure</strong> Technology Conference<br />
7-8 June 2011, Vistana Hotel, Penang, Malaysia<br />
Izquierdo, 2007). Some of the engineering properties of bottom ash that are of particular interest when<br />
bottom ash are used as an aggregate in granular base applications are gradation, specific gravity <strong>and</strong><br />
unit weight, moisture-density relationship, degradation under compaction, shear strength, bearing<br />
strength, <strong>and</strong> corrosivity. The gradations of bottom ash are considered fine aggregates (ASTM 1994).<br />
In order to improve the sizing characteristics of the bottom ash or boiler slag, a conventional<br />
aggregate may be blended with the ash prior to its use in a base or subbase.<br />
This study examines the potential of using bottom ash (BA) as additives to the crushed aggregate for<br />
road base <strong>and</strong> bottom ash use as substitution for s<strong>and</strong> size to the crushed aggregate for road base.<br />
This study involved the determination of optimum concentration additives of bottom ash (BA) based on<br />
the CBR value <strong>and</strong> the CBR value of mixed road base aggregate with the optimum concentration of<br />
bottom ash (BA). The second objective is to determine the CBR value when the substitution of s<strong>and</strong><br />
size from 0.075mm to 2mm of road base crushed aggregate size with the of bottom ash. The<br />
laboratory was conducted to determine the CBR value. It shown that bottom ash can be usefully used<br />
as additives to the road base aggregate.<br />
2. MATERIALS AND METHODS<br />
2.1 Road Base Aggregate<br />
The aggregate sample for road base was collected from Hanson Quarry based on the gradation limit<br />
for road base aggregate from JKR road work specification shown in Figure 1. The properties of road<br />
base aggregate shown in Table 1.<br />
Percentage Passing, (%)<br />
100<br />
90<br />
80<br />
70<br />
60<br />
50<br />
40<br />
30<br />
20<br />
10<br />
0<br />
0.01 0.1 1 10 100<br />
Lower Range Road Particle Base Size, Aggregate (mm)<br />
Upper Range<br />
Figure 1. Particle size distribution for road base aggregate based on gradation limit from<br />
JKR Specification for road work<br />
2.2 Bottom Ash<br />
Table 1. Physical properties of Road Base Aggregate<br />
Properties Values<br />
Specific gravity, (Gs) 2.67<br />
Particle size distribution:<br />
Gravel (%) 70<br />
S<strong>and</strong> (%) 20<br />
Fine/Silt (%) 10<br />
Compaction Characteristic:<br />
Optimum water content, % 7.26<br />
Maximum dry density, (Mg/m 3 ) 2.07<br />
The main additives materials used in this study were bottom ash (BA) <strong>and</strong> collected from TNB Power<br />
Plant in Port Dickson, Negeri Sembilan. The bottom ash was sieved <strong>and</strong> the size ranging from<br />
0.075mm to 2mm indicating s<strong>and</strong> size <strong>and</strong> the result shown in Figure 2. The bottom ash also tested
204<br />
International <strong>Building</strong> & <strong>Infrastructure</strong> Technology Conference<br />
7-8 June 2011, Vistana Hotel, Penang, Malaysia<br />
for physical properties <strong>and</strong> the result shown in Table 2. The result for chemical properties of bottom<br />
ash determined by X-ray fluorescence (XRF) test shown in Table 3 <strong>and</strong> the bottom ash (BA) sample<br />
classified as Class-F ash. Table 4 shows the classification of BA compliance with ASTM C618. Based<br />
on the result, BA describe as siliceous <strong>and</strong> aluminous materials that possess little or no cementatious<br />
value consisting a little quantity of Calcium Carbonate (CaO) lower than 10%. The combination<br />
percentage composition of silicon dioxide (SiO2), aluminina oxide (Al2O3) <strong>and</strong> iron oxide (Fe2O3) more<br />
than 70 percent. This BA considered as non self-cementing ash because having pozzolanic properties<br />
<strong>and</strong> no or small quantities of self-cementing properties sources of calcium <strong>and</strong> magnesium ions.<br />
Percentage Finer<br />
CLAY-- |-------------SILT-------------| --------------SAND-------------|-----------GRAVEL---------|<br />
100<br />
90<br />
80<br />
70<br />
60<br />
50<br />
40<br />
30<br />
20<br />
10<br />
0<br />
0.0010.002<br />
0.006 0.02 0.06 0.2 0.6 2 6 10 60<br />
Particle Size (mm)<br />
Figure 2. Particle size distribution for Jimah bottom ash<br />
Table 2. Physical properties of Jimah Bottom ash (BA)<br />
Properties Values of BA<br />
Natural Moisture content, (%)<br />
Specific gravity, (Gs) 2.06<br />
Particle size distribution:<br />
Gravel (%) 0<br />
S<strong>and</strong> (%) 84.5<br />
Fine/Silt (%) 15.5<br />
Compaction Characteristic:<br />
Optimum water content, % 8<br />
Maximum dry density, (Mg/m 3 ) 1.227<br />
Classification (BS) SAND with fine soils<br />
Table 3. Chemical composition of Jimah Bottom ash (BA)<br />
Chemical Constituents Chemical Composition of Jimah BA (%)<br />
Silicon Dioxide (silica) , SiO2<br />
46.60<br />
Alumunium trioxide, Al2O3<br />
30.30<br />
Iron oxide, Fe2O3<br />
6.44<br />
TiO2<br />
3.31<br />
Calcium Oxides (lime) CaO 0.68<br />
Potasium oxide , K2O 0.50<br />
Sodium oxide , Na2O 0.26<br />
Magnesium oxide, MgO -<br />
Sulphate, SO3<br />
0.09<br />
L.O.I 0.64
2.3 Laboratory testing<br />
205<br />
International <strong>Building</strong> & <strong>Infrastructure</strong> Technology Conference<br />
7-8 June 2011, Vistana Hotel, Penang, Malaysia<br />
Table 4. Classification of PFA compliance with ASTM C618<br />
Chemical<br />
Requirements<br />
for Fly Ash<br />
Classification<br />
(ASTM C618)<br />
Properties Requirement Class<br />
Result of<br />
chemical<br />
composition<br />
of Jimah BA<br />
F<br />
Class<br />
C<br />
(%)<br />
SiO2 +<br />
Al2O3 +<br />
Fe2O3<br />
Min (%) 70 50 83.34<br />
SO3 Max (%) 5 5 0.09<br />
Loss on<br />
ignition<br />
Max (%) 6 6 0.64<br />
There are several testing carried out to determine the physical properties of road base aggregate <strong>and</strong><br />
bottom ash based on BS 1377: 1990. The main testing is the California Bearing Ratio (CBR) test<br />
carried out to determine the CBR value of the samples. The CBR test carried out based on the<br />
st<strong>and</strong>ard procedure given in BS1377-4: 1990 <strong>and</strong> ASTM D1883. This test method is used to evaluate<br />
the potential strength of sub-grade, sub-base <strong>and</strong> base course material. CBR defined as the ratio of<br />
the load sustained by the specimen at 2.5 or 5.0 mm penetration to the load sustained by st<strong>and</strong>ard<br />
load aggregates at corresponding penetration level. In this study, unsoaked CBR tests were<br />
performed on the samples. The samples were prepared with its OMC <strong>and</strong> were compacted at their<br />
MDD by using static compaction machine.<br />
3. RESULT AND DISCUSSION<br />
3.1 The optimum concentration of bottom ash as an additives in road base aggregate<br />
Figure 3 shows the optimum concentration result of bottom ash (BA) been used as additives to the<br />
road base aggregate. It was found that, the optimum concentration of bottom ash is about 9% with the<br />
CBR value about 204%. The graph shows, more than 9% of bottom ash been used as an additives to<br />
the road base aggregate will give the lower of CBR value.<br />
CBR value<br />
The graph of CBR value versus Percentage of Bottom Ash<br />
250<br />
200<br />
150<br />
100<br />
50<br />
0<br />
0 10 20 30 40 50<br />
Percentage (%) of BA<br />
Figure 3. The graph of CBR value versus the percentage of bottom ash
206<br />
International <strong>Building</strong> & <strong>Infrastructure</strong> Technology Conference<br />
7-8 June 2011, Vistana Hotel, Penang, Malaysia<br />
3.2 Comparison of CBR value between road bases aggregate mixed 9% bottom ash with<br />
the control (road base aggregate)<br />
Figure 4 shows the comparison result of CBR value between the control (road base aggregate) <strong>and</strong><br />
road base aggregate mixed with 9% bottom ash (BA). The finding indicates that the addition of 9%<br />
additives of bottom ash was giving the best result in term of CBR value about 210% compared to the<br />
control only 115.9%. It shows an increment percentage about 81% by using the additive of bottom ash<br />
compared to the control. It can be seen that the CBR value of road base depend on the presence of<br />
additive such as bottom ash because bottom ash considered as fine aggregate <strong>and</strong> this will fill the void<br />
<strong>and</strong> space between the road base aggregate materials.<br />
CBR Value (%)<br />
250<br />
200<br />
150<br />
100<br />
50<br />
0<br />
Road Base (RB)<br />
aggregate as Control<br />
RB aggregate + 9% BA<br />
CBR value (%) 115.9 210.0<br />
Figure 4. CBR value for road base aggregate (control) <strong>and</strong> road base aggregate mixed with<br />
9% bottom ash<br />
3.3 Comparison of CBR value between control (Road base aggregate) <strong>and</strong> substitutions of<br />
s<strong>and</strong> aggregate size in road base aggregate with bottom ash<br />
Figure 5 show the comparison result of CBR value between the control (road base aggregate) <strong>and</strong> the<br />
substitutions of s<strong>and</strong> size (from 0.075mm to 2mm) in road bases aggregate with bottom ash. The<br />
results shows that the substitutions of s<strong>and</strong> size with bottom ash were give slightly give higher <strong>and</strong><br />
best result of CBR value about 129.7 % compared 115.9% for control (road base aggregate only).<br />
This shows an increment percentage of CBR value about 12% to the control.<br />
CBR Value (%)<br />
135<br />
130<br />
125<br />
120<br />
115<br />
110<br />
105<br />
Road Base (RB) aggregate<br />
as Control<br />
RB aggregate + Substitution<br />
of s<strong>and</strong> aggregate with BA<br />
CBR value (%) 115.9 129.7<br />
Figure 5. CBR value for road base aggregate (control) <strong>and</strong> substitution of s<strong>and</strong> size in the road base<br />
aggregate with bottom ash
3.4 Summarized of laboratory result<br />
207<br />
International <strong>Building</strong> & <strong>Infrastructure</strong> Technology Conference<br />
7-8 June 2011, Vistana Hotel, Penang, Malaysia<br />
Figure 6 show the illustrated comparison of three laboratory result for CBR value between the control<br />
(road base aggregate) <strong>and</strong> road base aggregate mixed with 9% of bottom ash (BA) <strong>and</strong> bottom ash<br />
substituted to the s<strong>and</strong> size in road base aggregate. Among the three results shown, by using 9%<br />
additive of bottom ash were gives the better <strong>and</strong> higher result of CBR value about 210% compared to<br />
the control (about 115.9%) <strong>and</strong> compared to the substitution s<strong>and</strong> size with bottom ash (about<br />
129.7%). It can be seen slightly increment percentage for substitution s<strong>and</strong> aggregate with bottom<br />
ash about 12% higher compared to control.<br />
4. CONCLUSIONS<br />
CBR Value (%)<br />
250<br />
200<br />
150<br />
100<br />
50<br />
0<br />
Road Base (RB)<br />
aggregate as Control<br />
RB aggregate + 9%<br />
BA<br />
RB aggregate +<br />
Substitution of s<strong>and</strong><br />
aggregate with BA<br />
CBR value (%) 115.9 210.0 129.7<br />
Figure 6. CBR value for three experimental results<br />
Based on this study, bottom ash is suitable material to be used as road base additives. It was proved<br />
by experimental from laboratory result. By using of bottom ash (BA) as an additives material to the<br />
road base aggregate was improved the CBR value strength. Instead, bottom ash can be used as<br />
substitution of s<strong>and</strong> aggregate size (from 0.075mm to 2mm) in road base aggregate materials. These<br />
also were giving the higher of CBR value compared to control. Nevertheless, bottom ash (BA) more<br />
effective as additives <strong>and</strong> can be used as alternative additives materials to the road base aggregate to<br />
enhance <strong>and</strong> improve the CBR value. Thus this will reduce the construction cost <strong>and</strong> solving disposal<br />
problems.<br />
REFERENCES<br />
American Coal Ash Association (1996). Coal Combustion By-Product Production <strong>and</strong> Use: 1966-<br />
1994. Alex<strong>and</strong>ria, Virginia, 1996.<br />
American Coal Ash Association, ACAA.2005a. (2003). Coal Combustion Product (CCP) Production<br />
<strong>and</strong> Use Survey. Ash at work (Winter/Spring):25<br />
ASTM D1241 (1994). “St<strong>and</strong>ard Specification for Materials for Soil-Aggregate Subbase, Base, <strong>and</strong><br />
Surface Courses.” American Society for Testing <strong>and</strong> Materials, Annual Book of ASTM St<strong>and</strong>ards,<br />
Volume 04.08, West Conshohocken, Pennsylvania.<br />
ASTM D1883 (1994). St<strong>and</strong>ard Specification for CBR (California Bearing Ratio) of laboratory<br />
compacted soils. American Society for Testing <strong>and</strong> Materials, Annual Book of ASTM St<strong>and</strong>ards.
208<br />
International <strong>Building</strong> & <strong>Infrastructure</strong> Technology Conference<br />
7-8 June 2011, Vistana Hotel, Penang, Malaysia<br />
ASTM D2940. (1994) “St<strong>and</strong>ard Specification for Graded Aggregate Material for Bases or Subbases<br />
for Highways or Airports.” American Society for Testing <strong>and</strong> Materials, Annual Book of ASTM<br />
St<strong>and</strong>ards, Volume 04.03, West Conshohocken, Pennsylvania.<br />
British St<strong>and</strong>ard Institution, (1990) British St<strong>and</strong>ard Method of Test for Soils for Civil Engineering<br />
Purposes. London: (BS 1377).<br />
Collins, Robert J. <strong>and</strong> Stanley K. Ciesielski (1994). Recycling <strong>and</strong> Use of Waste Materials <strong>and</strong> By-<br />
Products in Highway Construction. National Cooperative Highway Research Program Synthesis<br />
of Highway Practice No. 199, Transportation Research Board, Washington, DC<br />
Huang H.W. (1990). The Use of Bottom Ash in Highway Embankments, Subgrade <strong>and</strong> Subbases.<br />
Joint Highway Research Project, Final Report, FHWA/IN/JHRP-90/4! Purdue University, W. Lafayette,<br />
Indiana.<br />
Joseph, C. Chong. (2005). Report of the Fourth Meeting of The Asean Forum on Coal (AFOC)<br />
Council. New World Renaissance Hotel, Makati City, Philippines.<br />
Lee Foo Wei, Aminaton Marto, Ahmad Mahir Makhtar <strong>and</strong> Tey Kim Hai (2011). Signalling Engineering<br />
Characterization Of Tanjung Bin Bottom Ash. Proceedings of Geotropika Conference 2011.<br />
Maria Izquierdo , Xavier Querol, Alej<strong>and</strong>ro Josa, Enric Vazquez, Angel López-Soler (2007),<br />
Comparison between laboratory <strong>and</strong> field leachability of MSWI bottom ash as a road material.<br />
Institute of Earth Sciences “Jaume Almera” (CSIC), C/Lluís Solé i Sabarís s/n, 08028<br />
Barcelona, Spain<br />
U.S. Environmental Protection Agency (EPA, 2005), Using Coal Ash in Highway Construction - A<br />
Guide to Benefits <strong>and</strong> Impacts, U.S. Environmental ProtectionAgency (EPA).<br />
Wei H.H. (1990). The Use of Bottom Ash in Highway Embankments, Subgrade <strong>and</strong> Subbases. Joint<br />
Highway Research Project, Final Report, FHWA/IN/JHRP- 90/4 Purdue University, W. Lafayette,<br />
Indiana.
T146<br />
209<br />
International <strong>Building</strong> & <strong>Infrastructure</strong> Technology Conference<br />
7-8 June 2011, Vistana Hotel, Penang, Malaysia<br />
STATIC LOADING ON DEEP BEAMS WITH LARGE OPENING WITH AND<br />
WITHOUT CFRP SHEETS AT BENDING ZONE<br />
Preetpal Kaur A/P Ragbir Singh 1 <strong>and</strong> Nasir Shafiq 2<br />
1, 2 Universiti Teknologi Petronas, Perak, Malaysia<br />
1 r<strong>and</strong>hawa_preeti1985@yahoo.com.my, 2 nasirshafiq@petronas.com.my<br />
ABSTRACT: In the construction of modern buildings, tall buildings <strong>and</strong> other industrial structures,<br />
pipes <strong>and</strong> ducts are installed to accommodate essential services such as water supply, sewerage, air<br />
conditioning, electricity, telephone <strong>and</strong> computer network. These pipes <strong>and</strong> ducts usually run<br />
horizontally <strong>and</strong> vertically. Pipes <strong>and</strong> ducts that have horizontal layout <strong>and</strong> run under the ceiling may<br />
sometimes penetrate through RC columns. These openings can cause RC beams to become weaker<br />
in load resistance due to shear <strong>and</strong> bending moment. This depends on the size, shape <strong>and</strong> location of<br />
the openings. The beam will reduce its stiffness under service load with higher deflection. Besides<br />
that, loads higher than the design service loads or chemical processes due to aggressive<br />
environmental conditions can damage the existing structures. This research focuses on static loading<br />
on reinforced concrete deep beams with openings. This research also studies the prospect of<br />
strengthening the beams by using external bonded CFRP in different combinations or arrangement to<br />
regain bending capacity that was lost due to the openings. The openings are circular, rectangular,<br />
square <strong>and</strong> elliptical shaped. Nine identical beams with <strong>and</strong> without opening were cast <strong>and</strong> tested<br />
under static loading with several different arrangements of CFRP sheets to regain the lost strength.<br />
Carbon Fibre Reinforced Polymer (CFRP) can increase the strength lost due to large opening with<br />
appropriate strengthening configuration <strong>and</strong> location of the CFRP. The usage is maximized by<br />
applying the CFRP perpendicular to the expected crack pattern on beams with large opening for<br />
bending zone.<br />
Keywords: static loading, beam with opening, CFRP<br />
1. INTRODUCTION<br />
In the construction of modern buildings, tall buildings <strong>and</strong> other industrial structures, pipes <strong>and</strong> ducts<br />
are installed to accommodate essential services such as water supply, sewerage, air conditioning,<br />
electricity, telephone <strong>and</strong> computer network. These pipes <strong>and</strong> ducts usually run horizontally <strong>and</strong><br />
vertically. Horizontal pipes <strong>and</strong> ducts that run under the ceiling may sometimes penetrate through RC<br />
columns. These openings will cause RC beams to become weaker in load resistance due to shear <strong>and</strong><br />
bending moment. This depends upon the size, shape <strong>and</strong> location of the openings. The beam will<br />
have higher deflection under service load. This will occur when the beam stiffness reduces. In the<br />
continuous beam with opening the redistribution of moments <strong>and</strong> internal forces occurs. When a beam<br />
with opening has insufficient special reinforcement, the beam will reduce its strength to a critical<br />
degree.<br />
Besides that, loads higher than the design service loads or chemical processes due to aggressive<br />
environmental conditions can damage the existing structures. The openings in the beams may be<br />
different in shapes <strong>and</strong> sizes. Prentzas (1968), in his extensive experimental study, considered<br />
openings of circular, rectangular, diamond, triangular, trapezoidal <strong>and</strong> even irregular shapes. Among<br />
all these openings, the most constructed ones are circular <strong>and</strong> rectangular. Circular openings<br />
accommodate service pipes, such as for plumbing <strong>and</strong> electrical supply. Rectangular openings<br />
accommodate rectangular air conditioning ducts. One of the ways to reduce possible stress<br />
concentrated at the sharp corners of rectangular openings is by rounding off these sharp edges. This<br />
will improve the cracking behavior of the beam in service. Mansur <strong>and</strong> Hasnat (1979) have defined<br />
openings such as circular, square or nearly square as small openings. According to Somes <strong>and</strong> Corley<br />
(1974), large circular opening has its diameter exceeds 0.25 times the depth of the beam web.
210<br />
International <strong>Building</strong> & <strong>Infrastructure</strong> Technology Conference<br />
7-8 June 2011, Vistana Hotel, Penang, Malaysia<br />
The carbon fibre reinforced polymer (CFRP) is one of the reinforced materials that are widely used for<br />
repairing all kind of RC structures. The CFRP is used as external reinforce to the concrete members,<br />
which is different from other reinforced material that is used to reinforce the concrete members<br />
internally. The material used in upgrading <strong>and</strong> strengthening structural capacity is CFRP. In the bridge<br />
construction, CFRP is most commonly used. CFRP strips are lighter, non-corrosive, <strong>and</strong> less intensive<br />
than the application of the steel plate or exterior post-tensioning. Structural elements can increase its<br />
strength by pasting CFRP externally. The lightweight of CFRP strips can provide ten times the tensile<br />
strength of steel. The capability of the CFRP to carry loads in tension can be a way to strengthen<br />
against flexural, shear or compression, depending on how the CFRP strips are oriented to the<br />
longitudinal reinforcing steel. Steel has superior qualities in terms of strength <strong>and</strong> compatibility with<br />
concrete where steel is an effective concrete reinforcement. However, steel is highly susceptible to<br />
oxidation when exposed to chlorides. Factors such as insufficient cover, poor design or workmanship,<br />
poor concrete mix <strong>and</strong> aggressive environment can break down the protection layer <strong>and</strong> may lead to<br />
corrosion of the steel rebars.<br />
For several decades, Fiber Reinforced Polymeric (FRP) is a kind of polymer besides CFRP that is<br />
widely used in the aerospace industry. Recently both FRP <strong>and</strong> CFRP are becoming popular in the<br />
construction industry for strengthening purpose. This is due to CFRP has the advantages of<br />
compositing materials such as immunity to corrosion, a low volume to weight ratio, a high strength to<br />
weight ratio, <strong>and</strong> unlimited delivery length (in sheet form), thus eliminating the need for joints. The<br />
usage of CFRP as an effective mean of improving, upgrading <strong>and</strong> strengthening reinforced concrete<br />
beams. This CFRP improves the efficiency of construction work. This is due to CFRP is applied<br />
externally to the reinforced concrete beam whereas the reinforced can only be applied internally in the<br />
beam. By using conventional method, the beam has to be hacked of the reinforced before the<br />
reinforced can be applied internally in the beam. This will create problem, as it has to rectify the<br />
structurally deteriorated or functionally obsolete reinforced concrete beam. This method wastes a lot of<br />
money. The following are some advantages of using CFRP for bending strengthening in the critical<br />
bending zone of the beam with large opening:<br />
i. Tailorability; the CFRP sheets can be arranged to the loading condition to optimize the<br />
performance.<br />
ii. It has a low weight that reduces transportation expenses <strong>and</strong> allows for some prefabrication<br />
that consequently reduces time at the job site.<br />
iii. CFRP does not have a yield limit <strong>and</strong> more or less elastic up to failure.<br />
iv. CFRP has high elastic modulus <strong>and</strong> high strength in both tension <strong>and</strong> compression mode.<br />
The strongest <strong>and</strong> stiffest reinforcing fibers for polymer composites are carbon fibers. The most<br />
commonly used are glass fibers. These fibers are made of pure carbon in form of graphite <strong>and</strong> the<br />
fibers are low in density. These fibers also have a negative coefficient of longitudinal thermal<br />
expansion. These carbon fibers are very expensive <strong>and</strong> can give galvanic corrosion in contact with<br />
metals. Therefore, they are generally used together with epoxy where high strength <strong>and</strong> stiffness is<br />
required. Generally, there are eight possible failure modes in CFRP strengthened reinforced concrete<br />
beams. Not all of this eight failure modes can be observed in this research. For a simply supported<br />
reinforced concrete beam strengthened by CFRP the following four modes will most likely occur:<br />
i) CFRP rupture in tension zone<br />
ii) Concrete crush in compression<br />
iii) Delamination between CFRP <strong>and</strong> concrete<br />
iv) CFRP peeling off in curtail zone resulting from a combination of shear <strong>and</strong> tensile stresses<br />
in the plane of the longitudinal steel bars.<br />
This research focuses on static loading on reinforced concrete deep beams with openings. This<br />
research also studies the prospect of strengthening the beams by using external bonded CFRP in<br />
different combinations or arrangement to regain bending capacity that was lost due to the openings.<br />
The material used to develop the strength of the beam is CFRP sheets. The openings are circular,<br />
rectangular, square <strong>and</strong> elliptical shaped. The purposes of these large openings in floor beams are to<br />
facilitate the passage of utility pipes <strong>and</strong> service ducts. Nine identical beams with <strong>and</strong> without opening<br />
were casted <strong>and</strong> tested under static loading with several different arrangements of CFRP sheets to<br />
regain the lost strength.
2. METHODOLOGY<br />
Figure 1. Experimental Setup<br />
211<br />
International <strong>Building</strong> & <strong>Infrastructure</strong> Technology Conference<br />
7-8 June 2011, Vistana Hotel, Penang, Malaysia<br />
Figure 2. CFRP Debonding After Static Fracture of Reinforcing Steel<br />
2.1 CASTING 9 CONCRETE DEEP BEAMS<br />
In this research, the bending moment loss due to the large web opening is to be studied. By using<br />
CFRP it can be determined how much strength the beam regained even though there are large<br />
opening in the beam. As CFRP is an expensive material, the significance of using CFRP to regain the<br />
strength should be relatively feasible to be implemented in the industry. Nine beams were cast to test<br />
the strength of the beams. One of these beams is solid beams (reference beam) that have no<br />
openings. Two beams has circular opening (270mm diameter) in the middle of the beam <strong>and</strong> the other<br />
two has square openings (240mm X 240mm) in the middle of the beam. Two beams have rectangular<br />
opening (700mm X 500mm) in the middle of the beam <strong>and</strong> the last two has elliptical openings in the<br />
middle of the beam. All these nine beams were divided into two group that is CFRP <strong>and</strong> non-CFRP<br />
group. The CFRP group beams were tested under static loading that will have circular <strong>and</strong> square<br />
beams strengthen with CFRP sheets. The non-CFRP group beams tested under static loading that will<br />
have rest of the beams tested without strengthen with CFRP sheets. The criteria’s for 9 Test Beams is<br />
shown in Table 2.<br />
The concrete strength, fcu is 35+/- 5Mpa. The beams have 2T12 rebar as the bottom rebars <strong>and</strong> 2T10<br />
rebar at the top of the beam. These rebars act as the main bars in the beams. The beams also have<br />
stirrups of R6 rebar with spacing of 300mm center to center. The beams were cast using the ready mix<br />
concrete with the strength of 35Mpa. The concrete cover used was 10mm top <strong>and</strong> bottom. First, the<br />
formwork of the beams was prepared following the dimension of the beams. The dimensions of all 9<br />
beams are 2500mm X 500mm X 150mm. For the square opening, wooden framework was used to<br />
ensure the hollow section is maintained during casting. As for the circular opening, the hollow section<br />
was maintained by using a pipe of external diameter Φ270mm. Formwork must be applied with grease<br />
before the pouring of concrete. When the formwork for all the beams is done, with all the rebar <strong>and</strong><br />
stirrups are placed as designed, then ready mix concrete is poured in the formwork. A poker was
212<br />
International <strong>Building</strong> & <strong>Infrastructure</strong> Technology Conference<br />
7-8 June 2011, Vistana Hotel, Penang, Malaysia<br />
used to apply vibration the mixture in the formwork. Three layers of mixture were placed in the each<br />
formwork <strong>and</strong> poker was used to vibrate after each layer was placed. A poker vibrator was used to<br />
ensure air is not entrapped <strong>and</strong> to avoid honeycomb in the concrete. However, the vibrator should not<br />
be used too long (more than 1 minute) which could lead to bleeding <strong>and</strong> segregation problems in the<br />
concrete later on. The top layer should not be vibrated, <strong>and</strong> surface to be finished. Then the beams<br />
were left for three days in the formwork to harden.<br />
After three days, the formwork of the beams was open <strong>and</strong> the beams were place at the corridor of the<br />
lab for curing purpose by water. The beams are big in size <strong>and</strong> there are no curing tanks big enough<br />
for these beams. Therefore, the beams were cover with sacks <strong>and</strong> water daily. The functions of the<br />
sacks are to keep water so that the beams will not over dry <strong>and</strong> to avoid surface cracks at the surface<br />
of the beams. The extra ready mix concrete were placed in 15 cubes’ moulds 100mm X 100mm. A<br />
poker was used to apply vibration to the mixture in the mould. Three layers of mixture were place in<br />
the each mould <strong>and</strong> poker was used to vibrate after each layer was place. The vibration was only<br />
given for 2 seconds. It cannot be more than 2 seconds, as it will enhance watering <strong>and</strong> segregation in<br />
the mixture. This will give wrong result later when tested under compression test. Then the cubes were<br />
left one day in the mould to harden. The next day, the moulds were open <strong>and</strong> the cubes were place in<br />
water for curing purpose. On the 3 rd day three cubes were tested under compression test. Then the<br />
other three cubes were tested on the 7 th day. The rest nine cubes were tested on the 28 th day. The<br />
major purpose of this cube testing is to find out the concrete strength, fcu on the 28 th day. The<br />
concrete strength, fcu supposedly should be 35+/-5Mpa <strong>and</strong> this was achieved in this experiment.<br />
The beams were tested after 28 days using the self straining loading frame machine. The solid beam<br />
is tested first. Then the beams with the circular <strong>and</strong> square opening in the middle were tested<br />
continued with the rest of the beams. The CFRP is pasted based on the crack pattern that is obtained<br />
from the circular <strong>and</strong> square opening beams tested under static. This will increase the strength of the<br />
beams with circular <strong>and</strong> square opening. Beams with rectangular <strong>and</strong> elliptical opening have higher<br />
static load then the solid, therefore no need to paste CFRP sheets. Below shown compression test<br />
result for cubes in Table 1 <strong>and</strong> average compression strength of concrete increases as the Day<br />
Increases in Figure 3,<br />
Table 1. Compression Test Result for 15 Cubes<br />
Compressive Strength<br />
Days Cube Maximum Load (kN)<br />
(N/mm 2 )<br />
A 147.40 14.74<br />
3 B 143.10 14.31<br />
C 141.10 14.11<br />
A 185.90 18.59<br />
7 B 189.90 18.99<br />
C 189.50 18.95<br />
A 350.52 35.05<br />
B 350.85 35.08<br />
C 351.42 35.14<br />
D 350.02 35.00<br />
28 E 35.12 35.12<br />
F 350.74 35.07<br />
G 350.94 35.09<br />
H 350.53 35.05<br />
I 351.26 35.13
Beam<br />
No<br />
Compression Strength of<br />
Concrete (N/mm^2)<br />
213<br />
International <strong>Building</strong> & <strong>Infrastructure</strong> Technology Conference<br />
7-8 June 2011, Vistana Hotel, Penang, Malaysia<br />
Figure 3. Average Compression Strength of Concrete increases as the Day Increases<br />
CFRP<br />
Strengthening<br />
Average Compression Strength of Concrete is Plotted Against the<br />
Day Tested<br />
40<br />
35<br />
30<br />
25<br />
20<br />
15<br />
10<br />
5<br />
0<br />
0 1 2 3 4 5 6 7 8 9 10 11 12 13 14 15 16 17 18 19 20 21 22 23 24 25 26 27 28<br />
Shape of<br />
Opening<br />
1 No None<br />
Table 2. Criteria’s for 9 Test Beams<br />
Spam of<br />
Beam (mm)<br />
Design<br />
Strength<br />
(MPa)<br />
2300 +/- 35<br />
2 No Square (240 X<br />
240 mm) 2300 +/- 35<br />
3 Yes Square (240 X<br />
240 mm) 2300 +/- 35<br />
4 No Circular<br />
(Φ270 mm) 2300 +/- 35<br />
5 Yes Circular<br />
(Φ270 mm) 2300 +/- 35<br />
6 No Elliptical (Φ125 mm,<br />
h=500mm,<br />
d=250mm)<br />
7 No Elliptical (Φ125 mm,<br />
h=500mm,<br />
d=250mm)<br />
Days<br />
2300 +/- 35<br />
2300 +/- 35<br />
8 No Rectangular (700mm<br />
x 250mm ) 2300 +/- 35<br />
9 No Rectangular (700mm<br />
x 250mm 2300 +/- 35<br />
Number of<br />
Openings<br />
Location of<br />
Opening<br />
Type of<br />
Loading<br />
0 No Static<br />
2 850mm<br />
from the<br />
support<br />
2 850mm<br />
from the<br />
support<br />
2 850mm<br />
from the<br />
support<br />
2 850mm<br />
from the<br />
support<br />
1 875mm<br />
from the<br />
support<br />
1 875mm<br />
from the<br />
support<br />
1 900mm<br />
from the<br />
support<br />
1 900mm<br />
from the<br />
support<br />
Static<br />
Static<br />
Static<br />
Static<br />
Static<br />
Static<br />
Static<br />
Static
Figure 4. Drawings of the 9 tested beams<br />
214<br />
International <strong>Building</strong> & <strong>Infrastructure</strong> Technology Conference<br />
7-8 June 2011, Vistana Hotel, Penang, Malaysia<br />
Figure 5. Graph Plotted for All Tested Beams Under Static Condition Without CFRP Sheets
215<br />
International <strong>Building</strong> & <strong>Infrastructure</strong> Technology Conference<br />
7-8 June 2011, Vistana Hotel, Penang, Malaysia<br />
Figure 6. Graph Plotted to Show Comparison Among Circular <strong>and</strong> Square Opening Beam With <strong>and</strong><br />
Without CFRP Sheets Under Static Condition<br />
Figure 7. Failure of Solid Beam Under Static Figure 8. Failure of Square Opening Beam Condition<br />
Without CFRP Sheet Under Static Condition Without CFRP Sheet<br />
Figure 9. Failure of Rectangular Opening Figure 10. Failure of Square Opening Beam Beam<br />
Under Static Condition Without Under Static Condition With CFRP Sheet CFRP Sheet
216<br />
International <strong>Building</strong> & <strong>Infrastructure</strong> Technology Conference<br />
7-8 June 2011, Vistana Hotel, Penang, Malaysia<br />
Figure 11. Failure of Elliptical Opening Beam Under Static Condition Without CFRP Sheet<br />
3. DISCUSSION<br />
This research is focused on the effects of large opening in deep beams under static condition for<br />
bending zone as well as the configuration on CFRP used for strengthening the beams with openings.<br />
From the results obtained after carrying out the lab work for these nine beams, the summary of<br />
ultimate load is summarized in Table 3 below:<br />
Table 3. Summary of Static Load Test (Beams Without CFRP Sheets)<br />
Beam Characteristic (Beams<br />
without CFRP strengthening)<br />
Ultimate strength<br />
under static<br />
condition (kN)<br />
Deflection<br />
(mm)<br />
% lost or gain in strength<br />
due to opening in critical<br />
bending zone<br />
Solid beam (Reference Beam) 139.15 50.24 Nil<br />
Beam with Circular Opening 130.32 24.55 -6.5%<br />
Beam with Square Opening 132.42 69.73 -6.3%<br />
Beam with Elliptical Opening 143.97 27.59 +3.5%<br />
Beam with Rectangular Opening 139.82 21.40 +0.5%<br />
From Table 3, it can be observed that the deflection increase when there is square opening in the<br />
beam. The other opening beams have less deflection compared to solid beam. Deep beams are<br />
suitable to have large openings compared to solid beam. Deep beams with elliptical <strong>and</strong> rectangular<br />
opening can st<strong>and</strong> higher ultimate load <strong>and</strong> has less deflection compared to solid beam. The only<br />
opening beam that is weak is square opening beam. Therefore, deep beam with square opening is not<br />
suitable to have square opening in the middle. From Table 3, it is shown that circular <strong>and</strong> square<br />
opening beams lost its strength about 6-6.5% whereas elliptical <strong>and</strong> rectangular opening beams gain<br />
its strength about 0.5-3.5% compared to solid beam. Here can be conclude that deep beams are<br />
suitable to have large opening in the middle of the beam because the beam acts as a spring <strong>and</strong> allow<br />
energy to dissipate when load is being applied on it. The lost of strength is not much therefore, large<br />
opening in deep beams works well.<br />
Solid beam is heavy in mass <strong>and</strong> there is no opening for the energy to dissipate when load is being<br />
applied on it. Since square opening beams are weak, the only way to reduce the stress concentrated<br />
at sharp edges is by rounding off the sharp edges. Rectangular <strong>and</strong> elliptical opening beams have<br />
higher yield strength compared to square <strong>and</strong> circular opening beams. All the beams have good<br />
ductility from the elastic point compared to solid beam by referring the Figure 5. Since square <strong>and</strong><br />
circular opening beams lost its strength, therefore CFRP sheets are paste to gain its lost strength. The<br />
configuration of CFRP sheets pasted for square opening beam is shown in Figure 10. The CFRP<br />
sheets are paste front, back <strong>and</strong> bottom of the square opening beam. For circular opening beam, the<br />
CFRP sheets are only paste at the bottom (minimum usage of CFRP).<br />
From Figure 6, it shows that square opening beam gain its strength up to 10% (145.24 kN) compared<br />
to non-CFRP sheets pasted square opening beam. CFRP pasted for square opening was<br />
perpendicular to the crack pattern obtain from the beam without CFRP sheets, which was tested
217<br />
International <strong>Building</strong> & <strong>Infrastructure</strong> Technology Conference<br />
7-8 June 2011, Vistana Hotel, Penang, Malaysia<br />
earlier. The CFRP sheet pasted for circular was in minimum quantity therefore, not much strength<br />
increased for this beam. CFRP pasted for circular opening was not perpendicular to the crack pattern<br />
obtain from the beam without CFRP sheets, which was tested earlier. Carbon Fibre Reinforced<br />
Polymer (CFRP) can increase the strength lost due to large opening with appropriate strengthening<br />
configuration <strong>and</strong> location of the CFRP. The usage is maximized by applying the CFRP perpendicular<br />
to the expected crack pattern on beams with large opening for bending zone.<br />
4. CONCLUSIONS<br />
The conclusions of this study are listed below:<br />
1. The shape of opening does affect the loading capacity of the beam under bending zone. Elliptical<br />
<strong>and</strong> rectangular opening beams lost less strength compared to solid, square <strong>and</strong> circular opening<br />
beams. Square <strong>and</strong> circular opening beams lost more strength compared to solid beam. It means<br />
that the critical openings are square <strong>and</strong> circular for deep beams under static loading at bending<br />
zone. Rectangular <strong>and</strong> elliptical opening beams are not critical for deep beams under static<br />
condition at bending zone.<br />
2. The bending cracks for beams with square <strong>and</strong> rectangular opening were massive compared to<br />
the beams with circular <strong>and</strong> elliptical openings.<br />
3. Carbon Fibre Reinforced Polymer (CFRP) can increase the strength lost due to large opening with<br />
appropriate strengthening configuration <strong>and</strong> location of the CFRP. The usage is maximized by<br />
applying the CFRP perpendicular to the expected crack pattern on beams with large opening for<br />
bending zone.<br />
4. The beams increase its strength by increasing the bending capacity by using CFRP sheets even<br />
though there are large opening in the deep beam.<br />
REFERENCES<br />
Ahmad Shahrin Bin Mohamad. (2004). Thesis on Flexural Strengthening of RC Beams Using CFRP<br />
Strips. Malaysia: University Technology Petronas Library.<br />
C.-T. T. Hsu., W. Punurai., H. Bian., Y. Jia. (2003). Flexural Strengthening of Reinforced Concrete<br />
Beams Using Carbon Fibre Reinforced Polymer Strips. Magazine of Concrete Research (55/No.3), pg<br />
279-288.<br />
J.A.O, Barros., S.J.E, Dias., J.L.T. Lima. (2007). Efficacy of CFRP-based Technique for The Flexural<br />
<strong>and</strong> Shear Strengthening of Concrete Beams. Cement <strong>and</strong> Concrete Composites (29), pg 203-217.<br />
M.A. Mansur., Kiang-Hwee Tan CRC. (1999). Concrete Beams with Openings Analysis <strong>and</strong> Design<br />
Book. New York: Press LLC.<br />
M.R, Islam., M.A, Mansur., M, Maalej. (2005). Shear strengthening of RC Deep Beams Using<br />
Externally Bonded FRP System. Cement <strong>and</strong> Concrete Composites (27), pg 413-420.<br />
Muhammad Masood Rafi., Ali Nadjai., Faris Ali., Didier Talamona. (2008). Aspects of behaviour of<br />
CFRP Reinforced Concrete Beams in Bending. Construction <strong>and</strong> <strong>Building</strong> Material (22), pg 277-285.<br />
Riyadh Al-Amery., Riadh Al-Mahaidi. (2006). Coupled Flexural-Shear Retrofitting of RC Beams Using<br />
CFRP Straps. Composite Structures (75). pg 457-464.<br />
Tom Norris., Hamid Saadatmanesh., Member., ASCE., Mohammad R., Ehsani., Member., ASCE.<br />
(1997). Shear <strong>and</strong> Flexural Strengthening of R/C Beams With Carbon Fiber Sheets. Journal of<br />
Structural Engineering (Vol 123/ No.7),pg 903-911<br />
www.engineersedge.com/material_science/fatigue_failure.htm
T147<br />
218<br />
International <strong>Building</strong> & <strong>Infrastructure</strong> Technology Conference<br />
7-8 June 2011, Vistana Hotel, Penang, Malaysia<br />
SUBURBAN NEIGHBORHOODS SATISFACTION TOWARDS CREATION<br />
HIGH QUALITY OF URBAN LIFE THROUGH NEW URBANISM<br />
Rozina Farajollahzdehˡ, Hasanuddin Lamit²<br />
1 Universiti Teknologi Malaysia, 81310 UTM Skudai, Johor, Malaysia ,<br />
2 L<strong>and</strong>scape Departments, Faculty of Built Environment, Universiti Teknologi Malaysia,<br />
Skudai, Malaysia<br />
1 rozarc2000@yahoo.com, 1 frozina2@live.utm.my , 2 inadean@hotmail.com<br />
ABSTRACT: This paper examine the characteristics associated with implementing the principles of<br />
new urbanism through creation of a walkable neighborhood centre towards neighborhood satisfaction<br />
in Taman Sutera Utama, Skudai-Johor. The main purpose of this research is to explore <strong>and</strong> evaluate<br />
the main elements of creating a neighborhood centre towards achieving neighborhood satisfaction<br />
based on walkability. Results analyzed through qualitative <strong>and</strong> quantitative methods which show the<br />
high level of neighborhood satisfaction among permanent, temporary <strong>and</strong> transit residents in this<br />
region. The main reason of this satisfaction is walkability, mixed-used <strong>and</strong> diversity, sense of safety,<br />
sense of security.<br />
Keywords: walkability, neighbourhood satisfaction, neighbourhood centre, travel behaviour,<br />
safety, security.<br />
1. INTRODUCTION<br />
Walkabiliy is one of the core aspects of ‘Travel Behavior’ <strong>and</strong> ‘Principles of New Urbanism’. Urban<br />
professional such as urban planners, urban designer <strong>and</strong> transportation planners in travel behavior<br />
field of research are focusing on walking <strong>and</strong> walkability issues in urban design. Such issues cannot<br />
be resolved through intuition <strong>and</strong> experience rather on scientific research evidence which may<br />
convince policymakers to apply walkability principles in urban management.<br />
There is an evaluation about the rate of implementation of the principles of new urbanism such as:<br />
Walkability; Connectivity; Mix-used <strong>and</strong> Diversity; Mixed Housing; Quality Architecture <strong>and</strong> Urban<br />
Design; Traditional Neighbourhood Structure; Increased Density; Green Transportation<br />
;Sustainability; Quality of Life. The purpose of this study is to explore the main elements of<br />
neighbourhood centre towards achieving neighbourhood satisfaction <strong>and</strong> examine the rate of<br />
implementation of new urbanism’s principles.<br />
Controversial <strong>and</strong> critical issue of walkability as considerable human behaviour approach in town<br />
design <strong>and</strong> planning is evident in the trend toward behaviour-oriented investigations. Decision<br />
behaviour analysis (H<strong>and</strong>y, 2004; Mokhtarian, 2005; Coa, 2006) <strong>and</strong> activity-based modelling (Krizek<br />
<strong>and</strong> Waddell, 2003) are the most particular areas of concern for walkability inquiry in urban design<br />
<strong>and</strong> urban planning.<br />
H<strong>and</strong>y (1996a) states that research into urban form <strong>and</strong> travel behaviour should be modified to focus<br />
from changing behaviour to determining initiatives to provide choices for residents to walk. Current<br />
urban design philosophies tend to emphasize accessibility rather than mobility by building the<br />
environment to offer choices <strong>and</strong> alternatives (Levine, 1999). A combination of urban design, l<strong>and</strong><br />
use zoning, <strong>and</strong> transportation systems intended to promote non-motorized travel may create<br />
healthier <strong>and</strong> more liveable communities (H<strong>and</strong>y et al., 2002). Meanwhile, refined decision making<br />
approaches will be necessary to achieve this, including better measures of the physical <strong>and</strong><br />
environmental indicators towards walkability, accurate <strong>and</strong> comprehensive data on non-motorized<br />
travel, <strong>and</strong> spatial matching of travel data. Shay et al. (2006) identified differences between the walk<br />
<strong>and</strong> drive modes in the number of internal daily trips within a neighbourhood, where walk trips<br />
decrease considerably with distances between residences <strong>and</strong> the commercial centres. The
219<br />
International <strong>Building</strong> & <strong>Infrastructure</strong> Technology Conference<br />
7-8 June 2011, Vistana Hotel, Penang, Malaysia<br />
complexity of travel behaviour <strong>and</strong> its multiple measures make it difficult to express how the<br />
environmental factors affect trip generation <strong>and</strong> travel distances.<br />
Campbell et al., (1976) <strong>and</strong> Francescato et al., (1987; 2002 ) described the level of “satisfaction”<br />
conceptually as the degree to require meeting of need, in contrast with some other kinds of attitudinal<br />
queries that a number of argue sketch more on emotional, normative, or cognitive beliefs. Since<br />
reported levels of satisfaction are intrinsically r<strong>and</strong>om scales, they are mainly helpful for comparing<br />
relative levels crossways sections of an example <strong>and</strong> for investigating what variables are connected<br />
with higher satisfaction ratings. The combination of reflection <strong>and</strong> perception of respondents’<br />
preference was studied by Lovejoy, K; H<strong>and</strong>y, S; Mokhtarian, P (2010) to achieve satisfaction levels.<br />
Dependent variable such as measuring the levels of neighbourhood satisfaction include:<br />
attractiveness; quiet; liveliness; big yards; safety; mixed-use; good infrastructure. (Marans <strong>and</strong><br />
Rodgers, 1975; Galster <strong>and</strong> Hesser, 1981; Weidemann <strong>and</strong> Anderson, 1985; Lu, 1999).<br />
2. METHODOLOGY<br />
2.1 NEIGHBOURHOOD AND RESPONDENT SELECTION<br />
In this research the method used to obtain data is questionnaire survey. The survey contains mixed<br />
mode of qualitative <strong>and</strong> quantitative approaches on data gathering from the target population in an<br />
urban neighbourhood of Taman Sutera Utama,Skudai-Johor. The site study is the 400 meters<br />
(5min.walking distance) from A as focal point in a neighbourhood centre. R<strong>and</strong>omizing the election of<br />
respondents procedures help control error from sources which the research might not anticipate<br />
(Zeisel, 2006). Figure 1 shows the study area.<br />
2.2 STUDY COMPONENTS.<br />
Figure 1. Study Area<br />
This study evaluated the type of differences in design characteristics (environmental analyses) <strong>and</strong><br />
used these to interpret self-reported travel behaviour provided by residents. For example, distances<br />
between homes <strong>and</strong> everyday facilities such as convenience stores were related to self-reported style<br />
choices.
220<br />
International <strong>Building</strong> & <strong>Infrastructure</strong> Technology Conference<br />
7-8 June 2011, Vistana Hotel, Penang, Malaysia<br />
Figure 2. Preferable Elements of Neighbourhood Centre by Residents <strong>and</strong> Transit<br />
Table 1. Diverse Walking Behavior <strong>and</strong> Influencing Factors in Resident ‘Walking Decision Making<br />
Towards Specified Shopping Centers.<br />
Name Shopping<br />
Centre<br />
Sense of<br />
safety<br />
Sense of<br />
security<br />
Comfort Convenience Visual<br />
Interest<br />
Sutera Mall 75.28% 73.67% 52.37% 56.78% 80.87%<br />
Table 2. Walking Behavior Factors Impact on Residents before <strong>and</strong> after Walking Decision Making<br />
Name of Shopping<br />
Sutera Mall<br />
Centre<br />
Before After<br />
a. Sense of safety<br />
b. Sense of Security<br />
c. Comfort<br />
d. Convenience<br />
e. Visual Interest<br />
a.1.Traffic speed<br />
<strong>and</strong> pedestrian crossing<br />
65.67% 46.75%<br />
a.2. crossing facilities 63.14% 40.12%<br />
a.3. Facility for sidewalks 42.8% 25.23%<br />
b.1.Security at day 50.76% 32.13%<br />
b.2. Security at night 54.89% 34.24%<br />
c.1.Physical comfort 46.76% 27.45%<br />
c.2.environment effects 57.34% 31.65%<br />
d.1.Functionaly of sidewalk<br />
with diverse activities<br />
48.32% 10.27%<br />
d.2.Easy access <strong>and</strong> crossing 62.12% 10.76%<br />
e.1.Street-Scale <strong>and</strong> Enclosure 34.54% 29.45%<br />
e.2.Variety 72.14% 39.43%<br />
3. CONCLUSIONS<br />
Data gathered from the surveyed areas were analyzed respectively through the method of ‘Analytical<br />
Hierarchy Process’. The model shows the five walking behaviour factors which are Sense of safety,<br />
Sense of security, Comfort, Convenience <strong>and</strong> Visual Interest. The data gathered from the surveys<br />
conducted within the residential areas around the shopping centres of Sutera Mall, shows that this<br />
shopping centre with the percentages of 87.08% is more preferable than others specially by residents<br />
of Taman Sutera Utama. In exploring the main elements of neighbourhood centre towards achieving<br />
neighbourhood satisfaction, some qualitative <strong>and</strong> quantitative methods were conducted. Figure 2
221<br />
International <strong>Building</strong> & <strong>Infrastructure</strong> Technology Conference<br />
7-8 June 2011, Vistana Hotel, Penang, Malaysia<br />
identifies the preferable elements of neighbourhood centre by residents <strong>and</strong> transit visitors while table<br />
1 represents the diverse walking behaviour <strong>and</strong> influencing factors in resident ‘walking decision<br />
making towards specific shopping centres <strong>and</strong> table 2 describes walking behaviour factors impact on<br />
residents before <strong>and</strong> after walking decision making.<br />
Based on the results, the most notable <strong>and</strong> cited reasons of residents <strong>and</strong> transit visitors towards<br />
achieving neighbourhood satisfaction are, existing walkable main elements such as shopping mall,<br />
parking area, neighbourhood park, public transport, attractiveness, liveliness, sense of safety <strong>and</strong><br />
security. Therefore, In reference to the main aim of this paper, raising the rate of implementation of<br />
the principles of new urbanism will improve the quality of life <strong>and</strong> neighbourhood satisfaction.<br />
In summary, the scope of investigation <strong>and</strong> study on travel behaviour is naturally vast <strong>and</strong> the range<br />
of sensitive factors is large which are influenced by both urban form <strong>and</strong> personal characteristics. The<br />
existing literature of interaction between environment <strong>and</strong> travel behaviour is not entirely<br />
comprehensive, because of the complexity of both urban form <strong>and</strong> human travel behaviour subjects.<br />
New approaches or techniques to measure this relationship are needed.<br />
REFERENCES<br />
Addy, C.L., & Wilson, D.K., (2004); Associations of Perceived Social <strong>and</strong> Physical Environment<br />
Supports with Physical Activity <strong>and</strong> Walking Behavior; American Journal of Public Health,94.<br />
America, The Urban Institute Press: Washington, DC.<br />
Aronson, R. E., &Oman, R.F.; 2004; Views on Exercise <strong>and</strong> Physical Activity among Rural Dwelling<br />
Senior Citizens. Journal of Rural Health.<br />
Arth, Michael E. (2010). Democracy <strong>and</strong> the Common Wealth: Breaking the Stranglehold of the<br />
Special Interests Golden Apples Media, ISBN 978-0-912467-12-2. pp. 120-139, 363-386.<br />
Chaskin, R.J., Joseph, M.L., Webber, H.S. (2007) the Theoretical Basis for Addressing Poverty<br />
Through Mixed-Income Development. Urban Affairs Review 42 (3): 369-409.<br />
Costanza, R. et. al. (2008) “An Integrative Approach to Quality of Life Measurement, Research, <strong>and</strong><br />
Policy”. S.A.P.I.EN.S. 1<br />
Goetz, Edward G. (2003) Clearing the Way: Deconcentrating the Poor in Urban<br />
Gregory, Derek; Johnston, Ron; Pratt, Geraldine et al., eds (June 2009). "Quality Life". Dictionary of<br />
Human Geography (5th ed.). Oxford: Wiley-Black ISBN 978-1-4051-3287-9.<br />
H<strong>and</strong>y, S. L., 2005; Critical Assessment of the Literature on the Relationship among Transportation,<br />
L<strong>and</strong> use, <strong>and</strong> Physical Activity .<br />
H<strong>and</strong>y, S. L; Clifton. K. J., 2001, Local Shopping as a Strategy for Reducing Automobile Travel;<br />
Transportation 28.<br />
Kelbaugh, Douglas S. 2002. Repairing the American Metropolis: Common Place Revisited. Seattle:<br />
University of Washington Press. 161.<br />
S. Grignaffini, S. Cappellanti, A. Cefalo, "Visualizing sustainability in urban conditions", WIT<br />
Transactions on Ecology <strong>and</strong> the Environment, Vol. 1, pp. 253-262, 10 Jun 2008.<br />
S. Reid, "Fit for purpose: evaluating walkability", Engineering Sustainability, Vol. 161, No. 2, June<br />
2008, pp.105-112.<br />
Steve Melia (2008) Neighborhoods Should be Made Permeable for Walking <strong>and</strong> Cycling but not for<br />
Cars, , Local Transport Today,<br />
Teri Pruden, "The New Urban Cowboy: Michael E. Arth transforms Cracktown into Historic Garden<br />
District in DeL<strong>and</strong>” DeL<strong>and</strong> Magazine, Jan-Feb, 2008.<br />
Watson, G., Bentley, I., Roaf, S. <strong>and</strong> Smith, P., 2004. Learning from Pound bury, Research for the<br />
West Dorset District Council <strong>and</strong> the Duchy of Cornwall. Oxford Brookes University.
T148<br />
222<br />
International <strong>Building</strong> & <strong>Infrastructure</strong> Technology Conference<br />
7-8 June 2011, Vistana Hotel, Penang, Malaysia<br />
ASSESSMENTS OF GREEN BUILDING INDEX RATING FOR CONCRETE AND<br />
ITS EFFECTS ON GLOBAL WARMING<br />
Alonge O. Richard 1 <strong>and</strong> Mahyuddin B. Ramli 2<br />
1,2 Universiti Sains Malaysia, Penang, Malaysia.<br />
Olarichy07@yahoo.com 1 , mahyudin@usm.my 2<br />
ABSTRACT: Carbon dioxide is considered worldwide as the major cause of global warming <strong>and</strong> the<br />
effects thereof on the surface of the Earth. Studies have shown that production of Portl<strong>and</strong> cement<br />
alone accounted for approximately 5% of the total global Carbon-dioxide (CO2) emissions through<br />
various human activities. A further study shows that a tonne of concrete produced carbon dioxide of<br />
between 0.05 to 0.13 tonnes approximately ninety-five percent (95%) of the total estimated carbondioxide<br />
emissions derived from production of concrete. Gore (2003), considered buildings as one of<br />
the largest end consumer of energy. It was established that building sector accounts for 25 to 40% of<br />
the final energy dem<strong>and</strong>. This paper study the elaborated efforts made so far in the production of<br />
green concrete <strong>and</strong> its emphasis on the use of GREEN BUILDING INDEX as a comprehensive rating<br />
system to evaluate the extent of green nature properties of green concrete, the environmental design<br />
<strong>and</strong> the performance. All these will be evaluated to establish their correlations with fundamental<br />
sustainability requirements.<br />
Keywords: green concrete, global warming <strong>and</strong> green building index rating.<br />
1. INTRODUCTION<br />
The increasing emissions of anthropogenic greenhouse gases has being causing climate changes<br />
over some decays now <strong>and</strong> this fact has being established with measurement through researches <strong>and</strong><br />
studies that there is global growth of CO2 concentration in the atmosphere.<br />
Concrete is considered worldwide as the most important building materials <strong>and</strong> also the most common<br />
materials used in the construction of building or civil engineering structures. The reason behind this<br />
are not farfetched; if concrete is properly <strong>and</strong> adequately designed <strong>and</strong> produced, it possess some<br />
valuable, conducive <strong>and</strong> economic features through its properties chemically, physically <strong>and</strong><br />
mechanically, hence its popularity in the world, its durability <strong>and</strong> adaptability is worldwide friendly. As a<br />
result of its environmental impact also, it remain one of the most costly materials of construction.<br />
Concrete is mouldable, affordable highly resistance to fire attack, easy to work with <strong>and</strong> readily<br />
available. It can be worked upon to meet up with any specifications or requirements, easily modifiable<br />
hence term engineering materials.<br />
(Neville, 1996), revealed that an ordinary concrete typically contains about 12% cement <strong>and</strong> 80%<br />
aggregates by mass. Likewise,(Mehta,2001), claimed that the global construction industry uses<br />
approximately 1.6 billion tonnes of cement <strong>and</strong> 10 billion tonnes of s<strong>and</strong>, gravel <strong>and</strong> crushed rock<br />
every year. He further explained that the world’s yearly cement production of 1.6 billion tones accounts<br />
for about 7% of the global loading of carbon dioxide CO2 into the atmosphere.<br />
(Mehta,2001), says mining large quantities of raw materials for the production of cement such as<br />
limestone <strong>and</strong> clay <strong>and</strong> fuel such as coal often results in extensive deforestation or denudation <strong>and</strong> top<br />
soil loss. All these need of vast quantity of natural resources to produce an estimated billion of tons of<br />
concrete each year resulted in great impact on the immediate environment. Apart from the estimated<br />
7% of the global loading of carbon dioxide CO2 into the air annually, the cement industry through the<br />
production of Portl<strong>and</strong> cement is also considered to be energy intensive. In addition to these, quite a<br />
large quantity of water are required for the production of concrete <strong>and</strong> this is considered burdensome<br />
considering the availability of good <strong>and</strong> fresh water suitable for concrete production.
223<br />
International <strong>Building</strong> & <strong>Infrastructure</strong> Technology Conference<br />
7-8 June 2011, Vistana Hotel, Penang, Malaysia<br />
In addition, concrete structures have life span, a service lives of several decades up to a century or<br />
more. Those structures that failed after achieving their life span <strong>and</strong> could no longer fulfill their original<br />
purpose are demolished. The demolition <strong>and</strong> the disposal need of the debris or left over of concrete<br />
constitute another environmental problem. Construction as well as demolition debris constitute a<br />
considerable fraction of solid waste in developed countries even as concrete is considered as the<br />
largest single components of it all.(Mehta,2001), claimed that the annual worldwide output of concrete<br />
<strong>and</strong> masonry rubble has been estimated roughly as one billion tonnes. The continuous use of natural<br />
aggregate <strong>and</strong> the use of cement in the production of concrete conventionally likewise has negative<br />
effect on the environment. This effect on the habitat as stated by (Winfield <strong>and</strong> Taylor, 2005), is the<br />
extraction of aggregates from pits <strong>and</strong> quarries results in the destruction of the natural habitats of<br />
many organisms <strong>and</strong> in the disturbance of the pre-existing stream flow <strong>and</strong> water resources. There are<br />
great impact of the natural aggregate production on the quality of both groundwater <strong>and</strong> running<br />
surface water. The flow patterns of the water are disturb – in the course of natural aggregate<br />
production <strong>and</strong> likewise the ground water storage capacity deposits are considered as the reservoirs<br />
for underground water.<br />
After quarrying, the natural aggregates have to be transported; the cost of transporting the already<br />
crushed aggregates from quarry to the place or location of use visa a vise the transportation of the<br />
ready mix concrete has great financial impact. Despite, all these short coming of concrete production<br />
impart on the environment, concrete is still considered as an inherent environmental friendly structural<br />
materials.<br />
Many research work <strong>and</strong> studies have been done <strong>and</strong> still in the offing to see that concrete production<br />
achieve greenish features hence green concrete. Among the contemporary research studies is the<br />
use of some cementitiouse materials such as fly ash, ground granulated blast furnace slag <strong>and</strong> silica<br />
fumes as a substitute to Portl<strong>and</strong> cement in the production of concrete. In some part of developed<br />
countries, many achievements have been reached with partial substitute of Portl<strong>and</strong> cement with<br />
some cementitiouse materials in the ratio of either 70% of cementitiouse materials <strong>and</strong> 30% of<br />
Portl<strong>and</strong> cement or 60% of cementitiouse <strong>and</strong> 40% of Portl<strong>and</strong> cement. For instances, in Denmark<br />
according to (Ecoserve,2006b),the blending of Portl<strong>and</strong> clinker with supplementary materials mainly<br />
takes place at the concrete plant whereas the trend in central <strong>and</strong> southern Europe goes towards<br />
blended cements where the blending take place at the cement plant.<br />
However, the application of various types of supplementary materials depends strongly on the<br />
availability <strong>and</strong> traditions in the various countries. For instance in North America, the concept of<br />
environmentally friendly concrete is closely related with high volume fly ash concrete where about half<br />
of the cementitiouse materials consist of fly ash (Malhotra 2006, Obla et al. 2003).With this in mind,<br />
this paper seek to assess the green nature or features of this environmental friendly concrete using<br />
green building index rating <strong>and</strong> look at its effects on global warming.<br />
2. GREEN BUILDING AND GREEN BUILDING INDEX<br />
Green building is generally classified as the process of building <strong>and</strong> structure production that are<br />
environmentally responsible <strong>and</strong> efficient resourcefully throughout the building or structure life’s span<br />
beginning from the sitting to the deconstruction. It can also be refered to as high performance building.<br />
(Kibert, 2004), defined a sustainable or green building as a subset of sustainable construction,<br />
representing simply the structure. Years later, he went further to explain that sustainable construction<br />
most comprehensively addressed the ecological, social <strong>and</strong> economic issues of a building in the<br />
context of its community (Kibert, 2007). (Ahmad S,2010), defined Green <strong>Building</strong> Index as the<br />
comprehensive rating system for evaluating design <strong>and</strong> performance of buildings based on six (6)<br />
main criteria using Malaysia GBI;<br />
- Energy efficiency which carry 35%<br />
- Indoor environmental quality 21%<br />
- <strong>Sustainable</strong> site planning <strong>and</strong> management 16%<br />
- Water efficiency 10%<br />
- Innovation 7%<br />
- Materials <strong>and</strong> resources 11%
224<br />
International <strong>Building</strong> & <strong>Infrastructure</strong> Technology Conference<br />
7-8 June 2011, Vistana Hotel, Penang, Malaysia<br />
The actual reason for the construction of greener building is quite important <strong>and</strong> this has to do with the<br />
main fact that we need to live most lightly on the earth surface as much as possible. The impact of we<br />
as human being with our various activities has on the earth’s ecosystem cannot be over emphasized<br />
<strong>and</strong> the major factor of concern in most of our activities <strong>and</strong> operations boils down on the use of<br />
energy production, dissipation, use <strong>and</strong> consumption of energy from various sources. Green building<br />
target on increasing the resource use energy efficiency, water <strong>and</strong> materials efficiency <strong>and</strong> at the<br />
same time reducing the impact of these various activities on human health, well being <strong>and</strong> the<br />
environment during the life time of such building <strong>and</strong> these can be achieved through better sitting ,<br />
green nature driving design, construction, operation, maintenance <strong>and</strong> removal.<br />
In the building <strong>and</strong> construction sector, 40% of the world’s energy are consumed,12% of water are<br />
also consumed with 40% of the waste sent to l<strong>and</strong>fill, all these contribute majorly to the global<br />
problem. The design <strong>and</strong> choice of materials has most significant ways of affecting our environment,<br />
likewise the quantity of energy embodied in the building materials themselves, their transportation <strong>and</strong><br />
their assemblage duly call for concern in term of global warming. These energy consumption <strong>and</strong><br />
dissipation has a direct correlation or effect on our environmental quality because of the environmental<br />
pollution through the emission of greenhouse gases <strong>and</strong> other types of emissions. However, the<br />
building <strong>and</strong> construction sector can as well be a major playmaker in the solution of world acclaimed<br />
global warming problem.<br />
International researchers confirmed that green buildings consume less energy, water <strong>and</strong> generate<br />
less waste thereby create a healthy <strong>and</strong> productive environment. It has being claimed through the<br />
chairman, world green building, Tony Arnel, that research had shown that green building practices can<br />
reduces a building costs by as much as 9% building values by 7.5% <strong>and</strong> realized a total 6.6% increase<br />
in return on investment, so, green building don’t just make a sound ecological <strong>and</strong> environmental<br />
sense, they make sound economic sense too.<br />
In line with growing green building delivery system worldwide, quite a number of green building<br />
assessment tools have been invented by several international <strong>and</strong> national research organization,<br />
institute <strong>and</strong> scholars <strong>and</strong> most of these assessing tools or ratings have being tested <strong>and</strong> accepted<br />
although many are still being improved upon yearly or quarterly. The area of focus of most or majority<br />
of these rating tools are;<br />
(a) Energy efficiency of all components of the building, i.e. all the elements, assess one after the<br />
other.<br />
(b) Indoor environmental quality<br />
(c) <strong>Sustainable</strong> site planning <strong>and</strong> management<br />
(d) Water efficiency<br />
(e) Innovation<br />
(f) Materials <strong>and</strong> Resources.<br />
And the main objectives of most, if not all of these green building ratings are;<br />
- To evaluate the overall performance of the green building by considering all the elements one<br />
after the other<br />
- To monitor <strong>and</strong> coordinate the process of green building production in other to achieve the<br />
basic fundamental principles of green building which are economic growth, environmental <strong>and</strong><br />
ecological balance equity <strong>and</strong> social advancement.<br />
- To increase <strong>and</strong> improve on the evolution of green building construction.<br />
2.1 NOTABLE GREEN BUILDING INDEXES IN THE WORLD<br />
There are several green building index rating tools developed across the whole continents of the world<br />
<strong>and</strong> many are still being developed .There are few of these rating tools that are considered as the<br />
mainstream building index tools for the general use in the production of green building, however, it<br />
was found that the generation of this rating tools has to be localized as it has much to do with locality,<br />
culture <strong>and</strong> regional system of building production.
225<br />
International <strong>Building</strong> & <strong>Infrastructure</strong> Technology Conference<br />
7-8 June 2011, Vistana Hotel, Penang, Malaysia<br />
Among these major green building tools are;<br />
(1) LEEDS, which is interpreted to mean Leadership in Energy <strong>and</strong> Environmental Design. The United<br />
State Green <strong>Building</strong> Council (USGBC) first developed this system of rating in the year 1998. It was<br />
developed with a target of evaluating the environmental performance of a green building over the<br />
whole life span. Although this version has being improved upon, as we now have LEED (V.2.0) in the<br />
year 2000 <strong>and</strong> LEED (V.3.0) in year 2009. This current one has larger advancement than LEED<br />
(V.2.0), although LEED (V.2.0) is still more prominent in use in the prevailing market of green building.<br />
(http://www.usgbc.org.2011)<br />
(2) CASBEE, this is developed in Japan by Japan Green <strong>Building</strong> Council (JAGBC) in the year 2001<br />
<strong>and</strong> her subcommittee that includes the government official <strong>and</strong> the academicians. This green building<br />
tool adopts the value of building environmental efficiency in the evaluation used.<br />
BEE = <strong>Building</strong> environmental quality <strong>and</strong> performance / <strong>Building</strong> environmental loadings.<br />
(http://www.ibec.or.jp/casbee, 2011)<br />
(3) SBTOOL, this tool is designed with two focuses, which are to assess the environmental <strong>and</strong><br />
sustainable performance of building. It started in 1996 by a group of more than a dozen team from<br />
different countries <strong>and</strong> later h<strong>and</strong>ed over to international initiatives for a sustainable built environment<br />
(iisbe) in the year 2002. Initially it was called GBTOOL <strong>and</strong> it was designed compel the users to reflect<br />
the different priorities, technologies, building traditions <strong>and</strong> cultural values of various regions of the<br />
world. It make use of a Microsoft excel workbook configured to fit into any construction condition of all<br />
regions of the world. (http:// www.iisbe.org. 2011)<br />
(4) BREAM, this was developed in the United Kingdom in the year 1990 by the <strong>Building</strong> Research<br />
Establishment. The BRE is owned by the foundation for the Built Environment, a registered charity in<br />
the UK, <strong>and</strong> it provides a range of consultancy, testing <strong>and</strong> commission research services for all<br />
aspects of the built environment. (Bunz, Henze, et al. 2006) .This happen to be the pioneer building<br />
index tool in the whole world <strong>and</strong> this tool make use of environmental assessment method for<br />
buildings. A review of this tool was launched in 2008 <strong>and</strong> two major changes was introduced which<br />
include, a new two stage assessment process which are design stage <strong>and</strong> post construction, the<br />
second is the introduction of m<strong>and</strong>atory credits. (http://www.bream.org.2011)<br />
(5) ESGB, In the year 2006, China ministry of housing <strong>and</strong> urban rural development came up with<br />
education st<strong>and</strong>ard for green building <strong>and</strong> the china government has made this to become a national<br />
st<strong>and</strong>ard named GB/T 50378- 2006, the ESGB consist of six divisions, each with 3 sub divisions.<br />
(6) BCA- GM is another tools that was launched in Singapore in January 2005. This tool was<br />
supervised <strong>and</strong> endorsed by the National Environment Agency with main aim of the production of<br />
environment friendly buildings. BCA, green mark consist of assessment criteria for two main<br />
categories which are new building <strong>and</strong> existing building <strong>and</strong> the criteria is sub divided into two<br />
categories BCA – GM non residential building which is the latest version <strong>and</strong> BCA- GM for residential<br />
building. (http://www.bca.gov.sg/green mark 2011)<br />
(7) MALAYSIA GBI, this building rating was generated in year 2008 <strong>and</strong> was launched in 21 st of May<br />
2009. It was developed for new buildings with two ratings one for residential <strong>and</strong> another one for nonresidential.<br />
It was created to provide the building industry a common <strong>and</strong> verifiable mechanism to<br />
benchmark buildings within the Malaysian context. It was formed to set out a vision for sustainability<br />
within the built environment <strong>and</strong> provides guidance that will assist end users to deliver sustainable<br />
townships. It was developed specifically for the Malaysian tropical climate, environmental <strong>and</strong><br />
developmental context <strong>and</strong> social needs <strong>and</strong> created to;<br />
- Define green buildings by establishing a common language <strong>and</strong> st<strong>and</strong>ard of measurement<br />
-Promote integrated, whole building designs that provides a better environment for all<br />
-Recognize <strong>and</strong> reward environmental leadership<br />
-Transform the built environment to reduce its negative environmental impact<br />
- Ensure new buildings remain relevant in the future <strong>and</strong> existing buildings are refurbished <strong>and</strong><br />
upgraded to improve the overall quality of the building stock. (http://www.green<br />
buildingindex.org/indexhtml.2011).
226<br />
International <strong>Building</strong> & <strong>Infrastructure</strong> Technology Conference<br />
7-8 June 2011, Vistana Hotel, Penang, Malaysia<br />
3. METHODOLOGY OF RATING CONCRETE USING GREEN BUILDING INDEX.<br />
Concrete is considered as the most important building materials worldwide because of the readily<br />
available of its constituents. It consists of aggregates, which can be coarse or fine as the case may be,<br />
cements <strong>and</strong> water. We have different types of concrete, no fine aggregate concrete <strong>and</strong> lightweight<br />
aggregate concrete. Lightweight concrete is a major improvement through continuous research on the<br />
conventional concrete over the years, all to meet up with the global solution of reducing gas emission,<br />
which makes the globe to warm.<br />
Looking at the greenish features of concrete in the light of some of the green building index highlighted<br />
above, this paper come to conclusion that concrete can thoroughly be green hence environmentally<br />
friendly <strong>and</strong> provide solution to global warming in a no small measures.<br />
The table 1 below shows the comparism of the energy consumption <strong>and</strong> green house gas emission of<br />
traditional <strong>and</strong> green concrete as highlighted by Abbas, et. al. 2007.<br />
Table 1. Comprise of the energy consumption<br />
Traditional concrete Green Concrete<br />
GHG Emission in tones 1.25tonnes from Cement/ tone 0.875 sq. from Cement<br />
GHG Emission per km. 15,000per km from aggregate 7,500 cube from aggregate<br />
____________________________________________________________________________<br />
Energy Consumption (MJ) 4,000MJ from Cement 2,800MJ from cement<br />
Energy Consumption (MJ) 63MJ from aggregate 31.5MJ from aggregate<br />
Concrete are measure in the following area of focus of the green building index;<br />
(a) Energy efficiency – There are many categories of energy needs in the cause of concrete<br />
production such as in the production of Portl<strong>and</strong> cement, a tonne of Portl<strong>and</strong> cement requires<br />
about four giga- joules of energy according to research. The use of some newly innovated<br />
cementitiouse materials such as fly ash, ground slag, silicon fumes ,etc for partial or complete<br />
replacement of cement in the productions of concrete <strong>and</strong> some admixtures, surfactants , all<br />
these put together, drastically reduce the energy consumption in the production of concrete<br />
<strong>and</strong> the gas emission through cement hydration process.<br />
(b) Another area of energy requirement in concrete is in the production of crushed aggregates.<br />
The Portl<strong>and</strong> cement association (1993) came up with estimated energy requirements for<br />
s<strong>and</strong> <strong>and</strong> gravel productions to be 5.0 M- joules per tonne while crushed aggregates requires<br />
an energy in – put of 54M- joules per tonne. The use of natural s<strong>and</strong>, washed <strong>and</strong> unsaturated<br />
sea s<strong>and</strong> <strong>and</strong> natural gravel will definitely reduces the energy production in the cause of doing<br />
that.<br />
(c) The haulage of aggregate materials to processing plants requires enormous energy, so also is<br />
the transporting process of aggregates to ready mixed concrete plants. (PCA,1993) revealed<br />
that 2.7M-joules per tonne- km for s<strong>and</strong> <strong>and</strong> gravel <strong>and</strong> 3.8M- joules per tonne- km for<br />
crushed aggregates are required to transport these materials to ready- mixed concrete plants.<br />
In addition to all these energy is the main energy needed in the production of wet concrete itself as<br />
established by (George <strong>and</strong> Michael, 2001), the production of new concrete using recycling concrete<br />
aggregates requires the same amount of energy as producing concrete with natural aggregate <strong>and</strong><br />
this energy can be approximately estimated as 1.3 to 2.4 GJ/m3. Therefore, for concrete to be green<br />
<strong>and</strong> fulfilled the requirement of building index rating, it must be able to reduce drastically, the energy<br />
consumption <strong>and</strong> dissipation in the course of sourcing <strong>and</strong> production to the placement process.<br />
Using, exergy analysis of energy system as postulated by (chunhai et al. 2007), though not for<br />
concrete but for heat <strong>and</strong> cold system in building, this paper is of the opinion that the energy efficiency
227<br />
International <strong>Building</strong> & <strong>Infrastructure</strong> Technology Conference<br />
7-8 June 2011, Vistana Hotel, Penang, Malaysia<br />
of concrete can be estimated, the energy transfer includes work <strong>and</strong> heat, when work is converted<br />
into heat, the quality of energy depreciates. As a result of this, the ratio of work, which can be<br />
delivered to its surroundings to total energy can be used as a measurement of the energy quality,<br />
which is defined as the Energy Quality Coefficient (EQC) in GOBAS, <strong>and</strong> the formulae is;<br />
ץ = W/ Q.<br />
Where, Q is the total quantity of energy in (GJ) <strong>and</strong> W is the exergy of energy (GJ).<br />
The heat generated in concrete during hydration process can be used to arrive at the work being<br />
converted to heat.<br />
4. WATER RESOURCES CONSERVATION OF GREEN CONCRETE<br />
This is another green building index parameter that concrete that want to be green must fulfill.<br />
(Winfield <strong>and</strong> Taylor 2005), declared that natural aggregates production impacts on the surface <strong>and</strong><br />
groundwater quality <strong>and</strong> the natural habitat of many species is a serious concern. Many are the ways<br />
that the excavation of natural aggregates changes l<strong>and</strong> <strong>and</strong> vegetation slope <strong>and</strong> tamper with the<br />
underground water reservoir as natural aggregate is considered a natural reservoir for underground<br />
water. For any concrete to be green then it must make use of lightweight aggregates or recycle<br />
aggregate so that the water resources can be conserved.<br />
5. CONCERETE RECYCLING<br />
Another parameter of green building index is the ability to be recycled. According to (George <strong>and</strong><br />
Michael, 2001), concrete constitute 52% of construction <strong>and</strong> demolition waste, <strong>and</strong> approximately 73%<br />
of it is reused in low value applications as filler materials or as road sub grade. The natural aggregates<br />
can be substituted with recycle aggregates since it has being confirmed that continuous use of natural<br />
aggregates <strong>and</strong> cement to produce conventional concrete has negative effects on the environment.<br />
Research has suggested some many ways of overcoming the problems associated with the use of<br />
recycled concrete, such as large amount of fines found in recycle concrete, lower density than the<br />
original materials used because of cement mortar attached to the aggregates surface <strong>and</strong> various<br />
contaminants that can be found in recycled concrete. <strong>Building</strong> demolished materials are generally<br />
termed as construction <strong>and</strong> demolition waste <strong>and</strong> the main part of this are considered to be concrete,<br />
in the word of (Mehta,2001), the annual worldwide output of concrete <strong>and</strong> masonry rubble has being<br />
estimated roughly as one billion tones.<br />
6. EFFECTS ON GLOBAL WARMING<br />
The green building index rating tools if employed in the assessment of concrete produced in the<br />
building, civil construction industries throughout the world, then the concrete produced will be<br />
environment friendly <strong>and</strong> contribute in the reduction of global warming which is a global problem. The<br />
following are the ways green concrete can affect global warming;<br />
a) The energy production will be reduced likewise the green house gas emission.<br />
b) The use of cementitiouse materials as replacement partially or fully, in the production of<br />
concrete will go a long way to reduce gas emission into the atmosphere.<br />
c) Natural aggregates <strong>and</strong> s<strong>and</strong> can be replaced by the use of recycle concrete aggregate <strong>and</strong><br />
lightweight aggregate as researched in the current years, hence energy are reserved <strong>and</strong> little<br />
disturbances to the natural water reservoir.<br />
7. CONCLUSIONS<br />
The invention of green building index with common aims throughout the whole world is a significant<br />
indication that the world is seriously facing <strong>and</strong> tackling the global warming problem as associated with<br />
the various activities of humankind. Shelter, which is considered as one of the three main basic needs<br />
of life, should be taking as major point of impact to the environment at large. Therefore, concrete that<br />
is green in nature will go a long way to help reduce global warming as the greenish nature can be
228<br />
International <strong>Building</strong> & <strong>Infrastructure</strong> Technology Conference<br />
7-8 June 2011, Vistana Hotel, Penang, Malaysia<br />
assessed with green building index parameter as postulate by this paper. Another major area that<br />
needs to be studied throughout the world is the parameter to show the effectiveness of the various<br />
green building index in the various countries of the world, the activities of the facilitators of the various<br />
index <strong>and</strong> the government policies to back up their work needs to be investigated.<br />
REFERENCES<br />
A. Abbas, G. Fathifazi, O.B. Isgor, A.G.Razaqpur, B. Fournier, S. Foo, IEE 2006 Conference paper<br />
published in EIC Climate technology journal, pp. 1- 8. ISBN, 14244-0218-2.<br />
Ahmad Shakri, M, S. Materials for green buildings. Syarahan perdana 2010, siri 5/2010.<br />
BREAM homepage, 2011. (http:www.bream.org. Feb. 16 th , 2011.<br />
<strong>Building</strong> <strong>and</strong> Construction Authority of Singapore homepage, 2011.(http:www.bca.gov.sg/green mark,<br />
Feb. 17, 2011).<br />
CASBEE homepage, 2011. (http:www.ibec.or.jp/casbee, Feb, 16 th , 2011<br />
Chunhai Xia, Yingxin Zhu <strong>and</strong> Borong Lin. (2007). Renewable energy journal, vol. 33, issue 5, May<br />
2008, pgs. 883- 886.<br />
Concrete International.ACI. 25 (8), 29- 34.<br />
ECOserve (2006b). Blended cements – the sustainable solution for the cement <strong>and</strong> concrete industry<br />
in Europe. Cluster 2 reports. Downloadable from www.Eco-serve.net.<br />
Evaluation st<strong>and</strong>ard of Green <strong>Building</strong>: GB/T 50378- 2006, published by MOHURD of PRC, In<br />
Chinese.<br />
George J.V, Michael N. 2001. Waste streams from building construction <strong>and</strong> demolition, with specific<br />
focus on concrete reuse <strong>and</strong> recycling report submitted to public works Government<br />
IISBE homepage, 2011. (http://www.iisbe.org. Feb 16, 2011).<br />
Kibert C.J; (2004). “Green building an overview of progress”, Journal of l<strong>and</strong> use, vol. 19:2, pp. 491 –<br />
502.<br />
Kibert C.J; (2007).<strong>Sustainable</strong> Construction: green building design <strong>and</strong> delivery, 2 nd edition, John<br />
Wiley <strong>and</strong> son USA.<br />
Kimberly R.Bunz,Gregory P. Henze <strong>and</strong> Dale K.Tiller; (2006). Survey of sustainable building design<br />
practices in North America, Europe <strong>and</strong> Asia, Journal of Architectural engineering (ASCE),pp. 33- 62.<br />
Malhotra, M. (2006). “Reducing CO2 emissions”. Concrete International, ACI. 28 (9) pp.42 – 45.<br />
Mehta, P.K.2001. Reducing the environmental impact of concrete. Concrete International, ACI,<br />
October issue, pp; 61 – 66.<br />
Neville, A.M. 1996. Properties of Concrete. Longman group Limited, Essex.<br />
Obla, K, Hill, R.L. <strong>and</strong> Martin, R. S; (2003). “HVFA-Concrete – an industry perspective.”<br />
Portl<strong>and</strong> cements Association (PCA), (1993).Cement <strong>and</strong> Concrete- environmental considerations:<br />
Environmental <strong>Building</strong>s News, vol. 2, no 20, Skokie, IL.<br />
Services Canada, Gatineau, Quebec, Canada.<br />
Top Energy Green <strong>Building</strong> Assessment,(2007). China construction industry press (In Chinese).
T149<br />
229<br />
International <strong>Building</strong> & <strong>Infrastructure</strong> Technology Conference<br />
7-8 June 2011, Vistana Hotel, Penang, Malaysia<br />
THE POTENTIALS OF URBAN WIND POWER IN MALAYSIA<br />
Hirda Lailani Khalid 1 <strong>and</strong> Abdul Malek Abdul Rahman 2<br />
1,2 Universiti Sains Malaysia, Pulau Pinang, Malaysia<br />
1 hirda_khalid@yahoo.com 1 , 2 malik@usm.my 2<br />
ABSTRACT: Located near the Equator, the Malaysian climate can be classified as hot-humid<br />
Equatorial. The sun generally shines throughout the year with high humidity <strong>and</strong> copious rain. Winds<br />
however are light <strong>and</strong> variable with the average of 0.3 m/s which can be considered as calm. Wind<br />
flows in the urban areas are complex but some general patterns can be identified such as the variation<br />
of height <strong>and</strong> different types of terrain. The uses of electric fans without proper design strategies to<br />
encourage air movements in the buildings will only distribute hot air that trapped inside. Due to this<br />
problem, most Malaysians are resorted <strong>and</strong> preferably to use air-conditioning systems to achieve<br />
thermal comfort at the same time avoiding air pollutions. Unfortunately, the modern fully airconditioned<br />
buildings making the cities temperature grows warmer <strong>and</strong> becoming urban heat isl<strong>and</strong>s.<br />
The evidence shows that the average global temperatures rose by modest but significant amount<br />
since the 20 th Century. The exhaust air from air-conditioning condenser which is technically released<br />
heat to surroundings, potentially becoming the alternative source in wind power generation. With the<br />
average of 9.23 m/s it is more than sufficient to generate electricity using a vertical-axis wind turbine<br />
(VAWT). Renewable energy is a promising way to solve the problem of environmental pollution <strong>and</strong><br />
global warming. There has been increased interest in using renewable energy technologies especially<br />
in the urban areas. Solar energy is an abundant source in Malaysia <strong>and</strong> people are making use of it by<br />
using solar photovoltaic (PV). It is unfortunate that the wind characteristics here are unpredictable,<br />
multidirectional <strong>and</strong> erratic except for two places which are on the sea sides (l<strong>and</strong> <strong>and</strong> sea breeze)<br />
<strong>and</strong> hilly areas (prevailing wind). Thus, this paper explores to what extent can wind or air movement<br />
be contributively <strong>and</strong> be better utilized in whatever form possible as an alternative energy for<br />
Malaysia’s initiatives to meet the Kyoto Protocol requirements.<br />
Keywords: wind power, Malaysia, urban area, exhaust air<br />
1. INTRODUCTION<br />
Malaysia is located near the Equator (4° 0' 0" N / 102° 0' 0" E) where the weather here can be<br />
classified as hot-humid Equatorial (www.met.gov.my). It is well-known for its extreme weather which is<br />
hot <strong>and</strong> humid throughout the year with copious of rain. Light winds, year-round warm <strong>and</strong> pleasant<br />
weather with constant temperatures <strong>and</strong> high humidity make outdoor living is much desirable<br />
(Furturarc, 2010). In the old days before the electrical lighting <strong>and</strong> cooling system were introduced,<br />
people rely solely on natural ventilation for comfort purposes by having many openings in their houses<br />
such as doors <strong>and</strong> windows in the living rooms, a chimney in the kitchen, <strong>and</strong> slits near the roof to<br />
allow air circulation <strong>and</strong> also illumination (Salmah Ahmed, et al., 2006). Traditional houses especially<br />
in rural areas were built in such a way the orientations of the buildings meet the criteria that favor the<br />
natural ventilation to take the effect.<br />
It has been gradually changed when space is now becoming limited <strong>and</strong> expensive especially in urban<br />
areas. Houses were built to accommodate as much as possible in provided l<strong>and</strong>, making people<br />
depending on electrical appliances for cooling <strong>and</strong> lighting purposes. As a result, the dem<strong>and</strong> on<br />
energy rises as the number of population grows, thus consume a hefty bill for electricity every month.<br />
Most people are resorted to use air-conditioning systems to cool the buildings, thus becoming urban<br />
heat isl<strong>and</strong>. The modern fully air-conditioned building is well-known as the late 20 th Century<br />
phenomenon (Roaf, et al., 2005) which is over 75% of the energy consumption in high rise buildings is<br />
allocated for air-conditioning systems only. Malaysia has been experiencing a dramatic increase in<br />
number of air-conditioning used which expected to be higher in the future (Mahlia, T.M.I., 2001;
230<br />
International <strong>Building</strong> & <strong>Infrastructure</strong> Technology Conference<br />
7-8 June 2011, Vistana Hotel, Penang, Malaysia<br />
Masjuki, et al., 2001). If looking into the air-conditioning process, the exhaust air path is the route<br />
ventilation of air travels between the outside <strong>and</strong> the occupied space inside the building. Exhaust air<br />
will be releases through the condenser unit that located outside the building. The hypothesis is the<br />
exhaust air releases from the air-conditioning unit as waste energy can be useful to generate<br />
electricity using the vertical-axis wind turbine (VAWT). This is the on-going research project that will be<br />
explained further on Section 3.<br />
According to Kyoto Protocol, the members should initiate programs to reduce global warming. The<br />
Kyoto target is a relatively small step which can be considered as the first step on a ‘ladder of change’<br />
(Stankovic, S., 2009). Malaysia National Policy has been created <strong>and</strong> one of the strategies is by<br />
promoting the use of alternative energy instead of fossil fuel. Suria 1000 targeting the residential <strong>and</strong><br />
commercial sector will establish the new BIPV market <strong>and</strong> will provide direct opportunities to the public<br />
<strong>and</strong> industry to be involved in renewable energy initiatives <strong>and</strong> environmental protection<br />
(www.mbipv.net.my/suria.htm, 2010). To achieve the Kyoto Protocol <strong>and</strong> our National Policy, we need<br />
to discover whatever possibilities we have in our region to optimize the use of renewable energy such<br />
as wind, biomass, hydro energy, wave energy, etc.<br />
The potential for urban wind energy in windy area is large <strong>and</strong> there are many forms that can be<br />
exploited (Stankovic, S., et al., 2009). In tropical region like Malaysia where it is difficult to obtain<br />
predictable or large amounts of wind energy, smaller systems may still be used to run low power<br />
equipment such as lighting, parking meters, etc. The key elements that determine the viability of urban<br />
power are wind turbine technology, wind resources, cost, <strong>and</strong> regulation (Christopher, et al., 2004).<br />
Besides, in considering the urban wind regime, two main characteristics appear which are lower<br />
annual mean wind speeds <strong>and</strong> turbulent flow (Paulides, J.J.H., et al., 2009). Omni-directional wind or<br />
uniform wind (turbulence) is common in many urban areas which help to accelerate the wind through<br />
building designs (Stankovic, S., et al., 2009). Those factors are crucial in order to choose the right <strong>and</strong><br />
efficient turbine that is worth as alternative energy. This is important to get sufficient power output from<br />
wind generation.<br />
2. WIND CHARACTERISTICS IN URBAN AREA<br />
Malaysian winds are unpredictable, multidirectional, <strong>and</strong> erratic (Abdul Malek, 2004) except for sea<br />
sides that creating l<strong>and</strong> <strong>and</strong> sea breeze <strong>and</strong> highl<strong>and</strong>s, creating prevailing winds; which are set for<br />
rural settings. The average of natural mean velocities in several towns in Malaysia is in the range of<br />
1.0 m/s to 3.0 m/s (Kubota, T., & Supian Ahmad, 2006) which can considered as calm.<br />
In the cities (urban areas), wind flows are complex but some general patterns can be identified,<br />
starting with the variation of velocity with height as the wind flows over different types of terrain<br />
(Dutton, 2005). Most of the buildings are high-rise, thus affecting the pattern of wind flow. The air on<br />
the lower levels is normally polluted by exhaust air from transportations <strong>and</strong> other human activities. To<br />
avoid this, most tropical high-rise buildings especially in developing countries replicate cold-climate<br />
models with sealed facades, reliant on air-conditioning (<strong>Future</strong>arc, 2010). As the higher the altitude,<br />
the intensity of air pollution is decreasing <strong>and</strong> the wind flows are increasing as well (Figure 1). These<br />
winds will not only have a relatively high energy content but are also likely to be less turbulent<br />
(Stankovic, S., et al., 2009). These advantages are useful to design high-rise buildings with natural<br />
ventilated internal spaces <strong>and</strong> making the air-conditioning as an option.<br />
Figure 1. Power law relation for varying wind speed with height (Source: Ecology of The Sky)
231<br />
International <strong>Building</strong> & <strong>Infrastructure</strong> Technology Conference<br />
7-8 June 2011, Vistana Hotel, Penang, Malaysia<br />
The bioclimatic skyscrapers designed by Ken Yeang are taking these factors into the design<br />
considerations which can be seen through the building façades in most of his projects such as Editt<br />
Tower (Figure 2a), Menara Mesiniaga (Figure 2b) <strong>and</strong> Menara UMNO (Figure 2c) (Richards, I., 2001).<br />
Floor plans on the higher levels are different from those on the lower levels. Balcony, sky court <strong>and</strong><br />
terrace garden (Figure 2b <strong>and</strong> 2c) are applied on upper levels not only functioned as resting areas but<br />
also to accommodate natural winds <strong>and</strong> provide greenery spaces to filter the natural wind. The other<br />
feature of bioclimatic skyscraper that considering wind factor is the wing-walls (Figure 2c) that<br />
functioned to redirect the wind to special balconies zone that serve as pockets with ‘air-locks’. The<br />
positioning of wing-walls is indicated by the wind rose for the site.<br />
The other example of tropical skyscraper that taking the advantage of natural wind on higher altitude is<br />
‘The MET’, which is located in Bangkok. The climate in Bangkok is almost similar with Malaysia. The<br />
designs are accommodate cross-ventilated tropical houses in the sky with breezeways, full exposure<br />
to light <strong>and</strong> views, outdoor living areas, planters <strong>and</strong> high-rise gardens, open-air communal terraces,<br />
libraries <strong>and</strong> other facilities (Futurarch, 2010). These are the proofs that the tropical high-rise buildings<br />
have great potentials to achieve thermal comfort through passive design if we know the characteristics<br />
of nature itself.<br />
(a) (b) (c)<br />
Figure 2: The highlighted areas show the design features that accommodate natural wind in Ken<br />
Yeang’s bioclimatic skyscrapers designs (Source: Ecology of The Sky)<br />
The swirling turbulent character of low-level urban wind, due to complex interaction of the wind with<br />
buildings is detrimental to the amount of energy that can be extracted. The wake effect is a common<br />
phenomenon of winds in urban environments. It usually occurs when the wind is accelerating with high<br />
turbulence when hitting the edge of buildings. The disturbed regions of wake effect should be justified<br />
<strong>and</strong> should be avoided by placing the turbine as higher as possible (Figure 3). This is an important<br />
consideration when siting turbines in urban environment which commonly achieved by ensuring the<br />
blades of turbine are sufficiently elevated above the level that needs to be avoid. In the Western<br />
countries, the horizontal-axis wind turbine (HAWT) type is widely <strong>and</strong> commonly used especially in<br />
wind farms in rural areas because the direction prevailing winds are predictable. In urban<br />
environments, HAWT type is not suitable to be used due to the unpredictable pattern. However, there<br />
are cases where turbulence or the acceleration near buildings can be used to gain an advantage<br />
(Stankovic, S., et al., 2009). As the wind is at its highest speed at the edges (highlighted area), the<br />
optimum length need to be determined in order to reduce the unwanted turbulence. There are<br />
promising ways to generate electricity using natural wind in our low-wind speed conditions as the<br />
studies from Western countries on the characteristics of urban winds are studied thoroughly.
232<br />
International <strong>Building</strong> & <strong>Infrastructure</strong> Technology Conference<br />
7-8 June 2011, Vistana Hotel, Penang, Malaysia<br />
Figure 3. The wake effect phenomenon <strong>and</strong> the possible sitings of wind turbines to avoid the<br />
disturbed region (Source: Urban Wind Energy)<br />
3. TURBINE TECHNOLOGIES FOR TROPICAL URBAN WIND POWER<br />
There are two types of wind turbines that categorized by the way they look; which are horizontal <strong>and</strong><br />
vertical. Horizontal-axis wind turbines is effective when the wind speed is higher enough <strong>and</strong> not<br />
suitable for the locations that have average wind speed is not enough <strong>and</strong> too low (Masaaki, H., et al.,<br />
2008). The vertical-axis wind turbine (VAWT) is the most suitable wind turbine to be used in Malaysia<br />
or urban areas where the winds are multidirectional <strong>and</strong> low-wind speed condition (Stitt, 1999;<br />
Masaaki, H., et al., 2008; Paulides, et al., 2009; Stankovic, S., et al., 2009; LeGault, M.R., 2009).<br />
VAWT is Omni-directional, which means it can harness wind from all direction. Changes in wind<br />
direction have fewer negative effects on this type of turbine because it does need to be positioned into<br />
the wind direction (Paulides, J.J.H., et al., 2009). With the minimum wind velocity of 5.0 m/s it is<br />
sufficient to generate electricity (Gauzin-Muller, 2002).<br />
In Malaysia, there are several manufacturers that show potentials for urban wind purposes such as<br />
iWind, Cygnus Power <strong>and</strong> Loopwing. They have been designed to suit in low-wind speed conditions<br />
with the start-up wind speed as low as 0.8 m/s <strong>and</strong> it could start generate electricity (cut-in wind<br />
speed) at 1.8 m/s (www.iwindenergy.com.my). The technology from these manufacturers already has<br />
been tested in our region for st<strong>and</strong>-alone purposes <strong>and</strong> even in research field.<br />
Table 1. Several manufacturers of wind turbines in Malaysia that suited with low-wind speed condition<br />
MANUFACTURER COUNTRY Type (load) Blade diameter Start‐up wind speed Cut‐in wind speed<br />
iWind<br />
Cygnus Power<br />
Loopwing<br />
Taiwan 300 W 1.2 m 0.8 m/s 1.8 m/s<br />
Japan 200 W 1.0 m 1.0 m/s 1.3 m/s<br />
Japan<br />
Tronc Series<br />
µ Series<br />
1.5 m<br />
2.85 m<br />
2.0 m/s<br />
2.0 ‐ 3.0 m/s<br />
4.0 m/s<br />
4.0 m/s
233<br />
International <strong>Building</strong> & <strong>Infrastructure</strong> Technology Conference<br />
7-8 June 2011, Vistana Hotel, Penang, Malaysia<br />
3.1 Small Wind Energy: Retrofitting <strong>and</strong> <strong>Building</strong>-mounted Wind Turbines<br />
Small-scale renewable energy technologies generate clean <strong>and</strong> renewable energy while reducing CO2<br />
emissions (Paulides, J.J.H., et al., 2009). The small-scale st<strong>and</strong>-alone power generation systems are<br />
an important source of electrical energy as they can be applied in locations where conventional<br />
generation is not practical (Ahmed Nabil, et al., 2009). As been discussed on the above section, the<br />
disturbed areas caused by the wake effect can be avoided by placing the turbines as higher as<br />
possible. Wind turbines installed at high levels are able to access winds with higher energy contents<br />
(Stankovic, S., et al., 2009). In housing areas, it can be done by determine the minimum height of<br />
disturbed area, thus small <strong>and</strong> st<strong>and</strong>-alone turbines can be building-mounted using high poles on the<br />
building’s main structure.<br />
Figure 4.(Left) The sharp edge of a typical building is normally creating turbulence <strong>and</strong> a<br />
disturbed region, thus wind turbine needs to be placed as higher as possible. (Right) With the smooth<br />
edge, winds will be less turbulence <strong>and</strong> wind turbine has the advantage to be placed much lower.<br />
3.2 Hybrid Solar Photovoltaic <strong>and</strong> Wind Turbine<br />
Renewable energy source from wind turbine <strong>and</strong> solar photovoltaic (PV) is the most environmentalfriendly<br />
type of energy to be used in tropical regions. Economic aspects of these renewable energy<br />
technologies are sufficiently promising to include them for rising power generation capability in<br />
developing countries (Nema, P., et al., 2009). In our region, solar is an abundant energy, making the<br />
hybrid solar photovoltaic <strong>and</strong> wind turbine as the most appropriate technology. Winds are less reliable<br />
in our climate condition but it is possible to be generated if it is being placing on the right locations<br />
such as sea sides, highl<strong>and</strong>s <strong>and</strong> higher altitude.<br />
Figure 4: The examples of hybrid solar photovoltaic <strong>and</strong> wind turbine<br />
In cold-climate countries, wind speeds are usually low in the summer when the sun shines brightest<br />
<strong>and</strong> longest. The wind is strong in the winter when there is less sunlight available. Because the peak<br />
operating times for wind <strong>and</strong> PV occur at different times of the day <strong>and</strong> year, hybrid systems are more<br />
likely to produce power when it needed. For the times when neither the wind generator nor the PV<br />
modules are producing electricity (at night when the wind is not blowing), most st<strong>and</strong>-alone systems<br />
provide power through batteries or an engine-generator powered by fossil fuels like diesel. If the<br />
batteries run low, the engine-generator can be run at full power until the batteries are charged. It is<br />
applicable for Malaysian wind due to its unreliability factors. Today’s technology has made wind<br />
turbine is easy <strong>and</strong> quick to install, besides it has came in modular system. Hybrid solar photovoltaic<br />
<strong>and</strong> wind turbine is cost-effective <strong>and</strong> suitable for the sites that under varying climatic conditions. It can<br />
be installed without measuring the irradiance of the photovoltaic or wind speed on site (Ahmed Nabil,<br />
et al., 2009).
3.3 <strong>Building</strong>-Integrated Wind Turbine (BIWT)<br />
234<br />
International <strong>Building</strong> & <strong>Infrastructure</strong> Technology Conference<br />
7-8 June 2011, Vistana Hotel, Penang, Malaysia<br />
BIWT is defined when the wind turbines associated with buildings designed <strong>and</strong> shaped specially with<br />
wind energy in mind (Stankovic, S., et al., 2009). The buildings also act as concentrator of the wind<br />
(Mertens, S., 2002) in which it can speed up the wind velocity at the position of wind turbine or create<br />
a high turbulence level. Thus, the wind turbines will be located at the high wind speed zones in the<br />
buildings.<br />
The integration of dynamic rotating machines will influence decisions on building designs such as<br />
orientation, massing, structure, insulation, etc. The matching of supply <strong>and</strong> dem<strong>and</strong> within local areas<br />
<strong>and</strong> the connection of loads to the system need consideration at urban site planning scale because of<br />
the importance of the mix of building types <strong>and</strong> activities (Pitts, 2004). Alternative building forms,<br />
orientations <strong>and</strong> design features may be necessary to provide for or enhance the energy supply<br />
potential of the alternative technologies.<br />
Wind turbines for the built environment that exploit higher wind speeds around buildings have to be<br />
designed for different types of flow <strong>and</strong> low noise emission (Mertens, S., 2002). The turbines that<br />
integrate smoothly to the building both structurally <strong>and</strong> visually will minimize the maintenance <strong>and</strong><br />
noise especially in highly dense populated areas (Paulides, J.J.H., et al., 2009). For large-scale BIWT,<br />
it needs to consider the public safety aspect, the visual effect, noise, shadow flicker <strong>and</strong> blade<br />
reflected light, electromagnetic interference (EMI), biodiversity <strong>and</strong> birds, <strong>and</strong> property values<br />
(Stankovic, S., et al., 2009), if not these will distracting the existing surroundings.<br />
The concentrator effect will only be present for small wind turbine dimensions compared to the<br />
building dimension since the wind turbine has to be located in high- wind speed zones, which only<br />
exist close to the buildings (Mertens, S., 2002). When a void or open floor is created, this would cause<br />
strong acceleration of wind. For example, the sky court design which is used to serve as transitional<br />
areas between inside <strong>and</strong> outside areas, it also can functioned as concentrator to receive direct wind<br />
flow of external wind <strong>and</strong> redirect it into indoor environment. Besides, small VAWTs can be retrofit in<br />
this area at the same time to harness the accelerate winds. A hole in the middle of building façade<br />
where the turbine will be placed is also called a ‘coin’ model (Beller, C., 2008).<br />
The Castle House is an example of the coin model that acts as concentrator. It is a 43-story buildings<br />
rising to 147 meter above ground level with three 9-meter diameter wind turbine at the top. Another<br />
large-scale urban wind power is Bahrain World Trade Center. It has three units of horizontal-axis wind<br />
turbines that located in between two towers. Each turbine has 225 kW power make the total of 625 kW<br />
of power. The HAWT is the best type to be used for this building because they have the advantage of<br />
facing the Gulf Sea which has high annual wind speeds. Air Apartments, designed by Australian’s<br />
Rothe Lowman Architect is another proposal of integrated wind turbine design on top of towers. Wind<br />
turbines are adapted for local conditions will offset a percentage of energy loads of the buildings<br />
(Futurarch, 2010).<br />
(a) (b) (c)<br />
Figure 5. (a) The Castle House, London (http://inhabitat.com/castle-house-eco-skyscraper/ ) (b)<br />
Bahrain World Trade Centre (http://www.bahrainwtc.com/ ) (c) Air Apartment, Australia<br />
(http://www.archdaily.com/33510/air-apartments-rothe-lowman/) that integrate the building designs<br />
with large-scale wind turbine.
3.4 Harnessing Exhaust Air of Air-Conditioning System<br />
235<br />
International <strong>Building</strong> & <strong>Infrastructure</strong> Technology Conference<br />
7-8 June 2011, Vistana Hotel, Penang, Malaysia<br />
This is the on-going research project entitled “Optimizing Wind Power for Energy Efficient <strong>Building</strong><br />
Design in Tropical Hot-Humid Climate of Malaysia”. The hypothesis is the exhaust air of airconditioning<br />
can be the alternative source for wind power generation in Malaysia <strong>and</strong> other low-wind<br />
speed regions. It is predictable winds that already available from air-conditioning systems for most of<br />
buildings in hot-humid countries, thus wind turbine technology is ready to be retrofit into the existing<br />
buildings.<br />
Based on the literature review discussed on the above section, it can be conclude that natural wind in<br />
Malaysia is unreliable, multidirectional <strong>and</strong> unpredictable making that as limitation factors of research<br />
in tropical countries. As for Western countries, wind power generations have large potential in<br />
replacing fossil fuels. However, they are also facing the same problems to harness wind power in<br />
urban areas due to the unpredictable flow pattern. The methodology of research that they are using<br />
can still be adapted for our conditions such as the juxtapositions of wind turbines on the existing<br />
buildings. The experimental study is divided into three phases, which are:<br />
(a) Phase 1- Lab test: To test the efficiency of VAWT from manufacturer<br />
(b) Phase 2- Exhaust air distribution: To investigate the characteristics of exhaust air distribution<br />
of condenser<br />
(c) Phase 3- Field test: To test the efficiency of both VAWT <strong>and</strong> alternative source<br />
After done the surveys on 30 condenser units around the <strong>USM</strong> campus, Topaire br<strong>and</strong> has the highest<br />
velocity with the average of 9.23 m/s. It is being used to test the characteristics of its air distribution<br />
without <strong>and</strong> with Venturi concentrator. The Venturi concentrator is expected to create the Venturi<br />
effect which will accelerate the exhaust air <strong>and</strong> give higher wind velocity. The final part of the thesis<br />
will be the recommendations on architecture design solution to retrofit the VAWT technology on the<br />
existing buildings in Malaysia especially in urban areas. To support all the empirical data, the result<br />
also will be shown in Computational Fluid Dynamics (CFD) Modeling.<br />
(a) (b) (c)<br />
Figure 6. (a) The characteristics of exhaust air distribution will be investigated, (b) without<br />
concentrator <strong>and</strong> (c) with a venturi concentrator<br />
4. CONCLUSIONS<br />
The research on wind power in low-wind speed conditions have not been discovered widely as there<br />
are many limitations on wind characteristics itself. In Western countries, wind power is a potential<br />
renewable energy alongside with solar energy, hydro power, biomass, tidal energy <strong>and</strong> geothermal.<br />
Thus, their studies on urban wind power in which the conditions <strong>and</strong> characteristics are almost similar<br />
to our climate conditions, could be used in this research. There are many possible ways to optimize<br />
wind power in Malaysia; therefore any possibilities should be explored as it is our initiatives to meet<br />
the Kyoto Protocol requirements.<br />
REFERENCES<br />
Abdul Malek, A. R. (2004). Low Energy Cooling Technology for Malaysian Homes, Penang, Universiti<br />
Sains Malaysia Publisher.
236<br />
International <strong>Building</strong> & <strong>Infrastructure</strong> Technology Conference<br />
7-8 June 2011, Vistana Hotel, Penang, Malaysia<br />
Ahmed, N. A., Miyatake, M. & Al-Othman, A. K. (2009). Hybrid solar photovoltaic/ wind turbine<br />
energy generation system with voltage-based maximum power point tracking. Electric Power<br />
Components <strong>and</strong> <strong>Systems</strong>, 37, pp 43-60.<br />
Beller, C. (2008). Layout design for a Venturi to encase a wind turbine integrated in a high rise.<br />
Christopher, D. D., Michiel, J.G.J (2004). Wind Power for Urban Applicants. ASME 2004 Power<br />
Conference.<br />
Dutton, A., Halliday, J. & Blanch, M. (2005). The Feasibility Of <strong>Building</strong>- Mounted/Integrated Wind<br />
Turbines (Buwts): Achieving Their Potential For Carbon Emission Reductions. Energy Research Unit,<br />
Cclrc, May, 2002-07.<br />
Gauzin-Muller, D. (2002). <strong>Sustainable</strong> Architecture And Urbanism :Concepts, Technologies,<br />
Examples, Basel, Birkhauser.<br />
Http://Www.Met.Gov.My/Index.Php?Option=Com_Content&Task=View&Id=75&ItemiD=1089<br />
[Accessed 2010].<br />
Iwind Energy Malaysia [Online]. Malaysia. Available: Http://Www.Iwindenergy.Com.My [Accessed<br />
2010].<br />
Legault, M. R. (2009). Urban Turbine Redesign Taps Benefits Of Additive Fabrication. High-<br />
Performance Composites, 17.<br />
Mahlia, T. M. I., Masjuki, H. H., Choudhury, I. A. & Saidur, R. (2001). Potential Co2 Reduction By<br />
Implementing Energy Efficiency St<strong>and</strong>ard For Room Air Conditioner In Malaysia. Energy Conversion<br />
And Management, 42, pp 1673-1685.<br />
Malaysian Meteorological Department (Mmd): General Climate Of Malaysia [Online]. Malaysia.<br />
Available:<br />
Masaaki Honda, D. H. D., Kyung Rok Moon, Yong Beom Pyeon, Yangil Yoon, Hyo Jae Jo & Masahiro<br />
Takei. (2008). Three Dimensional Flow Characteristics Of The Tip Vortices Near The Blade Of A<br />
Vertical Axis Mill. In: Isfv13 - 13th International Symposium On Flow Visualization, Fluvisu12 - 12th<br />
French Congress On Visualization In Fluid Mechanics, Nice, France.<br />
Masjuki, H. H., Mahlia, T. M. I. & Choudhury, I. A. (2001). Potential Electricity Savings By<br />
Implementing Minimum Energy Efficiency St<strong>and</strong>ards For Room Air Conditioners In Malaysia. Energy<br />
Conversion And Management, 42, pp 439-450.<br />
Mertens, S. (2002). Wind Energy In Urban Areas: Concentrator Effects For Wind Turbines Close To<br />
<strong>Building</strong>s. Refocus, 3, pp 22-24.<br />
Nema, P., Nema, R. K. & Rangnekar, S. (2009). A Current And <strong>Future</strong> State Of Art Development Of<br />
Hybrid Energy System Using Wind And Pv-Solar: A Review. Renewable And <strong>Sustainable</strong> Energy<br />
Reviews, 13, pp 2096-2103.<br />
Paulides, J. J. H., Encica, L., Jansen, J. W., Lomonova, E. A. & Van Wijck, D. (2009). Small-Scale<br />
Urban Venturi Wind Turbine: Direct-Drive Generator. Miami, Fl. pp 1368-1373.<br />
Pitts, A. C. (2004). Planning And Design Strategies For Sustainability And Profit: Pragmatic<br />
<strong>Sustainable</strong> Design On <strong>Building</strong> And Urban Scales Oxford, Architectural Press.<br />
Residential Architecture. (2010). Multiple Houses. Futurarc. 3rd Quarter Ed. Malaysia: Yamagata<br />
(Malaysia) Sdn. Bhd.<br />
Richards, I. (2001). Hamzah & Yeang : Ecology Of The Sky (The Millennium Series), Australia,<br />
Images Publishing Group.<br />
Roaf, S. (2005). Adapting <strong>Building</strong>s And Cities For Climate Change: A 21st Century Survival Guide,<br />
Amsterdam, Elsevier/Architectural Press.<br />
Samirah Abdul Rahman & Azni Zain- Ahmed (2006). Energy In <strong>Building</strong>s, Selangor, Malaysia, Pusat<br />
Penerbitan Universiti (Upena) Uitm.<br />
Stankovic, S. (2009). Urban Wind Energy, London; Sterling, Va, Earthscan.<br />
Stitt, F. A. (1999). Ecological Design H<strong>and</strong>book: <strong>Sustainable</strong> Strategies For Architecture,<br />
L<strong>and</strong>scape Architecture, Interior Design, And Planning, Whitehouse Station, Mcgraw-Hill.<br />
Suria 1000 [Online]. Available: Www.Mbipv.Net.My/Suria.Htm [Accessed 2011].<br />
Tetsu Kubota & Supian Ahmad (2006). Wind Environment Evaluation Of Neighborhood Areas In<br />
Major Towns Of Malaysia. Journal Of Asian Architecture And <strong>Building</strong> Engineering, May 2006/8.
T150<br />
237<br />
International <strong>Building</strong> & <strong>Infrastructure</strong> Technology Conference<br />
7-8 June 2011, Vistana Hotel, Penang, Malaysia<br />
FACILITIES MANAGEMENT DECISION SUPPORT IN INTELLIGENT BUILDING<br />
TECHNOLOGIES: A STUDY IN KLANG VALLEY, MALAYSIA<br />
Mohamad Ridzuan Yahya<br />
Kulliyyah of Architecture <strong>and</strong> Environmental Design, International Islamic University<br />
Malaysia, 50728 Kuala Lumpur.<br />
moham643@gmail.com<br />
ABSTRACT: It is important to focus on developing facilities management (FM) decision support<br />
aspect in the intelligent building technologies (IBTs) of high rise buildings in order to make sure it is in<br />
good condition <strong>and</strong> positive performance all the time. In Malaysia scenario, various obstacles have to<br />
be faced by the FM for controlling all activities related to the high rise building <strong>and</strong> its system. The<br />
crucial issue is to provide advance technology in order to support adequate economical <strong>and</strong> technical<br />
aspect in FM. FM decision support involves obtaining maximum benefit from the investment made on<br />
the maintenance activities. The present research focused on a pilot study which interviewed all<br />
professionals involved in the project particularly based on the value aspects of building which are the<br />
quality, safety <strong>and</strong> service of the FM provided <strong>and</strong> implemented in five selected high rise buildings in<br />
Klang Valley, Malaysia. The paper concludes that even though measured a current practice of FM, the<br />
model of IBTs in Malaysia has not been adopted as rapidly <strong>and</strong> extensively as expected because of<br />
lack of information <strong>and</strong> knowledge support to the entire group of professionals involved at the design<br />
stage until future maintenance of a building. This paper provides a concise general idea on the new<br />
advances of IBTs <strong>and</strong> discusses ways of supplementing the decision making process by adopting two<br />
methods for economical <strong>and</strong> technical aspects of IBTs. It goes on to initiate an on-going study which<br />
aims to develop knowledge based systems to grant all-inclusive evaluations FM decision support to<br />
retrofit building maintenance when they are being conceptualized.<br />
Keywords: intelligent building, facilities management, decision support<br />
1. INTRODUCTION<br />
IBT of high rise buildings in Malaysia are becoming one of the criteria in the FM <strong>and</strong> performance<br />
management. As new products <strong>and</strong> technologies are emerging, this problem seems to be more<br />
evident as the gap widens between available IBT <strong>and</strong> the actual number of high rise buildings<br />
incorporating IBT concepts. Recently significant advances have been made in the design, engineering<br />
<strong>and</strong> construction of IBT, which not only accommodate major advances in high rise building but also<br />
provide better physical <strong>and</strong> environmental settings for the occupants. However, the development <strong>and</strong><br />
implementation of sustainable FM in that particular building is still lacking. Lee <strong>and</strong> Scott (2008)<br />
identify building policy <strong>and</strong> strategy, strategic management, facility management <strong>and</strong> performance<br />
management as the four main aspects influencing the sustainable of IBT implementation. Nowadays<br />
building owners are more concerned about building maintenance performance as it reflects their<br />
buildings image as well as competitive advantages in terms of a marketing strategy to attract more<br />
people to buy <strong>and</strong> rent.<br />
There are many potential reasons for this gap. One of them is the lack of information <strong>and</strong><br />
underst<strong>and</strong>ing of IBT among building owners <strong>and</strong> FM personnel. FM, with characteristic least cost<br />
mindset, often considers IBT expensive to install as well as maintain. They lack true thoughtful of the<br />
IBT. Very often they are not well knowledgeable of the lifecycle costing of the project. Hence, these<br />
decision makers often fail to consider the effectiveness <strong>and</strong> flexibility that IBT can ensure to their<br />
tenants <strong>and</strong> occupants, which will raise rent potential. In addition, engineers develop new technology<br />
to mechanical <strong>and</strong> electrical system as well as electronic system such as building automation system<br />
(BAS) <strong>and</strong> other advance technology in their components in order to save energy <strong>and</strong> easier to control<br />
these particular systems. In contrast, contractors refuse to take on these concepts in their products
238<br />
International <strong>Building</strong> & <strong>Infrastructure</strong> Technology Conference<br />
7-8 June 2011, Vistana Hotel, Penang, Malaysia<br />
fearing that it will make their job more difficult <strong>and</strong> increase project risk <strong>and</strong> costs. Again, lack of<br />
knowledge <strong>and</strong> appreciation of IBT plays an important part.<br />
The IBT is considered to be fundamental part of ensuring high-quality service for the high rise<br />
buildings such as Petronas Twin Tower, TM Tower, Maybank Square, Maybank Tower <strong>and</strong> Kawalram<br />
Tower. According to Seeley (1976); Lee (1987); Spedding (1987); Barrett (1995); Chanter <strong>and</strong><br />
Swallow (1996); Horner et al (1997) the future implementation in facilities management, including IBT<br />
<strong>and</strong> its maintenance programming <strong>and</strong> scheduling are developed.<br />
2. THEORITICAL FRAMEWORK<br />
This paper focused on high rise building managed by the facilities management (FM). Theoretically, in<br />
managing IBT of high rise building, both parties, i.e. FM <strong>and</strong> the owners have to attain a consensus in<br />
all management-related matters. This is to ensure an effective management for the building. This<br />
study found that there are many potential reasons <strong>and</strong> gap decision maker in FM regarding IBT<br />
among high rise buildings. In discussing this matter, the paper starts briefly on several key issues that<br />
led to a management gap. It is then followed by the methodology in identifying the management gap<br />
<strong>and</strong> the important findings from this study.<br />
As a IBT can be seen as a system, the systems approach can be used in the FM development<br />
process. The systems approach integrates the analytic <strong>and</strong> the synthetic method, encompassing both<br />
holism <strong>and</strong> reductionism (Heylighen, 1998). This approach employs the systems thinking introduced<br />
by Simon (1960). When solving a complex problem following the systems thinking, one is to take out<br />
the parts which can be well defined <strong>and</strong> solve them separately. For IBT problems characterized by<br />
complexity (such as those concerned with FM <strong>and</strong> maintenance management re-development) using<br />
systems concepts offers a way of rationalizing aspects of existing practice <strong>and</strong> of suggesting<br />
directions for improvement (Stewart et.al., 2001).<br />
While systems theories <strong>and</strong> models can certainly be improved, De Greene (1993) placed great<br />
emphasis on the deficiencies in the structure of the IBT implementation <strong>and</strong> in policymakers. He<br />
provided the results of many years of working with complex systems in the contexts of systems<br />
analysis, systems design, <strong>and</strong> policy-making <strong>and</strong> decision-making.<br />
While aiming at the application in the housing sector, Burian (1989) who discussed a framework for<br />
IBT <strong>and</strong> development. The framework presented can be used in the IBT development process or post<br />
facto in FM. The usefulness of the framework is that it provides a means to think about IBT <strong>and</strong> its<br />
development.<br />
According to the systems approach as understood from the literature, six (6) steps of IBT development<br />
process are defined in this paper, namely:<br />
i. Preparation <strong>and</strong> informal consultations<br />
ii. Establishment of facilities management agenda<br />
iii. Creation of facilities management personnel commitment <strong>and</strong> owners as well as end user<br />
opinion<br />
iv. Decision making<br />
v. Evaluation<br />
vi. IBT Implementation <strong>and</strong> FM development<br />
3. RESEARCH OBJECTIVE<br />
To rectify this problem, an aim of study is to develop a knowledge based system to provide information<br />
<strong>and</strong> decision support to FM, engineers, contractors, potential tenants <strong>and</strong> occupants, on the adoption<br />
<strong>and</strong> application of IBT. It involves several major stages of development, such as scope definition of<br />
IBT applications, categorization of IBT <strong>and</strong> extraction <strong>and</strong> formation of decision-making processes of<br />
design teams <strong>and</strong> FM. Unique mechanisms for simulation <strong>and</strong> knowledge representation developed<br />
for the system allow the simulation of decision making models while maintaining system flexibility. The
239<br />
International <strong>Building</strong> & <strong>Infrastructure</strong> Technology Conference<br />
7-8 June 2011, Vistana Hotel, Penang, Malaysia<br />
incorporation of life cycle costing analysis into the system adds another dimension <strong>and</strong> creditability to<br />
overall process of the identification, selection, evaluation <strong>and</strong> feedback for the application of IBT.<br />
Having identified some of the possible reasons for the resistance to IBT applications <strong>and</strong> based on<br />
these findings, this paper gives a brief review on the recent IBT development <strong>and</strong> its relevance in<br />
tenant <strong>and</strong> occupant requirement. It discusses the specific considerations in the decision making<br />
process of IBT applications in terms of economical <strong>and</strong> technical evaluations.<br />
The present research focused on sustainable IBT of existing FM in high rise buildings in Klang Valley,<br />
Malaysia. Its goal was to stimulate <strong>and</strong> support sustainable <strong>and</strong> consumer oriented transformation of<br />
IBT in high rise buildings. The main results of this research are management tools designed for FM<br />
organization <strong>and</strong> decision makers (building owner) in order to integrate sustainability <strong>and</strong> building end<br />
user participation in IBT implementation processes. It was concluded that an integrated approach for<br />
decision making based on a strategic plan could contribute to better outcomes. Based upon<br />
questionnaires interviewed to the 100 respondents, a comprehensive analysis of data was compiled.<br />
The main objective was to identify the problems of sustainable IBT of FM in high-rise buildings. Not<br />
only were problems from a technical perspective discussed, but also FM performance indicators were<br />
taken into account.<br />
4. INVESTIGATION METHOD<br />
This study attempts to provide a technical analysis on the IBT of FM in high rise buildings through<br />
unstructured interview. The study surveys the availability of relevant information <strong>and</strong> documentation,<br />
<strong>and</strong> the performance of building maintenance in FM. The interview is based on the following<br />
questions:<br />
i. How buildings were managed?<br />
ii. Whether or not IBT is provided in practicing FM operational processes?<br />
iii. Whether or not the FM personnel have appropriate skill <strong>and</strong> knowledge?<br />
iv. Whether the record management is systematic?<br />
v. Whether the maintenance job is conducted in house or outsourced?<br />
vi. Whether the FM complies with building requirement?<br />
vii. Whether the IBT operation is efficient?<br />
viii. Whether the IBT fulfill a satisfaction level <strong>and</strong> comfort?<br />
Five high rise buildings in Malaysia were r<strong>and</strong>omly selected. The buildings were Petronas Twin Tower,<br />
TM Tower, Maybank Square, Maybank Tower <strong>and</strong> Kawalram Tower located in Klang Valley, Malaysia.<br />
<strong>Building</strong> Owner, FM personnel, engineers, maintenance professional, contractors, potential tenants<br />
<strong>and</strong> occupants were interviewed. A series of test runs will be combined with verification <strong>and</strong> evaluation<br />
of the system by engineer, building management personnel <strong>and</strong> contractors.<br />
5. RESULT AND DISCUSSION<br />
It was found IBT implementation was available in certain system only such as air-conditioning, lighting,<br />
alarm, close circuit television (cctv), building access, lift in the buildings but the development of<br />
strategic management, FM <strong>and</strong> performance management were available in them. However, planned<br />
maintenance <strong>and</strong> unplanned maintenance are not in a high priority list in most of the IBT in FM<br />
organizations. It was also found annual budget for unplanned maintenance <strong>and</strong> long-term planning for<br />
planned maintenance of IBT, were practiced at only three buildings. Finally, it was found all buildings<br />
did not conduct building services audit of IBT.<br />
5.1 BUILDING MANAGEMENT AND FM OPERATION<br />
The operation of building <strong>and</strong> FM is becoming much more business driven <strong>and</strong> managers will<br />
increasingly see occupants of buildings as customers or clients who must be kept happy rather than<br />
tenants who just happen to occupy the buildings. FM able to utilize both human systems for FM <strong>and</strong>
240<br />
International <strong>Building</strong> & <strong>Infrastructure</strong> Technology Conference<br />
7-8 June 2011, Vistana Hotel, Penang, Malaysia<br />
computer systems for building such as building automation system (BAS) in order to provide a better<br />
service. In turn, this dem<strong>and</strong>s three levels of solutions to ensure a successful intelligent building in<br />
place. First, an effective building shell is needed to absorb information technology expansion <strong>and</strong><br />
allow organizations’ growth <strong>and</strong> change. Second, building <strong>and</strong> BAS <strong>and</strong> space management systems<br />
are required to facilitate effective internal <strong>and</strong> external communication, support environmental <strong>and</strong><br />
individual comfort control <strong>and</strong> monitor change, access <strong>and</strong> usage. Third, there is a need for integrated<br />
technologies <strong>and</strong> services that allow the integration of disparate organizations, systems, data <strong>and</strong><br />
personnel to focus on the common goal of increased business effectiveness.<br />
5.2. SPECIFIC CONSIDERATIONS IN THE IMPLEMENTATION OF IBT<br />
The application of new IBT was met with problems associated with the decision making process, in the<br />
conception stage of the project development. Key issues include the lack of information <strong>and</strong><br />
established assessment criteria.<br />
It is evident from the findings that the knowledge <strong>and</strong> quality of maintenance of FM implemented for<br />
IBT system is not consistent. There is a need to develop a FM decision support to be enforced<br />
practically to ensure comfort <strong>and</strong> safety to public. Maintenance of IBT seems to be implemented ‘half<br />
cook’ basis. In other word, planned <strong>and</strong> unplanned maintenance is not given a priority. This can be<br />
inferred from the finding of this study that annual budget for unplanned maintenance <strong>and</strong> long-term<br />
planning for planned maintenance are not implemented in some buildings. They more concentrated on<br />
corrective maintenance rather than preventive maintenance. This argument is supported by other<br />
findings that building audit, response time, down time, request for repairs <strong>and</strong> quality workmanship;<br />
the benchmarks for operational processes improvement were also not implemented. A sound planned<br />
maintenance relies on comprehensive data collection through building audit.<br />
6. RECOMMENDATION<br />
A systems approach for IBT can be used to integrate decision support <strong>and</strong> to structure the process<br />
involving many stakeholders. The implementation of this approach is not simple since it will take much<br />
effort to break down closed thinking patterns <strong>and</strong> working cultures as well as to introduce new roles in<br />
the collaboration. In order to do so, we firstly need to underst<strong>and</strong> the real concept of IBT for<br />
sustainable FM. The model for IBT development process can be used to define the scope of its<br />
development. For example, at the building owner level, IBT development is aimed at elaborating<br />
strategies which reflect the building image for sustainable FM in high rise building. IBT development<br />
for FM of buildings is in direct relation with implementation for product development, for instance<br />
sustainable building maintenance quality in the high rise building. In setting-up strategies for building<br />
maintenance, one should take into account the current high rise building, such as the quality of design<br />
<strong>and</strong> engineering as well as the consequences of the applied techniques <strong>and</strong> materials of IBT for the<br />
future implementation of the building.<br />
It is recommended to follow the above discussions for further in-depth investigation by looking into the<br />
following objectives:<br />
� define <strong>and</strong> identify the basic terms in the IBT operation processes;<br />
� develop the system of IBT;<br />
� underst<strong>and</strong> the objective <strong>and</strong> justification of planned maintenance <strong>and</strong> unplanned<br />
maintenance for IBT;<br />
� identify the list of the priority for planned maintenance <strong>and</strong> unplanned maintenance operation<br />
in the IBT system;<br />
� identify the categories <strong>and</strong> problems of maintenance strategy challenges;<br />
� identify the categories of impacts on building maintenance operation processes due to FM <strong>and</strong><br />
strategic management;<br />
� improvement of maintenance operation processes through building performance management<br />
<strong>and</strong> building audit;<br />
� rationalize <strong>and</strong> improve the gaps between top management at strategic level <strong>and</strong> maintenance<br />
personnel at operational level.
241<br />
International <strong>Building</strong> & <strong>Infrastructure</strong> Technology Conference<br />
7-8 June 2011, Vistana Hotel, Penang, Malaysia<br />
To provide evaluation <strong>and</strong> feedback on the performance of IBT with respect to conventional building<br />
projects, two methods of evaluation can be used together with an analysis of design <strong>and</strong> construction<br />
options.<br />
6.1 ECONOMICAL ASPECTS<br />
The Life Cycle Costing (LCC) analysis is a method used to assess design alternatives considering all<br />
the significant costs of ownership. The ultimate objective of LCC is the determination of optimum<br />
design decisions following the evaluation of all viable design alternatives. The LCC process can be<br />
applied to a total building or to any building components. It generally includes the following steps:<br />
� Choose design alternatives for cost studies.<br />
� Determine elements for each option to be studied.<br />
� Establish capital cost <strong>and</strong> cost-in-use for each alternative.<br />
� Convert cash flow for each option to a common time basis for rational comparison using<br />
discounting techniques.<br />
� Select final design solution with consideration of function, quality etc.<br />
Single building systems apply those LCC components related to capital cost, maintenance cost,<br />
operating cost <strong>and</strong> demolition cost. In addition to cost components, another critical aspect of LCC is<br />
the determination of evaluation period over which the building or component is expected to operate.<br />
For the purpose of evaluation, the following operation periods are suggested:<br />
� The shell, skin, <strong>and</strong> structure are designed to last for at least 50 years.<br />
� The services, the primary mechanical <strong>and</strong> electrical systems have a lifespan of usually no<br />
more than 15 years.<br />
� Ceilings, partitions, furniture <strong>and</strong> finishes, which constitute the fitting-out to accommodate<br />
a particular division or tenant, are often cleared away within five to seven years.<br />
6.2. TECHNICAL ASPECTS<br />
Technically, it was decided that the proposed system development must incorporate three key<br />
features:<br />
� Ability to conduct consultation processes of IBT decision making during project conception<br />
<strong>and</strong> design.<br />
� Ability to perform basic life cycle cost information <strong>and</strong> to provide comparisons.<br />
� Ability to assess the level of building intelligence based on user options <strong>and</strong> indicates<br />
areas of concerns <strong>and</strong> possible improvement.<br />
� Ability to present alternatives to users, provide evaluations <strong>and</strong> make recommendations of<br />
decisions.<br />
With the novice nature <strong>and</strong> vast body of knowledge to be accessed in these types of projects, it has<br />
been decided that a prototype system should be developed in a controlled domain of IBT applications.<br />
At the same time, this area of application must also be practical so that the research results can be<br />
readily verified <strong>and</strong> used by the industry.<br />
Therefore, to cope with environmental, technological <strong>and</strong> organizational changes, building<br />
management have devoted much effort to those building services that have shorter lifespan. New<br />
innovations <strong>and</strong> development in energy saving <strong>and</strong> automatic lighting <strong>and</strong> air conditioning controls,<br />
cctv, alarm are to name just a few. However, the major asset of an IBT lies within its ability to learn<br />
<strong>and</strong> adapt. Hence, the development of new technologies in association with building management <strong>and</strong><br />
operation is given high priority.<br />
7. CONCLUSIONS<br />
IBTs are set to play a major part in the future high rise building development. This has been<br />
demonstrated by the changing business requirement <strong>and</strong> the subsequent adoption of intelligent<br />
buildings by major corporate clients as building users/tenants. However, the application of IBT is<br />
lagging behind their invention <strong>and</strong> development. There has been inadequate support to the
242<br />
International <strong>Building</strong> & <strong>Infrastructure</strong> Technology Conference<br />
7-8 June 2011, Vistana Hotel, Penang, Malaysia<br />
dissemination of information <strong>and</strong> particularly the decision support at the conceptual design stage of<br />
building development. The objective of the paper is to raise awareness of the importance of<br />
maintaining a comprehensive underst<strong>and</strong>ing of IBT implementations. The on-going system<br />
development introduced here attempts to fill in the gap between increasing dem<strong>and</strong> <strong>and</strong> the lack of<br />
tools in tackling the complex issues of selecting the most appropriate design alternatives, when clients<br />
<strong>and</strong> consultants work with other construction professionals for IBT applications.<br />
ACKNOWLEDGEMENT<br />
Thanks are due to building owners, FM personnel, engineers, contractors, tenants <strong>and</strong> occupants of<br />
every building for their assistance in this study.<br />
REFERENCES<br />
Arditi, D., & Nawakorawit, M. (1999). Issues in building maintenance: property manager’s perspective.<br />
Journal of Architectural Engineering 117–132, December 1999.<br />
Barrett, P. (1995). Facilities Management: Towards Better Practice. Oxford, UK: Blackwell Science.<br />
British St<strong>and</strong>ard Institution. BS 8210: 1986, British St<strong>and</strong>ard Guide to <strong>Building</strong> Maintenance<br />
Management<br />
British St<strong>and</strong>ard Institution. BS3811:1993, Glossary of terms used in terotechnology.<br />
Burian B. (1989). Policy Process Framework: A <strong>Systems</strong> Approach to Policy Development, in: Journal<br />
of Allied Health, vol. 18(1)<br />
Chanter, B. <strong>and</strong> Swallow, P. (1996). Maintenance Organisation. <strong>Building</strong> Maintenance Management.<br />
London: Blackwell Science.<br />
Collins, R. (ed.) (1993). Organization Effective Management. New Zeal<strong>and</strong>: CCCH International .<br />
De Greene, K.B. (1993). A <strong>Systems</strong>-Based Approach to Policymaking, New York: Springer-Verlag<br />
Drejer, A. (2004). Back to basics <strong>and</strong> beyond, strategic management – An area where practice <strong>and</strong><br />
theory are poorly related. Management Decision 42 (3/4): 508–520.<br />
Heylighen, F. (1998). Basic Concepts of the <strong>Systems</strong> Approach, in: F. Heylighen, C. Joslyn <strong>and</strong> V.<br />
Turchin (eds.) Principia Cybernetica Web, URL: http://cleamc11.vub.ac.be/REFERPCP.html<br />
Horner, R. M. W., El-Haram, M. A. <strong>and</strong> Munns, A. K. (1997). <strong>Building</strong> maintenance strategy: A new<br />
management approach. Journal of Quality in Maintenance Engineering 3 (4): 273–280.<br />
Langford , D. A. <strong>and</strong> Male, S. P. (1991). Strategic Management in Construction. UK: Gower<br />
Publishing.<br />
Lasher, W. R. (2002). Strategic Thinking for Smaller Business <strong>and</strong> Division. London: Blackwell<br />
Science.<br />
Lee, H. Y. H. <strong>and</strong> Scott, D. (2008). Identification of main aspects in the management of building<br />
maintenance operation processes. ‘Surveyors Times’, Hong Kong Institute of Surveyors 17 (6): 37–41.<br />
Lee, R. (1987). <strong>Building</strong> Maintenance Management. London: William Collins Sons.<br />
Seeley, I. H. (1976). <strong>Building</strong> Maintenance. London: Macmillan.<br />
Simon, H.A. (1960). The Science of Management Decision, Englewood-Cliffs: Prentice-Hall<br />
Spedding, A. (1987). <strong>Building</strong> Maintenance Economics <strong>and</strong> Management London: E. & F. N. Spon .<br />
Stewart, J. & Ayres, R. (2001). <strong>Systems</strong> theory <strong>and</strong> policy practice: An exploration, in: Policy Sciences,<br />
vol. 34<br />
Wordsworth, Paul (2001). Lee’s <strong>Building</strong> Maintenance Management. 4th edition. Blackwell Science.
T151<br />
243<br />
International <strong>Building</strong> & <strong>Infrastructure</strong> Technology Conference<br />
7-8 June 2011, Vistana Hotel, Penang, Malaysia<br />
A STUDY OF THE HEALTH AND SAFETY CIRCUMSTANCES OF SHOP<br />
APARTMENT AND APARTMENT BUILDINGS IN KLANG VALLEY, MALAYSIA<br />
Mohamad Ridzuan Yahya<br />
Kulliyyah of Architecture <strong>and</strong> Environmental Design, International Islamic University<br />
Malaysia, 50728 Kuala Lumpur.<br />
moham643@gmail.com<br />
ABSTRACT: Residential stratified property is now becoming a high-density built environment poses<br />
challenges of living style among the urban space in Malaysia which is currently facing serious<br />
problems with the health <strong>and</strong> safety of particular building stock. To examine the significance of the<br />
high-density problem, this study aims to survey the health <strong>and</strong> safety performance of shop-apartment<br />
<strong>and</strong> apartment buildings in a compactly inhabited urban, using a basic assessment method. An<br />
assessment method based on a hierarchy of building performance indicators concerning the quality of<br />
five attributes: (i) architectural design, (ii) building services design, (iii) the surrounding environment,<br />
(iv) operation <strong>and</strong> maintenance, <strong>and</strong> (v) facilities management approaches was developed. Nine shop<br />
apartment buildings <strong>and</strong> eight apartment buildings were r<strong>and</strong>omly selected in Klang Valley, Malaysia<br />
<strong>and</strong> assessed through site inspections, desk searches, <strong>and</strong> interviewed facilities management<br />
personnel, management corporation personnel, home-owners as well as tenants. A performance an<br />
analysis was conducted to examine <strong>and</strong> compare the overall health <strong>and</strong> safety performance of the<br />
buildings. The results had shown that there were significant variations in health <strong>and</strong> safety conditions<br />
across buildings, although they are situated within a single locality. Most of the problems were<br />
attributed to differences in building management systems rather than building design. Enhancing<br />
strategic management approaches (e.g. a comprehensive planned maintenance) appears to be the<br />
most critical factor that underperformers should consider in order to improve the occupants’ quality of<br />
life.<br />
Keywords: health, safety, building performance indicator, strategic management<br />
1. INTRODUCTION<br />
Currently, shop-apartment <strong>and</strong> apartment stratified buildings are becoming accepted in Malaysia<br />
especially among metropolitan citizens. One of the reasons they prefer to dwell in the particular<br />
buildings is the facilities provided in the building <strong>and</strong> its surrounding. The FM is the responsible party<br />
to manage all the facilities in the building. Shop-apartment stratified building is a unique building <strong>and</strong> it<br />
differs from l<strong>and</strong>ed building, such as factories <strong>and</strong> terrace houses. Its uniqueness presents itself<br />
during the management era after the buildings have been occupied, where facilities management<br />
became an issue (Linariza <strong>and</strong> Ashok, 2003). To h<strong>and</strong>le the issues pertaining to the management <strong>and</strong><br />
maintenance activities, STA was implemented in 1985, to accommodate the insufficiency of the<br />
National L<strong>and</strong> Code that was ineffective in h<strong>and</strong>ling the issues that arose in stratified building types<br />
(Tiun, 2006). According to STA, the FM is accountable for all the management <strong>and</strong> maintenance<br />
aspects of the building <strong>and</strong> common facilities in the building (Teo, 1993; Jamila, 1994). Unfortunately<br />
most of the stratified buildings found were not effectively managed. Owners complained through the<br />
mass media <strong>and</strong> the issues were always about health <strong>and</strong> safety as well as disputes between FM <strong>and</strong><br />
home-owners. Referring to Liias (1998), Jamila (1994), Malaysia Government (1999), Sapian (2003),<br />
Tiun (2006) <strong>and</strong> Eddy (2004a) on the management side, the most challenging issues faced by them in<br />
managing the stratified buildings were health <strong>and</strong> safety aspect which related to FM activities. These<br />
issues led to the management gap in managing facilities of shop-apartment stratified building. The<br />
management gap occurred when the expected services by the owners cannot be delivered by the FM.<br />
The owners were paying on a monthly basis <strong>and</strong> expected the facility management to be effective.<br />
Under STA, there is a legal provision for the FM to engage the services of a Management Agent (MA)<br />
as the party responsible for running the facility management activities. In practice, most FM functions<br />
in that way because they do not have the expertise to run <strong>and</strong> maintain the high rise building. If the FM<br />
fails to function well as stipulated in STA, the owners of the particular building have the right to<br />
summon the said FM. Therefore in order to avoid this case, the FM normally engages a Management<br />
Agent in order to transfer their liability towards the building. Even so, the management gap continued
244<br />
International <strong>Building</strong> & <strong>Infrastructure</strong> Technology Conference<br />
7-8 June 2011, Vistana Hotel, Penang, Malaysia<br />
to exist as referred to the on-going issues reported in mass media (Tiun, 2006). Owners continued to<br />
complain about the health <strong>and</strong> safety in the stratified residential buildings as well as the responsibility<br />
of FM in ensuring effective FM.<br />
2. RESEARCH OBJECTIVE<br />
Since health <strong>and</strong> safety are among the most problematic issues in a high-density environment, this<br />
paper aims to survey the health <strong>and</strong> safety performance of shop apartment <strong>and</strong> apartment buildings in<br />
Malaysia using a simplified assessment scheme. Health <strong>and</strong> safety were chosen as research focus<br />
because they are the most fundamental aspects that a dwelling should fulfill, <strong>and</strong> yet they usually<br />
cannot be easily observed <strong>and</strong> evaluated by occupants <strong>and</strong> the public. Moreover, health <strong>and</strong> safety<br />
problems have a stronger spillover effect in a high-density setting than a low-density one a building<br />
with poor health <strong>and</strong> safety conditions not only adversely affects its own occupants, but also<br />
jeopardizes those living <strong>and</strong> working in the neighborhood. The research, therefore, contributes to the<br />
revelation of hidden building information to the community, which, in turn, helps build a more<br />
sustainable residential area.<br />
3. RESEARCH METHOD<br />
Step 1 The background <strong>and</strong> objectives of the survey are first presented to<br />
the respondents.<br />
Step 2 The respondents are given brief instructions on how to complete the<br />
questionnaire, followed by an explanation of the key terms used.<br />
Step 3 The respondents fill in the questionnaire.<br />
Step 4 The questionnaire results are keyed into computer.<br />
Step 5 The ranking, weighting, <strong>and</strong> internal consistency ratios are<br />
calculated by using the Expert Choice 2000.<br />
Step 6 The analyzed results (i.e., the weighting <strong>and</strong> ranking of each<br />
attribute) are reported to respondents.<br />
Step 7 If the internal consistency ratio at any level is not smaller than 0.1,<br />
the computer package will locate the possible sources of<br />
inconsistency. The respondent is allowed to revise his/her<br />
responses.<br />
Step 8 The revision is keyed into a laptop computer. Instantaneous<br />
feedback on the internal consistency ratio is shown to each<br />
respondent.<br />
Step 9 If the internal consistency ratio is still not lower than 0.1, the<br />
respondent can follow Steps 7 <strong>and</strong> 8 again for further revision. The<br />
process will continue until the respondent rejects making any further<br />
changes.<br />
Figure 1. A flowchart showing the procedures of the BHHI <strong>and</strong> BSCI
245<br />
International <strong>Building</strong> & <strong>Infrastructure</strong> Technology Conference<br />
7-8 June 2011, Vistana Hotel, Penang, Malaysia<br />
Utilizing Ho et al. (2004) simple assessment framework, nine shop apartment stratified buildings <strong>and</strong><br />
eight apartment stratified buildings have been surveyed within a short period of time in Klang Valley<br />
area (refer to Figure 1). Research also extended Ho et al. (2004) health assessment framework to<br />
building safety. To make the survey results more comprehensible to the public, the research has<br />
translated technical performance details into indices (e.g. a health index <strong>and</strong> a safety index) for<br />
building classification. With these indices, the public <strong>and</strong> building owners can easily know the health<br />
<strong>and</strong> safety performance of buildings.<br />
The research method was organized which include site inspections, desk searches <strong>and</strong> interviewed<br />
facilities management personnel, management corporation personnel, home-owners as well as<br />
tenants.<br />
Two assessment schemes such as <strong>Building</strong> Health <strong>and</strong> Hygiene Index (BHHI) for health <strong>and</strong> <strong>Building</strong><br />
Safety <strong>and</strong> Conditions Index (BSCI) for safety were developed which based on the theoretical<br />
assessment framework introduced by Ho et al. (2004). There are 25 building factors for the BHHI <strong>and</strong><br />
19 building factors for the BSCI.<br />
The weightings of the building factors were assessed by two expert panels by using analytic hierarchy<br />
process (AHP) (Saaty, 1982).<br />
1. 15 experts were selected in building health who gave their perceptions of the relative<br />
importance of the building factors in the BHHI scheme.<br />
2. 13 experts were selected in building safety who provided the weightings of the building<br />
factors in the BSCI scheme.<br />
The respondents’ weightings of the different factors were extracted from a pair wise comparison of the<br />
relative importance of all pairs of factors at the same level as the hierarchy using the AHP computer<br />
package Expert Choice 2000.<br />
To compute the rating of each building factor in the assessment scheme, one would normally use a<br />
continuous scale ranging from the best practice (rating = 1) to the worst practice (rating = 0).<br />
3.1. ASSESSMENT PRINCIPLES<br />
The purpose of assessment is to quickly scan the health <strong>and</strong> safety conditions of shop apartment<br />
stratified buildings <strong>and</strong> apartment stratified buildings at the city level for building classification. The<br />
principles of the survey design based on the assessment model proposed by Ho et al. (2004), which is<br />
simple, <strong>and</strong> yet theoretically sound. This assessment model is in line with the ideology of the<br />
assessment model developed by Kim et al. (2005), which was designed for existing buildings with<br />
various degrees of quality.The principles of survey design are as follows.<br />
1. The items to be surveyed should be flexible enough to embrace most settings of shop<br />
apartment <strong>and</strong> apartment buildings (e.g. buildings of different designs).<br />
2. The items to be surveyed should be easily obtainable. Site inspections were confined to<br />
common areas <strong>and</strong> the external environment. These common areas are usually the most<br />
problematic in terms of management <strong>and</strong> maintenance due to the co-ownership nature of<br />
these areas (Chen <strong>and</strong> Webster, 2005).<br />
3. Only measurable <strong>and</strong> verifiable items would be assessed, while subjective items should<br />
be avoided as much as possible. If subjective judgment (e.g. hygienic condition <strong>and</strong> visual<br />
structural condition) was unavoidable, assessor would be given clear guidelines, with<br />
judgments referenced to sample photos of different grades or scores to ensure<br />
consistency.<br />
3.2. DEFINING HEALTH AND SAFETY<br />
Ho et al. (2004) pointed out some characteristics that a healthy building should have:<br />
1. A healthy building should not be too densely populated;<br />
2. Its window design <strong>and</strong> layout should facilitate natural ventilation <strong>and</strong> diffusion of daylight;
3. It should be isolated from noise <strong>and</strong> air pollution sources;<br />
246<br />
International <strong>Building</strong> & <strong>Infrastructure</strong> Technology Conference<br />
7-8 June 2011, Vistana Hotel, Penang, Malaysia<br />
4. Its water supply <strong>and</strong> waste systems should be appropriately installed, maintained, <strong>and</strong><br />
managed; <strong>and</strong><br />
5. Its environmental conditions should be clean <strong>and</strong> hygienic.<br />
Ho et al. (2004) was defined a safe building as one that minimizes the risk of physical injury <strong>and</strong> the<br />
death of occupants, such as evacuating them effectively should emergencies arise. Hence, a safe<br />
building should have the following characteristics:<br />
1. a structurally sound construction design <strong>and</strong> condition;<br />
2. properly installed <strong>and</strong> maintained electrical <strong>and</strong> gas supply systems;<br />
3. a design that facilitates the evacuation of occupants in case of emergency; <strong>and</strong><br />
4. a location that is less prone to flooding or l<strong>and</strong>slides.<br />
When building factors are qualitative in nature, a different method is used to deal with intermediate<br />
cases. A dichotomous building factor (e.g. presence or absence of a certain design), by definition, has<br />
no intermediate case, <strong>and</strong> its rating is either zero or one. For multinomial building factor, we will<br />
describe clearly what each rating means, as illustrated in Table 1.<br />
Grade Rating Description<br />
Table 1. Rating scale for drainage conditions<br />
Satisfactory 1 Good conditions without observable defects<br />
Above<br />
average<br />
0.75 Surface of the pipe or brackets slightly rusted<br />
Acceptable 0.5 Pipe partly rusted<br />
Deficient 0.25 About half of the length of pipe rusted; vegetation growth<br />
around the pipe<br />
Poor 0 Choking <strong>and</strong> unsanitary conditions; whole length of the pipe<br />
seriously rusted; dripping observed, or pipe broken<br />
3.3 DESK SEARCH<br />
Most of the information required for building design was acquired through desk searches which<br />
include:<br />
(a) taking measurements from building layout plans;<br />
� to get information on a building design, such as its window-to-floor area ratio, the size<br />
of its residential units, <strong>and</strong> the widths of its staircases.<br />
(b) searching for information on the web;<br />
� to find information like the air pollution index <strong>and</strong> other information such as population<br />
density.<br />
(c) analyzing street maps for items under external environment;<br />
� to give information for external environment factors, such as the distance of a building<br />
from the nearest fire station <strong>and</strong> green area.<br />
3.4 SITE INSPECTION<br />
Site inspection is important because the information from other sources does not often reflect the real<br />
situation of a building. Hoxley (2002) stressed that anything missed during the initial inspection of the<br />
exterior could be re-inspected relatively easily, but it may not be so easy to re-inspect the interior
247<br />
International <strong>Building</strong> & <strong>Infrastructure</strong> Technology Conference<br />
7-8 June 2011, Vistana Hotel, Penang, Malaysia<br />
when any problem is raised during the subsequent external inspection. All parameters to be measured<br />
or inspected on site were confined to:<br />
(a) common areas (e.g. podiums, lobbies, lifts, staircases, <strong>and</strong> corridors) where permission<br />
for access is given by owners or management agents,<br />
(b) the surrounding external environment.<br />
3.5 STRUCTURED INTERVIEW<br />
With the use of a preset questionnaire, interviews with facilities management personnel, management<br />
corporation personnel, home owners as well as tenants were conducted to collect this information. If<br />
necessary, the owner or management personnel was requested to provide documentary records (e.g.<br />
tenant survey records <strong>and</strong> monthly financial statements) for verification.<br />
4. RESULT AND DISCUSSION<br />
Table 2. <strong>Building</strong> factors assessed under the BHHI <strong>and</strong> BSCI, <strong>and</strong> their relative weightings<br />
BHHI<br />
Level 1 Level 2 Level 3<br />
Weight<br />
(%)<br />
Category Weight<br />
(%)<br />
<strong>Building</strong> factor Weight<br />
(%)<br />
Design 53.6 Architecture 18.5 Size 2.5<br />
<strong>Building</strong><br />
Services<br />
External<br />
Environment<br />
Management 46.4 Operations &<br />
maintenance<br />
Plan shape 3.5<br />
Master Bedroom 2.0<br />
Windows 5.7<br />
Noise reduction 3.4<br />
Open space 1.4<br />
19.3 Water supply 5.6<br />
Drainage 6.8<br />
Refuse disposal 4.7<br />
Lift 2.2<br />
15.8 Density 1.9<br />
Adjacent use 1.7<br />
Air quality 5.2<br />
Aural quality 2.6<br />
Visual<br />
obstruction<br />
1.6<br />
Thermal comfort 2.8<br />
27.1 Cleaning 5.1<br />
Pest control 3.1<br />
Refuse h<strong>and</strong>ling 4.6<br />
Drainage 4.6
BSCI<br />
Management<br />
approaches<br />
248<br />
International <strong>Building</strong> & <strong>Infrastructure</strong> Technology Conference<br />
7-8 June 2011, Vistana Hotel, Penang, Malaysia<br />
condition<br />
Unauthorized<br />
alteration<br />
4.0<br />
Water quality 5.7<br />
19.3 Owners’ duties 7.9<br />
Documentation 6.8<br />
Emergency<br />
preparedness<br />
Design 47.0 Architecture 22.1 Height <strong>and</strong><br />
disposition<br />
<strong>Building</strong><br />
services<br />
External<br />
environment<br />
Management 53.0 Operations &<br />
maintenance<br />
Management<br />
approaches<br />
4.6<br />
3.8<br />
Means of escape 9.3<br />
Means of access 6.3<br />
Amenities 2.7<br />
16.6 Fire service<br />
installations<br />
Electrical<br />
installations<br />
8.3<br />
4.3<br />
Fuel supply 4.0<br />
8.2 Proximity to<br />
special hazards<br />
Proximity to fire<br />
station<br />
33.5 Structural<br />
condition<br />
<strong>Building</strong> services<br />
condition<br />
Exit routes<br />
condition<br />
6.4<br />
1.8<br />
8.6<br />
5.3<br />
8.4<br />
Fire compartment 4.3<br />
Illegal<br />
appendages<br />
6.9<br />
19.5 Owners’ duties 4.3<br />
Documentation 3.5<br />
Emergency<br />
preparedness<br />
Financial<br />
arrangement<br />
7.8<br />
3.9
No. of <strong>Building</strong><br />
No. of <strong>Building</strong><br />
249<br />
International <strong>Building</strong> & <strong>Infrastructure</strong> Technology Conference<br />
7-8 June 2011, Vistana Hotel, Penang, Malaysia<br />
Figure 2. <strong>Building</strong> Health <strong>and</strong> Hygiene Indices (BHHI) of the sampled buildings<br />
Figure 3. <strong>Building</strong> Safety <strong>and</strong> Conditions Indices (BSCI) of the sampled buildings<br />
4.1 Overall results<br />
The raw data collected was converted into a set of performance indicators that represent the health<br />
<strong>and</strong> safety conditions of each building factor in Table 2. The analysis of the assessment results will<br />
contribute to the key factors that influence the variations in the health <strong>and</strong> safety performance of the<br />
shop apartment <strong>and</strong> apartment buildings.<br />
BH<br />
BS<br />
Equation 1(a)
250<br />
International <strong>Building</strong> & <strong>Infrastructure</strong> Technology Conference<br />
7-8 June 2011, Vistana Hotel, Penang, Malaysia<br />
Equation 1(b)<br />
The distributions of BHHI <strong>and</strong> BSCI after the application of Equation (1a) <strong>and</strong> Equation (1b) to each<br />
building are presented in Figure 2 <strong>and</strong> Figure 3, respectively. The median BHHI <strong>and</strong> BSCI scores<br />
were 42% <strong>and</strong> 58%, respectively. Specifically, the BHHI ranged from 26% to 65%, whereas the BSCI<br />
ranged from 33% to 68%. Since the indices are building-specific, the health <strong>and</strong> safety performance of<br />
every building, it can be compared to the others. The stakeholders can use these results to know<br />
whether a building outperforms or underperforms. Homebuyers as well as FM also can use the data to<br />
ascertain the performance of building before they make their decisions.<br />
4.2 Performance attribution<br />
As shown in Figure. 2 <strong>and</strong> Figure 3, buildings differ, at most, by 35% for the BHHI <strong>and</strong> 43% for the<br />
BSCI. A variance disintegration analysis was conducted to tell the relative significance of the first level<br />
factors (design <strong>and</strong> management) in affecting the dispersion of the BHHI <strong>and</strong> BSCI.<br />
By definition, the BHHI <strong>and</strong> BSCI are the weighted sums of the design index (DI) <strong>and</strong> the management<br />
index (MI), respectively. In other words:<br />
Equation 2(a)<br />
Equation 2(b)<br />
Figure 4. Contributions of design <strong>and</strong> management factors to variations in the BHHI <strong>and</strong> BSCI<br />
Figure 4 summarized the results in Venn diagrams. 82% of variations in BHHI are merely attributable<br />
to management factors, suggesting that management factors dominate design factors in differentiate<br />
healthy buildings from the relatively less healthy ones. Only 4% of variations due to their comovements<br />
were very low <strong>and</strong> insignificant. In BSCI, pure design factors contributed 18% to the total<br />
variation, while pure management factors contributed 45%. Similar to its health counterpart, pure<br />
management factors are more influential than pure design factors in affecting the variations in safety<br />
performance. In other words, most of the variations in building health <strong>and</strong> safety conditions were<br />
attributed to be difference in building management rather than building design. So, FM should improve<br />
health <strong>and</strong> safety performance by enhancing management. However, as opposed to the BHHI’s<br />
results, the co-movement of design <strong>and</strong> management factors occupies quite a significant share, being<br />
responsible for 37% of the variations in the BSCI. A probable rationale for such a strong co-movement<br />
is that design <strong>and</strong> management factors are determined by some ordinary factors, especially building<br />
age.<br />
5. CONCLUDING REMARKS<br />
This paper developed two simple <strong>and</strong> cost-effective assessment schemes to evaluate the health <strong>and</strong><br />
safety performance of stratified residential buildings in Malaysia. There were significant variations in<br />
health <strong>and</strong> safety circumstances across buildings, although they are placed in the same area.<br />
Neglecting <strong>and</strong> tolerating poor building health <strong>and</strong> safety conditions could now make a high-density<br />
society pay a higher price in the future. Most of the variations in building health <strong>and</strong> safety conditions<br />
were attributed to differences in building management systems rather than building designs.
251<br />
International <strong>Building</strong> & <strong>Infrastructure</strong> Technology Conference<br />
7-8 June 2011, Vistana Hotel, Penang, Malaysia<br />
Enhancing strategic management approaches (e.g. better delineation of home-owners’ rights <strong>and</strong><br />
duties) appears to be the first priority to building performance in order to improve their buildings <strong>and</strong><br />
living conditions.<br />
To encourage more sustainable buildings at the community level, the assessment results can be<br />
summarized into two simple <strong>and</strong> user-friendly performance indicators for public consumption, namely<br />
the BHHI <strong>and</strong> the BSCI. By publicizing these performance indices, the public would be better informed<br />
of the health <strong>and</strong> safety risks of different buildings so that building owners, FM as well tenants can<br />
make more responsible decisions in the future. It is envisaged that further research can be conducted<br />
to investigate the relationship between building performance <strong>and</strong> extraneous factors, such as building<br />
age, management structure, <strong>and</strong> scale of development.<br />
ACKNOWLEDGEMENT<br />
Thanks are due to facilities management personnel, management corporation personnel, building<br />
owners <strong>and</strong> tenants of every shop-apartment stratified building <strong>and</strong> apartment stratified buildings for<br />
their assistance in this study.<br />
REFERENCES<br />
Amaratunga, D. <strong>and</strong> Baldry, D. (2002) Moving from performance measurement to performance<br />
management. Facilities 20 (5/6): 217 – 223.<br />
Chen SCY, Webster CJ. (2005). Homeowners associations, collective action <strong>and</strong> the costs of private<br />
governance. Housing Studies 2005;20: 205–20.<br />
Eddy, C. L. L. (2004a). Affordable Housing Development: Coming Together For The Benefit of The<br />
Nation. The National Housing & Property Summit. 12-13 August 2004. Kuala Lumpur.<br />
HBA (2003). Recommendations on Stratified Property Presented To YB Dr Tan Kee Kwong, Deputy<br />
Minister of L<strong>and</strong> & Cooperative Development on 12 June 2003 during the ‘Mesyuarat Pendidikan<br />
Untuk Bangunan Bil. 3/2003’. House Buyers Association of Malaysia (HBA).<br />
Ho DCW, Leung HF, Wong SK, Cheung AKC, Lau SSY, Wong WS, (2004). Assessing the health <strong>and</strong><br />
hygiene performance of apartment buildings. Facilities 2004;22(3/4):58–69.<br />
Ho DCW, Yau Y. (2004). <strong>Building</strong> safety <strong>and</strong> condition index: benchmarking tool for maintenance<br />
managers. Proceedings of the CIB W70 facilities management <strong>and</strong> maintenance symposium 2004,<br />
Hong Kong, 7–8 December 2004. p. 49–155.<br />
Hoxley M. (2002) Condition inspections of residential property: a procedural framework. Structural<br />
Survey 2002;20(1):31–5.<br />
Jamila, H. (1994). Strata Title in Malaysia. Selangor: Pel<strong>and</strong>uk Publications (M) Sdn.Bhd.<br />
Kim SS, Yang IH, Yeo MS, Kim KW. (2005) Development of a housing performance evaluation model<br />
for multi-family residential buildings in Korea. <strong>Building</strong> <strong>and</strong> Environment 2005;40:1103–16.<br />
Liias, R. (1998). Housing Stock: The Facilities for <strong>Future</strong> Development. Journal of Facilities. Volume<br />
16 Number 11. pp. 288-294. MCB University Press.<br />
Linariza, H.; Ashok, V. (2003). Facility Management: An Introduction. Journal of The Malaysian<br />
Surveyor. 1st Quarter 2003 (38.1). pp. 13-19.<br />
Malaysia Government (1999). Housing In The New Millenium – Malaysian Perspective.<br />
Malaysia Government (2003d). P<strong>and</strong>uan Kehidupan Bersama Dalam Bangunan Bertingkat (Pra-<br />
Strata). Jilid 1. Jabatan Ketua Pengarah Tanah & Galian, Kementerian Sumber Asli & Alam Sekitar.<br />
Saaty TL. (1982).The analytical hierarchy process. New York: McGraw-Hill; 1982.<br />
Sapian, I. (2003). Pengurusan Penyenggaraan Bangunan & Kualiti Kehidupan Di Kondominium Di<br />
Malaysia. Seminar Pengurusan & Penyenggaraan Bangunan Ke-2, 22-23 Disember 2003, Kuala<br />
Lumpur.<br />
Teo, K. S. (terjemahan) (1993). Hak Milik Strata Di Malaysia. Kuala Lumpur: Dewan Bahasa &<br />
Pustaka.<br />
Tiun, L. T. (2006). Managing High-Rise Residential <strong>Building</strong> In Malaysia: Where Are We?. Persatuan<br />
Sains Sosial, Universiti Putra Malaysia. 8-10 Ogos 2006. Fakulti Ekologi, Universiti Putra Malaysia.
T152<br />
252<br />
International <strong>Building</strong> & <strong>Infrastructure</strong> Technology Conference<br />
7-8 June 2011, Vistana Hotel, Penang, Malaysia<br />
MAINTENANCE MANAGEMENT SYSTEM FOR INDUSTRIALIZED BUILDING<br />
SYSTEM<br />
Ng Ban Kiong 1 <strong>and</strong> Zainal Abidin bin Akasah 2<br />
1, 2 University Tun Hussein Onn Malaysia<br />
1 wanqiang0505@hotmail.com , 2 zainal59@uthm.edu.my<br />
ABSTRACT: With the aim to reduce the number of the unskilled foreign labor, government had<br />
encouraged our local contractor to use the Industrialized <strong>Building</strong> System (IBS). They are few type of<br />
IBS system in Malaysia <strong>and</strong> this included precast concrete frame, panel <strong>and</strong> box systems, steel<br />
formwork systems, steel frame systems, prefabricated timber systems <strong>and</strong> block work systems. But at<br />
the same time, when a building was built by the IBS system, the building also needed a system of<br />
technique maintenance of the building to prolong the building life. Hence, this paper will focus on the<br />
maintenance management system use for the building built by IBS. The objective of this paper is to<br />
identify building maintenance problems in IBS, to explain the development of maintenance<br />
management system for IBS. As such, the building need to be identified before the research start. The<br />
defect <strong>and</strong> the problem face by the owner of the IBS building will be collect <strong>and</strong> note down in a check<br />
list. This will be done by questionnaire <strong>and</strong> distributed to all Malaysia’s government IBS’s building<br />
management office. Interview session <strong>and</strong> site visit also will be done with the contractor <strong>and</strong> the<br />
building owner to underst<strong>and</strong> the problem that facing by the IBS building that has been chosen. To<br />
prolong the building life cycle <strong>and</strong> prevent the wasting of the money, a systematic of maintenance<br />
management system (technique) used for Industrialized <strong>Building</strong> System need to be developed<br />
Keywords: industrialized building system (ibs), maintenance management system, life cycle<br />
1. BACKGROUND OF STUDY<br />
In Malaysia, construction sector play an important role in generic country economy. Over the year in<br />
Malaysia, 3% to 5 % of the national Gross Domestic Product(GDP) for the pass 20 years was<br />
contributed by the construction sector. Apparently this statistic has obvious shows that the<br />
construction was one of the important major sector that stimulate our country’s economy. A boom<br />
construction activities can show that country’s economy was in brisk condition while the sluggish<br />
construction activities show that the nation’s economy was under depression condition. Thus, the<br />
construction sector also can serve as an important barometer indicating our country economy<br />
condition.<br />
Industrialized <strong>Building</strong> System(IBS) generally can be known as all building components which are<br />
mass produced either in factory or at site factory. All the mass component of the building will be<br />
design accordingly to specifications with st<strong>and</strong>ardize shapes <strong>and</strong> dimensions.<br />
Eventually, when all the building component has been successfully produced, all the component will<br />
be transported to the construction site to be rearrange with certain st<strong>and</strong>ard to form a building(Lim,<br />
2006).Construction industry in Malaysia generally comprise many process <strong>and</strong> this included many<br />
parties <strong>and</strong> different stages of work. Involvement of various parties from different sectors can<br />
effectively ensure the high efficiency of the construction that will be carried out. Only with the high<br />
quality of managerial <strong>and</strong> organizational performance with the effective co-ordination through good<br />
teamwork from different parties will create an efficiency <strong>and</strong> success of construction development <strong>and</strong><br />
activities. Thus, every team member play an effectives roles in their work to ensure the development<br />
of the construction industry will be achieved.(.Tay,2006)<br />
The concept of using Industrialized <strong>Building</strong> System (IBS) in Malaysia getting started after the ministry<br />
of housing <strong>and</strong> local government of Malaysia visiting several European country. This became the<br />
significant starting point for the IBS in Malaysia although IBS was not so popular at that era. <strong>Our</strong>
253<br />
International <strong>Building</strong> & <strong>Infrastructure</strong> Technology Conference<br />
7-8 June 2011, Vistana Hotel, Penang, Malaysia<br />
Malaysia construction field achieve another new mile stone when the pioneer of the project Pekeliling<br />
Flat at Kuala Lumpur has been successfully built within 27 months which utilized the panel pre-cast<br />
concrete wall <strong>and</strong> plank slabs in the project.<br />
Nowadays, there are lots of local IBS manufacture <strong>and</strong> yet were mushrooming. Most of the IBS<br />
system used in Malaysia are large panel systems, steel frame, precast frame <strong>and</strong> formwork system.<br />
All this system has been largely used for private residential project in Malaysia which included projects<br />
in Shah Alam, Wangsa Maju <strong>and</strong> P<strong>and</strong>an, Dua Residency, KL, Taman Mount Austin <strong>and</strong> Tongkang<br />
Pecah, Johor (CIDB, 2006).<br />
In this 21 st century, IBS is not new to the construction industry. This method had effectively can cost<br />
saving <strong>and</strong> improve the quality through the reduce of the labor intensity <strong>and</strong> construction<br />
st<strong>and</strong>ardization. Besides, it minimized the wastage, less site material, more cleaner <strong>and</strong> neater<br />
environment, quality controlled, <strong>and</strong> reduce the total construction costs. Successful implementation<br />
IBS in the world are Sesikui Home(Japan), Living Solution(United Kingdom),Open House(Sweden)<br />
<strong>and</strong> Wenswonen (Netherl<strong>and</strong>s).<br />
IBS should approach to the maintenance management. Maintenance management is a system that<br />
orderly <strong>and</strong> systematically that approach to the planning, organizing, monitoring <strong>and</strong> evaluating<br />
maintenance activities <strong>and</strong> their costs. Thus, a good maintenance management system could prevent<br />
health <strong>and</strong> safety problems <strong>and</strong> environmental damage, yield longer asset life with fewer breakdown<br />
<strong>and</strong> result in lower operating costs <strong>and</strong> a higher quality of life.<br />
2. STATEMENT OF THE PROBLEM<br />
In the 1960’s, IBS was often misinterpreted with negative meaning. Normally, IBS building associated<br />
with pre-fabricated mass construction method, low quality buildings, leakages, ab<strong>and</strong>oned projects,<br />
unpleasant architectural appearances <strong>and</strong> other drawbacks. Public have bad impression about the<br />
precast concrete due to the poor architectural design for the old pre-fabricated buildings. The example<br />
of two early pre-fabricated flats were constructed was Pekeliling Flats in Kuala Lumpur <strong>and</strong> Taman<br />
Tun Sardon,Gelugor,Penang. The very basic design for the Taman Tun Sardon by British Research<br />
Estalishment,UK was create lots of problem. The lack of design such as the need for wet toilets <strong>and</strong><br />
bathrooms was leads to problems of leakage Futher more, many low cost housings are not<br />
maintained properly <strong>and</strong> this give the negative vision <strong>and</strong> poor image to the IBS building. (Rahman<br />
<strong>and</strong> Omar, 2006).<br />
However, lack of knowledge in structural analysis <strong>and</strong> design of pre-fabricated components also<br />
contribute to the problem of the implementation IBS system. The most common problem are the<br />
connection between the beam to column <strong>and</strong> column to base. The lack of knowledge of design could<br />
cause the poor connection at site work. The poor connection may leads the issued of comfort <strong>and</strong><br />
safety. When the steelwork structures are design as the conventional reinforced concrete structural<br />
system, this concept result exposed steel beams <strong>and</strong> columns. Unfortunately, this can comes out of<br />
many problem such as leakage. The rain water was easily seep into the building joint between the wall<br />
<strong>and</strong> steel beam. On the other h<strong>and</strong>, the dampness leads to corrosion to the lighting system <strong>and</strong> the<br />
beam (Rahman <strong>and</strong> Omar, 2006).<br />
3. IBS DEFINATION<br />
Actually there are various definition of the Industrialized <strong>Building</strong> System(IBS) in Malaysia. This<br />
indicated that no agreed definition of the IBS since there have few type of definition from different<br />
author (Mohamad Rofzdi, 2009). IBS can be consider as the building built by using pre-fabricated<br />
components. The component was systematically manufactured either by using machine or other forms<br />
of mechanical equipment. The component was manufacturing off site <strong>and</strong> delivered to construction<br />
sites for assembly <strong>and</strong> erection (Rahman <strong>and</strong> Omar, 2006).<br />
Chung <strong>and</strong> Kadir (2007) has defined that the IBS is a mass production of building components either<br />
in factory or at site. It depends on the specification of the st<strong>and</strong>ard shape <strong>and</strong> dimension to transport<br />
to the site to be re-arranged according to certain st<strong>and</strong>ard to form a building. Construction Industry<br />
Development (2003) defined IBS as a construction technique included components which are<br />
manufactured in a controlled environment either on or off site, transported, positioned <strong>and</strong> set up into<br />
a structure with minimal additional site works.
254<br />
International <strong>Building</strong> & <strong>Infrastructure</strong> Technology Conference<br />
7-8 June 2011, Vistana Hotel, Penang, Malaysia<br />
Warswaki,1999 defined industrialized as an investment in equipment, facilities <strong>and</strong> technology with the<br />
aim to maximizing the output <strong>and</strong> minimizing the labour resources <strong>and</strong> improving the quality. For the<br />
building system, Warswaki defined as a set of interconnected element that joint together to enable the<br />
designated performance of a building.<br />
Esa <strong>and</strong> Nuruddin,1998 stated that IBS is a kind of manufacturing process in order to minimize<br />
resources wastage <strong>and</strong> enhance value for end users through continuous beginning from utilizing<br />
craftsman for every aspects of construction to a system that make use of manufacturing production.<br />
3.1 HISTORY IBS IN MALAYSIA<br />
Since 1960’s, IBS was starting used in Malaysia after the ministry of housing <strong>and</strong> local government of<br />
Malaysia inspired the idea from the visiting at several European countries. The pioneer project of<br />
building using IBS was Pekeliling Flat at Kuala Lumpur <strong>and</strong> the Rifle Range Flat at Penang. This two<br />
project significantly had cause the Malaysia construction field achieved another new milestone in the<br />
era of 1960’s when IBS which also known as modern method construction had been recognized in<br />
Malaysia. Since then, many construction after the year using precast wall panel system. This method<br />
became popular when most of the low cost high rise residential building using IBS following the years<br />
after 1960’s. But unfortunately some of the technique that had been utilized in Malaysia from over sea<br />
did not suitably use in Malaysia’s weather climate <strong>and</strong> social practices. In the early of 80’s, structural<br />
steel component getting using in high rise building in Kuala Lumpur (CREAM AND CIDB, 2010).<br />
The 36-storey Dayabumi complex was successfully completed in 1984 by a Japan company name<br />
Takenaka Corporation. In the period of 1981 to 1993, Perbadanan Kemajuan Negeri Selangor (PKNS)<br />
adopted precast concrete technology from Praton Haus International based on Germany to build low<br />
cost house <strong>and</strong> high cost bungalow for the new townships in Selangor (Zuhairi Abd Hamid, 2007). The<br />
evolution of the construction in Malaysia had encourage many local company involved in IBS<br />
construction. To improve the IBS technique, some local company had collaborate with the foreign<br />
company from Japan, Australia <strong>and</strong> US to develop a quality technology in IBS. There are various of<br />
project utilized IBS in this modern era <strong>and</strong> this including Bukit Jalil Sport Complex, Kuala Lumpur<br />
Convention Centre, Lightweight Railway Train, KL tower, KLIA, <strong>and</strong> Petronas Twin Tower (Zuhairi Abd<br />
Hamid, 2007).<br />
3.2 CLASSIFICATON OF IBS<br />
Generally, there are four categories in construction method <strong>and</strong> this including conventional method,<br />
cast in situ, composite method <strong>and</strong> fully prefabricated. Basically cast in situ, composite method <strong>and</strong><br />
fully prefabricated was classified as non conventional method. While for the structural aspects, IBS<br />
can be divided into five major types:<br />
a) Precast Concrete Framing,Panel <strong>and</strong> Box System<br />
-this including PC columns, beams, slabs, 3D-components(balconies, staircase, toilet, lift<br />
chambers, box girders, etc), (MIIE, 2009)<br />
b) Steel Formwork System<br />
-Tunnels forms, beams <strong>and</strong> colums moulding forms, permanent steel formworks(metal<br />
decks), etc (MIIE, 2009).<br />
c) Steel Frame <strong>Systems</strong><br />
-Steel beams <strong>and</strong> columns, portal frames, roof trusses, etc (MIIE, 2009)<br />
d) Prefabricated Timber Frame <strong>Systems</strong><br />
-Timber frames, pre-fab timber, roof trusses, etc (MIIE, 2009).<br />
e) Blockwork <strong>Systems</strong><br />
-Interlocking concrete masonry unit(CMU), lightweight concrete blocks, etc (MIIE, 2009)
3.3 PERCENTAGE OF FOREIGN LABOR BASED ON STATES<br />
255<br />
International <strong>Building</strong> & <strong>Infrastructure</strong> Technology Conference<br />
7-8 June 2011, Vistana Hotel, Penang, Malaysia<br />
States in Malaysia Average %<br />
Selangor 97<br />
Wilayah Persekutuan Kuala Lumpur 95<br />
Melaka 86<br />
Pahang 76<br />
Johor 73<br />
Negeri Sembilan 62<br />
Pulau Pinang 52<br />
Sabah 48<br />
Perak 48<br />
Kedah 36<br />
Terengganu 24<br />
Kelantan 17<br />
Perlis 13<br />
Sarawak 6<br />
Average per state 52<br />
Source: Malaysia International IBS Exhibition 2009<br />
3.4 REGISTRATION OF IBS MANUFACTURER AND PRODUCTS IN “ORANGE<br />
BOOK”<br />
NO TYPES OF IBS MANUFACTURER PRODUCT<br />
1 Precast Concrete System 39 249<br />
2 Formwork System 23 29<br />
3 Steel Frame System 27 45<br />
4 Timber Frame System 21 21<br />
5 Blockwork System 9 11<br />
Total 119 355<br />
Source: Malaysia International IBS Exhibition 2009<br />
3.5 REGISTERED IBS CONTRACTOR(ACTIVE) IN MALAYSIA BY CIDB GRADE<br />
(2007)<br />
GRED NUMBERS<br />
G7 334<br />
G6 52<br />
G5 83<br />
G4 42<br />
G3 191<br />
G2 76<br />
G1 71<br />
TOTAL 849<br />
Source: Construction Industry Development Board(CIDB) Malaysia<br />
4.0 DEFINATION MAINTENANCE<br />
Maintenance can be defined as the combination of all the technical <strong>and</strong> administrative action which<br />
intended to retain or restore it to a state it can perform its required function according to BS8210.<br />
BS3811:1964 had defined maintenance as a combination of any actions that carried out to restore,<br />
retain <strong>and</strong> acceptable condition or st<strong>and</strong>ard. This combination of any action had included combination<br />
of many parties that involved in maintenance work which were contractor, worker, management <strong>and</strong><br />
other parties. Retain <strong>and</strong> restore will well defined as there are two process which work are carried out<br />
in anticipation of failure <strong>and</strong> work carried out after failure. While word acceptable condition st<strong>and</strong> for<br />
the person which receiving benefit from the acceptability to the person paying. Each person which
256<br />
International <strong>Building</strong> & <strong>Infrastructure</strong> Technology Conference<br />
7-8 June 2011, Vistana Hotel, Penang, Malaysia<br />
paid for the work has it own acceptable condition based on the building, building life budget <strong>and</strong><br />
workers.<br />
From the Oxford Advance Learners’s English Dictionary defined maintenance as the action of<br />
maintaining something or the state of being maintained. While Majdi(2002) has described<br />
maintenance as methods <strong>and</strong> techniques used to restore a specified level of service <strong>and</strong> to prolong<br />
life by slowing its deterioration rate.(Mohamed, 2010)<br />
While according to Wordworth(2001), maintenance is the action referred to the initiation, organization,<br />
<strong>and</strong> implementation of series of works. There are two processes of works that envisage, retaining <strong>and</strong><br />
restoring. Retaining is more to the work carried out in anticipating of failure <strong>and</strong> restoring is the work<br />
carried out after the failure. For the further explanation, the concept of maintenance acceptable<br />
st<strong>and</strong>ard is referred to the person who is paying the work to the person receiving benefit or to some<br />
outside body with the responsibility for enforcing minimum st<strong>and</strong>ards.(Hashim,2007)<br />
4.1 IMPORTANT OF MAINTENANCE<br />
Why maintenance was so important? Basically building <strong>and</strong> structure will last longer with proper <strong>and</strong><br />
continuous maintenance. If a structure or building had a poor maintenance, this will resulted the need<br />
for reparation, renovation or restoration. Hence, this will increase the cost at the end of life cycle of the<br />
building or structure. The value of the maintenance is discussed from the aspect of:<br />
i) Time<br />
If compared the time needed for reparation <strong>and</strong> renovation, maintenance was totally less time<br />
then the reparation <strong>and</strong> renovation but can produce a better quality result. On the other h<strong>and</strong>,<br />
work qualities for maintenance are also relatively lesser compare to reparation <strong>and</strong> renovation.<br />
ii) Cost<br />
Cost required for maintenance are lesser then cost required for repair or renovation. When the<br />
maintenance work is carry on, the specific structure can still be running <strong>and</strong> this saving cost<br />
from the economic perspective.<br />
iii) Structure value <strong>and</strong> performance<br />
Structure will have high value <strong>and</strong> good performance during its service life if maintenance<br />
works are done according to schedule <strong>and</strong> plan. The unproper maintenance will cause the<br />
structure will not be able to provide services as its maximum performance all the<br />
time.(Yacob,2006)<br />
4.2 FACTOR OF GOOD AND EFFECTIVE MAINTENANCE MANAGEMENT<br />
Maintenance management consists of managing, planning <strong>and</strong> also controlling. In spite of that. There<br />
are four supporting factors that need to be considered in making the maintenance management more<br />
effective <strong>and</strong> efficient when it is executed.<br />
i) The Organization structure <strong>and</strong> general responsibilities of maintenance management.<br />
ii) The maintenance policies <strong>and</strong> st<strong>and</strong>ard for maintenance.<br />
iii) The maintenance management planning <strong>and</strong> scheduling<br />
iv) The maintenance management for budgeting <strong>and</strong> cost controlling.(Yacob,2006)<br />
5.0 METHODOLOGY<br />
5.1 INTRODUCTION<br />
First of all, this research will start with identifying research problem which cover significance, objective<br />
<strong>and</strong> scope of study followed by exploratory research of the literature. All the information is gather from<br />
two kind of sources which firstly is journals, books, internet <strong>and</strong> reports while secondly is through<br />
preliminary interview to consultants, contractors, architectural firms, IBS manufacturer, CIDB <strong>and</strong><br />
CREAM <strong>and</strong> site visit . Questionnaire will develop after all the information that related with the<br />
research will obtain from the potential respondents. All the questionnaire which was successfully<br />
develop will distribute to the potential respondents with either by post, h<strong>and</strong> or by email
5.2 PROCESS OF METHODOLOGY<br />
257<br />
International <strong>Building</strong> & <strong>Infrastructure</strong> Technology Conference<br />
7-8 June 2011, Vistana Hotel, Penang, Malaysia<br />
Process methodology need to arrange systematically to achieve the aim of the research study. This<br />
process started from the topic selection followed by identifying issues, objectives, scopes, data, data<br />
collection, data analysis, conclusion <strong>and</strong> recommendation <strong>and</strong> finally the thesis write up.<br />
To achieve the objective of the research, the following steps were carried out such as:<br />
1. A preliminary research on the maintenance management system for industrialized building<br />
system through the study of the literature.<br />
2. Site visit, interview <strong>and</strong> discussion session with the contractors, engineers, architects, IBS<br />
manufacturer, CIDB <strong>and</strong> CREAM. This will help a lot to identify the datas <strong>and</strong> to underst<strong>and</strong><br />
the building maintenance.<br />
3. Formulated questionnaires after the preliminary interviews <strong>and</strong> literature review was obtained.<br />
4. The pilot study need to be conducted before distributed to the respondent. This pilot study are<br />
very important to:<br />
� Test the adequacy of the questions for each question.<br />
� Test the efficiency of the sampling.<br />
5. After the pilot study has been achieved, the questionnaire was distributed by post, email or by<br />
h<strong>and</strong> to the potential respondent.<br />
6. The questionnaire will be collected after the feedback from the respondent but the<br />
uncompleted questionnaire will exclude.<br />
7. The questionnaire will be examined weighted overall factors that affect IBS building<br />
maintenance.
5.3 METHODOLOGY FLOW CHART<br />
Site Visit IBS<br />
Project<br />
NO<br />
Identify Research<br />
Problem<br />
Literature Review<br />
Interview With Engineers, Architects,<br />
Contractors, IBS Manufacturer, CIDB <strong>and</strong><br />
CREAM<br />
Questionnaire<br />
Development<br />
Content Validity<br />
Test<br />
Pilot Study<br />
Sampling<br />
258<br />
YES<br />
YES<br />
Sampling Analysis<br />
Conclusion And<br />
Recommendation<br />
International <strong>Building</strong> & <strong>Infrastructure</strong> Technology Conference<br />
7-8 June 2011, Vistana Hotel, Penang, Malaysia<br />
Conference paper, Journal, Pass<br />
Research, Reference Books, Etc<br />
NO
6. EXPECTED OUTCOMES<br />
259<br />
International <strong>Building</strong> & <strong>Infrastructure</strong> Technology Conference<br />
7-8 June 2011, Vistana Hotel, Penang, Malaysia<br />
IBS maintenance management system will be develop <strong>and</strong> to be used by the contractors <strong>and</strong> the<br />
administrators of the building. This maintenance management system is important to prolong the<br />
building’s life cycle <strong>and</strong> avoid the wasting of the money.<br />
7. CONCLUSIONS<br />
This paper significantly revealed the important of develop the maintenance management for IBS<br />
building in Malaysia. All the review that has been highlighted for example history, issues <strong>and</strong> problem<br />
of IBS in Malaysia hope will be an important information <strong>and</strong> reference to develop the maintenance<br />
management system for IBS building.<br />
ACKNOWLEDGEMENT<br />
I would like to take this opportunity to thanks to my supervisor which is Assoc. Prof. Dr Hj. Zainal<br />
Abidin Bin Akasah who keep supporting <strong>and</strong> sharing his knowledge in my master research. Besides, I<br />
would also like to thanks to my parents <strong>and</strong> friend which always encouraging me in my master<br />
research.<br />
REFERENCE<br />
Abdullah, M.R, Kamar, K.A.M, Nawi, M.N.M, Haron, T <strong>and</strong> Arif, M(2009), “Industrialized <strong>Building</strong><br />
System: A Defination And Concept”, Proceeding In ARCOM Conference, 7-9<br />
September2009,Nottingham,United Kingdom.<br />
Chung, L. P.& Kadir, A. M. (2007) , “Implementation Strategy for Industrialised <strong>Building</strong><br />
<strong>Systems</strong>”,. PhD thesis, Universiti Teknologi Malaysia (UTM), Johor Bahru. Construction Industry<br />
Development Board (CIDB) Malaysia (2003a) IBS Roadmap 2003- 2010, Construction Industry<br />
Development Board Malaysia (CIDB), Kuala Lumpur.<br />
CREAM <strong>and</strong> CIDB(2010), INDUSTRIALIZED BUILDING SYSTEM (IBS) CONSTRUCTION<br />
RESEARCH AND INFORMATION, Retrieved from:<br />
http://ibsresearch.blogspot.com/2010/04/history-of-ibs-adoption-in-malaysia.html<br />
Diah, A.B.M, Majid, T.A, Nawawi, N.M, Ismail, S., Zain, M.Z.M <strong>and</strong> Hassan, R. (2009), “Development<br />
through IBS Integration”, Proceeding International Seminar On IBS in Malaysia IBS International<br />
Exhibition(MIIE 2009), at CIDB Convention Centre.<br />
Hamid,Z.A, Kamar, K.A.M, Zain,M.Z.M, Ghani,M.K <strong>and</strong> Rahim,A.H, “Industrialized <strong>Building</strong><br />
System(IBS) In Malaysia:The Current State And R&D Initiatives”,CREAM,Kuala Lumpur.<br />
Hashim,A.R(2007), “Maintenance Management And Services Case study Perkeso <strong>Building</strong> In<br />
Penisular Malaysia, Master Thesis Of UTM.<br />
Kamar, K.A.M, Alshawi, M <strong>and</strong> Hamid, Z. (2009), “Barriers To Industrialized <strong>Building</strong> System(IBS):<br />
The Case Of Malaysia”, Proceeding In BuHu 9 th Postgraduate Research Conference(IPGRC), 29-<br />
30January2009, at Salford United Kingdom.<br />
Kamar, K.A.M, Egbu,C, Arif,M, Hamid, Z.A, Zin, M.Z.M, Ghani. M.K <strong>and</strong> Rahim, A.H.A(2009),<br />
“Submission to Construction Industry Development Board(CIDB), IBS Centre Malaysia <strong>and</strong> IBS<br />
Technical Committee”, Proceeding Of 1 st CIDB/CREAM IBS Roundtable Workshop<br />
(IRW01),29July2009, Gr<strong>and</strong> Season Hotel Kuala Lumpur.<br />
Kamar, K.A.M, Hamid, Z.A.H, Sani, S.F.A, Ghani,M.K, Zin, Rahim,A,H <strong>and</strong> Karim,A.Z.A(2010),“The<br />
Critical Success Factors (CSFs) for the Implementation Of Industrialized <strong>Building</strong> System(IBS) in<br />
Malaysia”,Proceeding 3 rd IBS Roundtable Workshop (IRW03) CIDB/CREAM IBS Survey 2010.<br />
Mohamed, N.W,(2010), “Road Maintenance Management System: Case Study At Public Work<br />
Department”, Master Thesis UTM.<br />
Rahman, A.B.A, Omar, W. (2006) , “Issues <strong>and</strong> Challenges in the Implementation of IBS in Malaysia”.<br />
Proceeding of the 6th Asia-Pasific Structural Engineering <strong>and</strong> Construction Conference (ASPEC<br />
2006). 5-6 September 2006, Kuala Lumpur, Malaysia.<br />
Yaacob,S.(2006), “Maintenance Management System Through Strategic Planning For Public School<br />
In Malaysia”, Master Thesis UTM.
T155<br />
260<br />
International <strong>Building</strong> & <strong>Infrastructure</strong> Technology Conference<br />
7-8 June 2011, Vistana Hotel, Penang, Malaysia<br />
IMPLEMENTING LIFE CYCLE COSTING IN MALAYSIA CONSTRUCTION<br />
INDUSTRY: A REVIEW<br />
Nor Azizah Mohammed Rum 1 dan Zainal Abidin Akasah 2<br />
1,2 Universiti Tun Hussein Onn Malaysia<br />
1 jijah22@yahoo.com , 2 zainal59@uthm.edu.my<br />
ABSTRACT: Globally, the construction industry is one sector that contributes to economic growth in<br />
Malaysia. The construction industry is developing rapidly <strong>and</strong> become one of the backbones of the<br />
country compared with other developing countries in the world. As developing countries are now<br />
moving towards sustainable development is in line with the 9th Malaysia Plan, development should be<br />
built to meet current <strong>and</strong> future needs for achieving sustainability of economic development, social <strong>and</strong><br />
environmental responsibility for the prosperity without compromising the needs of future generations.<br />
Therefore, to ensure the government's objective was achieved construction industry must implement<br />
the Life Cycle Costing (LCC) method to construct the structures <strong>and</strong> infrastructure projects that it will<br />
not cause losses to the industry itself <strong>and</strong> government. Each stage of construction project begins with<br />
planning, design, construction, operation, maintenance <strong>and</strong> demolishes the project <strong>and</strong> it cost should<br />
be considered to ensure the overall project costs as are known. Through this LCC, factors <strong>and</strong><br />
maintenance costs for a building products accounted at the design stage to obtain a more accurate<br />
projection of the cost. This paper will describe the LCC as a vital element in all sectors of the<br />
construction industry because this method can drive quality improvement by taking into account the<br />
cost of a comprehensive project. The aim of this paper is to underst<strong>and</strong> the LCC for the construction<br />
industry in Malaysia expecially in maintenance phase. Secondly is to identify the process of LCC in<br />
buildings construction <strong>and</strong> last but not least is recommending that appropriate measures to implement<br />
the LCC in the construction industry in Malaysia. The main sources of the literature research will be<br />
taken through articles, journals, references books in the resources centre <strong>and</strong> internet search.<br />
Hopefully the implementation of LCC in the construction industry in Malaysia could be accessed <strong>and</strong><br />
used for research reference by future researcher <strong>and</strong> as reference materials for the construction<br />
management industry in Malaysia.<br />
Keywords: construction industry, life cycle costing, implementation, maintenance<br />
1. INTRODUCTION<br />
Construction industry is one sector that contributes to economic growth (CIMP, 2007). This industry is<br />
regarded as a stimulus to the development of other industries in introduced Malaysia as a developing<br />
country in the developed world. As the economy improved the construction industry will follow the<br />
same increase <strong>and</strong> at the same time dem<strong>and</strong> will increase in economic construction. It is closely linked<br />
to the development of other sectors such as manufacturing, services, <strong>and</strong> etc. However, production of<br />
the construction sector is different from other sectors, it is not homogenous <strong>and</strong> each of it is<br />
considered unique <strong>and</strong> has its own value. The output of construction or design that is required must<br />
been meet the external influences which include sociology, politics, culture <strong>and</strong> economy (Aminah &<br />
Ismail, 2007).<br />
According to the Economic Report 2010/2011, Ministry of Finance Malaysia (2010), development of<br />
construction industry was largely supported by the increase in civil engineering <strong>and</strong> non-residential<br />
property immediately following the implementation of development projects under the Ninth Malaysia<br />
Plan (9MP) <strong>and</strong> stimulus packages. The industry is estimated to grow 4.9 percent in 2010. Consistent<br />
with this report indirectly any infrastructure construction projects <strong>and</strong> commercial building ever built<br />
with the progress <strong>and</strong> success achieved by the country.<br />
As a developing country, the construction industry in Malaysia is the most important <strong>and</strong> consistent<br />
where it involves a very detailed management on various matters such as management of
261<br />
International <strong>Building</strong> & <strong>Infrastructure</strong> Technology Conference<br />
7-8 June 2011, Vistana Hotel, Penang, Malaysia<br />
construction materials, machinery, technology, labour, implementation <strong>and</strong> etc, so well that it can<br />
realize its aspirations as well as fulfilling people’s basic needs. This industry is important because it is<br />
like as a tool of economic management for government as the Gross Domestic Product First Quarter<br />
of 2010 (GDP) highlight that the growth momentum to continue in the construction sector this quarter<br />
with record growth of 8.7 percent which includes Sub-Civil <strong>and</strong> Non-Residential which is a major<br />
contributor to this strong economic growth.<br />
However the more sophisticated approach is needed for the design <strong>and</strong> construction of building<br />
facilities that through a combination of economic theory <strong>and</strong> computer technology where it is seen in<br />
terms of cost to design <strong>and</strong> build (Dhillon, 1989, Kirk & Dell'Isola, 1995; Hyo 2008). Nevertheless,<br />
owners can exp<strong>and</strong> their perspective to include the cost of the operation, maintenance, repair,<br />
replacement, <strong>and</strong> disposal (Sirin, 2007; Venkataraman & Pinto, 2008). Therefore, to ensure the<br />
government's objective was achieved construction industry must implement the Life Cycle Costing<br />
(LCC) method to construct the structures <strong>and</strong> infrastructure projects that it will not cause losses to the<br />
industry itself <strong>and</strong> government. LCC is the process of identifying <strong>and</strong> documenting the initial cost <strong>and</strong><br />
total cost of the future on the development <strong>and</strong> operation of buildings during the lifetime of the building<br />
(Sirin, 2007, Bahr & Lennerts, 2008; Ade Asmi, 2009). Through this LCC, factors <strong>and</strong> maintenance<br />
costs for a building products accounted at the design stage to obtain a more accurate projection of the<br />
cost.<br />
2. LIFE CYCLE COSTING<br />
2.1 LIFE CYCLE COST DEFINITION<br />
There are different terms used in the literature today like, cost in use, life cycle costs (LCC), whole life<br />
costing (WLC) <strong>and</strong> whole life appraisal (WLA). Where defined that the terminology has changed over<br />
the years from cost in use to life cycle costing <strong>and</strong> further to whole life costing (Flanagan & Jewel,<br />
2005). They defined the new term whole life appraisal which is the systematic consideration of all<br />
relevant costs, revenues <strong>and</strong> performance associated with the acquisition <strong>and</strong> ownership of an asset<br />
over its physical / economic / functional / service / design life. It minimises total expenditure through<br />
proper appraisal of coats that will be incurred through the life facility.<br />
LCC is a valuable technique that is used for predicting <strong>and</strong> assessing the cost performance of<br />
constructed assets. LCC is one form of analysis for determining whether a project meets the client's<br />
performance requirements (BS ISO: 15686-5, 2008). The Norwegian St<strong>and</strong>ard defined LCC as<br />
including both original costs <strong>and</strong> cost incurred throughout the whole functional lifetime including<br />
demolition (NS 3454, 2000).<br />
However, LCC also a process to determine the sum of all the costs associated with an asset or part<br />
there of, including acquisition, installation, operation, maintenance, refurbishment <strong>and</strong> disposal costs.<br />
It is pivotal to the asset management process as an input to the evaluation of alternatives via<br />
Economic Appraisal, Financial Appraisal, Value Management, Risk Management <strong>and</strong> Dem<strong>and</strong><br />
Management. LCC adds all the costs of alternatives over their life period <strong>and</strong> enables an evaluation<br />
on a common basis for the period of interest. This enables decisions on acquisition, maintenance,<br />
refurbishment or disposal to be made in the light of full cost implications (TAM, 2004).<br />
According to Olanrewaju, Khamidi, Idrus <strong>and</strong> Shobowale (2010), the large sums of money are<br />
required to keep the facility in operations <strong>and</strong> in good conditions. Generally, in some cases running<br />
cost could be as high as 40% of the capital cost or even more. Anecdotal evidences have suggested<br />
that only about 10% of the total cost is actually required to complete the project. What this mean is<br />
nearly, 90% of the total cost of project is claimed by maintenance <strong>and</strong> running costs. The effects of the<br />
maintenance <strong>and</strong> running costs on the construction are so evident that any attempt to overlook them<br />
would be at the detriment of the client <strong>and</strong> in fact, to the professional competence of the designs’ <strong>and</strong><br />
construction teams. Figure 1 show the LCC planning at different stages during a building lifespan.
262<br />
International <strong>Building</strong> & <strong>Infrastructure</strong> Technology Conference<br />
7-8 June 2011, Vistana Hotel, Penang, Malaysia<br />
Figure 1. Life cycle cost planning at different stages (BS ISO: 15686-5, 2008)<br />
2.2 LCC MODEL<br />
According to Total Asset Management (2004), LCC model is an accounting structure containing terms<br />
<strong>and</strong> factors which enable estimation of an asset's component costs. A number of commercially<br />
available models can be used for LCC analysis. However, in some cases it may be appropriate to<br />
develop a model for a specific application. In either case, the LCC model should:<br />
a. Represent the characteristics of the asset being analysed including its intended use<br />
environment, maintenance concept, operating <strong>and</strong> maintenance support scenarios <strong>and</strong> any<br />
constraints or limitations;<br />
b. Be comprehensive enough to include <strong>and</strong> highlight thefactors relevant to the asset LCC;<br />
c. Be easily understood to allow timely decision-making, future updates <strong>and</strong> modification; <strong>and</strong><br />
d. Provide for the evaluation of specific LCC elements independently of other elements.<br />
Before selecting a model, the purpose of the analysis <strong>and</strong> the information it requires should be<br />
identified. The model should also be reviewed with respect to the applicability of all cost factors,<br />
empirical relationships, constants, elements <strong>and</strong> variables. Refer figure 2 below to know the process<br />
of LCC fundamentally involves:<br />
a. Assessing costs arising from an asset over its life cycle; <strong>and</strong><br />
b. Evaluating alternatives that have an impact on this cost of ownership.<br />
An asset can be any item that has a value to an organisation over time. Items such as buildings,<br />
physical plant <strong>and</strong> equipment <strong>and</strong> computer software are normally regarded as assets. Consideration<br />
of all these costs is important, even if they are funded from different sources within an organisation<br />
(Better Practice Guide, 2001).<br />
One may describe LCC models as predictive in nature <strong>and</strong> characterize a stochastic process involving<br />
many parameters such as interest rates <strong>and</strong> reliability. Nevertheless, irrespective of the types of<br />
models used for LCC analysis they all must be visible, transparent <strong>and</strong> effective in representing<br />
systems, equipment, subsystems or devices (Dhillon, 2009).
263<br />
International <strong>Building</strong> & <strong>Infrastructure</strong> Technology Conference<br />
7-8 June 2011, Vistana Hotel, Penang, Malaysia<br />
Figure 2. Life cycle cost concept (Better Prctice Guide, 2001)<br />
2.3 LCC METHOD<br />
Cost estimating is a popular activity as various kinds of costs have to be estimated each day. The<br />
estimated cost has to be as close as possible to its actual value; otherwise it may lead to a<br />
consequence of a severe degree. Most specially, the success or failure of an organization may<br />
depend on the quality of cost estimates however over the years, people working in cost estimating<br />
area have to come up with several different cost estimation methods, models <strong>and</strong> procedures (Dhillon,<br />
2009).<br />
The literature shows that the most suitable approach for LCC in the construction industry is the net<br />
present value (NPV) method. Existing mathematical LCC models, which are based on NPV, have<br />
various advantages <strong>and</strong> disadvantages, as they differ in the breakdown costs elements. The model<br />
from the American Society for Testing Materials as shown in Eq.(1) for example, distinguishes<br />
between energy <strong>and</strong> other running cost, which is useful in adopting different discount rates for different<br />
cost items.<br />
NPV = C + R – S + A + M + E ……………..(1)<br />
C = investment costs<br />
R = replacement costs<br />
S = the resale value at the end of study period<br />
A = annually recurring operating, maintenance <strong>and</strong> repair costs (except<br />
energy costs)<br />
M = non-annually recurring operating, maintenance <strong>and</strong> repair cost (except<br />
energy costs)<br />
E = energy costs<br />
According to Arja, Souce & Souyri (2009), LCC can be calculated at any phase of the building life in<br />
assessing the overall cost of the buildings which are under construction or already in service. There<br />
are basically few steps to go in LCC (Barringer, 2003), as shown below:<br />
1. Identify what has to be analyzed <strong>and</strong> the time period for the project life study along with the<br />
appropriate financial criteria.<br />
2. Focus on the technical features by way of the economic consequences to look for alternative<br />
solutions.
264<br />
International <strong>Building</strong> & <strong>Infrastructure</strong> Technology Conference<br />
7-8 June 2011, Vistana Hotel, Penang, Malaysia<br />
3. Develop the cost details by year considering memory joggers for cost structures.<br />
4. Select the appropriate cost model, simple discrete, simple with some variability for repairs <strong>and</strong><br />
replacements, complex with r<strong>and</strong>om variations, etc.<br />
5. Acquire the cost details.<br />
6. Assemble the yearly cost profiles.<br />
7. For key issues prepare breakeven charts to simplify the details into time <strong>and</strong> money.<br />
8. Sort the big cost items into a Pareto distribution to consider futher study.<br />
9. Test alternatives for high cost items such as what happens if maintenance cost is up to 10%<br />
than planned, etc.<br />
10. Study uncertainty/risk of errors or/alternatives for high cost items as a sanity check <strong>and</strong><br />
provide feedback to the LCC studies in iterative fashion.<br />
11. Select the preferred course of action <strong>and</strong> pelan to defend the decisions with graphics.<br />
2.4 INTEGRATED LIFE CYCLE DESIGN<br />
Integrated life cycle design is still at a phase of rapid development, <strong>and</strong> this is the start of the final<br />
formulation of a new integrated design process <strong>and</strong> methodology, which in future will serve as general<br />
design culture. The step will be in integration of the design, management <strong>and</strong> maintenance planning of<br />
buildings <strong>and</strong> civil infrastructures into comprehensive life time engineering (Asko, 2002). The main<br />
aspects included in the model are displayed in figure 3. The model might be able to address several<br />
facets of uncertainties, going beyond a traditional LCC model.<br />
Culture<br />
- Business culture<br />
- <strong>Building</strong> traditions<br />
- Aesthetics<br />
- Architectural<br />
styles <strong>and</strong> trends<br />
Ecology<br />
- Energy costs<br />
- Waste costs<br />
- Raw materials costs<br />
- Environment burdens costs<br />
Figure 3. Integrated life cycle design (Erika, Jutta & Lars, 2007)<br />
3. OPERATIONS AND MAINTENANCE<br />
Maintenance means any activity or combination of actions that cover the technical aspects <strong>and</strong><br />
management function undertaken to maintain, preserve or recover a thing to the original condition. It is<br />
also a combination of any action taken to repair or relocate the things or tools appropriate to the<br />
situation acceptable (Wood, 2009). However, it also the work other than daily <strong>and</strong> routine cleaning,<br />
necessary to maintain the performance of the building fabric <strong>and</strong> its services (BS: 8210,1986).<br />
Maintenance also is the one of the most difficult decisions facing facility/asset owners is the timing of<br />
different types of maintenance work in order to keep facilities up to a proper <strong>and</strong> acceptable state of<br />
repair. Several policies are available, ranging from a short-term temporary repair to the undertaking of<br />
a full-scale renewal. The choice of action depends on a number of factors <strong>and</strong> as a result significant<br />
reductions in maintenance costs are likely to result from a life cycle approach:<br />
a. The cost of different types of repair.<br />
Integrated life cycle design<br />
Financial Cost<br />
- Investment costs<br />
- Construction costs<br />
- Running costs LCC<br />
- End of life cycle<br />
Human Conditions<br />
- Safety<br />
- Health<br />
- Convenience<br />
- Functionality in use
265<br />
International <strong>Building</strong> & <strong>Infrastructure</strong> Technology Conference<br />
7-8 June 2011, Vistana Hotel, Penang, Malaysia<br />
b. The rate of deterioration.<br />
c. The relationship between the physical life of the repair <strong>and</strong> required physical, functional <strong>and</strong><br />
economic life of the facility.<br />
d. The disruption <strong>and</strong> disturbance to the building occupants <strong>and</strong> time required for the repair.<br />
Maintenance repair consists of three stages: inspection, diagnosis <strong>and</strong> constructional or remedial<br />
action. The maintenance can be classified under the following subheading (Flanagan & Jewel, 2005).<br />
Maintenance of the Main Structure: The main structure is exposed primarily to the natural elements<br />
<strong>and</strong> maintenance work will probably involve inspection <strong>and</strong> routine planned maintenance.<br />
Maintenance of the Finishing/Fixture/Fittings: The finishing suffers from wear <strong>and</strong> tear by the<br />
occupants <strong>and</strong> will require periodic renewal.<br />
Maintenance of the External Works: The external works will require extensive maintenance with grass<br />
cutting, replacement of shrubs <strong>and</strong> tress <strong>and</strong> paving.<br />
Maintenance of the Plumbing, Mechanical <strong>and</strong> Electrical Services: Each of the services elements will<br />
have its own maintenance requirements. While planned <strong>and</strong> preventive works will be undertaken,<br />
frequent corrective maintenance dependent upon the age will be needed.<br />
Modernisation <strong>and</strong> Adaptation: This will often take place on a planned basis at a certain point in the<br />
facility life.<br />
Redecorations: Internal <strong>and</strong> external redecorations will be necessary on a planned basis.<br />
4. RESEARCH AIMS<br />
The aim of this paper is to underst<strong>and</strong> the LCC for the construction industry in Malaysia expecially in<br />
maintenance phase. Secondly is to identify the process of LCC in buildings construction <strong>and</strong> last but<br />
not least is recommending that appropriate measures to implement the LCC in the construction<br />
industry in Malaysia. Those objectives will show the important of the implementation of LCC in<br />
construction industry especially during in operation <strong>and</strong> maintenance phase.<br />
5. SCOPE OF STUDY<br />
The scope of this study is limited to the government building in Malaysia such as Institution building<br />
like several building in Universiti Tun Hussein Onn Malaysia (UTHM), Johor. The scope is chosen<br />
based on the higher cost for energy consumption in institutions of the industrial sector. Institutions are<br />
also a place for convenience in order to produce excellent <strong>and</strong> quality students.<br />
6. RESEARCH METHODOLOGY<br />
Among the approaches used is through searching the source of printed materials <strong>and</strong> electronic media<br />
to facilitate the study of literature carried out while the questionnaires, interviews <strong>and</strong> brief discussion<br />
with the supervisor, certain person <strong>and</strong> respondents also facilitate the empirical study. To obtain<br />
accurate information <strong>and</strong> detailed the methods of this study will be implemented gradually based on<br />
figure 4 below:
266<br />
International <strong>Building</strong> & <strong>Infrastructure</strong> Technology Conference<br />
7-8 June 2011, Vistana Hotel, Penang, Malaysia<br />
Figure 4. Research Methodology Flow Chart<br />
6.1 RESEARCH POPULATION/SAMPLE<br />
In this study, a questionnaire will be asked to certain people such as the occupant of the building,<br />
contractors, developer <strong>and</strong> building consultant to obtain statistically useful information about a given<br />
topic. It is the only feasible way to reach a number of reviewers large enough to allow statistically<br />
analysis of the results.<br />
6.2 PROPOSED DATA COLLECTION METHOD<br />
The interviews will be conducted with the questionnaire <strong>and</strong> also site survey to obtain detailed<br />
investigation information <strong>and</strong> data in maintenance problem <strong>and</strong> also to implement the life cycle cost<br />
approach to control the costing of the building during their life time.<br />
6.3 Data analysis<br />
This study data for questionnaire will be analysed by using Statistical Package for Social Sciences<br />
(SPSS) <strong>and</strong> Mircosoft Excel to calculate the costing with information from interview <strong>and</strong> site survey will<br />
be discuss for more detailed result.<br />
7. EXPECTED OUTCOMES<br />
Hopefully at the end of this research will answer the objectives of this study which are to underst<strong>and</strong><br />
the LCC for the construction industry in Malaysia expecially in maintenance phase. Secondly is to<br />
identify the process of LCC in buildings construction <strong>and</strong> last but not least is recommending that<br />
appropriate measures to implement the LCC in the construction industry in Malaysia. Those objectives<br />
will show the important of the implementation of LCC in construction industry especially during in
267<br />
International <strong>Building</strong> & <strong>Infrastructure</strong> Technology Conference<br />
7-8 June 2011, Vistana Hotel, Penang, Malaysia<br />
operation <strong>and</strong> maintenance phase. Those objectives will integrate life cycle costing model in<br />
construction industry.<br />
According to Arja et-al (2009), for futher suggestion is that the LCC analysis should be developed <strong>and</strong><br />
extent in application for different type of bulding to obtain more reliable results <strong>and</strong> different LCC<br />
formule to contribute to other functions of building services such as building design <strong>and</strong> costing, in<br />
decision making <strong>and</strong> planning process.<br />
8. CONCLUSIONS<br />
As a conclusion, consideration of economic concept of time value of money involves variables such as<br />
cost, time <strong>and</strong> also discount rate (Cryder & Lally, 2008) in oder to compare the amout of money that<br />
will be spent over an extended number of years.<br />
This research also will provide benefits <strong>and</strong> advantages not only to the building management but also<br />
favourable to the government bodies involved in the construction sector <strong>and</strong> to overcome certain<br />
problems in maintenance phase through the life cycle cost approach in government building. It also<br />
can create an effective <strong>and</strong> safe environment that is comfortable to the occupier. The building work will<br />
increase productivity indirectly, increase the value of investments <strong>and</strong> reduce maintenance costs.<br />
From the study that has been conducted, perhaps it will be parallel with the objectives that achieved<br />
through the methods which have been stated earlier.<br />
ACKNOWLEDGEMENT<br />
I would like to sincerely thank Associate Professor Dr Hj Zainal Abidin Akasah as my supervisor for the<br />
feedback throughout the research <strong>and</strong> the writing process of this paper. My profound appreciation to<br />
Universiti Tun Hussein Onn Malaysia (UTHM) in giving me the opportunity to doing this study <strong>and</strong> not<br />
forget especially my family <strong>and</strong> friends are always giving support, encouragement <strong>and</strong> support in<br />
completing this study.<br />
REFERENCES<br />
Abdul Azis, A. A. (2009). BFB 4093 Chapter 4: Life Cycle Cost. Power Point: Universiti Tun Hussein<br />
Onn Malaysia.<br />
Arja, M., Sauce, G. <strong>and</strong> Souyri, B. (2009). External uncertainty factors <strong>and</strong> LCC: a case study,<br />
<strong>Building</strong> Research & Information, Vol.37 No.3, pp.325-334.<br />
Asko, S. (2002) Integrated Life Cycle Design of Structures. Great Britain: MPG Books Ltd.<br />
Bahr, C. & Lennerts, K. (2008). Maintenance-LCC analysis based on real data. Life-cycle Civil<br />
Engineering, 1, 783-786.<br />
Barringer, H. P., Barringer, P. E. & Associates, Inc. (2003). Life cycle costs & reliability for process<br />
equipment. Proc. of the 8 th Annual Energy Week Conference & Exhibition. Houston, Texas: American<br />
Petroleum Institute. pp. 1-22.<br />
Better Practice Guide (2001). Life Cycle Costing. Australian National Audit Office.<br />
British St<strong>and</strong>ards Institution (1986). Guide to <strong>Building</strong> Maintenance management. London: BS 8210.<br />
British St<strong>and</strong>ards Institution (2008). <strong>Building</strong> & Constructed Assets – Service Life Planning – Part 5:<br />
Life Cycle Costing. London: BS 15686-5.<br />
Dhillon, B. S. (2009). Life Cycle Costing for Engineers. Amsterdam: Gordon <strong>and</strong> Breach Science<br />
Publishers S.A.<br />
Dhillon, B.S. (1989). Life Cycle Costing. United States of America: Gordon <strong>and</strong> Breach Science<br />
Publishers.<br />
Erika, L., Jutta, S., & Lars, S. (2007). Life Cycle Costing for <strong>Building</strong>s: Theory <strong>and</strong> Suitability for<br />
Addressing Uncertainties About Timber Housing.
268<br />
International <strong>Building</strong> & <strong>Infrastructure</strong> Technology Conference<br />
7-8 June 2011, Vistana Hotel, Penang, Malaysia<br />
Flanagan, R. & Jewell, C. (2005). Whole Life Appraisal for Construction. Oxford: Blackwell Publishing<br />
Ltd.<br />
Hyo-Nam Cho (2008). Practical approaches to the application of life-cycle civil engineering for<br />
infrastructure in Korea. Life-cycle Civil Engineering, 1, 21-34.<br />
Kirk, J. S. & Dell’lsola, J. A. (1995). Life Cycle Costing for Design Professionals. 2 nd ed. United States<br />
of America: McGraw-Hill, Inc.<br />
Lembaga Pembangunan Industri Pembinaan Malaysia (2007). Pelan Induk Industri Pembinaan<br />
Malaysia 2006-2010 (CIMP). Malaysia : Lembaga Pembangunan Industri Pembinaan Malaysia.<br />
Norwegian St<strong>and</strong>ard (2000).Life cycle costs for building <strong>and</strong> civil engineering work - principles <strong>and</strong><br />
classification. St<strong>and</strong>ard Norge, NS3454.<br />
Olanrewaju, A. L., Khamidi, M. F., Idrus, A. & Shobowale, K. (2010). A comparative analysis of value<br />
engineering <strong>and</strong> life cycle costing techniques: a literature review.<br />
Sirin, M. R. (2007). Teori Asas Ekonomi Kejuruteraan. Parit Raja, Batu Pahat: Universiti Tun Hussein<br />
Onn Malaysia (UTHM).<br />
Total Asset Management (2004). Life Cycle Costing Guideline. Sydney: New South Wales Treasury.<br />
Venkataraman, R. R. & Pinto, J. K. (2008). Cost <strong>and</strong> Value Management in Projects. New Jersey:<br />
John Wiley & Sons, Inc.<br />
Wood, B. (2009). <strong>Building</strong> Maintenance. Singapore: Wiley-Blackwell.<br />
Yusof, M. A. & Omar, I. (2007). Analisis Kitaran Ekonomi dan Industri Pembinaan di Malaysia.<br />
Universiti Teknologi Malaysia : Thesis Ph.D.
T158<br />
269<br />
International <strong>Building</strong> & <strong>Infrastructure</strong> Technology Conference<br />
7-8 June 2011, Vistana Hotel, Penang, Malaysia<br />
KEY FACTORS IN DEVELOPING MAINTENANCE CULTURE OF PUBLIC ASSET<br />
MANAGEMENT<br />
Suwaibatul Islamiah Abdullah Sani 1 dan Abdul Hakim Mohammed 2<br />
1,2 Jabatan Pengurusan Harta Tanah, Fakulti Geoinformasi & Harta Tanah (FGHT), Universiti<br />
Teknologi Malaysia (UTM), 81310 Johor Bahru, Johor, Malaysia<br />
1 sweetbatul85@yahoo.com , 2 hakim@fksg.utm<br />
ABSTRACT: Malaysia is grow developing country <strong>and</strong> its visions in becoming a developed country<br />
with a first class infrastructural network. Towards this vision, asset facilities are developed especially<br />
buildings constructions <strong>and</strong> infrastructure to fulfill the need of society <strong>and</strong> organization. To ensure the<br />
functioning asset, minimum cost of repairing <strong>and</strong> providing a safe environment for user maintenance<br />
as activity those are undertaken to maintain <strong>and</strong> preserve asset. However, the asset especially public<br />
building <strong>and</strong> infrastructure are not maintained properly because the lack of maintenance culture.<br />
Therefore developing maintenance culture is hardly needed to increase the awareness about<br />
maintenance activity in managing public asset. Maintenance culture is an alternative measure that<br />
helps to increase the quality of maintenance <strong>and</strong> reducing the cost of repairing also ensuring the<br />
function asset <strong>and</strong> good safety environment. This paper will discuss <strong>and</strong> emphasize about nine<br />
factors in developing maintenance culture:- (a) Leadership, (b) Communication, (c) Reward <strong>and</strong><br />
Recognition, (d) Organization Structure, (e) Teamwork (f) Training <strong>and</strong> education, (g) Motivation (h)<br />
Involvement <strong>and</strong> Empowerment (i) Policy of Maintenance.<br />
Keywords: public asset, maintenance, maintenance culture<br />
1. INTRODUCTION<br />
Malaysia is a developing country that will achieve first class infrastructural network in 2020. Towards<br />
this vision, the public asset (physical asset) especially building <strong>and</strong> infrastructure are constructed to<br />
provide quality services as facilitating to fulfil the need of society <strong>and</strong> government organization.<br />
However numerous comments <strong>and</strong> arguments from various parties especially from the public, private<br />
<strong>and</strong> government sector about the condition of public asset did not achieve its function. The neglecting<br />
of maintenance public asset especially building damages is not repaired <strong>and</strong> replacement properly by<br />
parties involve of asset management. Part of this poor maintenance shows the lack of awareness in<br />
maintaining public asset by the government agencies. Maintenance activity or work process which is<br />
an important aspect in supporting business function in an organizational is to preserve for function of<br />
physical asset, reduce cost of operation <strong>and</strong> providing a safe environment for internal <strong>and</strong> external<br />
customer. In cultivating awareness concerning maintenance culture, the government or parties must<br />
held promotion <strong>and</strong> self-motivation in managing public asset. The new cultures about maintenance are<br />
needed to transform the traditional cultural <strong>and</strong> behavioural in the mind-set of all participants to<br />
improve quality maintenance. In developing maintenance culture the key factor which influences<br />
maintenance culture should be identified as a successfully quality maintenance performance.<br />
2. MAINTENANCE IN PUBLIC ASSET MANAGEMENT<br />
In February 2001, during the opening of the Kuala Lumpur 21 Convention <strong>and</strong> Exposition, the Deputy<br />
Prime Minister of Malaysia in referencing to the state of FM in Malaysia emphasized that: Unless<br />
Malaysians change their mentality to become more aware of the need to provide good services <strong>and</strong><br />
improve the upkeep of buildings, we will forever be a Third World country with First World<br />
<strong>Infrastructure</strong> (Prime Minister of Malaysia, 2001). From this statement it describing, the vision of<br />
government to be first world infrastructure by providing the good services but cultural in maintaining<br />
public asset especially government building were not keep inside in each individual of all parties asset
270<br />
International <strong>Building</strong> & <strong>Infrastructure</strong> Technology Conference<br />
7-8 June 2011, Vistana Hotel, Penang, Malaysia<br />
management. People do not have awareness the importance of maintenance work until maintenance<br />
work is not given a high priority in the organization.<br />
Every year government spends a lot of money replacing <strong>and</strong> repairing the breakdown of public asset<br />
that are caused by poor maintenance. According to the Chief Secretary of Government of Malaysia,<br />
despite the government commitment with the allocation of RM1.079 million (US$306,012.47) for<br />
upgrading renovation, there is evidence of shoddy work <strong>and</strong> buildings falling into despair (Syahrul <strong>and</strong><br />
Emma, 2009). Beside that The Ministry of Housing <strong>and</strong> Local Government received between 2400 <strong>and</strong><br />
4500 maintenance complaints each year over the last five years (Chuan, 2008) in (Idrus et. al, 2009).<br />
According Head of Maintenance Sector, Public Works Department Jabatan Kerja Raya (JKR), said<br />
that the st<strong>and</strong>ards of maintenance in government buildings are not up to the expectations (Annies,<br />
2007). This is part of issue are discussed about maintenance problem in public asset management.<br />
Many factor are contributed to the poor of maintenance public asset but the critical factor is the lack of<br />
management commitment by maintenance group to dexterity <strong>and</strong> responsive maintenance work<br />
(Derek Miles et. al, 1987; Elizebeth, 1993 dan Adenuga et. al, 2007, Jalal 2003). The other word this<br />
problem caused by human fault that is lack of culture in maintaining public asset by government<br />
agencies which regarding about lower quality of work, lack of ethics in maintenance effective, attitudes<br />
to underst<strong>and</strong>ing maintenance work, experience <strong>and</strong> unskilled worker <strong>and</strong> manpower, less supervision<br />
from leadership, postpones <strong>and</strong> delayed repairing <strong>and</strong> replacing asset, management not provide<br />
unclear policy <strong>and</strong> st<strong>and</strong>ard to guide staff, less information about maintenance <strong>and</strong> lack of<br />
commitment to maintenance plan (Emma <strong>and</strong> Syahrul, 2009; Jalal 2003; Elizebeth, 1993; Hammad,<br />
1995; Elizebeth, 1993; Adenuga et. al, 2007; Mark et. al, 2006; Angelo, 2003; Smith 1995; Onohaebi,<br />
2010; Rondeau et. al, 2006 dan Leather et. al, 1998).<br />
Maintenance culture in Malaysia needs a lot of efforts by the government to bring awareness in<br />
performing maintenance work properly for all parties that managing public asset. The government has<br />
outlined plans strategies to be implemented by all government agencies in the public asset<br />
management practices to create maintenance culture (DPAK Manual, 2009). In addition, the<br />
government allocated financial resources to create maintenance culture from the year 2005 until 2008<br />
in maintaining public asset (National Budget 2005-2008).<br />
3. MAINTENANCE CULTURE<br />
Many authors are not mention about maintenance culture but the concept of culture are similarity from<br />
other field especially in quality <strong>and</strong> safety culture. Culture is defined as those practices common to a<br />
group people (Saidin et. al, 2008), it described the learned <strong>and</strong> shared values <strong>and</strong> norms that<br />
influence members behavior <strong>and</strong> interaction with each others in organization group (Mark et. al, 2006).<br />
Otherwise culture is a key influence behaviour that is what gets done <strong>and</strong> people need to do the right<br />
things, the structure <strong>and</strong> strategy of the work <strong>and</strong> the goals won’t be acheived (Smith, 2006). Many<br />
researcher from other field especially safety <strong>and</strong> quality field believes that term quality <strong>and</strong> safety<br />
culture as a sub-facet of organisational culture that effect members attitudes <strong>and</strong> behaviours in<br />
relation to organisation.<br />
Thus the maintenance culture a is part of organisational culture that influences each member in<br />
organisation. The word maintenance is a noun derived from the verb “to maintain”. Maintenance<br />
means the process of keeping something in good condition (Telang, 2010). The concept of<br />
Maintenance culture is the internal environment between management <strong>and</strong> staff in managing<br />
maintenance effectively through the sharing of ideas, beliefs <strong>and</strong> values for each member in<br />
organization (Mark et. al, 2006). Maintenance culture is a way of thinking <strong>and</strong> behaving that can be<br />
drawn based on the actions taken by each individual in maintaining, preserving <strong>and</strong> protecting a<br />
system, equipment <strong>and</strong> structures. Involved with the maintenance of cultural beliefs, values, norms,<br />
practices <strong>and</strong> attitudes related to maintenance work. In other words, maintenance tasks into daily<br />
practice <strong>and</strong> embedded within each individual organization to appreciate the importance of<br />
maintenance (Suwaibatul, 2010).<br />
4. DEVELOPMENT MAINTENANCE CULTURE<br />
Cultivating the awareness in important of asset <strong>and</strong> facility management base on culture development<br />
in maintenance (Hakim, 2007). Developing maintenance culture is being recognised as an important<br />
aspect to increase quality maintenance work. Although culture is unique to each organisational (Yusof,<br />
2006), it is need cultural change. Olusanjo (2006) stated that, creating maintenance culture should be
271<br />
International <strong>Building</strong> & <strong>Infrastructure</strong> Technology Conference<br />
7-8 June 2011, Vistana Hotel, Penang, Malaysia<br />
established based on a cultural change in mindset <strong>and</strong> attitude people in the organization to enhance<br />
the knowledge <strong>and</strong> expertise performance of maintenance activities. This is because the cultural<br />
change needed to break indigenous moulds of poor perception, old patterns of now inappropriate<br />
behaviour <strong>and</strong> previous but now outdated, beliefs <strong>and</strong> values (Paschal, 1992). Smith (2006) stressed<br />
that, the work environment or culture is achieved by fostering learning, change, open communication,<br />
continual improvement <strong>and</strong> problem solving. Commitment from management is vital in creating<br />
maintenance culture for all employees in organization (Mark et. al, 2006).<br />
However, the maintenance culture has not been comprehensively studied by researcher from<br />
maintenance field. According to Oedewald <strong>and</strong> Reiman (2003) addressed that maintenance work has<br />
not been studied much from the cultural perspective <strong>and</strong> former approaches have seldom taken into<br />
account the dem<strong>and</strong>s of the maintenance work in the entire organization. The term of culture in<br />
maintenance are important to enhance the level good of maintenance perfomance.<br />
5. FACTORS IN DEVELOPING MAINTENANCE CULTURE<br />
Discussion about the factors that influences the development of culture are more discussing by<br />
researchers from the view of quality <strong>and</strong> safety culture <strong>and</strong> several researchers of other field. Thus the<br />
key factors will be identified base on literature riview from quality <strong>and</strong> safety culture field to develop<br />
maintenance culture. From literature riview in safety culture eigth important factors that contribute for<br />
the cultural development. This include leadership, communication, team work, training <strong>and</strong> education,<br />
motivation, recognition <strong>and</strong> reward, policy <strong>and</strong> involvement (Turner,1991; ACSNI, 1993; Health <strong>and</strong><br />
Safety Commission, 1993; Peterson, 1993; Ostrom et. al, 1993; Saidin, 2009; Eckhardt, 1996; Sayer,<br />
1994; Wiegmann et. al, 2002; Farrington et. al, 2005; Cabrera et. al, 2006; Parker et. al, 2006; Donald<br />
dan Center, 1994). While from literature review in quality culture had ten factors influencing the<br />
development of culture. These include leadership, communication, teamwork, training <strong>and</strong> education,<br />
motivation, recognition <strong>and</strong> reward, policy, involvement, empowerment <strong>and</strong> organization structure.<br />
Deming, 1986; Person, 1992; Juran dan Gyna, 1993; Bubshait, 2000; Goetch <strong>and</strong> Davis, 2000; Rita,<br />
2003; Carlo et. al, 2006; Yusof 2006; Tungkunan et. al, 2006; Viljoen & Wavaren 2008). As a result<br />
nine factors are indentified as a major influence in the development of maintenance culture, it consists<br />
of leadership, communication, teamwork, training <strong>and</strong> education, motivation, recognition <strong>and</strong> reward,<br />
policy, involvement <strong>and</strong> empowerment <strong>and</strong> organization structure.<br />
5.1 LEADERSHIP<br />
Leadership is a process of influencing the behavior group in organisation to encourage them performs<br />
the quality work towards achieving the goals. Koonntz <strong>and</strong> O'Donnell (1972) stated that leadership as<br />
skills to influence employees completed their tasks with great enthusiasm <strong>and</strong> confidence. According<br />
Saidin (2008) leadership is an essential part of the process of management <strong>and</strong> it also an integral part<br />
of the social structure <strong>and</strong> culture of organization. People in organization have beliefs about the<br />
leaders <strong>and</strong> their leader’s strengths <strong>and</strong> weakness can influence their work culture. Credible<br />
leadership would create the vision for organization, spread <strong>and</strong> foster the vision so that everybody buy<br />
the idea, actively participate during implementation <strong>and</strong> organize lifelong learning for the organization<br />
(Hakim, 2007).<br />
The role of leadership can be show by commitment from top management to create culture in<br />
maintenance. According Argyris (1999) in Govindaraju <strong>and</strong> Daily (2004) commitment is about<br />
generating human energy <strong>and</strong> activating the human mind. The management commitment is vital <strong>and</strong><br />
need to be demonstrated <strong>and</strong> visible to build work environment among employee based on conducting<br />
promotion of culture <strong>and</strong> provide information, reward system, training for improve employee skill,<br />
communicated about vision that won’t be achieved with employee <strong>and</strong> motivated employee with<br />
encouraging the good perform in maintenance work. Nakajima (1989) stated that top management’s<br />
primary responsibility is to establish a favourable environment where the work environment can<br />
support autonomous activities.<br />
5.2 COMMUNICATION<br />
Communication is the transfer information from a person to other member in organization by sending<br />
<strong>and</strong> receiving information or idea in form of oral or written (Carlo et al, 2006). Saidin, (2009) stated that<br />
communication as a tool in transferring ideas, statements, thoughts, feelings <strong>and</strong> values do that<br />
information are underst<strong>and</strong>ing by everyone in organization. Effective communication is important in<br />
the employee empowerment process. The use of teams is successful means for cross-functional
272<br />
International <strong>Building</strong> & <strong>Infrastructure</strong> Technology Conference<br />
7-8 June 2011, Vistana Hotel, Penang, Malaysia<br />
communications in organization. Multi-tiered management structure inhibited communication (Yusof,<br />
2006). Zohar, (1980) in Parker (2005) stressed that important effective communication that frequent<br />
<strong>and</strong> open contact between managers <strong>and</strong> worker was related good performance. According to Rita,<br />
(2003) communication is an instrument of positive interaction between top management <strong>and</strong> employee<br />
to perform a quality work. Communication can be achieved through a trust to employee, shared ideas<br />
<strong>and</strong> information within group member, accurate communicate with accurately, interaction to make<br />
friends, freedom of communication, open communication <strong>and</strong> communication between groups.<br />
5.3 REWARD AND RECOGNITION<br />
The recognition <strong>and</strong> reward would only be effective if it is meaningful <strong>and</strong> given an acknowledgment to<br />
the work produced (Saidin, 2008). It is what is received by an employee as reward for what their done<br />
in their work (Luthans, 2006). Gyna, 2001 in Viljoen <strong>and</strong> Waveren, (2008) are describing the<br />
recognition is defined as some sort of public acknowledgement for superior performance on quality<br />
activities <strong>and</strong> rewards are benefits such as salary increases, bonuses <strong>and</strong> promotions due to an<br />
individual’s performance on improving the quality aspects of his or her job.<br />
Rewards <strong>and</strong> recognition is the best when it is an inseparable habit of management <strong>and</strong> not awkward<br />
<strong>and</strong> delayed special nuisance. Recognition is a powerful motivator, because its reward behaviour<br />
immediately following that behaviour <strong>and</strong> there is a high degree of probability that behaviour will be<br />
repeated. The basic idea behind rewards is to give employees incentives for working harder <strong>and</strong><br />
smarter (Viljoen <strong>and</strong> Waveren, 2008).<br />
5.4 ORGANIZATION STRUCTURE<br />
The organizational structure is a system of rules <strong>and</strong> power relations that control how people in<br />
organizations work together <strong>and</strong> interaction each other. It is also associated with the use of structural<br />
resources to achieve organizational goals. The main objective organization structure is formulated as<br />
tool in coordinating human action <strong>and</strong> to motivate people in the achievement of organizational goals<br />
(Hizam <strong>and</strong> Zahir, 2002). Rita (2003) stressed that the organizational structure is important because it<br />
is a framework for carrying out the responsibilities <strong>and</strong> activities within the company. Organization is a<br />
division of function <strong>and</strong> mechanism of action about the task must be carry out for each people, without<br />
a good organization structure the activities will not run very well.<br />
5.5 TEAMWORK<br />
Team work comprised a group of people work together to achieve a goal. Specially, Salas et. al (1992)<br />
defining that team work one may conceive a team to be a distinguishable set of two or more people<br />
who interact dynamically, interdependently, <strong>and</strong> adaptively toward a common <strong>and</strong> valued mission, who<br />
have each been assigned specific roles or functions to perform, <strong>and</strong> who have a limited life-span<br />
membership’. People in organization are involved in conveying their opinions on works that they do<br />
<strong>and</strong> strategies to solve problems (Saidin, 2008).<br />
Teamwork occurs when two or more persons commit themselves to series of systematic actions<br />
based on brainstorming, discussing <strong>and</strong> exchange the information within another about task<br />
responsibility. Teamwork is universally accepted as the vehicle for change <strong>and</strong> the organizational<br />
mechanism for involving people in work improvement (Yusoff et al, 2006) <strong>and</strong> the role of team also<br />
influence change the individual behavioral (Rita, 2003). According Jawahar (1997) best activities in<br />
creating teamwork base on self managing work groups, coordination, team development,<br />
management reports, making decision in group, identifying problem, functional group, quality<br />
improvement <strong>and</strong> setting the goal must be achieved. Kirkman et al, (1998) stated that self managing<br />
work teams are needed for groups of employees in performing <strong>and</strong> managing their assigned work<br />
together. These teams operate with high levels of autonomy <strong>and</strong> responsibility to achieve specific<br />
goals defined by business plans.<br />
5.6 TRAINING AND EDUCATION<br />
Training is the development of attitudes, knowledge <strong>and</strong> specialized skills that required of an<br />
employee to perform job properly (Mahmood Nazar, 2005). Through training to develop human<br />
resources that enhance employee self-awareness, improve skills <strong>and</strong> knowledge of workers in certain<br />
areas <strong>and</strong> motivate employees to do the job better. Training should not be limited to transfer of<br />
technical skills <strong>and</strong> knowledge needed of optimal task performance. It should also cover generic
273<br />
International <strong>Building</strong> & <strong>Infrastructure</strong> Technology Conference<br />
7-8 June 2011, Vistana Hotel, Penang, Malaysia<br />
matters like the business imperative peculiar to organization, problem-solving techniques, team<br />
dynamics <strong>and</strong> facilitation skills (Tsang, 2002). Thiagarajan <strong>and</strong> Zairi (1997) further addressed that<br />
education <strong>and</strong> training is the single most important factor once the necessary commitment has been<br />
assured <strong>and</strong> had become a long-term strategy in the planning schedule to obtain aspirations <strong>and</strong><br />
skills. While education is important when explicit knowledge as knowledge that can be articulated in a<br />
formal education is one of the knowledge that acquired through education. Its forms the key in<br />
development of human nature with personal beliefs, perspectives <strong>and</strong> value system (Nonaka <strong>and</strong><br />
Tekeuchi, 1995). According Saidin, (2008), new employees must be trained before there begin their<br />
work. This is purpose to provide the performed with good, to underst<strong>and</strong>, to recognise the new work.<br />
The management are responsible for ensuring that the both new <strong>and</strong> experienced employees received<br />
the training.<br />
5.7 MOTIVATION<br />
Motivation is considered as processes of forming the personality of a person which can be<br />
encouraged to act in achieve certain goals (Ishak, 2006). Incentives that given for employees will<br />
increase confidence <strong>and</strong> encourage them carry out the quality of work. The successful to motivate<br />
employees depends on management role to full the employee need (Ali, 1995). Effective leaders must<br />
show high motivation <strong>and</strong> commitment to personal appearance in influencing attitude of employee.<br />
The motivation can be created such as reward, recognition <strong>and</strong> support by commitment management<br />
(Angelo, 2003).<br />
5.8 Involvement <strong>and</strong> Empowerment<br />
Empowerment is the process of delegating decision - making authority to lower levels within the<br />
organisation. Employees are encouraged to take the initiative <strong>and</strong> broaden their scope. Empowerment<br />
leads to improvements in ownership <strong>and</strong> responsibility <strong>and</strong> acts as evidence of managements trust in<br />
their employees’ abilities (Viljoen <strong>and</strong> Waveren, 2008). While the employee involvement is a<br />
participative process to increase commitment the employee any action <strong>and</strong> affair. The connection in<br />
involvement between employees <strong>and</strong> management can develop attitudes, behaviors <strong>and</strong> work culture<br />
(Dennis, 1997 in Saidin, 2009). Involving in teams of managers <strong>and</strong> workers “may reflect a growing<br />
awareness of the synergetic effects of working together. Involvement <strong>and</strong> empowerment is connection<br />
each other. Employee involvement (also termed empowerment) is where employees are encouraged<br />
to participate <strong>and</strong> take responsibility for decisions <strong>and</strong> management of their day to day tasks.<br />
Stenvenson (1996).<br />
5.9 Policy<br />
Policies can be described as actions that describe st<strong>and</strong>ard, rule <strong>and</strong> beliefs that must be followed by<br />
an individual or organization to achieve the goals (Dennis, 1997). The policy is a directive, persuasion,<br />
explanation <strong>and</strong> determination of responsibilities for the management <strong>and</strong> to ensure responsibilities<br />
are carried out efficiently review. The presence of the police is essential to create an effective<br />
management <strong>and</strong> it can explain the st<strong>and</strong>ards <strong>and</strong> actions that should be followed by everyone in the<br />
organization (Saidin, 2009). Statement of policy system should be simple <strong>and</strong> explain the core values<br />
<strong>and</strong> beliefs of a firm with a clear <strong>and</strong> express about the common goals <strong>and</strong> objectives that want be<br />
achieved (Ismail, 2006). Crosby (1979) in Yusoff, (2006) stated that policy as a st<strong>and</strong>ard for practice<br />
that sets priorities of what to do <strong>and</strong> not to do, without a formal policy people will develop their own<br />
individual <strong>and</strong> differing st<strong>and</strong>ards of practice.<br />
6. CONCLUSIONS<br />
Developing Maintenance culture is needed in organization. This is pupose to raise awareness<br />
important of maintenance in keep inside for each member that managing public asset. The<br />
effectiveness of maintenance depend base on the human factor to increase knowledge <strong>and</strong><br />
experience of workers in solving problems. Thus internal environment between management <strong>and</strong> staff<br />
must exist with sharing of ideas, beliefs, <strong>and</strong> values for each other. The development maintenance<br />
culture can make change of cultural work from traditional maintenance work based on reactive activity<br />
to productive activity. Nine important culture element from literature review that contribute to<br />
successful developing maintenance culture, which include leadership, communication, teamwork,<br />
training <strong>and</strong> education, motivation, recognition <strong>and</strong> reward, policy, involvement <strong>and</strong> empowerment <strong>and</strong><br />
organization structure.
REFERENCES<br />
274<br />
International <strong>Building</strong> & <strong>Infrastructure</strong> Technology Conference<br />
7-8 June 2011, Vistana Hotel, Penang, Malaysia<br />
Abdul Hakim Mohammed. (2007). Capacity <strong>Building</strong> <strong>and</strong> Sustainability in Asset <strong>and</strong> Facility<br />
Management. Proceeding of the National Asset <strong>and</strong> Facilities Management (NAFAM) Convention.<br />
Kuala Lumpur, Malaysia, 13 August.<br />
ACSNI (1993. Organising for Safety. Advisory Committe on the Safety of Nuclear Installations. Human<br />
Factors Study Group, Third Report. HSE Books, Suffolk.<br />
AD Telang <strong>and</strong> Amit Telang. (2010). Comprehensive Maintenance Management, Policies, Strategies<br />
<strong>and</strong> Options. PHI Learning Private Limited, New Delhi, ISBN 9788120339538. pp 1-173.<br />
Adenuga, O.A, Odusami, K.T, Faremi & J.O. (2007). Assessment of Factors Affecting Maintenance<br />
Management of Public Hospital <strong>Building</strong>s in Lagos State, Nigeria. The Construction And <strong>Building</strong><br />
Research Conference of The Royal Institution of Chartered Surveyors. Georgia Tech, Atlanta USA, 6-<br />
7 September 2007.<br />
Albert H.C. Tsang. (2002). Strategic Dimensions of Maintenance Management. Journal of Quality<br />
in Maintenance Engineering. Vol. 8 No. 1. pp. 7-39.<br />
Al-Hamad, S.Al-Mubaiyadh & T.Mamoud.(1995). Assessment of Problem Facing The <strong>Building</strong><br />
Maintenance Industry in Saudi Arabia. The Fourth Saudi Engineering Conference, Vol 1.<br />
Annies, A. (2007). “Current Issues And Challenges in Managing Government’s Assets <strong>and</strong> Facilities”,<br />
Proceeding of the National Asset <strong>and</strong> Facilities Management (NAFAM) Convention, Kuala Lumpur,<br />
Malaysia, 13 August.<br />
Arazi Idrus, Mohd Faris Khamidi & Olanrewaju Abdul Lateef. (2009). Value –Based Maintenance<br />
Management Model for University <strong>Building</strong>s in Malaysia-A Critical Review, Journal of <strong>Sustainable</strong><br />
Development. Volume 2. No.3.pp 127-133.<br />
Brendan J Smith (2006), Optimising the Maintenance Function - It’s Just as Much About the People as<br />
the Technical Solution, WCEAM 2006, No of Paper 095.<br />
Bubshait, K. A., (2000), Developing Quality Culture for Successful Quality Improvement Programme,<br />
First Gulf International, Exibition <strong>and</strong> Workshops.<br />
Carol R. Paris, Eduardo Salas <strong>and</strong> Janis A. Cannon-Bowers. (2000). Teamwork in Multi-Person<br />
<strong>Systems</strong>: A Review <strong>and</strong> Analysis, Journal Ergonomic, Vol. 43, No. 8, pp 1052-1075, ISSN 0014-0139<br />
print/ISSN 1366-584, Taylor & Francis Ltd.<br />
Deming, W.E. 1986. Out of the Crisis. Cembridge, MA: MIT Press.<br />
Dianne Parker, Matthew Lawrie <strong>and</strong> Patrick Hudson. (2006). A Framework for Underst<strong>and</strong>ing the<br />
Development of Organisational Safety Culture, Journal Safety Science. 44(2006). pp 551-562.<br />
Diaz-Cabrera, D. Hern<strong>and</strong>ez, E.-Fernaud <strong>and</strong> Isla-Diaz, R.(2007). An Evaluation of a New Instrument<br />
to Measure Organisational Safety Culture Values <strong>and</strong> Practices, Journal Accident Analysis <strong>and</strong><br />
Prevention. 39 (2007). pp 1202-1211.<br />
Douglas A. Wiegmann, Hui Zhang, Terry von Thaden, Gunjan Sharma, <strong>and</strong> Alyssa Mitchell. (2002).<br />
Safety Culture: A Review, Technical Report ARL-02-3/FAA-02-2, Prepared for Federal Aviation<br />
Administration Atlantic City International Airport, NJ, Contract DTFA 01-G-015.<br />
Eckhardt, R. (1996). Practitioner’s Influence on Safety Culture. Professional Safety. 41(7), 23-26.<br />
Emma Marinie Ahmad Zawawi & Syahrul Nizam Kamaruzzaman. (2009). Personnel Characteristics of<br />
Maintenance Practice: A Case of High-Rise Office <strong>Building</strong>s in Malaysia, University Technology MARA<br />
& University of Malaya, Journal of <strong>Sustainable</strong> Development. Vol 2 No 1, pp 111-116.<br />
Harold Koontz, Cyril O'Donnell. (1972). Principles of Management: An Analysis of Managerial<br />
Functions, McGraw-Hill. ISBN 0070353328.<br />
HSC (Health <strong>and</strong> Safety Commission). (1993). Third report: Organizing for Safety.<br />
ACSNI Study Group on Human Factors. HMSO, London.<br />
Jalal A. Al-Khatam. (2003). <strong>Building</strong>s Maintenance Cost, Construction Engineering <strong>and</strong> Management,<br />
King Fahd University of Petroleum & Minerals, Dhahran, Saudi Arabia.<br />
Juran & Gryna, (1993), Quality planning <strong>and</strong> analysis, McGraw – Hill.<br />
M.C. Eti, S.O.T. Ogaji & S.D. Probert, (2006). Impact of Corporate Culture on Plant Maintenance in<br />
Negerian Electric-Power Industry, Journal, Energy. 83, pp 299-310.
275<br />
International <strong>Building</strong> & <strong>Infrastructure</strong> Technology Conference<br />
7-8 June 2011, Vistana Hotel, Penang, Malaysia<br />
Mahmood Nazar Mohamed. (2005). Pengantar Psikologi Satu Pengenalan Asas kepada Jiwa dan<br />
Tingkah Laku Manusia. Kuala Lumpur: Dewan Bahasa dan Pustaka<br />
Manual Pengurusan Aset Menyeluruh Kerajaan, Kerajaan Malaysia, Pekeliling Am Bilangan 1 Tahun<br />
2009.<br />
Mark C. Eti, S. O. T. Ogaji <strong>and</strong> S. D Probert. (2006). Strategic Maintenance Management in Nigerian<br />
Industries. Applied Energy, Issue 3, pp 211-277.<br />
Miles, D., <strong>and</strong> Syagga, P. (1987). <strong>Building</strong> Maintenance: A Management Manual. Intermediate<br />
Technology Publications Ltd.<br />
Mohd Hizam, H. dan Zahir, M.M. (2002). Pengurusan Organisasi,Kuala Lumpur: Mc-Graw Hill<br />
(Malaysia) Sdn. Bhd.<br />
Mohd Saidin Misnan, Abdul Hakim, Wan Yusoff Wan Mahmood, Syamsul Hendra Mahmud <strong>and</strong> Mat<br />
Naim Abdullah (2008), International Conference on Built Environment in Developing Countries<br />
(ICBEDC 2008).<br />
Mohd Saidin Misnan (2009), Pembangunan Budaya Keselamatan Dalam Pembinaan. Tesis PHD,<br />
Universiti Teknologi Malaysia.<br />
Nalini Govindaraju <strong>and</strong> Bonnie F. Daily, (2004), Motivating Employees For Environmental<br />
Improvement, Journal Industrial Management & Data <strong>Systems</strong>, Valume 104, Number 4, pp 364-372,<br />
Emerald Group Publishing.<br />
Nasfryzal Carlo, Eva Rita, Abdul Hakim Mohammed <strong>and</strong> Muhd Zaimi Abd Majid. (2006). Budaya<br />
Kualitas (Mutu) Dalam Perusahaan Jasa Konstruksi. Conference Proceeding ICCI2006.<br />
Nations Centre for Human Settlements, (1993). The Maintenance of <strong>Infrastructure</strong> <strong>and</strong> its Financing<br />
<strong>and</strong> Cost Recovery, UN-HABITAT, 1993, HS/285/93E, ISBN/92-1-131209-4.<br />
Nonaka, I. & Takeuchi, H. (1995). The knowledge-creating company. New York: Oxford University<br />
Press<br />
O.S. Onohaebi <strong>and</strong> Y.O. Lawal. (2010). Poor Maintenance Culture; The Bane to Electric Power<br />
Generation in Nigeria, Journal of Economics <strong>and</strong> Engineering, ISSN: 2078-0346.<br />
Olosanjo Akanji Bamgboye. (2006). Capacity <strong>Building</strong> as Strategy for <strong>Sustainable</strong> <strong>Infrastructure</strong>s<br />
Maintenance Culture, National Engineering Conference. Nigerian Society of Engineers, Gateway.<br />
Abeokuta, Negeria<br />
Ostrom, L, Wilhelmsen, C. And Kaplan, B. (1993). Assessing Safety Culture. Journal of Nuclear<br />
Safety. 34(2), pp 163-173<br />
Pariyaporn Tungkunanan, Punnee Leekitchwatana, Narong Pimsarn And Siripunchumnum. (2008)<br />
Strategic Plan for Developing Quality Culture at Eastern School of the Office of Vocational Education<br />
Commission, Thail<strong>and</strong>, ABAC Journal Vol. 28, No. 2 (May-August 2008, Pp.52-63).<br />
Paschal RT. (1992). Athos A. The Art of Japanese Management. London: Penguin Books.<br />
Rita, E.(2003). Pembangunan Budaya Kualiti dalam Firma Pembinaan Di Indonesia, Tesis PHD.<br />
Universiti Teknologi Malaysia.<br />
Stephanus Johannes Viljoen dan Cornelis Cristo van Waveren. (2008). An Improved Model for<br />
Quantifying an Organisational Quality Culture, PICMET 2008 Proceedings. 27-31 July, Cape Town,<br />
South Africa. Page 1781-1789.<br />
Suwaibatul Islamiah Abdullah Sani, Abdul Hakim Mohammed, Fatin Syazwina, Shukor, Sheelah<br />
Sivanathan <strong>and</strong> Mariah Awang. (2010). Isu Budaya Penyenggaraan Aset Tak Alih Kerajaan,<br />
Conference Proceeding SSPNS2010, Pulau Pinang.<br />
Thiagarajan, T. <strong>and</strong> Zairi, M. (1997). A Review of Total Quality Management in Practice:<br />
Underst<strong>and</strong>ing the Fundamentals Through Examples of Best Practice Application-Part I. The TQM<br />
Magazine, 9 (4), 270-286.<br />
Turner B.A. (1991). The Development of a Safety Culture, Journal of Chemistry <strong>and</strong> Industry, No. 7,<br />
pp.241-243.<br />
Ucapan Bajet Tahun 2005 -2008<br />
Wan Yusoff Wan Mahmood, Abdul Hakim Mohammed, Mohd. Saidin Misnan, Zakaria Mohd. Yusof,<br />
Ahmadon Bakri (2006), Development of Quality Culture in The Construction Industry. Conference<br />
Proceeding ICCI2006.
T159<br />
276<br />
International <strong>Building</strong> & <strong>Infrastructure</strong> Technology Conference<br />
7-8 June 2011, Vistana Hotel, Penang, Malaysia<br />
PERFORMANCE OF SAND-CEMENT BLOCK WITH KENAF (HIBISCUS<br />
CANNABUNUS L.) FIBER<br />
Aimi Munirah Jalilluddin 1 , Kartini Kamaruddin 2<br />
1, 2 Faculty of Civil Engineering, Universiti Teknologi Mara, Malaysia<br />
1 aimi_munirah86@yahoo.com 1 , 2 ce_kartini@yahoo.com 2<br />
ABSTRACT: There is no doubt that issues relating to sustainability <strong>and</strong> green technology have been<br />
the main key of concern within the industry in the 21 st century. Moreover, there is encouragement from<br />
the 10 th Malaysian Plan (RMK-10) to employ sustainability <strong>and</strong> ‘green’ building design <strong>and</strong> technology<br />
in designing buildings or structures in Malaysia. Hence, a need in developing sustainable materials for<br />
the construction industry is on the dem<strong>and</strong>s. Interests on natural fiber can be seen progressively<br />
growing in Malaysia since it possesses ecological <strong>and</strong> economical value compared to synthetic fibers.<br />
Investigations have been actively conducted to incorporate these fibers (i.e. coir fiber <strong>and</strong> palm fiber)<br />
into cementitious materials <strong>and</strong> resulted promising results to be adopted into building materials.<br />
Meanwhile, masonry units have been seen to be used widely in the construction field <strong>and</strong> utilising<br />
agricultural products into these products may be capable of widening the applications of the natural<br />
fibers. Therefore, the present paper investigates on the compressive strength properties of s<strong>and</strong>cement<br />
masonry units (i.e. blocks) by incorporating kenaf (Hibiscus cannabinus L.) fiber with various<br />
percentages (0% - 2% by cement weight) with a cement to s<strong>and</strong> batching system of 1:2.5. A total<br />
number of 60 blocks with the dimension of 360mm x 180mm x 60mm were casted <strong>and</strong> air-cured in<br />
room temperature of 29°C. In this study, fixed water to cement (w/c) ratio of 0.5 <strong>and</strong> the length of fiber<br />
by 25mm long was specified throughout the study. The samples were evaluated based on the<br />
compressive strength taken at 7 <strong>and</strong> 28 days. It can be seen that the incorporation of 0.5% kenaf fiber<br />
was the optimum value in achieving the highest compressive strength. Furthermore, higher<br />
percentages of kenaf fiber were also found to reduce the self-weight of the block samples hence a<br />
lighter building material can be produced.<br />
Keywords: compressive strength, masonry units, natural fiber, kenaf, sustainability<br />
1. INTRODUCTION<br />
Masonry unit is a common material that has been widely used within the construction industry to build<br />
structures of housing (i.e. low <strong>and</strong> medium rise construction) <strong>and</strong> non-housing (i.e. industrial,<br />
commercial <strong>and</strong> educational buildings) sectors (Hendry, 2001). Its application varies to the<br />
requirements needed for a particular element which includes performing as external or internal walls<br />
or can also be functional for load bearing <strong>and</strong> non-load bearing walls. Employing masonry units has<br />
several advantages including economical construction without heavy <strong>and</strong> expensive plant, low cost,<br />
low maintenance, good durability <strong>and</strong> having desirable aesthetical value to the structure (Hendry,<br />
2001; Sousa et al., 2004). Meanwhile, it has been a current trend in today’s construction technology to<br />
employ ‘green’ <strong>and</strong> sustainability design techniques for proposed buildings where it is also being<br />
urged in the 10 th Malaysian Plan (RMK-10). In corresponding to the matter, numerous studies have<br />
progressively investigated on the potential value to adopt <strong>and</strong> utilize environmental-friendly materials<br />
into practical products for the usage of the industry. Moreover, natural fibers (i.e. coconut husk, sisal,<br />
palm, bamboo, sugarcane, wood <strong>and</strong> vegetable fiber) have been gaining significant interests to be<br />
explored as alternative raw materials to synthetic or inorganic fibers due to the benefits gained<br />
including being cheaper, lighter, renewable, non-abrasive <strong>and</strong> superior in terms of health <strong>and</strong> safety<br />
issues (Wambua et. al., 2003; Joshi et. al., 2004; Mahat et al., 2010; Ramli <strong>and</strong> Dawood, 2010). It has<br />
been observed from previous studies that incorporating fibers into cementitious materials serves the<br />
principle of providing reinforcement within the matrix which increases the tensile strength, increasing<br />
the fracture toughness, increase fracture roughness, modifying properties of elastic modulus <strong>and</strong><br />
reducing the density (Kolop et al., 2008). Furthermore, it can be further described that the natural
277<br />
International <strong>Building</strong> & <strong>Infrastructure</strong> Technology Conference<br />
7-8 June 2011, Vistana Hotel, Penang, Malaysia<br />
fibers was found to be comparable to the properties of synthetic fibers (Wambua et al., 2003).<br />
Meanwhile, incorporation of the natural fibers into cement pastes, mortar <strong>and</strong> concrete still remains a<br />
central focus that can be investigated to utilize agricultural products as much as possible by widening<br />
the applications of such materials (Ramli <strong>and</strong> Dawood, 2010). Hence, this study focuses to evaluate<br />
on the compressive strength development of s<strong>and</strong>-cement block by incorporating with various<br />
percentages of kenaf (Hibiscus cannabinus L.) fiber (0% - 2% by cement weight) at 7 <strong>and</strong> 28 days.<br />
Moreover, the density of the samples was also determined to observe the correlation of kenaf fiber<br />
inclusion into the s<strong>and</strong>-cement blocks.<br />
2. EXPERIMENTAL PROGRAMME<br />
This paper focuses to evaluate the compressive strength performance of s<strong>and</strong>-cement block<br />
incorporated with different proportions of kenaf fiber. The block samples were prepared by employing<br />
a mortar mixture of cement to s<strong>and</strong> (C:S) batching system of 1:2.5 <strong>and</strong> was further divided into six (6)<br />
groups indicating the various percentages of kenaf fiber (0% - 2% by cement weight) used in the<br />
study. The density of the blocks was also considered for assessment to observe the influence of kenaf<br />
fiber to the weight gained by the s<strong>and</strong>-cement block samples.<br />
2.1 MATERIALS<br />
The cement used in the mortar mixtures was Ordinary Portl<strong>and</strong> Cement (OPC) of Type I, a product<br />
manufactured by Tasek Corporation Berhad. The chemical compositions of OPC used in this study<br />
are shown in Table 1. Meanwhile, the fine aggregate used was well-graded s<strong>and</strong> classified through<br />
the sieve analysis in accordance to BS EN 933-1: 1997 where the maximum size of fine aggregate<br />
particles used was 5mm. The s<strong>and</strong> was sieved in order to separate the deleterious <strong>and</strong> larger particles<br />
in presence of bulk form that could affect the strength. The type of natural fiber used was bast-typed<br />
kenaf fiber supplied by Everise Crimson (M) Sdn. Bhd. which was combed initially to loose the<br />
‘contact’ between each fiber. The fibers were then measured to 25mm in length <strong>and</strong> cut into short<br />
fibers for mixing into the mortar paste.<br />
Table 1. Chemical Compositions of Ordinary Portl<strong>and</strong> Cement<br />
Chemical composition (%)<br />
Material<br />
SiO2 Al2O 3 Fe2O 3 MgO CaO Na2O K2O LOI<br />
Portl<strong>and</strong> cement 15.05 2.56 4.00 1.27 72.17 0.08 0.41 1.33<br />
2.2 Mix Proportions<br />
The mix proportion for block samples casted was shown in Table 2 where allocation of six (6) groups<br />
were determined by the different percentages of kenaf fiber incorporated into the mix (0% - 2% by<br />
cement weight). Meanwhile, fixed water to cement (w/c) ratio of 0.5 <strong>and</strong> fixed length of fiber of 25mm<br />
were also specified for the study. The kenaf fiber was added into the mortar paste by the addition<br />
principle where the fiber inclusion into the mixes does not modify the cement <strong>and</strong> s<strong>and</strong> content.<br />
C:S ratio C S W<br />
Table 2. Mix Design Proportions<br />
Kenaf (kg/m 3 )<br />
0% 0.5% 1% 1.5% 2%<br />
1:2.5 513 1282 256 - 2.57 5.13 7.70 10.26<br />
Note: C-cement, S-s<strong>and</strong>, W-water<br />
2.3 FABRICATION OF SAMPLES<br />
The study was carried out by preparing a total of 72 s<strong>and</strong>-cement block samples with the dimensions<br />
of 360mm x 180mm x 600mm. The method employed during the mixing stage of the mortar paste was<br />
a technique carried out by Kolop et al. (2008) where the constituents (i.e. s<strong>and</strong> <strong>and</strong> cement <strong>and</strong> fibers)<br />
were mixed together for several minutes to ensure that the materials were evenly dispersed before
278<br />
International <strong>Building</strong> & <strong>Infrastructure</strong> Technology Conference<br />
7-8 June 2011, Vistana Hotel, Penang, Malaysia<br />
adding the water. Nevertheless, the approach also takes into account by allowing the fiber to be<br />
saturated in water for 30 minutes <strong>and</strong> assuming that the fibers are in a saturated surface-dry (SSD)<br />
condition. Therefore, fibers will be prevented to absorb water from the mix, thus adjustment to the<br />
water to cement (w/c) ratio is negligible. The mortar paste was then casted into the steel moulds <strong>and</strong><br />
vibrated. After 24 hours, the moulds were demoulded <strong>and</strong> air-cured in room temperature of 29°C until<br />
the day of testing.<br />
2.4 TEST METHODS<br />
a. Compressive Strength<br />
The compressive strength was conducted in accordance to BS EN 772-1: 2000. A number of six (6)<br />
block samples with dimensions 360mm x 180mm x 600mm were used for the strength performance<br />
assessment at the Concrete Laboratory of Civil Engineering Faculty, UiTM Shah Alam. The test<br />
conducted was performed by using the Compression Auto Test machine which has the capacity of<br />
3000 kN <strong>and</strong> the rate of load employed was 2.75 kN/m. The block samples were evaluated on the<br />
compressive strength at 7 <strong>and</strong> 28 days of air drying.<br />
3. RESULTS AND ANALYSIS<br />
3.1 COMPRESSIVE STRENGTH<br />
Figure 1 shows the average value obtained from six (6) samples tested on the strength performance<br />
of the s<strong>and</strong>-cement blocks incorporated with different percentages of kenaf fiber at 7 <strong>and</strong> 28 days. It<br />
can be observed that the highest compressive strength at 28 days gained by the s<strong>and</strong>-cement blocks<br />
was achieved by incorporating 0.5% kenaf fiber with the value of 22.21N/mm 2 . In comparison of 0.5%<br />
sample to the control sample (0% kenaf fiber), there is a slight increase of strength development of<br />
about 3.3%.<br />
Figure 1. Compressive Strength of S<strong>and</strong>-Cement Blocks Incorporated with Kenaf Fiber at 7 <strong>and</strong> 28<br />
days<br />
Meanwhile, it can also be stated that higher incorporation of fiber content shows a higher reduction on<br />
the compressive strength of s<strong>and</strong>-cement blocks where fiber content exceeding 0.5% of kenaf fiber<br />
shows a rapid drop between 14% - 30% trend on the strength development. This study appears to be<br />
parallel to the findings of Kolop et al. (2008) where the compressive strength reduces with higher<br />
content of oil palm empty fruit bunches (EFB) fiber. In fact, this study is also in line with Ismail (2007)<br />
where remarked on every 0.5% addition of fiber resulted to strength reduction of approximately 10% at<br />
28 days. Furthermore, the strength improvement from day 7 to day 28 illustrates a rapid increase<br />
between 11% – 24% can be seen in the strength development. The following Figure 2 shows the<br />
relationship between the compressive strength <strong>and</strong> the different percentages of fiber inclusion where it<br />
shows clearly that a slight increase occurs from 0% to 0.5% fiber incorporation, rapid drop from 0.5%<br />
to 1.0% <strong>and</strong> a gradual decrease in the strength development with fiber addition exceeding 1.0%.
279<br />
International <strong>Building</strong> & <strong>Infrastructure</strong> Technology Conference<br />
7-8 June 2011, Vistana Hotel, Penang, Malaysia<br />
Hence, it can be stated that the optimum compressive strength is practically obtained with lower<br />
percentages of fiber where uniform distribution in the mortar matrix is mainly achieved (Kriker et. al,<br />
2005).<br />
Figure 2. Relation between Compressive Strength <strong>and</strong> Fiber Content at 7 <strong>and</strong> 28 days<br />
It can be stated that the reduction in the compressive strength is attributed by the presence of<br />
additional voids which exist in the mix due to presence of fiber which may lead to reducing the bonding<br />
between the cement matrix <strong>and</strong> disintegration (Djoudi <strong>and</strong> Khenfer, 2005; Ramli <strong>and</strong> Dawood, 2010).<br />
In this state, porosity will also be developed which gives direct impact to the strength development<br />
resulting to the reduction of strength (Djoudi <strong>and</strong> Khenfer, 2005). In fact, the occurrence of voids within<br />
the cement matrix may also be contributed by insufficient compaction due to high fiber content (Ismail,<br />
2007). Furthermore, presence of fiber in the matrix is vulnerable to axial load hence it does not play a<br />
significant factor in the development of strength performance (Kolop et al, 2008). In addition, the<br />
strength gained by s<strong>and</strong>-cement block of 0.5% fiber inclusion can be considered to fall within the<br />
s<strong>and</strong>-cement brick category of 20N/mm 2 . Meanwhile, s<strong>and</strong>-cement blocks incorporated with fiber<br />
exceeding 0.5% is comparable to s<strong>and</strong>-cement brick category of 15N/mm 2 - 20N/mm 2 in reference to<br />
BS 1180: 1972. Therefore, it can be functional to be applied as an infill of non-load bearing blocks<br />
within the walls of a structure or as external walls of cavity walls, solid construction <strong>and</strong> free st<strong>and</strong>ing<br />
walls. In fact, the results obtained for the s<strong>and</strong>-cement blocks is also comparable to clay bricks of<br />
class 2 <strong>and</strong> 3 (load-bearing brick) whilst class 2A <strong>and</strong> 2B (facing or common brick) or 3A <strong>and</strong> 3B (loadbearing<br />
or facing brick) when compared to calcium silicate bricks as stipulated in BS 3921: 1985 <strong>and</strong><br />
BS 187: 1978 respectively (Kamaruddin, 2000). Hence, s<strong>and</strong>-cement blocks incorporated with kenaf<br />
fiber can be seen to have the potential to replace or act as a substitute to s<strong>and</strong>-cement bricks, clay<br />
bricks <strong>and</strong> calcium silicate bricks for building materials.<br />
3.2 DENSITY<br />
Figure 3 shows the effect of different percentages of kenaf fiber to the density of s<strong>and</strong>-cement blocks<br />
at 7 <strong>and</strong> 28 days. It can described that the inclusion of kenaf fiber in the cement matrix resulted<br />
lowering the density of the s<strong>and</strong>-cement block samples in comparison with the control samples. The<br />
reduction in density with lower fiber content of 0.5% - 1.5% kenaf fiber only gave a slight effect<br />
between 0.5% - 2% compared to higher inclusion of kenaf fiber by 2% which shows a higher gap of<br />
7% density reduction to the control samples. Hence, it can be stated that the density of s<strong>and</strong>-cement<br />
blocks decreases as the content of fibers increases.
280<br />
International <strong>Building</strong> & <strong>Infrastructure</strong> Technology Conference<br />
7-8 June 2011, Vistana Hotel, Penang, Malaysia<br />
Figure 3. Density of S<strong>and</strong>-Cement Blocks Incorporated with Kenaf Fiber 28 days<br />
The reduction in the density can be considered as the result of the addition of kenaf fiber into the<br />
s<strong>and</strong>-cement blocks where the fiber content reduces the amount of s<strong>and</strong>-cement matrix within the<br />
volume per unit blocks hence dominating the space of the matrix by filling up the voids with fiber.<br />
Therefore, the more fiber is included into the mix subsequently replaces the constituents (i.e. s<strong>and</strong> <strong>and</strong><br />
cement) with an additional factor of an external element that consumes the original space of the<br />
cementitious matrix. In fact, the natural characteristic of the fiber itself as a lightweight material also<br />
contributes in reducing the density of s<strong>and</strong>-cement blocks. On the other h<strong>and</strong>, the inclusion of fiber<br />
within the matrix may also result to insufficient compaction that might have been occurred <strong>and</strong><br />
achieving the maximum density is possible (Ismail, 2007). Moreover, the lightweight factor of the s<strong>and</strong>cement<br />
blocks can be expected to reduce the load from the structure to the foundation element of a<br />
structure. In fact, heavy density of materials or products gives disadvantages when it is applied as a<br />
building material for construction. The increase in density hence results to difficulties of working with<br />
heavy loads during transportation <strong>and</strong> h<strong>and</strong>ling. Moreover, lower density may give significant benefits<br />
in terms of load-bearing elements where the total weight of the building will be lower that corresponds<br />
to reduction of the size of foundations hence permits low load-bearing capacity to the ground (Neville,<br />
1995).<br />
Meanwhile, Figure 4 shows the relationship between the density <strong>and</strong> the different percentages of fiber<br />
content. It can be observed that gradual reduction in the density occurs when incorporating kenaf fiber<br />
of 0.5% to 1.5% into the cement matrix whilst, a rapid drop of density took place of fiber inclusion of<br />
more than 1.5%. The best fit-line to show the correlation between both parameters was by the<br />
polynomial of power three where the magnitude correlation coefficient, (R) of the curve shown is<br />
0.99% <strong>and</strong> 0.993% for 7 <strong>and</strong> 28 days respectively.<br />
Figure 4. Relation between Density <strong>and</strong> Fiber Content at 7 <strong>and</strong> 28 days
281<br />
International <strong>Building</strong> & <strong>Infrastructure</strong> Technology Conference<br />
7-8 June 2011, Vistana Hotel, Penang, Malaysia<br />
Figure 5 shows the regression analysis correlating the density to the compressive strength of s<strong>and</strong>cement<br />
block incorporated with kenaf fiber. The best fit-line to show the correlation between the two<br />
(2) parameters was by the polynomial of power three where the magnitude correlation coefficient, (R 2 )<br />
of the curve shown is 0.99%. It indicates that the correlation between both elements is good.<br />
It can be described from Figure 5 that the highest compressive strength gained by the s<strong>and</strong>-cement<br />
block incorporated with kenaf fiber was discovered when the density of the block was not in the<br />
maximum state. This condition can be explained by the presence of fiber within the cementitous<br />
material which may have a significant influence to the cement matrix whereby it may improved the<br />
bonding between the matrix <strong>and</strong> other elements (i.e. compressive strength <strong>and</strong> density) of the cement<br />
matrix thus the results obtained from this study is out of the norm.<br />
Figure 5. Relation between Density <strong>and</strong> Compressive Strength at 28 days<br />
4. CONCLUSIONS<br />
The following conclusion can be made from the study of s<strong>and</strong>-cement block incorporated with various<br />
proportions of kenaf fiber where:<br />
1. Incorporation of 0.5% kenaf fiber in s<strong>and</strong>-cement blocks is considered the optimum value<br />
of kenaf fiber inclusion.<br />
2. Incorporation of more than 0.5% kenaf fiber does not show any significance to the<br />
development of compressive strength.<br />
3. Incorporation of high content of kenaf fiber resulted in the reduction of s<strong>and</strong>-cement block<br />
density.<br />
ACKNOWLEDGEMENT<br />
The authors would like to thank the Faculty of Civil Engineering, Universiti Teknologi MARA (UiTM)<br />
Shah Alam for supporting this study <strong>and</strong> Everise Crimson (M) Sdn. Bhd. for supplying the materials for<br />
the investigation.<br />
REFERENCES<br />
BS 187 (1978). Specification for Calcium Silicate (S<strong>and</strong>lime <strong>and</strong> Flintlime) Bricks<br />
BS EN 771-3 (2003). Specification for Masonry Units – Part 3: Aggregate Concrete Masonry Units<br />
Dense <strong>and</strong> Light-weight Aggregates)<br />
BS 3921 (1985). Specification for Clay Bricks
282<br />
International <strong>Building</strong> & <strong>Infrastructure</strong> Technology Conference<br />
7-8 June 2011, Vistana Hotel, Penang, Malaysia<br />
BS EN 772-1 (2000). Methods of Test for Masonry Units - Part 1: Determination of Compressive<br />
Strength<br />
BS EN 933-1 (1997). Tests for Geometrical Properties of Aggregates - Part 1: Determination of<br />
Particle Size Distribution – Sieving Method<br />
Djoudi, A. <strong>and</strong> Khenfer, M. M. (2005). Structural <strong>and</strong> Rheological Characterization of Vegetable Fibers<br />
Reinforced Concrete Plaster, 11 th International Conference on Fracture (ICF XI), Turin, Italy, pp 20-25<br />
Hendry, A. W. (2001). Masonry Walls: materials <strong>and</strong> construction. Construction <strong>and</strong> <strong>Building</strong> Materials,<br />
15, pp 323 – 330<br />
Ismail, M. A.(2007). Compressive <strong>and</strong> Tensile Strength of Natural Fibre-reinforced Cement base<br />
Composites, Al-Rafidain Engineering, Vol 15(2), pp 42-51<br />
Joshi, S. V., Drzal, L. T., Mohanty, A. K. <strong>and</strong> Arora, S. (2004). Are Natural Fiber Composites<br />
Environmentally Superior to Glass Fiber Reinforced Composites, Compos Part A, Applied Science,<br />
Vol 35, pp 371-376<br />
Kamaruddin, K. (2000). Course Note on Construction Materials- 2nd Edition for Diploma in Civil<br />
Engineering, Universiti Teknologi MARA, Malaysia, pp 169 - 1888<br />
Kolop, R., Haziman, W. I. M., <strong>and</strong> Eng, J. W. (2008). Properties of Cement Blocks Containing High<br />
Content of Oil Palm Empty Fruit Bunches (EFB) Fibres, In: International Conference on Civil<br />
Engineering Practice (ICCE’08), Kuantan<br />
Kriker, A., Debicki, G., Bali, A., Khenfer, M. M. <strong>and</strong> Chabannet, M. (2005). Mechanical Properties of<br />
Date Palm Fibres <strong>and</strong> Concrete Reinforced with Date Palm Fibres in Hot-Dry Climate, Cement <strong>and</strong><br />
Concrete Composites, Vol. 27, pp 554 – 564<br />
Mahat, N., Yaacob, Z., Mastan, N. F., Abd Rashid, A. F., Zainordin, Z., Husin, H. N., Khalil, N., Mat<br />
Noor, M. N., Wan Abdullah, W. F. I., Abd Rahman, N. A. <strong>and</strong> Ahmad, S. (2010). Comparison Study on<br />
Oil Palm Trunk <strong>and</strong> Oil Palm Fruit Bunch Fibre Reinforced Laterite Bricks, Modern Applied Science, 4<br />
(7), pp 119-129<br />
Neville, A. M. (1995). Properties of Concrete, 4 th Edition, Pearson Education Limited, London, pp 688 -<br />
691<br />
Ramli, M. <strong>and</strong> Dawood, E. T. (2010). Effects of Palm Fiber on the Mechanical Properties of<br />
Lightweight Concrete Crushed Brick, American Journal of Engineering <strong>and</strong> Applied Sciences, Vol. 3<br />
(2), pp 489-493<br />
Sousa, H., Carvalho, A. <strong>and</strong> Melo, A. (2004). A New Sound Insulation Lightweight Concrete Masonry<br />
Block: Design <strong>and</strong> Experimental Characterization, 13 th International brick <strong>and</strong> Block Masonry<br />
Conference, Amsterdam, July 4–7<br />
Wambua, P., Ivens, J. <strong>and</strong> Verpoest, I. (2003). Natural Fibres: Can They Replace Glass in Fibre<br />
reinforced Plastics?, Composites Science <strong>and</strong> Technology, Vol 63, pp 1259 -1264
T163<br />
283<br />
International <strong>Building</strong> & <strong>Infrastructure</strong> Technology Conference<br />
7-8 June 2011, Vistana Hotel, Penang, Malaysia<br />
DATA CENTER OPERATION OPTIMIZATION USING COMPUTATIONAL FLUID<br />
DYNAMICS (CFD).<br />
Rawnee Ho 1 <strong>and</strong> Dr.M.R Ismail 2<br />
1,2 Universiti Sains Malaysia, Pulau Pinang, Malaysia<br />
1 rawnee@yahoo.com , 2 rodzi@usm.my<br />
ABSTRACT: In the past the Data Centers design for ventilation <strong>and</strong> air conditioning have been<br />
determined by the requirements of Computer kW per unit. The knowledge about the air flow<br />
patter/situation inside the Data Centers was unable to carry out because a precise experimental<br />
determination of the essential flow parameters is only possible with expensive measurement<br />
equipment. Computational fluid dynamics (CFD) can play important roles in Data Centers design/study<br />
by providing complementary information about the Data Center buildings environmental performance<br />
Computational fluid dynamics (CFD) simulation <strong>and</strong> modeling is currently the most details Data<br />
Centers ventilation <strong>and</strong> comfort analysis method widely available to study the air flow pattern.<br />
Integration of CFD will enable us to get an accurate prediction of the Data Centers building air flow<br />
pattern. Many of the calculation <strong>and</strong> assumptions is eliminated with the help of complementary model<br />
available on the CFD simulation study. A case study will be carry out to study the air flow pattern <strong>and</strong><br />
describe the outcome of CFDs finding. This will be an opportunity on energy saving for Data Centers<br />
operation optimization. This paper illustrates a typical dynamic approach on using CFD software to<br />
study the 3D air flow pattern of the Data Centers.<br />
Keywords: definition, computational fluid dynamic (cfd), data centers (dc), tileflow, airflow,<br />
raised floor & air flow model<br />
1. INTRODUCTION<br />
Computational fluid dynamics program provide complementary information about the performance of<br />
buildings. Innovative Research Inc. programs, such as Tileflow TM a powerful three dimensional<br />
software tool for simulating cooling performance of data centers. It uses the state-of-the-art<br />
computational fluid dynamics (CFD) techniques, <strong>and</strong> is applicable to both raised-floor <strong>and</strong> non-raisedfloor<br />
data centers.<br />
TileFlow has been specifically designed to give the user the ultimate ease-of-use <strong>and</strong> speed in setting<br />
up the data center model <strong>and</strong> examining the results. In addition, TileFlow has an unmatched speed in<br />
performing the calculations. We believe--<strong>and</strong> this has been confirmed by many experts in the fieldthat<br />
no other CFD software product in the HVAC area or even other fields has the ease-of-use <strong>and</strong><br />
speed of TileFlow. Further, TileFlow presents the simulation results in a variety of colorful <strong>and</strong><br />
attractive ways, making it an excellent communication tool (in addition to a reliable analysis tool).<br />
TileFlow is being used worldwide by data center managers, equipment manufacturers, architectural<br />
<strong>and</strong> engineering firms, <strong>and</strong> consulting companies.<br />
CFD is a very powerful tool for simulation of natural ventilation driven by winds effect, stack effect, or<br />
both. CFD also can easily determine the temperature distribution <strong>and</strong> convective heat transfer<br />
coefficient with the help of building energy simulation programs. With the help of building energy<br />
simulation, it will able to provide critical information such as air-conditioning loads <strong>and</strong> surface<br />
temperature. This information is important for the success of this study, without the building energy<br />
simulation programs, the CFD programs will only able to compute results based on estimated<br />
boundary.
284<br />
International <strong>Building</strong> & <strong>Infrastructure</strong> Technology Conference<br />
7-8 June 2011, Vistana Hotel, Penang, Malaysia<br />
2. DATA CENTERS AIRFLOW MODELING<br />
Data centers are facilities that house computer servers, data storage systems, <strong>and</strong><br />
telecommunications equipment. To ensure that these computer systems operate reliably, they must be<br />
adequately cooled: The airflow requirement of each server rack must be met, in order to maintain the<br />
rack inlet air temperatures within acceptable range. The airflow distribution <strong>and</strong> rack inlet temperatures<br />
are controlled by complex fluid dynamics processes <strong>and</strong> depend on a large number of parameters,<br />
which often interact in a counter-intuitive manner. These parameters include the layouts of perforated<br />
tiles, CRAC units, supply <strong>and</strong> exhaust ducts, supplemental cooling units, <strong>and</strong> server racks; the open<br />
area of perforated tiles; the heat loads <strong>and</strong> airflow dem<strong>and</strong>s of the racks; <strong>and</strong>, obstructions under <strong>and</strong><br />
above the raised floor.<br />
Currently the data center floor layouts are designed using empirical guidelines based on limited<br />
measurements. These guidelines do not consider the complex fluid dynamics processes that control<br />
the airflow <strong>and</strong> temperature distribution. Consequently, the layouts do not produce the expected flow<br />
rates <strong>and</strong> rack inlet temperatures, <strong>and</strong> must be modified. However, because modifications in one<br />
region of the floor influence airflow <strong>and</strong> temperatures throughout the floor, considerable trial <strong>and</strong> error<br />
is involved in identifying adjustments that will yield the desired changes in the rack inlet temperatures.<br />
This design practice is time consuming <strong>and</strong> expensive, <strong>and</strong> often the resulting arrangement is not<br />
optimum. Computational Fluid Dynamics (CFD) modelling or airflow modelling offers a more scientific<br />
<strong>and</strong> comprehensive design approach.<br />
Computational simulation can be used for a quick setup of any proposed layout, any desired<br />
placement of CRAC units <strong>and</strong> perforated tiles, <strong>and</strong> any imagined failure scenario. The “computational”<br />
trial-<strong>and</strong>-error process is preferable for two reasons. First, performing a simulation is much faster <strong>and</strong><br />
more economical than building an actual layout. Second, the computed results provide not only the<br />
flow rate distribution through perforated tiles <strong>and</strong> rack inlet temperatures but also the underlying<br />
velocity, pressure, <strong>and</strong> temperature fields <strong>and</strong> thus explain the physics behind the results. This<br />
underst<strong>and</strong>ing is useful in guiding the computational trial-<strong>and</strong>-error process in the optimum direction.<br />
Figure 1: Temperature Distribution <strong>and</strong> flowpattern on a vertical plane (at a Data Centers Comm<strong>and</strong><br />
Room). TileFlow constructs a computer model of the data center <strong>and</strong> uses the technique of<br />
Computational Fluid Dynamics (CFD) to calculate the airflow pattern <strong>and</strong> pressure/temperature<br />
distributions. TileFlow is a reliable, fast, <strong>and</strong> cost-effective tool for:<br />
� Designing efficient data centers<br />
� Evaluating options for positioning new equipment<br />
� Examining "what if" scenarios<br />
� Streamlining installation <strong>and</strong> commissioning<br />
� Preventing heat related outages of computer equipment<br />
� Making cost-effective investments in cooling-related hardware<br />
Figure 1. Temperature Distribution <strong>and</strong> flowpattern on a vertical plane (at a Data Center Comm<strong>and</strong><br />
room)
3. THE COOLING CHALLENGE IN DATA CENTERS<br />
285<br />
International <strong>Building</strong> & <strong>Infrastructure</strong> Technology Conference<br />
7-8 June 2011, Vistana Hotel, Penang, Malaysia<br />
The Uptime Instituted. Data centers are facilities that house computer servers, data storage systems,<br />
<strong>and</strong> telecommunications equipment. To ensure that these computer systems operate reliably, they<br />
must be adequately cooled: The airflow requirement of each server rack must be met, in order to<br />
maintain the rack inlet air temperatures within acceptable range.<br />
The distribution of cooling air <strong>and</strong> the rack inlet temperatures (cooling performance) are controlled by<br />
complex fluid dynamics processes <strong>and</strong> depend on a large number of parameters, which often interact<br />
in a counter-intuitive manner. In a raised-floor data center, these parameters include the layout of<br />
perforated tiles, CRAC units, <strong>and</strong> server racks; the open area of perforated tiles; the heat loads of the<br />
racks; <strong>and</strong>, obstructions <strong>and</strong> blockages under <strong>and</strong> above the raised floor. Figure 2 show the<br />
temperature fog (3-Dimensional temperature distribution above the raised floor).<br />
Often the design practices for data center cooling are based on empirical guidelines <strong>and</strong> prior<br />
experiences. These practices do not consider the complex fluid dynamic processes that control the<br />
airflow <strong>and</strong> temperature distribution. Consequently, they lead to inefficient <strong>and</strong> ineffective data centers.<br />
The key to designing an optimally cooled data center is a good underst<strong>and</strong>ing of the airflow patterns<br />
<strong>and</strong> temperature distribution in the data center. This underst<strong>and</strong>ing is best achieved through computer<br />
modelling of the fluid flow <strong>and</strong> thermal processes, that is, by computer simulation of the cooling<br />
performance of the data center.<br />
Figure 2. Temperature fog (3-Dimensional temperature distribution above the raised floor)<br />
Figure 3. Animation of air movement above the raised floor (color rep the air temperature)
286<br />
International <strong>Building</strong> & <strong>Infrastructure</strong> Technology Conference<br />
7-8 June 2011, Vistana Hotel, Penang, Malaysia<br />
Figure 4. Display of cooling plumes through the perforated tiles<br />
Figure 5. Temperature distribution <strong>and</strong> flowpattern on a vertical plane<br />
4. CONVENTIONAL VS CFD IN DESIGNING DATA CENTERS<br />
The current approach of achieving the desired cooling performance in a data center through trial <strong>and</strong><br />
error is expensive <strong>and</strong> time consuming. TileFlow offers a comprehensive <strong>and</strong> cost-effective alternative<br />
involving computer simulation of the cooling performance of a data center. TileFlow constructs a<br />
computer model of the data center <strong>and</strong> uses the technique of Computational Fluid Dynamics (CFD) to<br />
calculate:<br />
� Airflow pattern <strong>and</strong> pressure distribution under the raised floor.<br />
� Distribution of airflow rates through perforated tiles <strong>and</strong> other openings on the raised floor.<br />
� Airflow pattern <strong>and</strong> temperature distribution above the raised floor (computer room).<br />
TileFlow can be used to model both raised-floor <strong>and</strong> non-raised floor data centers. It accounts for the<br />
effects of all important factors that influence the airflow patterns <strong>and</strong> temperature distribution, including<br />
� Plenum <strong>and</strong> ceiling heights<br />
� Location <strong>and</strong> flow rate of CRAC units<br />
� Arrangement <strong>and</strong> open area of perforated tiles<br />
� Cable openings on the floor<br />
� Layout <strong>and</strong> heat load of server racks<br />
� Under-floor obstructions<br />
� Above-floor partitions <strong>and</strong> blockages<br />
� Presence of overhead <strong>and</strong> rack-top cooling units
� Horizontal (in-row) coolers<br />
� Overhead supply <strong>and</strong> exhaust vents<br />
� Return ceiling plenum<br />
9. CONVENTIONAL VS CFD IN DESIGNING DATA CENTERS<br />
287<br />
International <strong>Building</strong> & <strong>Infrastructure</strong> Technology Conference<br />
7-8 June 2011, Vistana Hotel, Penang, Malaysia<br />
In 2007, a raised floor data center in the Intel plant in Penang, Malaysia, was about to be upgraded<br />
with new cooling system. This presented an ideal opportunity for using the Tileflow software to model<br />
the conceptual design of this room with proper cooling system. The raised floor area was approx. 8.5m<br />
x 10.4m, with 2 Computer Room Air-conditioning (CRAC) units placed into the room(as shown in the<br />
figure no.). This area was selected <strong>and</strong> it was sufficient to demonstrate the basis concepts. The raised<br />
floor was 18inch <strong>and</strong> the floor tiles were 610mmm (2ft) on a side. As shown in Fig no.6 a well<br />
developed modeling of PG12 Data Centers.<br />
Figure 6. A well developed modelling of Intel PG12 Data Center with 2 CRAC<br />
The positions of the CRAC units are shown in the top view included in Fig. no.6. The CRAC units were<br />
positioned such that the airstream exhausting from the two units were directed toward the pressurize<br />
air plenum, that is, the airstreams will discharge in a region between perforated tiles at the equipment<br />
racks. Figure 7; are displaying the experimental cooling plumes through the perforated tiles.<br />
Figure 7. Experimental setup display of cooling plumes through the perforated tiles<br />
The CRAC units were DB aire model DB20IC. These unit were approximately 20-ton units <strong>and</strong> provide<br />
airflow rates of 5000 cfm/min. After detailed examination of the CRAC units it was found that the outlet<br />
openings of the units were partially blocked by solid floor tiles. As a result, the actual flow rate<br />
delivered by the units was taken into account when performance the CFD calculations.
288<br />
International <strong>Building</strong> & <strong>Infrastructure</strong> Technology Conference<br />
7-8 June 2011, Vistana Hotel, Penang, Malaysia<br />
The rated opening area of the perforated tiles is 25%. Actual measurements, however, showed that<br />
the open area is only 19.5%.The flow resistance of the perforated tiles was measured on a flow bench<br />
<strong>and</strong> given. All nine perforated tiles arrangements considered in this study. Each tile arrangements<br />
were chosen such that it could potentially support arrays of rack aligned with the perforated tiles. The<br />
cold air from the perforated tiles washes the fronts of the racks, is drawn into the racks to cool the<br />
electronics, <strong>and</strong> is finally discharged from the rear of the racks to return to the inlets of the CRAC units<br />
above the ceiling.The airflow rates were measured with a calibrated Alnor balometer. This tool is<br />
capable of measuring flow rates from individual perforated tiles. The instrument was calibrated on a<br />
flow bench, <strong>and</strong> the collected data was suitably adjusted to account for the measurement errors. The<br />
total error in measurements, including instrument errors, is estimated to be within 5%.<br />
10. CONVENTIONAL VS CFD IN DESIGNING DATA CENTERS<br />
This configuration involves a 3 x 3 array of perforated tiles placed between two CRAC units. The flow<br />
rates of the tiles in the first two columns next to the CRACs unit are positive; that is, there is a forward<br />
flow is caused by the positive plenum pressure (pressure more than the ambient pressure above the<br />
raised floor) resulting from the supply air from the CRAC. The further tiles will received more air flow<br />
than compare to the ones nearer to the CRAC units. The slight dip for tiles in middle is caused by the<br />
presence of obstructions. Backflow of air is prevented with the help of the cardboard piece placed at<br />
the inlet of the unit to prevent this from happing. Figure 8: Experimental result display of cooling<br />
plumes through the perforated tiles.<br />
Figure 8. Experimental result display of cooling plumes through the perforated tiles<br />
The results presented in the preceding sections clearly show that the airflow distribution, even for a<br />
simple configuration, is a complex function of the layout of the perforated tiles <strong>and</strong> the positions of the<br />
CRAC units. In actual Data centre, it will depend on the additional parameters related to the<br />
dimensions of the plenum, the open area of the perforated tiles, <strong>and</strong> the flow resistance/blockage of<br />
the obstructions like pipes, <strong>and</strong> cables in the plenum. A clear underst<strong>and</strong>ing of the relationship<br />
between the airflow distribution <strong>and</strong> the governing parameters is essential for achieving the desired<br />
airflow distribution. The most convenient approach for establishing this relationship is through<br />
mathematical (computational) modeling.<br />
For a computational model to be useful as practical tool for designing new data centers <strong>and</strong> upgrading<br />
<strong>and</strong> retrofitting existing data centers, it must meet 2 criteria: (a) it should be east to use (it should not<br />
require specialized knowledge of CFD), <strong>and</strong> (b) it should produce results in short turnaround times. Off<br />
course, it should be produce results that agree well with the experimental data. At first glance, it
289<br />
International <strong>Building</strong> & <strong>Infrastructure</strong> Technology Conference<br />
7-8 June 2011, Vistana Hotel, Penang, Malaysia<br />
appears that the prediction of the airflow distribution would require calculations of velocity <strong>and</strong><br />
pressure distributions in the plenum <strong>and</strong> in the computer room above the raised floor. This approach<br />
would involve 3-D CFD model of the entire space.<br />
The airflow rate through a perforated tile depends on the local pressure drop across the tile (pressure<br />
in the plenum minus pressure above the raised floor). The pressure variations above the raised floor<br />
are small compared to the pressure drop across the perforated tiles <strong>and</strong> can thus be ignored. That is,<br />
the pressure above the raised floor can be assumed uniform. As a result, the airflow distribution is<br />
governed primarily by the pressure distribution in the plenum <strong>and</strong> can, therefore, be obtained.<br />
11. CONCLUSIONS<br />
Air flow distribution is presented for a number of raised floor data center configurations. The key<br />
conclusions from this study are the airflow distribution is a strong function of the number of CRAC<br />
units in operation. An improved airflow distribution is achieved when both CRAC units discharge air in<br />
the same direction. The airflow distribution is more non-uniform when the CRAC units are oriented<br />
such that they discharge in opposing directions <strong>and</strong> their airstreams collide. The results from the CFD<br />
programs are in good agreement with the experimental data.<br />
REFERENCES<br />
K.C.Karki & A.Radmehr <strong>and</strong> S.V.Patankar (2003). Use of Computational fluid Dynamics for<br />
Calculation Flow Rates Through Perforated Tiles in Raised Floor Data Centers. Inteinternational<br />
Journal of Heating, Ventilation, Air-Conditioning, <strong>and</strong> Refrigeration Research Vol.9. No.2, pp 153 –<br />
166<br />
S.V. Patankar (1980). Numerical Heat Transfer <strong>and</strong> Fluid Flow. USA: Taylor <strong>and</strong> Francis.<br />
P.S..Sathyamurthy <strong>and</strong> S.V. Patankar (2002). Block-Correction-Based Multigrid Method for Fluid Flow<br />
Problems. Numerical Heat Transfer, Part B (Fundamentals), Vol.25, pp 375 – 394<br />
B.E.Launder <strong>and</strong> D.B.Spalding (1974). BThe Numerical Computation of Turbulent Flows. Computer<br />
Methods in Applied Mechanics <strong>and</strong> Engineering, Vol.3, pp 269 – 289
T164<br />
ROOM AIR DISTRIBUTION OPTIMIZATION<br />
Rawnee Ho 1 <strong>and</strong> Dr.M.R Ismail 2<br />
290<br />
International <strong>Building</strong> & <strong>Infrastructure</strong> Technology Conference<br />
7-8 June 2011, Vistana Hotel, Penang, Malaysia<br />
1,2 Universiti Sains Malaysia, Pulau Pinang, Malaysia<br />
rawnee@yahoo.com 1 ; rodzi@usm.my 2<br />
ABSTRACT: Room air distribution <strong>and</strong> cooling load estimation for room/building are based on<br />
st<strong>and</strong>ard design approach (cooling estimation). The knowledge about the airflow distribution on a<br />
room/building is based on pattern inside the room/building need to be considered. Most room/building<br />
airflow distribution is not properly design, where the ventilation mixing plays a significance role toward<br />
thermal comfort. During Design stage, studying the airflow distribution <strong>and</strong> cooling load will enable us<br />
design a very efficient system. The case study has been carried at PBP Conference Room in<br />
University Science Malaysia, Penang. The outcome of the case studies shows the airflow distribution<br />
on a room/building play important key role room air distribution optimization study. The case studies<br />
based on recommended building heat gained (btu/hr) per sqft <strong>and</strong> underst<strong>and</strong>ing the airflow<br />
distribution pattern has proven to be useful for energy saving.<br />
Keywords: definition, cassette type air-conditioner, air change rates per hours (ach), british<br />
thermal unit per hours (btu/hr), refrigeration tonne (rt), cubic feet per minute (cfm), airflow &<br />
room air distribution modelling.<br />
1. INTRODUCTION<br />
Characterizing how airflow is introduced to, flows through, <strong>and</strong> is measured from spaces is known as<br />
room air distribution. Uneven or short circuit airflows in a room/building will causing significant problem<br />
to cooling system. It will also affect the thermal comfort due to poor air distribution & etc. This call for<br />
consideration when designing the room air distribution prior to estimate the cooling load required. In<br />
proper airflows design will cause a problem on the room air mixing (cool <strong>and</strong> re-heat air).<br />
2. VENTILATION MIXING SYSTEM<br />
Mixing systems generally supply air such that the supply air mixes with the room air so that the mixed<br />
air is at the room design temperature <strong>and</strong> humidity. In cooling mode, the cool supply air, typically<br />
around 55°F (13°C) (saturated) at design conditions, exits an outlet at high velocity. The high velocity<br />
supply air stream causes turbulence causing the room air to mix with the supply air. Because the<br />
entire room is near-fully mixed, temperature variations are small while the contaminant concentration<br />
is fairly uniform throughout the entire room. On this case study, Cassette air conditioner turbo fan will<br />
create the high velocity supply air stream. Most often, the air outlets <strong>and</strong> inlets are placed in the<br />
ceiling. Supply diffusers in the ceiling are fed by fan coil units in the ceiling void or by air h<strong>and</strong>ling units<br />
in a remote plant room. The fan coil or air h<strong>and</strong>ling unit take in return air from the ceiling void <strong>and</strong> mix<br />
this with fresh air <strong>and</strong> cool, or heat it, as required to achieve the room design conditions. This<br />
arrangement is known as 'conventional room air distribution'.<br />
The target of mixing ventilation applications is to diffuse the supply air draughlessly into the space so<br />
that the thermal conditions <strong>and</strong> eventual containment concentrations are uniform either in the entire<br />
space or in specific zone of the space (e.g. the occupied zone). The air flow rates typically defined<br />
using heat or humidity balance calculation, Alternatively, the air flow rate is determined on the basis of<br />
the dilution of emitted air contaminants in the space via air exchange. Naturally, the outdoor air<br />
ventilation specified in the building codes are respected. Ventilation efficiency is ensured by effective<br />
air diffusion through the occupied zone <strong>and</strong> avoid undesired stagnant zones <strong>and</strong> flow of the supply air<br />
into the exhaust.
291<br />
International <strong>Building</strong> & <strong>Infrastructure</strong> Technology Conference<br />
7-8 June 2011, Vistana Hotel, Penang, Malaysia<br />
3. DISPLACEMENT VENTILATION SYSTEM<br />
Displacement ventilation systems supply air directly to the occupied zone. The air is supplied at low<br />
velocities to cause minimal induction <strong>and</strong> mixing. This system is used for ventilation <strong>and</strong> cooling of<br />
large high spaces, such as auditoria <strong>and</strong> atria, where energy can be saved if only the occupied zone is<br />
treated rather than trying to control the conditions in the entire space. The displacement outlets are<br />
usually located at or near the floor with the air supply designed so the air flows smoothly across the<br />
floor. Where there is a heat source (such as people, lighting, computers, electrical equipment, etc.) the<br />
air will rise, pulling the cool supply air up with it <strong>and</strong> moving contaminants <strong>and</strong> heat from the occupied<br />
zone to the return or exhaust grilles above. By doing so, the air quality in the occupied zone is<br />
generally superior to that achieved with mixing room air distribution. If air mixing is encouraged at the<br />
floor level, this type of floor-to-ceiling room air distribution is known as underfloor air distribution; if<br />
mixing is discouraged, it is displacement.<br />
Displacement room airflow presents an opportunity to improve both the thermal comfort <strong>and</strong> indoor air<br />
quality (IAQ) of the occupied space. It also takes advantage of the difference in air density between an<br />
upper contaminated zone <strong>and</strong> a lower clean zone. Cool air is supplied at low velocity into the lower<br />
zone. Convection from heat sources creates vertical air motion into the upper zone where high level<br />
return inlets extract the air. In most cases these convection heat sources are also the contamination<br />
sources (e.g., people, equipment, or processes), thereby carrying the contaminants up to the upper<br />
zone, away from the occupants. Since the conditioned air is supplied directly into the occupied space,<br />
supply air temperatures must be higher than mixing systems (usually above 63 °F or 17 °C) to avoid<br />
cold draughts at the floor. By introducing the air at supply air temperatures close to the room<br />
temperature <strong>and</strong> low outlet velocity a high level of thermal comfort can be provided with displacement<br />
ventilation.<br />
4. CASSETTE AIR-CONDITIONER VS CEILING DIFFUSER<br />
The means of delivering the cool air from the air-conditioner unit is via air diffuser or air supply grille.<br />
The air diffuser or grille will uniformly distribute airflow from the ducted system. Whereas the cassette<br />
types of airflow, it is delivered with the help of auto air swing (30 o -60 o ) angle. Both method of airflow<br />
distribution has it’s limitation, air diffuser <strong>and</strong> cassette types only can covered room or area within 10<br />
feet radius. Cassette types airflow distribution pattern is more of active than passive (on diffuser).<br />
Cassette types auto swing louver will help the air distribution mixing effectively, than compare to air<br />
diffuser.<br />
Figure 1. Cassette types air-conditioner air flow distribution pattern in a room<br />
(Halton, 2009). Poor air distribution yields poor comfort, poor air quality, slow response system for the<br />
cool air to reach the designated area in the room/building. Diffuser selection needs to use<br />
mathematical modelling <strong>and</strong> most diffuser supplier will recommend the owner respectively.
292<br />
International <strong>Building</strong> & <strong>Infrastructure</strong> Technology Conference<br />
7-8 June 2011, Vistana Hotel, Penang, Malaysia<br />
Figure 2. Air flow supply direction of the cassette types air-conditioner<br />
Figure 3. Air flow supply direction of the ducted ceiling diffuser<br />
5. CASE STUDIES<br />
The PBP Conference Hall (Dewan Persidangan PBP) at University Science Penang, Malaysia, was<br />
holding a post graduate seminar <strong>and</strong> the cooling system have been reported to be too cool. The room<br />
is full of students <strong>and</strong> in middle of conference room, it was not so cooled. This presented an ideal<br />
opportunity to study the air conditioning design for the PBP Conference Hall based on cooling load<br />
design <strong>and</strong> also room air distribution study.<br />
Figure 4. PBP Conference <strong>Building</strong>
293<br />
International <strong>Building</strong> & <strong>Infrastructure</strong> Technology Conference<br />
7-8 June 2011, Vistana Hotel, Penang, Malaysia<br />
Figure 5. PBP Conference room with student <strong>and</strong> lecturer<br />
The PBP Conference Hall is located at the 1 st floor of the 2 storey building, 24ft x 46ft room (1,104<br />
sqft), 10ft room height with false ceiling <strong>and</strong> is capable of holding 50 people. As shown in Figure 6 a<br />
well developed modeling of PG12 Data Centers.<br />
6ft<br />
6ft<br />
6ft<br />
46ft<br />
28ft<br />
6ft<br />
6ft<br />
6ft<br />
3ft<br />
6ft<br />
24ft<br />
Figure 6. Pejabat Pembangunang. PBP Conference room layout<br />
The PBP Conference Hall (Dewan Persidangan PBP) air conditioning system is 4 nos of YSL50A<br />
50,000 Btu/hr cassette air conditioner (split unit) as shown in Figure 7. 4 nos Cassette Type indoor<br />
unit of 1029cfm turbo mixed fan each <strong>and</strong> total cooling capacity of 200,000 Btu/hr or 16.7 Refrigeration<br />
Tonne.
Figure 7. Location of Cassette types air-conditioner<br />
6. RECOMMENDATION AND FINDING<br />
294<br />
International <strong>Building</strong> & <strong>Infrastructure</strong> Technology Conference<br />
7-8 June 2011, Vistana Hotel, Penang, Malaysia<br />
6.1 Case Studies Finding<br />
The PBP Conference Room cooling capacity is 200,000 Btu/hr or 4 nos of cassette type airconditioner.<br />
Below is the estimated cooling load capacity <strong>and</strong> required air flow rate (CFM) study. The<br />
estimated cooling (Btu/hr) per sqft formula will be used to assist into studying the cooling load<br />
distribution Btu/hr per sqft. Required Air flow (CFM) = (Room Volume (Width x Length x Height) x Air<br />
Change Rates) / 60 second. Required Air flow (CFM) = 1,104 x 10 x 4 (recommend from BS5720)/60<br />
= 736 cfm (Installed cassette type fan capacity 1029x4 = 4,116 cfm). Cooling Per sqft = Total Install<br />
cooling capacity (Btu/hr)/Area Sqft (A) ,Cooling Per sqft = 200,000 (Btu/hr)/1,104 (Sqft) = 181.2 Btu/hr<br />
per sqft . [5].Dr Rodzi. Recommended building heat gained Btu/hr per sqft = 60 Btu/hr per sqft. Airflow<br />
distribution inefficiency blocked by ceiling beam <strong>and</strong> distribution of room temperature differences of 2-<br />
3 deg C. The temperature recorded at the conference room was 21 o C (as shown in figure 8).<br />
24o 21 C<br />
oC 21o 24 C<br />
o 21 C<br />
oC 21oC Figure 8. Obstructed airflows distribution of the PBP Conference (in blue shade)<br />
Discomfort feeling has been introduced due to the extreme low temperature (21 o C) <strong>and</strong> also it was<br />
found the cassette types air swing is not on swing position, instead it was on fixed position. Such<br />
airflow distribution has causing short circuit <strong>and</strong> blocked by the ceiling beam. Top view showing the<br />
ceiling airflow distribution showing hot spot area, where the airflow is being blocked by the ceiling<br />
beam.
21o 21 C oC 21o 21 C oC 24o 24 C oC 24o 24 C oC 295<br />
International <strong>Building</strong> & <strong>Infrastructure</strong> Technology Conference<br />
7-8 June 2011, Vistana Hotel, Penang, Malaysia<br />
21o 21 C oC 21o 21 C oC Figure 9. Airflows distribution coverage <strong>and</strong> temperature reading taken<br />
6.2 Case Studies Recommendation<br />
From the observation <strong>and</strong> finding, it is practical to consider the following recommendation to improve<br />
the airflow distribution <strong>and</strong> cooling load required. The required airflow pattern of the cassette types<br />
ceiling need to be re-look into <strong>and</strong> ensuring that the air swing is always on auto swing mode (this way<br />
it will help to circulate the airflow throughout the entire room. Total cooling load required will need to<br />
60 Btu/hr per sqft, thus this will result into running at least 2 nos or maximum of 3 nos of cassette<br />
types air-conditioner during any even/conference. Also need to re-consider to relocate 1 nos of the<br />
cassette types air-conditioner to the middle section of the conference room (as shown figure 10). This<br />
will help to further evenly circulate the airflow distribution effectively. Thus will ensure proper energy<br />
saving <strong>and</strong> help to prolong the cassette types air-conditioner life.<br />
25o 25 C<br />
o 25 C<br />
oC 25o 25 C<br />
o 25 C<br />
oC Figure 10. Recommended location <strong>and</strong> temperature setting for the air-conditioner<br />
25oC 25o 25 C<br />
o 25 C<br />
o 25 C<br />
oC 25o 25 C<br />
o 25 C<br />
oC Figure 11. Expected airflow distribution (in blue shade)<br />
To reset the room temperature to 25 o C instead of 21 o C for thermal comfort consideration <strong>and</strong><br />
gradually increase the cooling with regard to the outdoor ambient temperature. Reduction on the
296<br />
International <strong>Building</strong> & <strong>Infrastructure</strong> Technology Conference<br />
7-8 June 2011, Vistana Hotel, Penang, Malaysia<br />
cassette types air-conditioner fan speed can be reduced to 1,000cfm (each unit fan speed to be set at<br />
300-400 cfm). Too much cfm will cause draft <strong>and</strong> unwanted noise pollution. The results presented in<br />
the preceding sections clearly show that the airflow distribution, even for a simple configuration (small<br />
area of 1,104 sqft), need much attention. Below the false ceiling area need to be clear of obstacle to<br />
avoid any obstruction on the airflow discharge from the air-conditioner. The locations of air-conditioner<br />
play an important role for airflow distribution. A clear underst<strong>and</strong>ing of the relationship between the<br />
airflow distribution <strong>and</strong> the governing parameters is essential for achieving the desired airflow<br />
distribution. The most convenient approach for establishing this relationship is through mathematical<br />
modeling (software simulation).<br />
For a software mathematical modeling can be useful as practical tool for designing small or large<br />
areas, it must meet 2 criteria: (a) it should be easy to use <strong>and</strong> (b) it should produce results in short<br />
turnaround times. Off course, it should be produce results that agree well with the thermal comfort<br />
requirements.<br />
7. CONCLUSIONS<br />
Airflow distribution on a single zone building need to be considered during the designing stage <strong>and</strong> the<br />
ceiling airflow distribution play an important role to ensure the cool air is evenly distributed throughout<br />
the entire room. Small <strong>and</strong> single zone room/building has been a st<strong>and</strong>ard design practice to use rule<br />
of thumb to estimate the cooling requirement i.e. Btu/hr per sqft, with the help of recommended<br />
building heat gained Btu/hr chart, it will further simplified the estimation/design consideration of the<br />
cooling load, especially looking at Malaysia weather climate.<br />
REFERENCES<br />
Dr Rodzi Ismail (2010), “Air-Conditioner Design Guide, pp 10 – 30.<br />
Fujitsu Company (2005). Compact Cassette types of air-conditioner, pp 1 – 4<br />
Halton Company (2006). Air Diffuser Design Guide. Pp 1 – 6<br />
Halton Company (2009). Ventilation Ceiling Technical Manual. Pp 18 – 30<br />
Housing <strong>Building</strong> & Planning, Pejabat Pembangunan, Universiti Sains Malaysia, PBP Conference<br />
Room Layout.
T166<br />
297<br />
International <strong>Building</strong> & <strong>Infrastructure</strong> Technology Conference<br />
7-8 June 2011, Vistana Hotel, Penang, Malaysia<br />
PERFORMANCE OF SAND CEMENT BRICKS INCORPORATING KENAF<br />
POWDER AND RICE HUSK ASH<br />
Kartini, K. 1 , Ahmad Farhan, H. 2 , <strong>and</strong> Nor Azlina, U. 3<br />
1,2,3 Faculty of Civil Engineering, Universiti Teknologi MARA, MALAYSIA.<br />
1 ce_kartini2002@yahoo.com<br />
ABSTRACT: Green <strong>and</strong> lightweight material is turn out to be the interest as a global subject concern.<br />
A new invention about lightweight brick production is needed <strong>and</strong> improves our underst<strong>and</strong>ing about<br />
the composite material especially for building materials. Bricks are one of oldest building material used<br />
as construction materials that can be created <strong>and</strong> used in a long run. Recently, new approaches of<br />
design method were explored <strong>and</strong> differentiation of ordinary brick is needed to be investigated.<br />
Composite brick have developed quickly <strong>and</strong> became progressively more popular in building material.<br />
In addition, new innovative idea has been discovered to improve the capability of latest composite<br />
building materials in producing lightweight brick. Brick could carry various loading depend on their<br />
material mixture <strong>and</strong> strength. The composition of brick is highly constituent by s<strong>and</strong> <strong>and</strong> cement. It is<br />
very significant to find the alternative towards sustainable <strong>and</strong> environmental friendly in order to<br />
produce a lightweight brick that could reduce the overall construction costs as well, since bricks could<br />
reduce the load of structure. Two materials are identified in producing lightweight brick which are<br />
kenaf powder (KP) as additive materials for concrete mixes <strong>and</strong> rice husk ash (RHA) to partially<br />
replaced cement. The combination of such natural resources with cement mortar is expected to cause<br />
higher impact on compressive strength <strong>and</strong> improve the performance of the composite brick as<br />
additive materials. In the era of great information transfer by new technology in cement mortar <strong>and</strong><br />
concrete material, the exploitation of KP <strong>and</strong> RHA as replacement or addition materials may helps to<br />
increase the durability, <strong>and</strong> take full advantage of composite materials especially in terms of strength.<br />
Therefore, dem<strong>and</strong>s to use natural material in lightweight bricks manufacturing are certainly needed.<br />
Keywords: s<strong>and</strong> cement brick, kenaf powder, rice husk ash, compressive strength, durability<br />
1. INTRODUCTION<br />
In the last two decade, the dem<strong>and</strong> on building materials industry had raised up due to the increasing<br />
population which causes an unceasing shortage of building materials (Algin <strong>and</strong> Turgut, 2006). Thus,<br />
adaptation of the industrial <strong>and</strong> agricultural wastes to valuable building <strong>and</strong> construction materials<br />
especially for brick material are welcomed. Bricks are one of oldest building material used as<br />
construction materials that can be created <strong>and</strong> used in a long period of time. Bricks as an in-filled<br />
material in wall construction should be of lightweight <strong>and</strong> durable. Studies on the development of<br />
bricks are increasing <strong>and</strong> had move toward lighter bricks with increase in the thermal insulation<br />
(Chiang et al., 2009). The composition of bricks is highly constituent of s<strong>and</strong> <strong>and</strong> cement, <strong>and</strong> in<br />
producing a brick, these materials are very expensive <strong>and</strong> the sources availability is depleting.<br />
Therefore, ways in substituting these natural raw materials with recycles agricultural waste need to be<br />
exploited. Besides, the production of OPC will also result in the emission of green house gases<br />
especially CO2, which is accounting for approximately 7% to 8% of CO2 globally (Bronzeoak, 2003). It<br />
was reported that about 1 tonne of CO2 is released per tonne of clinker produced, which translates to<br />
about 0.95 to 0.97 tonne of CO2 per tonne of Portl<strong>and</strong> cement produced (Glasser, 1998). On top of<br />
that, it requires high-energy consumption to produce, i.e. 1 tonne of cement requires energy of 100-<br />
150 kWT. Till to date, the utilization of industrial waste by-products as well as the agricultural residue<br />
such saw dust ash (Kartini, 2001), empty fruit bunch ash (Amizan <strong>and</strong> Kartini, 2009), rice husk ash<br />
(Kartini, 2009) <strong>and</strong> quarry dust fine powder (Norhana et al., 2010) have been carried out in finding the<br />
outst<strong>and</strong>ing material as partial replacement or additive material for cement. Hence, it is very significant<br />
to use cement together with renewable materials which are sustainable <strong>and</strong> environmental friendly in<br />
order to produce a lightweight brick.
2. EXPERIMENTAL WORK<br />
2.1 MATERIAL USED<br />
298<br />
International <strong>Building</strong> & <strong>Infrastructure</strong> Technology Conference<br />
7-8 June 2011, Vistana Hotel, Penang, Malaysia<br />
The rice husk was burnt in a Ferro cement furnace to produce amorphous rice husk ash (RHA). After<br />
burning <strong>and</strong> left for 24 hours for it to further burning, the burnt ashes were left to cool inside the<br />
furnace for another 24 hours before taken out for grinding in a Los Angeles (LA) machine. To produce<br />
fine RHA, about 5 kg of RHA were placed in the LA machine, with 40 nos. of steel rod in it <strong>and</strong> grinded<br />
it for 5000 revolutions. Another material used is the kenaf (Hibiscus cannabinus L.) powder which was<br />
obtained from Everise Crimson (M) Sdn Bhd. This kenaf powder was added in the s<strong>and</strong> cement mixes<br />
in different proportion as additive material. The st<strong>and</strong>ard average grain size of kenaf powder particle<br />
was 3 mm <strong>and</strong> with a density of about 123 ± 2 kg/m 3 (Sarah <strong>and</strong> Mark, 2001). The other materials also<br />
used in this study were Ordinary Portl<strong>and</strong> Cement (OPC) <strong>and</strong> river s<strong>and</strong> of 5 mm maximum size as<br />
fine aggregates.<br />
2.2 TEST CONDUCTED<br />
2.2.1 COMPRESSIVE STRENGTH<br />
For hardened concrete, the brick units were subjected to compressive strength after 28 <strong>and</strong> 60 days of<br />
air curing <strong>and</strong> the test was performed in accordance to BS EN 772-1:2000 was measured on bed face<br />
of the brick.<br />
2.2.2 WATER ABSORPTION<br />
Water absorption is subjective by the capillary holes present in concrete surface. Water absorption<br />
test is conducted to determine the rate of absorption of water into the bricks. The test was conducted<br />
with accordance to BS EN 12390-8:2009. The brick units were dried in oven for 72 hours at<br />
temperature condition 105 ± 5°C. Then, the brick was placed in the closed container for 24 hours.<br />
Subsequently, the initial brick unit is first weighed before it is completely immersed in water. Depth of<br />
25±5 mm of water over the top of the brick unit was maintained throughout the test. The brick units<br />
were removed <strong>and</strong> weighed at every 30 minutes interval for 4 hours.<br />
2.2.3 SAMPLE PREPARATION<br />
Ten (10) various mixes of cement mortar (excluding specimen control) were prepared to cast the brick<br />
specimens. The design of the mortar mix was based on 1:3 mixes with 0.5 water cement (w/c) ratio.<br />
For the KP brick, the mix proportion was designed based on different level of kenaf powder addition,<br />
i.e. 0%, 3%, 5%, 7%, 10%, 15%, while for RHA brick the design is based on the percentages of<br />
replacement of OPC with RHA, i.e. 0%, 15%, 20%, 25%, 30%, 40%. The details of the design mixes<br />
were as shown in Table 1
299<br />
International <strong>Building</strong> & <strong>Infrastructure</strong> Technology Conference<br />
7-8 June 2011, Vistana Hotel, Penang, Malaysia<br />
Table 1. Mixture Proportion for Kenaf Powder <strong>and</strong> RHA Concrete Brick<br />
Mixture<br />
Designation Cement<br />
3. RESULT AND DISCUSSION<br />
Constituent Materials (kg/m 3 )<br />
Water<br />
River<br />
S<strong>and</strong><br />
Kenaf<br />
Powder<br />
RHA<br />
Control-0 513 256 1539 0 0<br />
KP-3 513 256 1539 69.2 -<br />
KP-5 513 256 1539 115.4 -<br />
KP-7 513 256 1539 161.6 -<br />
KP-10 513 256 1539 230.8 -<br />
KP-15 513 256 1539 346.2 -<br />
RHA-15 436 256 1539 - 77<br />
RHA-20 410 256 1539 - 103<br />
RHA-25 385 256 1539 - 128<br />
RHA-30 359 256 1539 - 154<br />
RHA-40 308 256 1539 - 205<br />
3.1 PROPERTIES OF MATERIALS<br />
A typical chemical composition of the RHA obtained after burning <strong>and</strong> grinding is shown in the Table<br />
2. From the table, it can be seen that SiO2 for RHA is 96.7 % <strong>and</strong> LOI is 4.81 %. These show that the<br />
ashes are of high content of silica <strong>and</strong> of good quality. It was investigated by Kartini (2009) that the<br />
OPC contains calcium oxide <strong>and</strong> silicon dioxide of 64.6% <strong>and</strong> 21.4% respectively, while, RHA is 0.49<br />
<strong>and</strong> 96.7 respectively. The RHA used satisfy the ASTM C618 (2003) requirement for SiO2, which<br />
should be minimum 70% <strong>and</strong> loss of ignition of a maximum 6%.<br />
3.2 WEIGHT OF BRICKS<br />
Table 2. Chemical Composition (%) of OPC <strong>and</strong> RHA (Kartini, 2009)<br />
Chemical composition (%) RHA OPC<br />
Silicon dioxide (SiO2) 96.7 21.4<br />
Aluminium oxide (Al2O3) 1.01 5.6<br />
Ferric oxide (Fe2O3) 0.05 3.4<br />
Calcium oxide (CaO) 0.49 64.6<br />
Magnesium oxide (MgO) 0.19 2.1<br />
Sodium oxide (Na2O) 0.26 0.1<br />
Potassium oxide (K2O) 0.91 -<br />
Phosphorous oxide (P2O5) 0.01 -<br />
Titanium oxide (TiO2) 0.16 -<br />
Sulphur trioxide (SO3) - 2.1<br />
Loss on ignition 4.81 0.64<br />
Figure 1 shows the graph of weight against age of curing of RHA brick. From the figure, it can be seen<br />
that the weight of the RHA bricks are decreasing from 15% up to 40% replacement, however, the 25%<br />
up to 40% replacement are more pronounced in terms of its reduction compared to the control brick,<br />
i.e. with a relative difference of 0.78% to 5.6% <strong>and</strong> 1.3% to 11.6% respectively taken at 28 days <strong>and</strong><br />
60 days of air drying. This means that for bricks to be used as an in-filled in wall construction, it is<br />
more that enough to have a one made of a lighter material compared to the normal s<strong>and</strong> cement brick.<br />
It is also to be noted that the specific gravity of Portl<strong>and</strong> cement is 3.11, while for RHA is 2.1 (Kartini,<br />
2009), thus this reduction in the specific gravity of RHA indicates lower weight when it is used<br />
compared to Portl<strong>and</strong> cement. Hence, this indicates that RHA might be an option to produce a<br />
lightweight bricks <strong>and</strong> reduce the utilisation of cement in brick manufacturing. Furthermore, reduction<br />
of cement used will considered environment sustainability towards less carbon dioxide (CO2)<br />
emission.
Figure 1. Weight Measurement of RHA Bricks<br />
300<br />
International <strong>Building</strong> & <strong>Infrastructure</strong> Technology Conference<br />
7-8 June 2011, Vistana Hotel, Penang, Malaysia<br />
Figure 2 shows the graph of weight against age of curing of KP brick. From the figure, it can be seen<br />
that the weight of the KP bricks reduces as the amount of addition of kenaf powder in the mixes<br />
increases. The percentages of reduction in weight compared to control brick (s<strong>and</strong> cement brick) are<br />
from 4.9% up to 20.5% for addition of 3% up to 15% taken at 28 days. The amounts of reduction are<br />
further increases as the period of air drying increases (60 days). This indicates that kenaf powder<br />
might also be an option to produce a lightweight bricks.<br />
Average Weight (g)<br />
3500<br />
3000<br />
2500<br />
2000<br />
1500<br />
1000<br />
500<br />
0<br />
3.3 COMPRESSIVE STRENGTH<br />
3071<br />
2920<br />
2813 2788<br />
3134<br />
2972<br />
2844<br />
2789<br />
2562<br />
2440<br />
2547<br />
2432<br />
28 60<br />
Days of Curing<br />
Figure 2. Weight Measurement of KP Bricks<br />
CONTROL-0<br />
3.3.1 RICE HUSK ASH (RHA) BRICKS<br />
The results of the compressive strength for the RHA bricks taken up to 60 days air drying is presented<br />
in Figure 3. From the bar chart presented, it is clearly seen that at 28 days of air drying it shows that<br />
as the percentage replacement of OPC with RHA in the mortar mix increases, the strength increases,<br />
however beyond 30% replacement, the strength starts reducing. Comparing with the control s<strong>and</strong><br />
cement brick, it seems that at 20%, 25% <strong>and</strong> 30% replacement the strength increases by about 10% -<br />
KP-3<br />
KP-5<br />
KP-7<br />
KP-10<br />
KP-15
301<br />
International <strong>Building</strong> & <strong>Infrastructure</strong> Technology Conference<br />
7-8 June 2011, Vistana Hotel, Penang, Malaysia<br />
27%. Comparing with the st<strong>and</strong>ard available (BS EN 771-3:2003), these RHA bricks can be classified<br />
under the category of strength 20 N/mm 2 , <strong>and</strong> as an in-filled in wall construction, these bricks able to<br />
fulfil it purpose. This increase in strength might be due to reduced porosity, reduced Ca(OH)2, <strong>and</strong><br />
reduced width of the interfacial zone between the paste <strong>and</strong> the fine aggregate as reported by Zhang<br />
et al. (1996), however further increase resulted in reduction in compressive strength (Cook <strong>and</strong><br />
Suwanvitaya, 1981; Kartini, 2009). Rashid et al. (2010) in their studies claimed that the incorporation<br />
of RHA produces the filler effect due to its fine particle size.<br />
Compressive Strength (N/mm²)<br />
45<br />
40<br />
35<br />
30<br />
25<br />
20<br />
15<br />
10<br />
5<br />
0<br />
29.2<br />
3.3.2 KENAF POWDER (KP) BRICKS<br />
23<br />
29<br />
32<br />
37<br />
28<br />
33.7<br />
28 60<br />
Days of Curing<br />
Figure 3. Compressive Strength of RHA Brick<br />
26<br />
31<br />
35<br />
39<br />
30<br />
CONTROL-0<br />
RHA-15<br />
RHA-20<br />
RHA-25<br />
RHA-30<br />
RHA-40<br />
Figure 4 shows the results of compressive strength of Kenaf Powder brick with respect to the age of<br />
air curing. From the figure, it is clearly seen that the strength reduces as the percentage of kenaf<br />
powder addition in the mix increases, <strong>and</strong> the strength are all lower than the control s<strong>and</strong> cement brick<br />
for all the ages. However, for it to be used as an in-filled in the wall construction, addition up to 7% is<br />
still viable. Comparing with the st<strong>and</strong>ard available (BS EN 771-3:2003), these kenaf powder bricks can<br />
be classified under the category of strength 20 N/mm 2 , <strong>and</strong> used as in-filled in wall construction, The<br />
possible reason why the strength reduces might be because firstly, as the kenaf powder used as an<br />
addition in the mix, therefore resulted in not enough cementitious material to hold the other constituent<br />
materials together, hence resulted in lower bond between them. Addition of kenaf powder in the mix<br />
resulted in dry mixture as this kenaf powder is absorptive in nature, thus absorbed water from the mix<br />
<strong>and</strong> made the mix dry.
Compressive Strength (N/mm²)<br />
40<br />
35<br />
30<br />
25<br />
20<br />
15<br />
10<br />
5<br />
0<br />
29.2<br />
27.93<br />
24.27<br />
3.4 WATER ABSORPTION<br />
18.56<br />
11.92<br />
6.02<br />
3.4.1 RICE HUSK ASH (RHA) BRICKS<br />
Figure 4. Compressive Strength of KP Brick<br />
302<br />
International <strong>Building</strong> & <strong>Infrastructure</strong> Technology Conference<br />
7-8 June 2011, Vistana Hotel, Penang, Malaysia<br />
33.7 32.77<br />
Figure 5 shows the result of the water absorption for the RHA bricks taken up to 60 days. It can be<br />
seen that increase the percentage of replacement of OPC with RHA in the mixes resulted in higher<br />
percentage of water absorption. These are more pronounced for higher replacement level. However,<br />
the amount of absorption is not greater than 7.5% as stated in BS EN 771-3:2003. The result of this<br />
study in terms of water absorption contradicts the findings of other researcher (Manmohan <strong>and</strong> Mehta,<br />
1981; Sugita et al., 1997; Kartini, 2009) in which they stated that RHA replacement in the mix resulted<br />
in pore refinement thus reducing the permeability or absorption of the mortar. It can also be seen that<br />
the amount of water absorption reduces with time in which in more matured mortar bricks the amount<br />
of water absorbed is less. This can be due to the pore structure in young mortar is coarser <strong>and</strong> with<br />
increasing hydration it becomes refined as stated by Saricimen et al. (2000) <strong>and</strong> Saraswathy<br />
<strong>and</strong>.Song (2005).<br />
30.21<br />
28 60<br />
Days of Curing<br />
22.85<br />
13.48<br />
6.7<br />
CONTROL-0<br />
KP-3<br />
KP-5<br />
KP-7<br />
KP-10<br />
KP-15
Figure 5. Water Absorption for RHA Brick<br />
303<br />
International <strong>Building</strong> & <strong>Infrastructure</strong> Technology Conference<br />
7-8 June 2011, Vistana Hotel, Penang, Malaysia<br />
3.4.2 KENAF POWDER (KP) BRICKS<br />
Figure 6 show that the percentages of water absorption for kenaf powder bricks with respect to time.<br />
From the figure it, can be seen that addition of kenaf powder in the mix resulted in increases in the<br />
degree of absorption compared to the control s<strong>and</strong> cement brick. However, at 3% addition of kenaf<br />
powder in the mix the absorption is lower than the control. According to BS EN 771-3:2003, the<br />
addition of up to 7% in the mortar mix still below the requirement of not greater than 7.5% absorption.<br />
It can also be seen that increased in the period of curing resulted in reduction in absorption. This is<br />
due to pore structure in young mortar is coarser <strong>and</strong> with increasing hydration it becomes refined as<br />
mentioned earlier.<br />
Figure 6. Water Absorption for KP Brick
304<br />
International <strong>Building</strong> & <strong>Infrastructure</strong> Technology Conference<br />
7-8 June 2011, Vistana Hotel, Penang, Malaysia<br />
4. CONCLUSIONS<br />
a. The weight of RHA <strong>and</strong> KP bricks decreasing due to the increasing percentage of the<br />
replacement of OPC with the RHA <strong>and</strong> addition of kenaf powder into the mixes. This indicates that<br />
these two materials might be a good option to produce lightweight building materials.<br />
b. Replacement of OPC with RHA up to 30% in the mixes resulted in increased in strength of the<br />
brick. The values of the compressive strength obtained are above the category of 20 N/mm 2 of s<strong>and</strong><br />
cement brick for in-filled in the wall construction.<br />
c. The addition of kenaf powder in the mixes decreased the compressive strength of brick.<br />
However, the 5% addition in the mix fulfilled the requirement of s<strong>and</strong> cement brick of the 20 N/mm 2<br />
strength categories.<br />
d. In terms of water absorption, replacement of up to 40% of OPC with RHA in RHA brick <strong>and</strong><br />
addition of up to 7% of kenaf powder in KP brick still below the requirement of the st<strong>and</strong>ard of 7.5%<br />
absorption.<br />
REFERENCES<br />
Algin, H. M. <strong>and</strong> Turgut, P. (2008). Cotton <strong>and</strong> limestone powder wastes as brick material, Journal of<br />
Construction <strong>and</strong> <strong>Building</strong> Materials 22 pp. 1074-1780.<br />
Amizan, M. <strong>and</strong> Kartini, K. (2009). Empty Fruit Bunch Ash (EFBash) Concrete. CONCET 2009, ISBN<br />
978-983-941-85-1, p. 29<br />
ASTM C 618 (2003), Specification for Coal Fly Ash <strong>and</strong> Raw or Calcined Natural Pozzolan for Use in<br />
Concrete.<br />
British St<strong>and</strong>ard Institution (2003). BS EN 771-3:2003, Specification for Masonry Units. Aggregate<br />
Concrete Masonry Units (Dense <strong>and</strong> Light-weight Aggregates).<br />
British St<strong>and</strong>ard Institution (2000), BS EN 772 Part 1:2000, Method of Test for Masonry units.<br />
Determination of Compressive Strength.<br />
British St<strong>and</strong>ard Institution (2009). BS EN 12390-8:2009, Testing Hardened Concrete. Depth of<br />
Penetration of Water Under Pressure.<br />
Bronzeoak Ltd. (2003). Rice husk ash market study. EXP 129, DTI/Pub URN 03/668, United Kingdom.<br />
Chiang, Kung-Yuh, Chou, Ping-Huai, Hua, Ching-Rou,<strong>and</strong> Chien, Kuang-Li, <strong>and</strong> Chris Cheeseman<br />
(2009). Lightweight bricks manufactured from water treatment sludge <strong>and</strong> rice husks, Journal of<br />
Hazardous Materials 171 pp. 76-82.<br />
Cook, D.J., <strong>and</strong> Suwanvitaya, P. (1981). Rice-husk ash based cements – A State of the Art Review.<br />
Proceeding of ESCAP/RCTT 3 rd. Workshop on Rice-Husk Ash Cement, New Delhi.<br />
Glasser, F.P. (1998). The burning of Portl<strong>and</strong> cement. In F.M Lea’s .Chemistry of Cement <strong>and</strong><br />
Concrete, 4 th Edition, Ed. P.C Hewlett, Edward, Arnold, ISBN/ISSW 0340565896, New York: Wiley.<br />
Kartini, K. (2001). Investigation on Saw Dust Ash as Partial Cement Replacement. Proceeding of 7 th<br />
International Conference on Concrete Engineering <strong>and</strong> Technology – CONCET 2001, Kuala Lumpur.<br />
ISBN 983-9414-26-7.<br />
Kartini, K. (2009). Mechanical, Time-Dependent <strong>and</strong> Durability Properties of Grade 30 Rice Husk Ash<br />
Concrete. PhD Thesis, University of Malaya, Malaysia. pp. 1-324.<br />
Manmohan, D., <strong>and</strong> Mehta, P.K. (1981). Influence of pozzalanic, slag <strong>and</strong> chemical admixture on pore<br />
size distribution <strong>and</strong> permeability of hardened cement paste, cement, concrete <strong>and</strong> aggregates. ASTM<br />
Journal Cement, Concrete <strong>and</strong> Aggregates, Vol.3, No.1, pp. 63-67.<br />
Norhana, A.R., <strong>and</strong> Kartini, K. (2010). Quarry Dust Fine Powder (QDFP) as <strong>Sustainable</strong> Material for<br />
Cement- Scaling New Height in S&T for <strong>Sustainable</strong> National Developement, Malaysian Science <strong>and</strong><br />
Technology Congress – MSTC 2010, Crystal Crown Hotel, Petaling Jaya, 9-10 November 2010, Book<br />
of Abstracts <strong>and</strong> CD, p 104.
305<br />
International <strong>Building</strong> & <strong>Infrastructure</strong> Technology Conference<br />
7-8 June 2011, Vistana Hotel, Penang, Malaysia<br />
Oyetola, E.B <strong>and</strong> Abdullahi. M. (2006). The Use of Rice Husk Ash in Low – Cost S<strong>and</strong>crete Block<br />
Production, Department of Civil Engineering, Federal University of Technology, P.M.B.65, Minna,<br />
pp.58-70.<br />
Rashid, M.H. et al., (2010). Mortar Incorporating Rice Husk Ash: Strength <strong>and</strong> Porosity.<br />
Sarah A. Lee <strong>and</strong> Mark A. Eiteman (2001). Ground Kenaf Core as a Filtration Aid, An International<br />
Journal Industrial Crops <strong>and</strong> Products 13, Elsevier, pp. 155-161.<br />
Saraswathy, V <strong>and</strong> Song. H.W. (2005). Corrosion Performance of Rice Husk Ash Blended Concrete,<br />
Department of Civil <strong>and</strong> Environmental Engineering, Yonsei University.<br />
Saricimen, H., Maslehuddin, M., Shameem, M., Al-Ghamdi, A.J., <strong>and</strong> Barry, M.S. (2000). Effect of<br />
curing <strong>and</strong> drying on strength <strong>and</strong> absorption of concrete containing Fly ash <strong>and</strong> silica fume,<br />
Proceeding of 5 th. International Conference on Durability of Concrete, Editor: Malhotra, V.M., Vol.1,<br />
ACI SP-192 (7), Barcelona, Spain, American Concrete Institute, pp. 103-118.<br />
Sugita, S., Yu, Q., Shoya, M., Tsukinaga,Y., <strong>and</strong> Isojima, Y. (1997). The Resistance of rice husk ash<br />
concrete to carbonation, acid attack <strong>and</strong> chloride ion penetration. High Performance Concrete,<br />
Proceeding of ACI International Conference, Malaysia, ACI SP-172 (2), American Concrete Institute,<br />
Detroit, Michigan, pp. 29-43.<br />
Zhang, M.H, Lastra, R., <strong>and</strong> Malhotra, V.M. (1996). Rice husk ash paste <strong>and</strong> concrete: Some aspects<br />
of hydration <strong>and</strong> the microstructure of the interfacial zone between the aggregate <strong>and</strong> paste. Cement<br />
<strong>and</strong> Concrete Research, Vol. 26, No. 6, Elsevier Science Ltd, pp. 963-977.
T167<br />
306<br />
International <strong>Building</strong> & <strong>Infrastructure</strong> Technology Conference<br />
7-8 June 2011, Vistana Hotel, Penang, Malaysia<br />
TRANSPORTATION STRATEGIES FOR URBAN SUSTAINABLE DEVELOPMENT<br />
Mojtaba Zourbakhsh<br />
Islamic Azad University, Estahban Branch, Iran<br />
m_zourbakhsh@iauestahban.ac.ir<br />
ABSTRACT: Traditional transport planning aims to improve mobility, especially for vehicles, <strong>and</strong> may<br />
fail to adequately consider wider impacts. In the past, planning <strong>and</strong> implementation of such strategies<br />
has been slow <strong>and</strong> spotty, deterred by the complexities of the underlying issues along with<br />
uncertainties about the magnitude <strong>and</strong> timing of impacts, the efficacy of available courses of action,<br />
<strong>and</strong> the consequences of action or inaction. Recently, however, a new interest in actively pursuing<br />
these strategies has emerged. Concerns about environmental quality, social equity, economic vitality,<br />
<strong>and</strong> the threat of climate change have converged to produce a growing interest in the concept of<br />
sustainable development. Efforts are being made all over the world to increase the sustainability of<br />
development patterns. In nations with more advanced economies, particular attention is being paid to<br />
the critical roles played by transportation <strong>and</strong> activity systems. The social costs of transport include<br />
road crashes, air pollution, physical inactivity, time taken away from the family while commuting <strong>and</strong><br />
vulnerability to fuel price increases. Many of these negative impacts fall disproportionately on those<br />
social groups who are also least likely to own <strong>and</strong> drive cars. Traffic congestion imposes economic<br />
costs by wasting people's time <strong>and</strong> by slowing the delivery of goods <strong>and</strong> services. Strategies for<br />
increasing transportation sustainability include dem<strong>and</strong> management, managing traffic congestion,<br />
pricing policies, vehicle technology improvements, clean fuels <strong>and</strong> transportation planning.<br />
<strong>Sustainable</strong> transport systems make a positive contribution to the environmental, social <strong>and</strong> economic<br />
sustainability of the communities they serve. Transport systems exist to provide social <strong>and</strong> economic<br />
connections, <strong>and</strong> people quickly take up the opportunities offered by increased mobility. This paper<br />
reviews current thinking about sustainable transportation <strong>and</strong> strategies of transportation for<br />
sustainability.<br />
Keywords: Transportation strategies, <strong>Sustainable</strong> transport, Urban sustainable development<br />
1. INTRODUCTION<br />
In developed nations,special attention is being given to the sustainability of current <strong>and</strong> emerging l<strong>and</strong><br />
use <strong>and</strong> transportation patterns.this focus reflects both the significant impacts that current patterns of<br />
transportation have on the environment <strong>and</strong> the complex interactions between transportation,l<strong>and</strong> use<br />
,<strong>and</strong> activity systems.In this context ,sustainable transportation is seen as transpotation that meets<br />
mobility needs while also preserving <strong>and</strong> enhancing human <strong>and</strong> ecosystem health,economic progress<br />
,<strong>and</strong> social justice now <strong>and</strong> for the future.Planning for sustainable development aims to attain all three<br />
objectives simultaneously <strong>and</strong> in a just manner,considering access as well as mobility in the<br />
process.Today,sustainable development is widely viewed as development that improves the st<strong>and</strong>ard<br />
of living <strong>and</strong> quality of life,while at the same time protecting <strong>and</strong> enhancing the natural environment<br />
<strong>and</strong> honoring local culture <strong>and</strong> history.Efforts are being made all over the world to increase the<br />
sustainability of development patterns.Concerns about environmental quality ,social equity ,economic<br />
vitality,<strong>and</strong> the threat of climate change have converged to produce a growing interest in the concept<br />
of sustainable development.one definition of sustainable development was put forth in 1992 by the<br />
Brundtl<strong>and</strong> Commission:”<strong>Sustainable</strong> development is development that meets the needs of the<br />
present without compromising the ability of future generations to meet their own needs.”Co2 reduction<br />
,as called for in the Kyoto Protocol <strong>and</strong> other agreements,is an important<br />
objective;however,sustainability has quickly been transformed into a much broader concept having<br />
economic ,social,<strong>and</strong> environmental dimensions. On the other h<strong>and</strong> concerned with urban space,<br />
there are example : Urban population exp<strong>and</strong>ing at more than 6 percent per year in many developing<br />
countries. Traffic Congestion <strong>and</strong> Air Pollution is on the rise in mega- cities. Pedestrians <strong>and</strong> Non-
307<br />
International <strong>Building</strong> & <strong>Infrastructure</strong> Technology Conference<br />
7-8 June 2011, Vistana Hotel, Penang, Malaysia<br />
Motorized Transport (NMT) are poorly served by the cities transport systems.so the number of megacities<br />
(with over 10 million inhabitants) expected to double within a generation.<br />
2. URBAN SUSTAINABLE DEVELOPMENT AND TRANSPORTATION STRATEGIES<br />
A variety of strategies have been identifiied for potentially increasing transportation<br />
sustainability,including dem<strong>and</strong> management,operation management,pricing policies,vehicle<br />
technology improvements,clean fules,<strong>and</strong> integratedl<strong>and</strong> use <strong>and</strong> transportation planning.The<br />
strategies are grouped into several categories based on the component of the transport systems<br />
addressed:vehicles,guideways <strong>and</strong> operations,<strong>and</strong> dem<strong>and</strong>.<br />
2.1 VEHICLE AND FUEL TECHNOLOGICAL CHANGES<br />
This part attention to reducing the bad environmental impact that is caused by vehicle engines.In the<br />
short run,this would most likely focous on strategies for improving the efficiency vehicles inorder to<br />
reduce emissions <strong>and</strong> greenhouse gases.In the longer run,the introduction of new vehicle<br />
technologies <strong>and</strong> new fuels might be an option <strong>and</strong> could lead to quieter,safer <strong>and</strong> cleaner vehicles.In<br />
either time frame,a variety of specific steps could be considered.For example,changes could be<br />
induced through consumer (dem<strong>and</strong>-side)incentives or disincentives,through incentives offerd to<br />
vehicle producers(e.g.,tax credits),or through direct regulation of vehicle manufacturers(e.g.,saftey<br />
st<strong>and</strong>ards).<br />
Figure1. Measures to Improve The Quality Of Vehicles And Fuel<br />
2.2 ROAD/VEHICLE OPERATIONS IMPROVEMENTS<br />
A second category of strategies involves improvements to the roadways <strong>and</strong> vehicle<br />
operations.Conventional traffic flow improvements such as traffic signal timing,ramp metering,flow<br />
metering,<strong>and</strong> bottleneck removal all have the potential to cut energy use,reduce greenhouse<br />
gasemissions,<strong>and</strong> lower noise levels somewhat by smoothing the flow of traffic <strong>and</strong> reducing stop<strong>and</strong>-go<br />
driving. Driver education could reduce emisssions by training drivers to avoid heavy<br />
accelerations <strong>and</strong> decelerations <strong>and</strong> to be mindful of the fuel consequences of high<br />
speeds.Scheduling trips outside of peak periods could reduce congestion <strong>and</strong> thereby cut a major<br />
source of economic loss.Improved methods of accidents/incident management <strong>and</strong> improved logistics<br />
<strong>and</strong> fleet management,both relying increasingly on advanced technologies for vehicle location <strong>and</strong><br />
communication,also have substantial promise for increased efficiency of operations.Information<br />
technology-enhanced routing <strong>and</strong> scheduling can reduce the fuel needed for transport of both<br />
passengers <strong>and</strong> freight.Technological innovations currently under development offer the potential for<br />
significantly larger gains.These include the more advanced aspects of intelligent transportation system<br />
improvement such as smart highways <strong>and</strong> smart vehicles.
2.3 DEMAND MANAGEMENT<br />
Figure 2. Road/Vehicle Operations Improvements<br />
308<br />
International <strong>Building</strong> & <strong>Infrastructure</strong> Technology Conference<br />
7-8 June 2011, Vistana Hotel, Penang, Malaysia<br />
Dem<strong>and</strong> management is a third category of strategies for managing the transportation system.<br />
Several subcategories of dem<strong>and</strong> management are in use.Modal substitution, telecommunications<br />
substitution,pricing,<strong>and</strong> l<strong>and</strong> use strategies all can be thought of as forms of dem<strong>and</strong> management.<br />
Modal substitution means,for example, replacing car trips with transit,paratransit, ridesharing,biking<br />
<strong>and</strong> air freight.This can be accomplished by providing better modal option(offering services <strong>and</strong><br />
improving their quality in order to attract travel to alternative modes)or through incentives for the use of<br />
the alternative modes(e.g.,subsidies for users of preferred modes). Regulatory requirements(trip<br />
reduction ordinances requiring employers to obtain commute mode shares of no more than 50% by<br />
drive-alone ,for example)are also a possible way to induce modal substitution.Telecommunications<br />
substitutions for travel also can be considered a form of dem<strong>and</strong> management.<br />
Telecommuting, teleshopping, teleconferencing, <strong>and</strong> distance learning are varieties of<br />
telecommunications substitutes for travel.Pricing incentives <strong>and</strong> disincentives could be used in the<br />
short run to reduce dem<strong>and</strong> <strong>and</strong> encourage the use of alternative modes or the substitution of<br />
telecommunications for travel.In the longer run,vehicle technology improvements would likely be<br />
induced by the higher prices.Gas tax increases are the pricing strategy most commonly in many<br />
countries.Fees <strong>and</strong> taxes that affect vehicle ownership,such as sales taxes <strong>and</strong> registration fees,also<br />
are common.Variations that base taxes <strong>and</strong> fees on fuel efficiency, emissions, <strong>and</strong> expected vehicle<br />
life could specifically target the reduction of greenhouse gases as “fee-bate”variations offering tax<br />
reductions for efficient,low emissions vehicles along with surcharges for high emitters.Or pricing<br />
strategies could base emissions or fuel surcharges on measured or estimated use.Finally ,rather than<br />
use pricing to restrain emisssions directly,pricing could take the form of subsidies for preferred modes<br />
or for telecommunications<br />
substitutes. L<strong>and</strong> <strong>and</strong> urban development strategies alter dem<strong>and</strong> by reducing trip length(by providing<br />
a choice of close-by destinations)or by making alternative to the auto more competitive <strong>and</strong> costeffective.(These<br />
stategies also may reduce emissions associated with building heating <strong>and</strong><br />
cooling,service provision,etc.)<br />
For example,compact development,mixed use development,<strong>and</strong> higher development densities can<br />
reduce trip lenghts <strong>and</strong> make transit,pedestrian,<strong>and</strong> bike use practical <strong>and</strong> affordable.In some<br />
cases,compact development also may facilitate better management of urban freight<br />
transport(shipment consolidation,delivery scheduling,etc.)
Figure3. Dem<strong>and</strong> Management Improvements<br />
309<br />
International <strong>Building</strong> & <strong>Infrastructure</strong> Technology Conference<br />
7-8 June 2011, Vistana Hotel, Penang, Malaysia<br />
2.3.1 URBAN PUBLIC TRANSPORT SERVICES AND INCREASING THE DESIRABILITY<br />
Today, based on patterns of urban sustainable development according to motivate <strong>and</strong> encourage<br />
citizens to use public transport services. but should be considered if the desirability <strong>and</strong> efficiency are<br />
not required, it cause people to use personal vehicles as well as single-passenger trips will increase in<br />
the city area . Therefore, measures should be conducted according to the equations <strong>and</strong> strategies of<br />
transportation for encouraging people to use public transport services.<br />
2.3.1.1 IMPROVING THE OPERATIONAL EFFICIENCY OF PUBLIC PASSENGER TRANSPORT<br />
Important in urban bus transport services is primarily responsible for this transportation system<br />
dem<strong>and</strong> in the short <strong>and</strong> medium haul range is remarkable <strong>and</strong> desirable methods of service delivery<br />
is considered upgrading this system is as follows:<br />
– Bus lanes <strong>and</strong> automatic priority at intersection help.<br />
– Exclusive bus-ways perform nearly equivalent to rail-based systems at much lower cost<br />
(except in very high traffic volume corridors).<br />
2.3.1.2 IMPROVING THE OPERATIONAL EFFICIENCY OF MASS TRANSIT SYSTEMS<br />
Major contribution to mass transit urban spatial displacement of long-haul is responsible, <strong>and</strong> due to<br />
high capacity system can meet the bulk of the convention is the urban dem<strong>and</strong>. Strategies to improve<br />
the performance of this system are as follows:<br />
– Investment decisions based on comparative analysis of strategic objectives, technological<br />
alternatives, <strong>and</strong> socio-economic <strong>and</strong> financial implications—not on short-term political or<br />
commercial opportunism.<br />
– Rail-based mass transit systems have a role only in very large cities, as these are less<br />
congesting <strong>and</strong> serve the peripherally located in work journeys.
310<br />
International <strong>Building</strong> & <strong>Infrastructure</strong> Technology Conference<br />
7-8 June 2011, Vistana Hotel, Penang, Malaysia<br />
2.3.1.3 Improving the Operational Efficiency of Non Motorized Transport(NMT)<br />
The role of urban design should always non-motorized transport systems, special attention is because<br />
the most appropriate manner consistent with the transportation policies of urban sustainable<br />
development. therefore recommended the following solutions:<br />
– Due Recognition in Transport Planning, including road design<br />
– Provision for the rights <strong>and</strong> responsibilities of pedestrians <strong>and</strong> bicyclists in traffic law<br />
- National Strategy on NMT<br />
– Provide Separate <strong>Infrastructure</strong> where appropriate.<br />
2.3.1.4 The Role of the private sector in improving efficiency of Transport<br />
Private sector has significant capabilities in most transportation projects could assist the government.<br />
Also, professional <strong>and</strong> operational potential of the private sector as the best in ensuring the success of<br />
projects will be considered under items proposed to strengthen this section is expressed as :<br />
– In cases of very high dem<strong>and</strong> for faster movement, private capital finance can be secured for<br />
investments in roads <strong>and</strong> metros.<br />
– Public sector must maintain a strategic, planning <strong>and</strong> regulatory role in such scenarios – need<br />
very high quality public institutions to perform this role.<br />
2.3.1.5 Strategic Framework <strong>and</strong> Compare <strong>Infrastructure</strong> Capabilities of MRT <strong>Systems</strong><br />
Mass Rapid Transit (MRT) <strong>Systems</strong> with different capabilities are certainly require any special<br />
infrastructure.So implementing sustainable development objectives must first meet the needs of each<br />
city <strong>and</strong> town level, then the dem<strong>and</strong> of citizens based on needs assessment to be appropriations act.<br />
more specifications <strong>and</strong> requirements of each system Noted:<br />
– Busways – these are generally segregated sections of roadway within major corridors, with<br />
horizontal protection from other traffic, <strong>and</strong> priority over other traffic at junctions, which are<br />
generally signalized.<br />
– Light rail transit (LRT) – this is at-grade, with similar horizontal protection to busways.<br />
– Metros – these are fully segregated, usually elevated or underground. It is the segregation that<br />
is critical to providing a rapid service, <strong>and</strong> the technology that allows a high mass ridership to<br />
be carried.<br />
– Suburban rail – these services are usually physically part of a larger rail network, usually atgrade<br />
<strong>and</strong> fully segregated incorporating road-rail segregation or controlled level-crossings.<br />
Continue this topic in all urban public transport systems of various aspects is reviewed:<br />
� Use of space<br />
– Busways usually involve reallocation of existing roadspace<br />
– LRT often does the same, but may also add new capacity, e.g., when using former rail<br />
alignment.<br />
– Metros add new capacity, typically increasing the passenger-carrying capacity of a<br />
major corridor by a factor of 3 (they may have no impact on road capacity, or if<br />
elevated lead to small reduction)<br />
� Integration<br />
– All systems require interchange to provide an integrated public transport system<br />
– Rail systems, <strong>and</strong> busways operating ‘trunk-<strong>and</strong>-feeder’ services require more<br />
interchange.<br />
� Capacity<br />
– Busways depending on specification, have a practical capacity of 10-20,000<br />
passengers per hour per direction (pphpd), or occasionally higher.<br />
– There are no examples of LRT carrying flows in excess of 10,000 pphpd, <strong>and</strong> there is<br />
reason to doubt whether they can achieve much higher flows.<br />
– Metros by comparison carry very large passenger volumes – 60,000 pphpd or higher;<br />
<strong>and</strong> high-specification suburban rail can typically carry 30,000 pphpd.<br />
� Level of service<br />
– Rail systems can generally provide a high quality ride, <strong>and</strong> when segregated,<br />
regularity.<br />
– Bus systems perform less well in these respects.<br />
� Common Features<br />
– Physically segregated busways
– Trunk-feeder operations<br />
– Fare prepayment, flat fares, free transfers with feeder buses<br />
– High station platforms<br />
– Mostly operated by private bus companies<br />
– High passenger dem<strong>and</strong><br />
– Quick implementation<br />
– Much lower cost than LRT or metro alternative<br />
– Metro-like appearance<br />
– Distinct identity <strong>and</strong> good image<br />
311<br />
International <strong>Building</strong> & <strong>Infrastructure</strong> Technology Conference<br />
7-8 June 2011, Vistana Hotel, Penang, Malaysia<br />
3. CONCLUSIONS<br />
In this paper, transport strategies was evaluated. Based on the concept of sustainable urban<br />
development, spatial development framework that will justify the stability of the current needs without<br />
spatial risk for future generations the ability to supply their needs have to provide. <strong>Sustainable</strong> cities<br />
need sustainable urban transport , therefore to create the infrastructure for the needs of communities<br />
in the principles is essential. Transport planning in cities is focused on passenger transport.Urban<br />
freight transport is a significant threat <strong>and</strong> needs a higher policy <strong>and</strong> action priority . So strategies for<br />
increasing transportation sustainability include dem<strong>and</strong> management,operations management,pricing<br />
policies,vehicle transportation planning. In order to achieve sustainable development objectives of<br />
urban citizens must first identify local needs <strong>and</strong> potentials in each region then assess funding <strong>and</strong><br />
schedule specific transport strategies to be implemented step by step.<br />
REFERENCES<br />
Alic,John A.(1997).”Technological Development&Urban Sustanability.”Technological Forecasting <strong>and</strong><br />
Social Change.<br />
Bell M., Chen H., Hackman M., McCabe K. <strong>and</strong> Price S.(2006) Using ITS to Reduce Environmental<br />
Impacts.Proceeding of the 13 th World Congress on Intelligent Transport <strong>Systems</strong>.London,UK.<br />
Deakin,Elizabeth(2001)"<strong>Sustainable</strong> Development <strong>and</strong> <strong>Sustainable</strong> Transportation." Strategies for<br />
Economic Prosperity,Environmental Quality,<strong>and</strong> Equity.<br />
Durrani A.,Menckhoff G.,Gvame V.(2006)"Options For Mass Rapid Transit Under Integrated Urban<br />
Transport Frame Work."<br />
Harbord B., White J.,McCabe K.,Riley A. <strong>and</strong> Tarry S.(2006) "Traffic Technology International<br />
Annual."Calmed <strong>and</strong> Controlled:Improving Efficiency,Safety <strong>and</strong> Emissions,UKIP Media Events.<br />
Stauffacher M., Walter A.I.,Lang D. J.,Wiek A.<strong>and</strong> Scholz R. W.(2006) Learning to research<br />
enviromental problems from a functional sociocultural constructivism perspective:The<br />
transdiscipplinary case study approach.International Journal of Sustainability in Higher Education.
T168<br />
312<br />
International <strong>Building</strong> & <strong>Infrastructure</strong> Technology Conference<br />
7-8 June 2011, Vistana Hotel, Penang, Malaysia<br />
GIS BASED STUDIES OF GEOTECHNICAL PROPERTIES FOR LAND<br />
DEVELOPMENT PLANNING AND DESIGN<br />
Wan Nur Syazwani W.M 1 <strong>and</strong> A. Naser Abdul Ghani 2<br />
1 Universiti Teknologi MARA (Perak) Malaysia,<br />
2 Universiti Sains Malaysia<br />
1 wannur956@perak.uitm.edu.my , 2 anaser@usm.my<br />
ABSTRACT: The benefits of GIS in terms of data access <strong>and</strong> representation contribute to the ability to<br />
make a quick decision making. It will also provide the basis of design <strong>and</strong> budgeting as well as<br />
creating a platform of communications among practitioners especially in relation to l<strong>and</strong> development.<br />
Therefore, this paper describes the use of a Geographic Information System (GIS) in a geotechnical<br />
study applied in the area of Seri Isk<strong>and</strong>ar, an upcoming new township in the District of Perak Tengah,<br />
Perak Darul Ridzuan, Malaysia. The study is to see how the various soil data information can be<br />
stored in GIS format. The database can be retrieved for processing <strong>and</strong> can be reproduced into<br />
meaningful decision support information in terms of geotechnical properties of the area concerned.<br />
The ability to access data at any time (now or later) is the main benefit of using this GIS method,<br />
moreover it will reduce time <strong>and</strong> possibly cost of site investigations. The GIS system developed in this<br />
study is capable of quickly producing various geotechnical information in any part of the study area.<br />
This information can be in the form of maps of soil types, soil strength, <strong>and</strong> water levels. It can also<br />
produce detail information relevant to the site <strong>and</strong> laboratory test results. This information will be<br />
useful to planners, architects <strong>and</strong> engineers in planning <strong>and</strong> designing suitable buildings <strong>and</strong><br />
infrastructures in the area. The paper concludes with discussions of possible future application of the<br />
GIS in the technical aspects of l<strong>and</strong> development planning <strong>and</strong> design.<br />
Keyword: Geographic Information System, GIS, Geotechnical, L<strong>and</strong> Development<br />
1. INTRODUCTION<br />
L<strong>and</strong> development becomes increasingly challenging today as our population increases <strong>and</strong> available<br />
l<strong>and</strong> becomes scarcer. Thus, smart development in planning is important in order to sustain the<br />
development. In addition, design, technology selection, <strong>and</strong> any other issue related to construction<br />
must be taken into consideration in developing any l<strong>and</strong>. Moreover, the developer spends a lot of<br />
money <strong>and</strong> sets budgets to demonstrate the development programmes <strong>and</strong> the designs must comply<br />
with the regulations needed. According to Budhu (2004), soil investigation process which is an<br />
important part before the design stage is being implemented in order to save a million ringgit <strong>and</strong> to<br />
keep the budget accordingly.<br />
However, currently most developers, contractors <strong>and</strong> consultants are not serious on this site<br />
investigation process due to the cost being expensive. As a result, the projects tend to fail <strong>and</strong> the cost<br />
will over-run (Budhu, 2004). Another issue related to site investigation is the report done after the<br />
investigation is over. The question is, how the report can be stored <strong>and</strong> how about ten years later, the<br />
report be retrieved.<br />
2. LITERATURE REVIEW<br />
As a developing country, technology becomes important in Malaysia. The development of technology<br />
in daily life is also important. Thus, the application of GIS (geographic Information system) is also<br />
needed especially, for site investigations preliminary study. As mentioned by Player (2000), the<br />
integration of information together with supporting documents such as maps, books, reports, etc. will<br />
give important effects during preliminary studies of site investigations. In the geotechnical discipline,<br />
the spatial study covers the related space of areas under study. Thus, by using GIS application, the<br />
maps, photos, etc. are also linked with their data feature <strong>and</strong> are analyzed spatially (Player, 2000).
313<br />
International <strong>Building</strong> & <strong>Infrastructure</strong> Technology Conference<br />
7-8 June 2011, Vistana Hotel, Penang, Malaysia<br />
Moreover, in this geotechnical study, the geotechnical data will integrate as database will be created<br />
<strong>and</strong> also visualization in terms of mapping, chart, etc. will also be generated to make the users<br />
underst<strong>and</strong> the matter well.<br />
Therefore, in l<strong>and</strong> development planning <strong>and</strong> design, GIS application is more important especially, in<br />
the process of site investigations preliminary study. In addition, GIS acts as a decision tool to<br />
determine the future development <strong>and</strong> foundation available in that certain area of focus. Then, to<br />
develop the database of the site, ArcGIS is applied within 1:10,000 of scale. All the site investigation<br />
information especially related to soil investigation is also needed <strong>and</strong> used in order to create the<br />
database.<br />
3. STUDY AREA<br />
This paper covers the area of Seri Isk<strong>and</strong>ar, District of Perak Tengah, Perak Darul Ridzuan. Currently,<br />
the new township of Seri Isk<strong>and</strong>ar is developing as an administrative capital which consists of a lot of<br />
government buildings, commercial buildings, <strong>and</strong> education centers such as UiTM Perak <strong>and</strong><br />
Universiti Teknologi Petronas. According to Majlis Perb<strong>and</strong>aran Seri Isk<strong>and</strong>ar (2009), Seri Isk<strong>and</strong>ar<br />
area covers 3,422.14 hectare or 34.22km 2. The site locations are divided into four areas such as<br />
B<strong>and</strong>ar Baru Seri Isk<strong>and</strong>ar (600.63 acres), UiTM Perak (11.6 acres), Latihan Kemas (ILK) Seri<br />
Isk<strong>and</strong>ar (7 acres), <strong>and</strong> Government Quarters (63 acres).<br />
Figure 1. Key Plan of District Seri Isk<strong>and</strong>ar<br />
(Source: www.googleimage.com)<br />
4. METHODOLOGY<br />
Figure 2. Site Plan of District Seri Isk<strong>and</strong>ar<br />
(Source: www.googleimage.com)<br />
(Source: www.googleimage.com)<br />
ArcGIS is one of Geographic Information <strong>Systems</strong> used in this research. There are two parts in this<br />
research where the first is the creation of a database <strong>and</strong> also a map display or visualization. In the<br />
development of database <strong>and</strong> visualization, most tools inside the ArcGIS are used.
5. RESULT AND DISCUSSION<br />
314<br />
International <strong>Building</strong> & <strong>Infrastructure</strong> Technology Conference<br />
7-8 June 2011, Vistana Hotel, Penang, Malaysia<br />
The figure below shows the attribute table of soil types <strong>and</strong> also soil penetration test for 3m, 5m, 10m,<br />
15m, 20m <strong>and</strong> 25m. With the help of ArcGIS, soil information data can be stored <strong>and</strong> retrieved<br />
effectively. For table 1, the qualitative method is applied to explain the soil types rather than the<br />
quantity. Meanwhile, for attribute table of SPT (Table 2), the quantitative method is applied as<br />
borehole name acts as a dependent variable, <strong>and</strong> SPT location is the independent variable.<br />
Database<br />
Table 1. Attribute table for soil types (Source: ESRI, 2008)<br />
Table 2. Attribute table for SPT (Source: ESRI, 2008)<br />
In addition, the data can also be represented in terms of a graph as generated from the attribute table<br />
above. ArcGIS helps to create the soil layer in every single borehole as per figure below. The layers<br />
drawn depend on the interval of soil type in every borehole (figure 1). Moreover, the bar chart can also<br />
represent the water level as in figure 2.
315<br />
International <strong>Building</strong> & <strong>Infrastructure</strong> Technology Conference<br />
7-8 June 2011, Vistana Hotel, Penang, Malaysia<br />
Figure 1. Bar chart of cross section of boreholes in Seri Isk<strong>and</strong>ar<br />
Figure 2. Bar chart of cross section of water level<br />
The next visualizer are shows the soil types <strong>and</strong> SPT in map display as ArcMap is choose.
Map display<br />
316<br />
International <strong>Building</strong> & <strong>Infrastructure</strong> Technology Conference<br />
7-8 June 2011, Vistana Hotel, Penang, Malaysia<br />
The important tools in this ArcMap such as Arc toolBox-Analysis Tools-proximity-thiessen<br />
polygon are selected. As a result, the point distribution will generate a polygon like the thiessen<br />
polygon.<br />
Figure 2, at 25m depth, clay type is shaded at borehole no 3 <strong>and</strong> another fourteen boreholes are<br />
unshaded. It also happens in figure 3, when BH3 only shows the SPT value ie 50 blows/cm <strong>and</strong> the<br />
others do not. In order to classify the various number of SPT, the SPT classification is used. In SPT<br />
value map, the result shows that the quantitative map is produced. The various colours show the<br />
spatial data with a different value. As shown in figure 5, there are five ranges of classes according to<br />
the value of SPT. This really can help the practitioners in the decision making process as they wish to<br />
do the development on the area.<br />
It means that, the area of BH3 is harder than other areas <strong>and</strong> the development can happen here.<br />
Thus, this affects the foundation design <strong>and</strong> budget. Moreover, the type of pile can be proposed at<br />
BH3 since it is the deepest <strong>and</strong> the SPT also reach 50 blows/cm as at this level.<br />
Figure 2. Soil type area at 25m
Data Presentation<br />
Figure 3. SPT value at 25m<br />
317<br />
International <strong>Building</strong> & <strong>Infrastructure</strong> Technology Conference<br />
7-8 June 2011, Vistana Hotel, Penang, Malaysia<br />
On the other h<strong>and</strong>, after the soil data are stored in the database form <strong>and</strong> also produced in the map,<br />
then they are ready to be presented to others. Moreover, they can be presented in terms of reports,<br />
posters, etc. of which the results are shown in figure 4 <strong>and</strong> 5 below.<br />
Figure 4. Map layout design for Soil types at 5 m
6. CONCLUSIONS<br />
Figure 5. Map layout design for SPT at 5m<br />
318<br />
International <strong>Building</strong> & <strong>Infrastructure</strong> Technology Conference<br />
7-8 June 2011, Vistana Hotel, Penang, Malaysia<br />
As a conclusion, ArcGIS tools provide a lot of beneficial information <strong>and</strong> decision making especially, in<br />
determining the development on the area especially at the preliminary stage. With the help of this<br />
software, the type of foundation can also be designed according to the soil type <strong>and</strong> SPT strength.<br />
Moreover, the geotechnical data can be saved as storage <strong>and</strong> can be well managed in the GIS format.<br />
ACKNOWLEDGEMENT<br />
Special thanks are extended to a lot of people in helping us to complete this paper. JUPEM, Majlis<br />
Perb<strong>and</strong>aran Seri Isk<strong>and</strong>ar, Pejabat Tanah Seri Isk<strong>and</strong>ar, Bahagian Perancangan B<strong>and</strong>ar dan<br />
Wilayah are the important bodies that give a lot of information. Thanks also go to JKR, Contractor,<br />
Seri Isk<strong>and</strong>ar Develepor <strong>and</strong> Consultant for their Soil Investigation report. Lastly, thanks to my friend<br />
especially from Surveying Science <strong>and</strong> Geomatics Department, Town Planning Department, UiTM<br />
Perak <strong>and</strong> also to my lovely family.<br />
REFERENCES<br />
Majlis Perb<strong>and</strong>aran Seri Isk<strong>and</strong>ar (2009), Kajian Profil B<strong>and</strong>ar Negeri Perak, Edisi Jun.<br />
Muniram Budhu (2004). ‘Foundation <strong>and</strong> Earth Structures’ (Draf), downloaded from<br />
http://www.ic.arizona.edu/ic/ce440/Site%20Characterization.pdf access on 22 nd Januari 2011.<br />
Player R. (2000). “Using GIS in Preliminary Geotechnical Site Investigations For Transportation<br />
Projects,MID-Continent Transportation Symposium 2000 Proceedings.
T169<br />
319<br />
International <strong>Building</strong> & <strong>Infrastructure</strong> Technology Conference<br />
7-8 June 2011, Vistana Hotel, Penang, Malaysia<br />
AN OVERVIEW ON INTEGRATING OF NON-MOTORIZED AND PUBLIC<br />
TRANSPORT IN URBAN ENVIRONMENT<br />
Bibie Sara Salleh 1 , Riza Atiq Abdullah O.K Rahmat 2 , Amiruddin Ismail 3 ,<br />
1, 2, 3 Universiti Kebangsaan Malaysia (UKM) , Bangi, Malaysia<br />
1,2,3 <strong>Sustainable</strong> Urban Transport Research Centre (SUTRA), UKM, Bangi, Malaysia<br />
bibie_sara@yahoo.com 1<br />
ABSTRACT: Ownership of cars in Shah Alam as a capital of Selangor, Malaysia is increasing at<br />
average rates of eight percent a year. This has resulted the congestion, noise <strong>and</strong> air pollution. Many<br />
of policy measures to reduce the congestion, noise <strong>and</strong> air pollution have been proposed <strong>and</strong><br />
implemented such as increased the capacity of road structure, limiting speed, upgrade the public<br />
transport system but there is no encouragement on the non-motorized (cycling <strong>and</strong> walking) as one of<br />
mode choice in Malaysia. One of the indicator for sustainable transportation in the state of Selangor is<br />
to encourage walking <strong>and</strong> cycling by the year 2020. Public transport has been seen to be a<br />
sustainable transport in the urban areas with the potential of competing with private cars. However, it<br />
does not provide door to door service which could mean extending bus routes to all parts of the city.<br />
This paper present a brief overview on how walking <strong>and</strong> bicycling as a feeder mode to increase the<br />
coverage of public transport to inaccessible areas. The integrated between public transport <strong>and</strong> nonmotorized<br />
vehicles may decrease the number of private cars <strong>and</strong> increase the quality of life. Malaysia<br />
plan towards non motorized also being discussed in this paper. As a conclusion, policymakers<br />
together with urban planners must approach the challenge of creating a sustainable city with the<br />
concerns of pedestrians <strong>and</strong> cyclists as a feedering mode to access to the public transport.<br />
Keywords : public transport, non-motorized, walking, cycling.<br />
1. INTRODUCTION<br />
In most of developing countries, passenger cars <strong>and</strong> trucks have become the most important transport<br />
modes. The provision of transportation infrastructure in the state of Selangor has been largely oriented<br />
towards the needs of private car users. The trends has resulted the limitation of availability, capacity<br />
<strong>and</strong> quality of public transport facilities in Shah Alam <strong>and</strong> current pattern of town planning <strong>and</strong> l<strong>and</strong><br />
use. At the same time, the public transport does not provided door to door service where it is<br />
inefficient to extend the bus routes to all parts of the city if there is a low dem<strong>and</strong> areas. The choose<br />
bicycles <strong>and</strong> walking as feeder mode can increase the coverage of bus to inaccessible area (Adjei,<br />
2010). Unfortunately, services <strong>and</strong> facilites for cyclists <strong>and</strong> pedestrians are mostly inadequated.<br />
Therefore, the traffic congestion has worsened in some places such as Batu Tiga, <strong>and</strong> TTDI Jaya. The<br />
problem is usually perceived in terms of safety <strong>and</strong> inconvenience faced by motorists rather than as a<br />
problem for the entire population. The concerns of pedestrians <strong>and</strong> cyclists are seldom acknowledged<br />
by policy makers <strong>and</strong> planners. This study is to moved away the traditional vies of highway provision<br />
that often leads to facilitates car dependent lifestyles where effect the congestion <strong>and</strong> air quality <strong>and</strong><br />
hoping that this research can help planners <strong>and</strong> decision makers in integrated non-motorized <strong>and</strong><br />
public transport planning in Shah Alam <strong>and</strong> elsewhere.<br />
2. RESEARCH PROBLEM<br />
The high rate of population increase brings challenges that need attention <strong>and</strong> action. Inefficient<br />
transportation system, inefficient infrastructure supply, insufficient community services <strong>and</strong> lack of<br />
urban design are degrading environmental quality <strong>and</strong> face issues of decline in quality of life.<br />
Inefficient transportation system will increase the private automobile use. Without proper
320<br />
International <strong>Building</strong> & <strong>Infrastructure</strong> Technology Conference<br />
7-8 June 2011, Vistana Hotel, Penang, Malaysia<br />
transportation infrastructures, the increase in private automobile may increase in congestion on the<br />
roads. High congestions have been attributed to the increase in traffic accident rates, noise <strong>and</strong> air<br />
pollution (Martens, 2004). Approximately 61 percent of the population in Klang Valley live 400 metres<br />
from the bus lane (possible walking distance). Roughly from the 4,000 bus stops in Klang Valley,40<br />
percent of them are not roofed <strong>and</strong> without any signboard. To prevent the problem of less access to<br />
public transport, less interaction between mode of transport <strong>and</strong> high congestion of traffic, people in<br />
Malaysia should be alleviated by encouraging to use public transport <strong>and</strong> non motorized vehicles<br />
which are cycling <strong>and</strong> walking. However, there has been no research on the real factors influencing<br />
cycling <strong>and</strong> walking in Malaysia. Policy measures to eliminate non motorized vehicles from urban<br />
arterial <strong>and</strong> other feeder networks have been implemented in other developing countries such as<br />
Delhi, Jakarta, Bangkok, Surabaya, Manila, Bogota <strong>and</strong> Beijing. To underst<strong>and</strong> the implementation of<br />
integrating of non motorized with public transport, this paper present a brief overview on how walking<br />
<strong>and</strong> bicycling as a feeder mode to increase the coverage of public transport to inaccessible areas <strong>and</strong><br />
how the integrated between public transport <strong>and</strong> non-motorized vehicles may decrease the number of<br />
private cars <strong>and</strong> increase the quality of life.<br />
.<br />
Figure 1. The increasing number of car ownerships in Malaysia<br />
(Malaysia Automative Association, 2010)<br />
3. STUDY AREA DESCRIPTION<br />
3.1 BACKGROUND<br />
Malaysia’s population in mid-2009 stoode at 28.3 million. From a total of 18.5 million in 2000, the<br />
projections from Malaysia’s National Physical Plan indicate that the population of Peninsular Malaysia<br />
in 2020 would increase to 26.8 million. Selangor’s population was 5.07 million in 2008, increasing from<br />
4.1 million in 2007. The projections from Selangor State Structure Plan indicates that Selangor’s<br />
population would grow by 2.9 percent to 7.3 million in 2020.The major urban centres in Selanogr are<br />
Petaling Jaya, Subang Jaya,Shah Alam, Ampang Jaya, Kajang <strong>and</strong> Klang. Shah Alam city has a<br />
population of more than 450,000 people with an area of 293 square kilometres <strong>and</strong> total revenue<br />
collected exceeds RM 100 million yearly. The Shah Alam Municipality has a density of 15.21 persons<br />
per hectare (Y.A.B Tan Sri Abd. Khalid bin Ibrahim, 2009).<br />
Shah Alam is a capital of Selangor, one of the state in Malaysia. It is located halfway between Kuala<br />
Lumpur <strong>and</strong> the Port Klang. Shah Alam climate is characterised by a warm, sunny days <strong>and</strong> cool<br />
nights all year round. The temperature ranges from 23°C to 33°C <strong>and</strong> the annual rainfall is 2670 mm.<br />
Most of the Shah Alam city occupy with housing areas with commercial centres making up most of the<br />
rest of the total of 56 city sections (Seksyen). The city has five shopping malls such as SACC Mall,<br />
(Plaza Alam Sentral), Plaza Shah Alam (formerly known as Shah Alam Mall) Anggerik Mall, Ole-Ole<br />
Seksyen 18 <strong>and</strong> Kompleks PKNS. There are also many schools, shops, banks, , hotels, medical<br />
centres <strong>and</strong> popular hypermarkets (Tesco, Giant <strong>and</strong> Tesco Extra). The commercial areas are situated<br />
mostly at the city centre sections of (Seksyen 14), Seksyen 13 <strong>and</strong> Seksyen 9.
321<br />
International <strong>Building</strong> & <strong>Infrastructure</strong> Technology Conference<br />
7-8 June 2011, Vistana Hotel, Penang, Malaysia<br />
3.2 PUBLIC TRANSPORT SERVICES<br />
Without access to the Light Rail Transit (LRT) <strong>and</strong> Monorail, residents have to rely on KTM Komuter,<br />
buses <strong>and</strong> taxis. Shah Alam KTM Komuter serves four stations in Shah Alam that lie on the Port Klang<br />
to Sentul line. There are Batu Tiga Komuter station, Shah Alam Komuter station (Seksyen 19),<br />
Padang Jawa Komuter station (Seksyen 17) <strong>and</strong> Bukit Badak Komuter station.<br />
RapidKL provides bus service to various areas in Shah Alam. Shah Alam KTM Komuter station is<br />
also currently served by one local shuttle bus. Batu Tiga KTM Komuter station is accessible via the<br />
following rapidKL buses - U62 : Klang - Sunway Pyramid - Klang U64 : Pasaramakota - Taman Sri<br />
Muda, Shah Alam - Pasaramakota U65 : Pasaramakota - Taman Alam Megah via Section 20 Shah<br />
Alam - Pasaramakota U80 : Pasaramakota - UiTM Section 2 Shah Alam - Pasaramakota T527 :<br />
Subang Mas - Section 15 Shah Alam - Subang Mas E4 : Terminal Jalan Sultan Mohamad - Klang -<br />
Terminal Jalan Sultan Mohamad. Mini bus service also provided from Shah Alam Kommuter station to<br />
Section 16, 17, Kompleks PKNS <strong>and</strong> Wet World (wikitravel.org, 2011).<br />
3.3 Walking <strong>and</strong> Cycling Facilities in Shah Alam<br />
Shah Alam Agricultural Park is also known as Taman Pertanian or Bukit Cahaya Seri Alam is one of<br />
the largest agriculture park in the world <strong>and</strong> built around a centerpiece artificial lake. It provides a<br />
jogging <strong>and</strong> biking path that goes around the lakes. Bicycles are available for rent at the park <strong>and</strong> a<br />
free bus service is provided to ferry visitors throughout. Shah Alam Lake Gardens also built around an<br />
artificial lake with several playgrounds for children, jogging <strong>and</strong> biking path around the lakes.<br />
Shah Alam Walk, a pedestrian-friendly area that is one of the attractions in the the city. It covers<br />
approximately 0.3 square kilometres which stretching over Jalan Institusi <strong>and</strong> Jalan Majlis in Shah<br />
Alam . It has become the city l<strong>and</strong>mark since 2004 when the city council had decided to spruce up the<br />
whole area with beautiful l<strong>and</strong>scape <strong>and</strong> fountains around the area.<br />
Shah Alam walk is covering three major Shopping Complexes in Shah Alam namely, SACC Mall,<br />
PKNS Complex <strong>and</strong> Plaza Alam Central. The place is also considered as a central business district for<br />
the city which consists of private <strong>and</strong> government offices, banks <strong>and</strong> shopping centres Shah Alam<br />
walk is directly linked with Dataran Shah Alam <strong>and</strong> other favourite retreats such as the Lake Gardens,<br />
Laman Budaya <strong>and</strong> Galery Shah Alam. For safety <strong>and</strong> monitoring purposes, the whole area has been<br />
equipped with CCTV system which is directly linked to Shah Alam Police Station.<br />
Though Shah Alam walk is popular <strong>and</strong> attractive for the pedestrian which is located in the middle of<br />
the Central <strong>and</strong> Bussiness District for the city, but vehicles which are parked along the pedestrian way<br />
affect the pedestrian. Visitors who come with own vehicles are advised to park their vehicles inside<br />
one of the shopping complexes <strong>and</strong> avoid parking their vehicles along the roadsides in order not to<br />
risk their vehicles being towed away by the local authority.<br />
Figure 1. Dataran Shah Alam is a part of the walk.
322<br />
International <strong>Building</strong> & <strong>Infrastructure</strong> Technology Conference<br />
7-8 June 2011, Vistana Hotel, Penang, Malaysia<br />
Figure 2 . Walking street with rows of palm trees an Balinese lights in the centre of the city<br />
Figure 3. The walk exudes serenity, especially at night.<br />
4. BICYCLE AND WALKING AS A FEEDERING MODE<br />
Less interaction between mode of transport effect the inefficiency of public transport service in<br />
Malaysia. A very obvious example is less interaction between Monorel <strong>and</strong> LRT stations at KL Central,<br />
Kuala Lumpur. Thuogh daily users approximately 3000 people but they have to walk for a distance of<br />
350 metres nearby construction site <strong>and</strong> they need to walk along the pedestrian walk which is not well<br />
prepared <strong>and</strong> without roof.Perhaps there are other facilities such as H<strong>and</strong> Tuah LRT station <strong>and</strong><br />
Titiwangsa LRT station where users face the same kind of problems (Transformation Goverment<br />
Programme, 2010).<br />
Bike parking is one of the key aspects of integrating bicycling with public transport (Pucher, 2010). The<br />
use of bicycle as a feeder mode to bus stop has been seen to be much healthy to the users (Banister,<br />
2008). The combined use of bicycle <strong>and</strong> public transport could be a competitive alternative to private<br />
car (Keijer & Rietveld, 2000). Research found that there is a significant increases in bicycling <strong>and</strong><br />
public transport use, but mainly for access trip <strong>and</strong> far less for egress trip (Martens, 2007). Access trip<br />
as mention by Martens is bicycle trips between home <strong>and</strong> suburban rail statio while egress trip means<br />
the bicycle trips between the terminal station <strong>and</strong> the activity end of trip.<br />
Waking is also an important mode to access public transport terminals (Wibowo & Olsxewski, 2005).<br />
They found that, the role of walking mode to access rail stations for three cities (BART, San Fransico,<br />
Tokyo Metro <strong>and</strong> Netherl<strong>and</strong>s) as shown in Figure 4. The proportion of walking to access the public<br />
transport is more than 20%. There is a higher proportion of walking in egress trip from station to the<br />
final destinations since most of the rail stations are located in city centre (Wibowo & Olsxewski, 2005).<br />
Most of public transport studies noted that walking as an access mode occurred up to 400 to 800<br />
meters or 10 to 15 minutes of walking time (O’Sullivan <strong>and</strong> Morrall, 1996).
Figure 4 . Access <strong>and</strong> Egress Mode Share<br />
Source : Wibowo <strong>and</strong> Olsxewski (2005)<br />
BART = Bay Area Rapid Transit, San Francisco<br />
323<br />
International <strong>Building</strong> & <strong>Infrastructure</strong> Technology Conference<br />
7-8 June 2011, Vistana Hotel, Penang, Malaysia<br />
Walking is a portion of total trip mode per day because commuters have to walk to other mode of<br />
transport if there is a short distance. According to UK DfT (2007), richer households tend to walk fewer<br />
short distance trips. Research found that a 400m walk to bus stops as the most comfortably distance<br />
for commuters (Murray et al, 1998). Rising incomes in developing countries will discourage people<br />
from cycling <strong>and</strong> walking in the future (Hook <strong>and</strong> Replogle, 1996).<br />
5. INTEGRATION OF BICYCLES WITH PUBLIC TRANSPORT<br />
Integration is defined as the movement of commuters from one place to another through rider-friendly<br />
intermodal facilities <strong>and</strong> inter-connections (Ibrahim, 2003). The ability of the cyclist to safely store their<br />
bicycle at park <strong>and</strong> ride or stations contribute to the successful integration of cycling with public<br />
transport (Johannesburg Report, 2009). The Bogota transport model is a highly successful,<br />
sustainable urban development models promoting non-motorized vehicle <strong>and</strong> public transport while<br />
restricting cars (Joewono &Kubota, 2005). The quality of such facilities in the Netherl<strong>and</strong>s has a<br />
positive effect on the perceptions of rail travel <strong>and</strong> encourage people to use public transport (Givoni<br />
<strong>and</strong> Rietveld, 2007).. The implementation of integrating bicycling with public transport as shown in<br />
Table 1.
324<br />
International <strong>Building</strong> & <strong>Infrastructure</strong> Technology Conference<br />
7-8 June 2011, Vistana Hotel, Penang, Malaysia<br />
Table 1. Implementation of integrating bicycle <strong>and</strong> public transport<br />
Implementation Strategy Implementing<br />
country<br />
Bicycle parking at<br />
rail stations<br />
Bike racks on<br />
buses<br />
� 740.000 bikes parked at<br />
Tokyo’s metro <strong>and</strong> train station<br />
everyday (Harden, 2008).<br />
� 350,000 bikes parked at Dutch<br />
train’s station (Dutch Nationnal<br />
railways, 2009)<br />
� 72% of buses equipped with<br />
bike racks in US (TRB, 2005)<br />
� 80% of Canadian buses<br />
equipped with bike racks<br />
(TRB, 2005)<br />
Rental bikes � With Smart Card <strong>and</strong> OV-Fiets<br />
(public transport bicycle<br />
system), bicycle rental<br />
provided at 156 Dutch rail<br />
stations (Putcher &<br />
Buehler,2008)<br />
� Call-a-bike rentals at 16 train<br />
station in German (Putcher &<br />
Buehler, 2008)<br />
Bikes on rail cars � In Europe <strong>and</strong> North<br />
America,during off –peak<br />
hours,often special space on<br />
rail cars that reserved for<br />
bikes, sometimes with hooks<br />
<strong>and</strong> bike racks ; many system<br />
prohibit bikes during peak<br />
hours (TRB, 2005)<br />
� Japan<br />
� Netherl<strong>and</strong><br />
� US<br />
� Canada<br />
� Netherl<strong>and</strong><br />
� German<br />
� Europe<br />
� North America<br />
Effects<br />
� Provision of good<br />
parking at public<br />
transport stations<br />
increases the<br />
number of public<br />
transport use as<br />
well as levels of<br />
bicycling (Rietveld<br />
(2000), Netherl<strong>and</strong>s<br />
Ministry of<br />
Transport (2009))<br />
� Public transport<br />
system s increases<br />
as well as<br />
increasing use of<br />
bicycle racks (TRB,<br />
2005)<br />
� Rental programs<br />
increased the<br />
public transport<br />
usage as well as<br />
increasing use of<br />
bicycle<br />
(Litman,2009<br />
Martens, 2007)<br />
&
325<br />
International <strong>Building</strong> & <strong>Infrastructure</strong> Technology Conference<br />
7-8 June 2011, Vistana Hotel, Penang, Malaysia<br />
Figure 5. (a) Bicycle rack on front of bus (Burden, 2006) (b) Bicycle rack (Fukushima, 2009)<br />
These are all examples of integration between public transport <strong>and</strong> cycling as non-motorized vehicle.<br />
While taking lesson from the successful integration elsewhere, it is necessary for Shah Alam or<br />
elsewhere to plan a functional integration mechanism depends on the travel dem<strong>and</strong> <strong>and</strong> traffic<br />
characteristic in that area.<br />
6. MALAYSIA PLAN TOWARDS NON MOTORIZED<br />
Malaysia is one the the presentatives of Asian countries at the Fifth Regional Environmentally<br />
<strong>Sustainable</strong> Transport (EST) Forum, which held in Bangkok, Thail<strong>and</strong> from 23 to 25 August 2010,<br />
express the intend to voluntarily develop <strong>and</strong> realize integrated <strong>and</strong> sustainable transport policy<br />
programmes, options <strong>and</strong> projects that will help realize the following EST goals <strong>and</strong> objectives by the<br />
year 2020 in the Asian region. One of the strategies to shift towards more sustainable modes is<br />
require Non-Motorized Transport (NMT) in transport master plans in all major cities including the<br />
improvement to bicycle <strong>and</strong> pedestrian facilities, adoption of complete street design st<strong>and</strong>ards <strong>and</strong><br />
development of facilities for intermodal connectivity. There are some indicators that countries may<br />
considered in achieving a successful Non Motorized Transport Strategy as shown in Table 1.<br />
Table 1. List of indicators to achieve a successful EST strategy for Non –Motorized Transport<br />
(Bangkok Declaration 2020 in Fifth Regional EST Forum, 23-25 August)<br />
Strategy Indicator<br />
Non-Motorized<br />
Transport<br />
Number of cities with NMT specifically highlighted in transport master<br />
plan<br />
Note the existence of national <strong>and</strong> local policies requiring drop curbs<br />
at interface between intersections <strong>and</strong> footpaths.<br />
Note the existence of national <strong>and</strong> local policies m<strong>and</strong>ating dedicated<br />
pedestrian signals at major intersections<br />
Note the existence of national <strong>and</strong> local policies m<strong>and</strong>ating minimum<br />
footpaths widths.<br />
Number of cities with dedicated cycleways<br />
Number of secure bicycle parking spaces<br />
Number of kilometres of cycleways<br />
Promote the monitoring <strong>and</strong> measurement of the quality of pedestrian<br />
facilities <strong>and</strong> the number of cities audited for a walk ability score<br />
Number of cities with shared bicycle programs<br />
Number of cities with pedicab (cycle rickshaw) improvement<br />
programmes.<br />
Number of public transport systems with formal integration of<br />
pedicabs<br />
Number of cities participating in a Car-Free Day programme.
326<br />
International <strong>Building</strong> & <strong>Infrastructure</strong> Technology Conference<br />
7-8 June 2011, Vistana Hotel, Penang, Malaysia<br />
In Malaysia, Penang is the first country promoting cycling among locals <strong>and</strong> tourists. Penang starts<br />
proposing three cycling tracks to promote healthy lifestyle, environmental friendly transportation <strong>and</strong><br />
sports tourism. They was proposing three tracks from Teluk Bahang to George Town, Batu Maung to<br />
George Town via Jelutong Expressway <strong>and</strong> a heritage trail within George Town itself (Cheu, 2008).<br />
Metro Bike is the only one company which provide bicycle rent at RM25 with a deposit of RM100 for<br />
24 hours <strong>and</strong> people are free to cycle wherever they want. The bicycle for rent is provided at Tanjung<br />
City Marina (beside Jetty Bus Terminal in George Town) as a starting point. There are four safety<br />
measures for cycling tour in George Town (UNESCO George Town Heritage Cycling Tour Overview,<br />
2010):<br />
a. Weekend morning (les traffic)<br />
b. Safely guided bicycle trails<br />
c. Small group guided cycling<br />
d. Safely pedestrian crossover.<br />
Figure 6. (a)Bicycle for rent at George Town (b) Cycling with small group guided cycling<br />
(http://www.metrobike.com.my)<br />
7. CONCLUSIONS<br />
As a conclusion, policymakers together with urban planners must approach the challenge of creating a<br />
sustainable city with the concerns of pedestrians <strong>and</strong> cyclists. The public transport including buses,<br />
trains, cabs are provided in Malaysia but it is not provided door to door service where it is inefficient to<br />
extend the bus routes to all parts of the city if there is a low dem<strong>and</strong> areas. The choose bicycles <strong>and</strong><br />
walking as feeder mode can increase the coverage of bus to inaccessible area. This research can<br />
help planners <strong>and</strong> decision makers in integrated non-motorized <strong>and</strong> public transport planning in Shah<br />
Alam <strong>and</strong> elsewhere.<br />
REFERENCES<br />
Adjei, E (2010). Multi-modal urban transport : Integrating non-motorized <strong>and</strong> bus transport. Master of<br />
Sciece thesis. International Institute for Geo-Information Science <strong>and</strong> Earth Observation Enschede,<br />
The Nertherl<strong>and</strong>s.<br />
Banister, D (2008). The sustainable mobility paradigm. Transport Policy 15(2) : 73-80<br />
Burden, D. Bicycle Racks. Rietrieved 4 th March 2011 from<br />
http://www.pedbikeimages.org/pubdetail.cfm?picid=1564<br />
Burden, D. Bicycle Rack on front of bus. Rietrieved 4 th March 2011 from<br />
http://www.pedbikeimages.org/pubdetail.cfm?picid=1212<br />
Cheu, T.Y (2008). Tanjung Bungah assemblyman.The Star online. 11 th November 2008. Accessible at<br />
http://thestar.com.my/metro/story.asp?file=/2008/11/22/north/2617074&sec=north<br />
Cervero, R & Duncan, M (2003). Walking, Bicycling <strong>and</strong> Urban L<strong>and</strong>scape : Evidence from the San<br />
Francisco Bay Area. University of California Transportation Centre. Working Paper
327<br />
International <strong>Building</strong> & <strong>Infrastructure</strong> Technology Conference<br />
7-8 June 2011, Vistana Hotel, Penang, Malaysia<br />
Dutch National Railways (2009). Bicycling parking at train stations. Netherl<strong>and</strong>se Spoorwegen,<br />
Utretch, The Netherl<strong>and</strong>s<br />
Final Version, Bangkok Declaration for 2020-<strong>Sustainable</strong> Transport Goals for 2010-2020 (2010). Fifth<br />
Regional EST Forum, Bangkok Thail<strong>and</strong>.<br />
Givoni, M <strong>and</strong> Rietveld, P (2007). The access journey to the railway station <strong>and</strong> its role in<br />
passengers’satisfaction with rail travel. Transport Policy 14 (5) : 357-365<br />
Goverment Transformation Program (2010). Chapter 11 : Increasing the public transport usage in<br />
urban.<br />
Harden, B (2008). For bicyclists, a widening patchwork world. Washington post. August 31, 2008.<br />
Accessible at http://www.washingtonpost.com/wpdyn/content/article/2008/08/30/AR2008083000632.html<br />
Hook, W <strong>and</strong> Replogle, M (1996). Motorization <strong>and</strong> non-motorized transport in Asia : transport system<br />
evolution in China, Japan <strong>and</strong> Indonesia. L<strong>and</strong> Use Policy 13 (1) :69-84<br />
Ibrahim, M.F (2003). Improvement <strong>and</strong> integration of a public system : the case of Singapore. Cities<br />
20 (3) : 205-216<br />
Janic, M <strong>and</strong> Reggiani, A (2001). Integrated transport systems in the European Union : an overview of<br />
some recent developments. Transport Reviews 21 (4) : 469-497<br />
Joewono, T.B & Kubota, H (2005). The characteristics of Para-Transit <strong>and</strong> Non-motorized in B<strong>and</strong>ung,<br />
Indonesia. Journal of Eastern Asia Society for Transportation Studies. Vol 6 :262-277<br />
Kiejer, M.J.N, Rietveld, P (2000). How do people get to the railway station? The Dutch experience.<br />
Transportation Planning <strong>and</strong> Technology 23 : 215-235<br />
Martens, K (2007). Promoting bike <strong>and</strong> ride : the Dutch experience. Transport Research Part A 41 :<br />
326-338<br />
Murray, A.T & Davis, R (1998). Public transportation access. Transportation Research Part D :<br />
Transport & Environment 3 (5) : 319-328<br />
Ontario Trails Strategy, Ministry & Health Promotion (2005). Province of Ontario.<br />
O’Sullivan, S. <strong>and</strong> Morrall, J. (1996). Walking Distances to <strong>and</strong> from Light-Rail Transit Stations.<br />
Transportation Research Record, No. 1538, Transportation Research Board,National Research<br />
Council, Washington DC, pp. 19-26.<br />
Pucher, J & H<strong>and</strong>y, S (2010). <strong>Infrastructure</strong>, programs <strong>and</strong> policies to increase bicycling : An<br />
international review. Preventive Medicine 50 (2010) :S106-S125<br />
UK DfT (2007). Delivering a sustainable railway, White Paper CM 7176. Department for Transport,<br />
HMSO, London.<br />
UNESCO George Town Heritage Cycling Tour Overview, July 2010. Retrieved 11 th March 2011 from<br />
http://metrobike.com.my/Metro%20Bike%20Heritage%20Cycling%20Tour%20Overview.pdf<br />
Y.A.B Tan Sri Abd. Khalid bin Ibrahim (2009). Setting the Local Context-Urban Generation in<br />
Selangor. Interational Conference Urban Generation – Towards Selangor’s <strong>Sustainable</strong> <strong>Future</strong>.
T173<br />
328<br />
International <strong>Building</strong> & <strong>Infrastructure</strong> Technology Conference<br />
7-8 June 2011, Vistana Hotel, Penang, Malaysia<br />
A COMPARATIVE STUDY ON RC MULTI-STORIED BUILDING FRAMES DESIGN<br />
BETWEEN NON SWAY AND SWAY METHOD USING STAAD. PRO V8i<br />
SOFTWARE<br />
Noor Md. Sadiqul Hasan 1 , Habibur Rahman Sobuz 2 , Costas Ioannou 3 , Md. Shiblee<br />
Sayed 4<br />
1 Linton University College, Legenda Education Group, Malaysia<br />
2 Department of Civil Engineering, Universiti Malaysia Sarawak, Malaysia<br />
3, 4 School of Computing, IT & Engineering, University of East London, UK<br />
1 s_adiqul@yahoo.com, 2 habibkuet@yahoo.com, 3 c.s.ioannou@uel.ac.uk <strong>and</strong><br />
4 shiblee181@yahoo.com<br />
ABSTRACT: The aim of this paper is to investigate the non-sway <strong>and</strong> sway method multi-storey<br />
reinforced concrete frame with the numerical modelling analysis. Two buildings of 15- storeys <strong>and</strong> 6storeys<br />
having a height of 57.7 m <strong>and</strong> 23.5 m respectively have been designed by using the design<br />
software STAAD Pro V8i for non-sway <strong>and</strong> sway condition. To make the analysis more practical <strong>and</strong><br />
economical, column sizes have been changed in every three storeys <strong>and</strong> beam sizes kept constant.<br />
Analysis of the reinforced concrete building frames has shown that how the reinforcement of the<br />
beams <strong>and</strong> columns changed with the effect of wind loading. From the analysis of that reinforced<br />
concrete structures, it can be seen that the reinforcement of the beams <strong>and</strong> columns have been<br />
increased in sway frame compare to the non-sway frame. Analysis of the two buildings (one tall <strong>and</strong><br />
another one short) in reinforced concrete frame show that how the beam <strong>and</strong> column design is<br />
affected by the height of the building. Finally, it is concluded that the software analysis predict the<br />
response of the reinforced concrete multi-storied buildings frames very well.<br />
Keywords: column, beam, multi-storey building, non-sway, sway, staad. pro v8i.<br />
1. INTRODUCTION<br />
Concrete is one of the most versatile, durable <strong>and</strong> cost-effective building materials known to people. It<br />
has a vast role to play both in the construction <strong>and</strong> improvement of our civil engineering <strong>and</strong><br />
infrastructure. Its great strength, durability <strong>and</strong> flexibility are properties which are utilised in the<br />
construction of <strong>Building</strong>s, Roads, Bridges, Airports, Railways, Tunnels, Ports <strong>and</strong> Harbours <strong>and</strong> many<br />
other major infrastructure projects. Concrete is the material which provides the best fire resistance<br />
than any other building materials. When it exposed to fire, It does not burn, cannot be 'set on fire' like<br />
other materials in a building <strong>and</strong> it does not emit any toxic fumes, smoke or drip molten particles.<br />
Concrete is making an intensive, synchronized effort to further reduce its environmental impact which<br />
includes the emergent use of recycled concrete in cement <strong>and</strong> concrete manufacture. Concrete is<br />
classified as an A1 fire resistance material under EN 13501-1 which means that it can sustain itself in<br />
highly combustible environment <strong>and</strong> has a very low rate of heat transfer quality <strong>and</strong> prove itself as an<br />
effective shield against spread of fire. Due to the reason of global warming, sustainability is the most<br />
important issue in our present planet. Concrete is the highly sustainable construction material in terms<br />
of its thermal mass energy consumption <strong>and</strong> in energy consumed during its manufacturing. Concrete<br />
is the small net contributor which is responsible for 2.6% of UK CO2 emissions according to 2002 <strong>and</strong><br />
this compare to 33% <strong>and</strong> 47% of total CO2 emission from transport <strong>and</strong> buildings in use respectively.<br />
Having good durability quality, good strength in compression, casting in any shape according to<br />
architectural/structural requirement <strong>and</strong> also cost-effectiveness are some other major reasons for<br />
using concrete in the construction industry so much (The Concrete Centre, 2009). According to Wong,<br />
et al. (2007, pp. 961-969), the modification of Muto’s method has been approached for unbraced
329<br />
International <strong>Building</strong> & <strong>Infrastructure</strong> Technology Conference<br />
7-8 June 2011, Vistana Hotel, Penang, Malaysia<br />
composite frames with semi-rigid beam-to-column connections in multi-storey frames for sway <strong>and</strong><br />
non sway conditions. Wang (1997, pp. 101-116) has stated beneficial <strong>and</strong> detrimental effects of<br />
structural continuity for non sway multi-storey frames on fire resistant design of steel columns. Li, et al.<br />
(2004) has obtained some selected results from the full scale measurements of dynamic behaviour of<br />
a 63-storey reinforced concrete tall building.<br />
In this paper, the numerical modelling analysis of the reinforced concrete multi-storied building frames<br />
for non sway <strong>and</strong> sway method using Staad. Pro V8i software is investigated. Using the software the<br />
15 <strong>and</strong> 6 storey’s building have been designed at the condition of without sway <strong>and</strong> with sway <strong>and</strong> the<br />
analysis results are compared for beams <strong>and</strong> columns.<br />
2. METHODOLOGY<br />
In reinforced concrete construction, effect of wind in the multi-storey building has played an important<br />
role. Sometimes, it may happen to change the mind to allow or not to allow wind loading in the<br />
structure. In non sway buildings wind loading may be resisted by shear walls, service cores, housing<br />
lifts services <strong>and</strong> stair cases in the building. In sway buildings, wind loading will be resisted by the<br />
beams <strong>and</strong> the columns of the building which have to be designed considering the wind loading. The<br />
main aim of this study is to analyse <strong>and</strong> design of two multi-storey buildings in concrete (one tall <strong>and</strong><br />
another one short) both for non sway <strong>and</strong> sway condition <strong>and</strong> compare the obtained results (Allen,<br />
1988) <strong>and</strong> (Mosley & Bungey, 1990).<br />
2.1 Plan <strong>and</strong> sectional elevation of the proposed building<br />
A A<br />
Figure 1. Plan view <strong>and</strong> sectional elevation (A-A) of the 15 storey building
330<br />
International <strong>Building</strong> & <strong>Infrastructure</strong> Technology Conference<br />
7-8 June 2011, Vistana Hotel, Penang, Malaysia<br />
A Fi<br />
g<br />
Figure 2. Plan view <strong>and</strong> sectional elevation (A-A) of the 6 storey building<br />
Figure 3. Three dimensional rendered view of the 6 storey building
Floor<br />
Ground<br />
Floor<br />
331<br />
International <strong>Building</strong> & <strong>Infrastructure</strong> Technology Conference<br />
7-8 June 2011, Vistana Hotel, Penang, Malaysia<br />
2.2 ANALYSIS OF RESULTS (BRITISH STANDARDS INSTITUTION, 2002)<br />
2.2.1 COMPARISON BETWEEN MIDDLE FRAME WITHOUT SWAY AND WITH SWAY FOR 15<br />
STOREY BUILDING<br />
Table 1. Comparison of middle column without sway <strong>and</strong> with sway for middle frame<br />
Column<br />
size(square)<br />
m 2<br />
As required<br />
mm 2<br />
Middle column without sway Middle column with sway<br />
As provided<br />
mm 2<br />
Bar number<br />
<strong>and</strong> size<br />
As required<br />
mm 2<br />
As provided<br />
mm 2<br />
Bar number<br />
<strong>and</strong> size<br />
0.58 11931 12566 10 T 40 11931 12566 10 T 40<br />
3 rd Floor 0.51 9908 10053 8 T 40 9908 10053 8 T 40<br />
6 th Floor 0.44 7703 7854 4 T 50 7703 7854 4 T 50<br />
9 th Floor 0.37 5151 6434 8 T 32 5151 6434 8 T 32<br />
12 th<br />
Floor<br />
0.26 2860 2945 6 T 25 2860 2945 6 T 25<br />
Floor<br />
Ground<br />
Floor<br />
Table 2. Comparison of side column without sway <strong>and</strong> with sway for middle frame<br />
Column<br />
size (square)<br />
m 2<br />
As required<br />
mm 2<br />
Side column without sway Side column with sway<br />
As provided<br />
mm 2<br />
Bar number<br />
<strong>and</strong> size<br />
As required<br />
mm 2<br />
As provided<br />
mm 2<br />
Bar number<br />
<strong>and</strong> size<br />
0.58 3580 3619 18 T 16 5050 5655 18 T 20<br />
3 rd Floor 0.51 3658 3770 12 T 20 3759 3770 12 T 20<br />
6 th Floor 0.44 3504 3770 12 T 20 3617 3770 12 T 20<br />
9 th Floor 0.37 3136 3142 10 T 20 3136 3142 10 T 20<br />
12 th<br />
Floor<br />
0.26 2479 2945 6 T 25 2633 2945 6 T 25<br />
Floor<br />
Table 3. Comparison of beam (depth = 0.50 m <strong>and</strong> width = 0.40 m) for middle frame<br />
Left h<strong>and</strong><br />
side*<br />
mm 2<br />
Without sway With sway<br />
Middle *<br />
mm 2<br />
Right h<strong>and</strong><br />
side *<br />
mm 2<br />
Left h<strong>and</strong><br />
side*<br />
mm 2<br />
Middle *<br />
mm 2<br />
Right h<strong>and</strong><br />
side *<br />
mm 2<br />
Ground<br />
Floor<br />
6T20(1885)<br />
5T16(1005)<br />
4T25(1963)<br />
3T40(3770)<br />
6T16(1206) 6T16(1206)<br />
3T40(3770)<br />
6T16(1206)<br />
3 rd Floor<br />
5T20(1571)<br />
6T16(1206)<br />
5T25(2454)<br />
4T32(3217)<br />
6T16(1206) 6T16(1206)<br />
3T40(3770)<br />
6T16(1206)<br />
6 th Floor<br />
5T20(1571)<br />
6T16(1206) 5T25(2454)<br />
5T25(2454)<br />
6T16(1206) 6T16(1206)<br />
4T32(3217)<br />
9 th Floor<br />
5T20(1571)<br />
6T16(1206)<br />
5T25(2454)<br />
6T20(1885)<br />
6T16(1206)<br />
5T25(2454)<br />
12 th Floor<br />
6T20(1885)<br />
5T20(1571)<br />
5T16(1005)<br />
6T20(1885)<br />
5T20(1571)<br />
6T16(1206)<br />
*Note: In each row, upper one shows top Reinforcement <strong>and</strong> lower one shows bottom reinforcement of the beam.
Floor<br />
Ground<br />
Floor<br />
332<br />
International <strong>Building</strong> & <strong>Infrastructure</strong> Technology Conference<br />
7-8 June 2011, Vistana Hotel, Penang, Malaysia<br />
2.2.2 COMPARISON BETWEEN SIDE FRAME WITHOUT SWAY AND WITH SWAY FOR 15<br />
STOREY BUILDING<br />
Table 4. Comparison of Middle Column without Sway <strong>and</strong> with Sway for Side Frame<br />
Column<br />
size(square)<br />
m 2<br />
As required<br />
mm 2<br />
Middle column without sway Middle column with sway<br />
As provided<br />
mm 2<br />
Bar number<br />
<strong>and</strong> size<br />
As required<br />
mm 2<br />
As provided<br />
mm 2<br />
Bar number<br />
<strong>and</strong> size<br />
0.58 4844 4909 10 T 25 4844 4909 10 T 25<br />
3 rd Floor 0.51 4267 4399 14 T 20 4267 4399 14 T 20<br />
6 th Floor 0.44 3607 3770 12 T 20 3607 3770 12 T 20<br />
9 th Floor 0.37 2716 2945 6 T 25 2716 2945 6 T 25<br />
12 th<br />
Floor<br />
Floor<br />
Ground<br />
Floor<br />
0.26 1842 1885 6 T 20 1842 1885 6 T 20<br />
Table 5. Comparison of side column without sway <strong>and</strong> with sway for side frame<br />
Column<br />
size(square)<br />
m 2<br />
As required<br />
mm 2<br />
Side column without sway Side column with sway<br />
As provided<br />
mm 2<br />
Bar number<br />
<strong>and</strong> size<br />
As required<br />
mm 2<br />
As provided<br />
mm 2<br />
Bar number<br />
<strong>and</strong> size<br />
0.58 1346 1358 12 T 12 1792 1810 16 T 12<br />
3 rd Floor 0.51 1040 1207 24 T 8 2104 2200 28 T 10<br />
6 th Floor 0.44 1007 1207 24 T 8 1735 1810 16 T 12<br />
9 th Floor 0.37 1475 1571 20 T 10 2574 2715 24 T 12<br />
12 th<br />
Floor<br />
0.26 1616 1810 16 T 12 1989 2413 12 T 16<br />
Floor<br />
Table 6. Comparison of beam (Depth = 0.50 m <strong>and</strong> Width = 0.40 m) for side frame<br />
Left h<strong>and</strong><br />
side*<br />
mm 2<br />
Without sway With sway<br />
Middle *<br />
mm 2<br />
Right h<strong>and</strong><br />
side *<br />
mm 2<br />
Left h<strong>and</strong> side<br />
*<br />
mm 2<br />
Middle *<br />
Ground 6T16(1206)<br />
6T16(1206) 4T32(3217)<br />
4T32(3217)<br />
Floor<br />
8T10(628)<br />
7T12(792) 7T12(792) 7T12(792)<br />
3<br />
*Note: In each row, upper one shows top reinforcement <strong>and</strong> lower one shows bottom reinforcement of the beam.<br />
rd Floor<br />
4T20(1257)<br />
4T16(804)<br />
3T20(942) 4T32(3217)<br />
7T12(792) 7T12(792)<br />
5T25(2454)<br />
7T12(792)<br />
6 th Floor<br />
5T20(1571)<br />
6T12(679)<br />
5T16(1005) 5T25(2454)<br />
6T12(679) 6T12(679)<br />
6T20(1885)<br />
6T12(679)<br />
9 th Floor<br />
6T16(1206)<br />
7T12(792)<br />
7T12(792) 6T20(1885)<br />
7T12(792)<br />
6T16(1206)<br />
7T12(792)<br />
12 th Floor<br />
8T10(628)<br />
3T20(942)<br />
4T20(1257) 7T12(792)<br />
3T20(942) 3T20(942)<br />
4T20(1257)<br />
mm 2<br />
Right h<strong>and</strong><br />
side *<br />
mm 2
Floor<br />
Ground<br />
Floor<br />
333<br />
International <strong>Building</strong> & <strong>Infrastructure</strong> Technology Conference<br />
7-8 June 2011, Vistana Hotel, Penang, Malaysia<br />
2.2.3 COMPARISON BETWEEN MIDDLE FRAME WITHOUT SWAY AND WITH SWAY FOR 6<br />
STOREY BUILDING<br />
Table 7. Comparison of Middle Column without Sway <strong>and</strong> with Sway for Middle Frame<br />
Column<br />
size(square)<br />
m 2<br />
As required<br />
mm 2<br />
Middle column without sway Middle column with sway<br />
As provided<br />
mm 2<br />
Bar number<br />
<strong>and</strong> Size<br />
As required<br />
mm 2<br />
As provided<br />
mm 2<br />
Bar number<br />
<strong>and</strong> size<br />
0.36 5949 7540 6 T 40 5949 7540 6 T 40<br />
3 rd Floor 0.26 3078 3217 4 T 32 3078 3217 4 T 32<br />
Floor<br />
Ground<br />
Floor<br />
Table 8. Comparison of Side Column without Sway <strong>and</strong> with Sway for Middle Frame<br />
Column<br />
size(square)<br />
m 2<br />
As required<br />
mm 2<br />
Side column without sway Side column with sway<br />
As provided<br />
mm 2<br />
Bar number<br />
<strong>and</strong> size<br />
As required<br />
mm 2<br />
As provided<br />
mm 2<br />
Bar number<br />
<strong>and</strong> size<br />
0.36 2208 2413 12 T 16 2423 2514 8 T 20<br />
3 rd Floor 0.26 1873 1885 6 T 20 1971 2945 6 T 25<br />
Floor<br />
Table 9. Comparison of beam (Depth = 0.50 m <strong>and</strong> Width = 0.40 m) for middle frame<br />
Left h<strong>and</strong><br />
side*<br />
mm 2<br />
Without sway With sway<br />
Middle *<br />
mm 2<br />
Right h<strong>and</strong><br />
side *<br />
mm 2<br />
Left h<strong>and</strong><br />
side*<br />
mm 2<br />
Middle *<br />
mm 2<br />
Right h<strong>and</strong><br />
side *<br />
mm 2<br />
Ground 5T25(2454)<br />
5T20(1571) 5T25(2454)<br />
6T20(1885)<br />
Floor<br />
6T16(1206)<br />
6T16(1206)<br />
3 rd Floor<br />
5T25(2454)<br />
5T20(1571)<br />
7T12(792) 5T25(2454)<br />
5T20(1571)<br />
5T16(1006)<br />
5T20(1571)<br />
*Note: In each row, upper one shows top reinforcement <strong>and</strong> lower one shows bottom reinforcement of the beam.<br />
Floor<br />
Ground<br />
Floor<br />
2.2.4 COMPARISON BETWEEN SIDE FRAME WITHOUT SWAY AND WITH SWAY FOR 6<br />
STOREY BUILDING<br />
Table 10. Comparison of middle column without sway <strong>and</strong> with sway for side frame<br />
Column<br />
size(square)<br />
m 2<br />
As required<br />
mm 2<br />
Middle column without sway Middle column with sway<br />
As provided<br />
mm 2<br />
Bar number<br />
<strong>and</strong> size<br />
As required<br />
mm 2<br />
As provided<br />
mm 2<br />
Bar number<br />
<strong>and</strong> size<br />
0.36 2325 2413 12 T 16 2325 2413 12 T 16<br />
3 rd Floor 0.26 1413 1885 6 T 20 1413 1885 6 T 20
Floor<br />
Ground<br />
Floor<br />
334<br />
International <strong>Building</strong> & <strong>Infrastructure</strong> Technology Conference<br />
7-8 June 2011, Vistana Hotel, Penang, Malaysia<br />
Table 11. Comparison of side column without sway <strong>and</strong> with sway for side frame<br />
Column<br />
size(square)<br />
m 2<br />
As required<br />
mm 2<br />
Side column without sway Side column with sway<br />
As provided<br />
mm 2<br />
Bar number<br />
<strong>and</strong> size<br />
As required<br />
mm 2<br />
As provided<br />
mm 2<br />
Bar number<br />
<strong>and</strong> size<br />
0.36 518 604 12 T 8 1062 1207 24 T 8<br />
3 rd Floor 0.26 1224 1257 4 T 20 1433 1608 8 T 16<br />
Floor<br />
Table 12. Comparison of beam (Depth = 0.50 m <strong>and</strong> Width = 0.40 m) for side frame<br />
Left H<strong>and</strong><br />
side*<br />
mm 2<br />
Without sway With sway<br />
Middle *<br />
mm 2<br />
Right h<strong>and</strong><br />
side *<br />
mm 2<br />
Left h<strong>and</strong><br />
side*<br />
mm 2<br />
Middle *<br />
mm 2<br />
Right h<strong>and</strong><br />
side *<br />
mm 2<br />
Ground 7T12(792)<br />
4T20(1257) 6T16(1206)<br />
5T20(1571)<br />
Floor<br />
7T12(792)<br />
7T12(792)<br />
3 rd Floor<br />
4T12(452)<br />
5T16(1006)<br />
5T20(1571) 5T12(565)<br />
5T16(1006) 5T16(1006)<br />
5T20(1571)<br />
*Note: In each row, upper one shows top reinforcement <strong>and</strong> lower one shows bottom reinforcement of<br />
the beam.<br />
2.3 DISCUSSION OF RESULTS<br />
2.3.1 FOR 15 STOREY BUILDING<br />
According to Table 1, it can be seen that middle column of middle frame without sway <strong>and</strong> with sway<br />
have the same amount of reinforcement in each floor. This is because, large amount of axial load from<br />
load combination 1.4 Dead Load + 1.6 Imposed Load is governing rather than the load combination<br />
1.2 Dead Load + 1.2 Imposed Load + 1.2 Wind Load.<br />
From Table 2, it can be seen that the reinforcement in the side column of middle frame has increased<br />
to 18 T 20 (5050 mm 2 ) in sway frame from 18 T 16 (3580 mm 2 ) at ground floor because of the<br />
governing load combination which includes wind load. And for all other side columns though area of<br />
reinforcement has slightly (approximately 3%) increased, same size of bar are used.<br />
From Table 3, it can be found that the bottom reinforcement at middle of the beam is almost the same<br />
in sway <strong>and</strong> non sway cases but extra amount of reinforcement has provided in the left <strong>and</strong> right h<strong>and</strong><br />
side bottom of the beam for sway cases except 9 th <strong>and</strong> 12 th floor. This is happened so to develop the<br />
necessary moment of resistance because the moment has increased significantly (approximately 50-<br />
60%) due to wind loading. And in 9 th <strong>and</strong> 12 th floor, the amount of reinforcement (approximately 20%)<br />
has also increased for wind loading in sway cases.<br />
According to Table 4, it can be seen that middle column of side frame without sway <strong>and</strong> with sway<br />
have the same amount of reinforcement in each floor. This is because, large amount of axial load by<br />
load combination 1.4 Dead Load + 1.6 Imposed Load is governing rather than the load combination<br />
1.2 Dead Load + 1.2 Imposed Load + 1.2 Wind Load.<br />
From Table 5, it can be observed that reinforcement has increased (approximately 33-83%) for all the<br />
side column of the side frame because of the governing wind load combination.<br />
From Table 6, it can be found that the bottom reinforcement at middle of beam is almost the same in<br />
sway <strong>and</strong> non sway cases but extra amount of reinforcement is needed in the left <strong>and</strong> right h<strong>and</strong> side<br />
bottom of the beam for sway cases. This is happened so to develop the necessary moment of<br />
resistance because the moment has increased significantly (approximately 20-50%) due to wind<br />
loading.
2.3.2 FOR 6 STOREY BUILDING<br />
335<br />
International <strong>Building</strong> & <strong>Infrastructure</strong> Technology Conference<br />
7-8 June 2011, Vistana Hotel, Penang, Malaysia<br />
According to Table 7 <strong>and</strong> 10, it can be found that middle column of middle <strong>and</strong> side frame for sway<br />
<strong>and</strong> non sway cases, the amount of reinforcement is same in each floor. As because large amount of<br />
axial load by load combination 1.4 Dead Load + 1.6 Imposed Load is governing rather than the load<br />
combination 1.2 Dead Load + 1.2 Imposed Load + 1.2 Wind Load. And from Table 8, it can be<br />
observed that the amount of reinforcement has increased (approximately 4%) in sway cases for side<br />
column of middle frame because of wind loading.<br />
According to Table 9, it can be observed that bottom reinforcement at middle of the beam <strong>and</strong> top<br />
reinforcement at right h<strong>and</strong> side of the beam are almost the same in sway <strong>and</strong> non sway cases. But at<br />
ground floor, approximately 20% more top reinforcement is needed at right h<strong>and</strong> side of the beam in<br />
sway frame due to wind loading. And at 3 rd floor, approximately 27% more top reinforcement is<br />
needed at right h<strong>and</strong> side of the beam <strong>and</strong> also extra amount of reinforcement (5T20) has provided at<br />
right h<strong>and</strong> side bottom of the beam for sway cases due to wind loading.<br />
From Table 11, it can be seen that the amount of reinforcement has increased significantly<br />
(approximately 100%) <strong>and</strong> slightly (approximately 4%) for ground floor <strong>and</strong> 3 rd floor respectively due to<br />
wind loading.<br />
From Table 12, it can be found that bottom reinforcement at middle of the beam is almost the same in<br />
both sway <strong>and</strong> non sway condition. But at ground floor, approximately 52% <strong>and</strong> 25% more top<br />
reinforcement is needed at left <strong>and</strong> right h<strong>and</strong> side of the beam respectively in sway frame due to wind<br />
loading. At 3 rd floor, approximately 25% more top reinforcement is needed at left h<strong>and</strong> side of the<br />
beam <strong>and</strong> also extra amount of reinforcement (5T16) has provided at left h<strong>and</strong> side bottom of the<br />
beam for sway cases due to wind loading.<br />
According to the design results of the 15 <strong>and</strong> 6 storey building, it can be seen that the middle column<br />
became same in both sway <strong>and</strong> non sway cases. In 15 <strong>and</strong> 6 storey building, the amount of<br />
reinforcement has increased slightly (approximately 4%) in sway cases for side column of middle<br />
frame. But for side column of side frame, the reinforcement has increased significantly (approximately<br />
up to 100%) for both 15 <strong>and</strong> 6 storey building in sway cases due to wind loading. In 15 storey building,<br />
beam reinforcement has increased approximately up to 60% <strong>and</strong> in 6 storey building, it has increased<br />
approximately up to 30% in sway frame. This is so happened as because of the significant effect of<br />
wind loading in 15 storey building.<br />
3. CONCLUSIONS<br />
The following conclusion can be made based on the analysis of the RC multi-storied building frames<br />
for non sway <strong>and</strong> sway method using Staad. Pro V8i software:<br />
� Because of load increasing from top to bottom, the size of column has also increased in every<br />
three storeys as economy is a big issue.<br />
� As because of symmetry, the design results of the right h<strong>and</strong> side <strong>and</strong> left h<strong>and</strong> side column of<br />
every frame is similar.<br />
� The design results of the left h<strong>and</strong> side <strong>and</strong> right h<strong>and</strong> side beams for all frames are the mirror<br />
of each other due to symmetry of load <strong>and</strong> plan of the building.<br />
� It can be observed that if the height of the building has shortened, column sizes become much<br />
smaller but beam size remained constant.<br />
� In sway <strong>and</strong> non-sway cases, the reinforcement of middle column remains constant but for<br />
side column, it has increased in sway cases due to wind loading. Side column of side frame of<br />
the building had shown more change of reinforcement in sway cases for wind loading.<br />
� The bottom middle reinforcement of the beam is almost the same for both sway <strong>and</strong> non sway<br />
cases but extra amount of reinforcement has provided at the left <strong>and</strong> right h<strong>and</strong> side of the<br />
beam for sway conditions due to wind loading.<br />
� Beam reinforcement has not changed significantly in the upper floors because of smaller<br />
effect of wind loading at the upper floors.<br />
REFERENCES<br />
Allen, A.H. (1988) Reinforced concrete design to BS 8110: Simply explained. London & New York: E.<br />
& F .N. Spon.<br />
British St<strong>and</strong>ards Institution (2002) Concrete Design (BS 8110-1: 1997): Extract from British St<strong>and</strong>ards<br />
for Students of Structural Design. UK: British St<strong>and</strong>ard Institution.
336<br />
International <strong>Building</strong> & <strong>Infrastructure</strong> Technology Conference<br />
7-8 June 2011, Vistana Hotel, Penang, Malaysia<br />
British St<strong>and</strong>ards Institution (2002) Wind Loads (BS 6399-2: 1997): Extract from British St<strong>and</strong>ards for<br />
Students of Structural Design. UK: British St<strong>and</strong>ard Institution.<br />
British St<strong>and</strong>ards Institution (2002) Weights of <strong>Building</strong> Materials: Extract from British St<strong>and</strong>ards for<br />
Students of Structural Design. UK: British St<strong>and</strong>ard Institution.<br />
Hasan, N. M. S., Sobuz, H. R. <strong>and</strong> Ioannou, C. (2011) Non Sway <strong>and</strong> Sway Methods for Design of<br />
Multi-Storey RC <strong>Building</strong>. Germany: VDM Publishing House Ltd. Benoit Novel<br />
Li, Q. S., et al. (2004) ‘Full-scale measurements <strong>and</strong> numerical evaluation of wind-induced vibration of<br />
a 63-story reinforced concrete tall building’ Engineering Structures, 26, pp. 1779-1794.<br />
Mosley, W. H. <strong>and</strong> Bungey, J.H. (1990) Reinforced concrete design. 4 th ed. London: Macmillan<br />
Education Ltd.<br />
The Concrete Centre (2009) Benefits of Concrete, Concrete Facts. UK: The Concrete Centre (Online)<br />
Available at: http://www.theconcretecentre.com [Accessed 01 May 2009].<br />
Wong, Y. L., Yu, T., Chan., S. L. (2007) ‘A simplified analytical method for unbraced composite frames<br />
with semi-rigid connections’, Journal of Constructional Steel Research, 63, pp. 961-969.<br />
Wang, W. C. (1997) ‘Effects of Structural Continuity on Fire Resistant Design of Steel Columns in<br />
Non-sway Multi-storey Frames’, Fire Safety Journal, 28, pp. 101-116.
T186<br />
337<br />
International <strong>Building</strong> & <strong>Infrastructure</strong> Technology Conference<br />
7-8 June 2011, Vistana Hotel, Penang, Malaysia<br />
SUSTAINABLE CONCRETE FROM MALAYSIA’S INDUSTRIAL BY-PRODUCTS<br />
AND BIOGENIC WASTES<br />
M. R. Karim 1 , M. F. M. Zain 2 , M. Jamil 3 , F.C. Lai 4 <strong>and</strong> M. N. Islam 5<br />
1,2,3 Universiti Kebangsaan Malaysia, Malaysia.<br />
4 Regional Technology Support Centre, Sika Kimia Sdn Bhd, Malaysia<br />
5 Dhaka University of Engineering <strong>and</strong> Technology, Gazipur, Bangladesh.<br />
1 reza_civil128@yahoo.com , 2 fauzi@vlis.eng.ukm.my , 3 lin@eng.ukm.my ,<br />
4 lfcclm@yahoo.com.sg , 5 nazrul2100@yahoo.com<br />
ABSTRACT: In the modern society, for the dwelling house <strong>and</strong> construction of infrastructures, the role<br />
of concrete is unavoidable. Besides, sustainability <strong>and</strong> sustainable concrete is a prime issue in<br />
concrete industry in recent decades. <strong>Sustainable</strong> concrete could be produced using waste material in<br />
cement or concrete <strong>and</strong> it will be a valuable step for: reduction of CO2 emission, making more durable<br />
<strong>and</strong> cost effective concrete, saving energy, <strong>and</strong> solving disposal problem. In this paper, a critical<br />
review <strong>and</strong> proposal on the consumption of Malaysia’s waste materials as a supplement of cement for<br />
the production of sustainable concrete have been presented. The physical, chemical properties waste<br />
materials <strong>and</strong> merits of supplementary use of waste materials in cement <strong>and</strong> concrete have also been<br />
pointed out. It can be concluded, depending on the information from published literatures, that<br />
effective utilization of these waste materials as a substitute of cement will influence researchers to<br />
examine a sustainable way of saving materials including cement as well as manufacture of<br />
sustainable concrete.<br />
Keywords: sustainable goncrete, waste materials, CO2 emission, energy<br />
1. INTRODUCTION<br />
In the present civilized world, due to growing population <strong>and</strong> living requirements the construction of<br />
buildings <strong>and</strong> infrastructures has been increased rapidly. Among the other construction materials,<br />
concrete has gained popularity for its multiple advantages: easiest manufacturing procedure, strength<br />
<strong>and</strong> durability properties at normal environment. The majority of commonly used cement - ordinary<br />
Portl<strong>and</strong> cement (OPC) - is a key ingredient in concrete production. It is reported that Portl<strong>and</strong> cement<br />
is accountable for the emissions of approximately 7% world’s carbon dioxide (CO2); in consequence,<br />
global warming is rising gradually (Malhotra 2000; Mehta, 1999). In addition to CO2 emissions, the<br />
burning of Portl<strong>and</strong>-cement clinker at temperatures around 1400 0 C is costly in terms of fossil fuel<br />
usage (Nehdi 2001). These effects of cement <strong>and</strong> concrete production on environment <strong>and</strong> the<br />
depletion of the world’s most valuable fossil energy resources have necessitated the exploitation of<br />
sustainable construction materials (Kartik et al. 2003). In consequence, nowadays, utilization of waste<br />
materials as a potential alternative in the construction industry is a great research interest in cement<br />
<strong>and</strong> concrete technology <strong>and</strong> it would be a valuable step for solving the mentioned issues. Waste<br />
materials could be used effectively as construction materials <strong>and</strong> have the capability to satisfy the<br />
design specifications provided that it would be processed properly. In this regards, various researches<br />
have been performed for the use of biogenic wastes including palm oil fuel ash (POFA), rice husk ash<br />
(RHA), sawdust ash/ash from timber (AFT) <strong>and</strong> industrial waste (slag, fly ash) as constituents of<br />
cement <strong>and</strong> concrete.<br />
The challenges listed above are more a result of the fact that Portl<strong>and</strong> cement is not particularly<br />
environmentally friendly. One can therefore reduce these challenges following simple formula: use as<br />
much concrete, but with as little Portl<strong>and</strong> cement as possible, this means to replace as much Portl<strong>and</strong><br />
cement as possible by supplementary cementitious materials, especially those that are industrial byproducts,<br />
<strong>and</strong> biogenic wastes (POFA, RHA, AFT). This study summarizes the use of supplementary<br />
cementing materials in sustainable concrete <strong>and</strong> a proposal to produce sustainable concrete from<br />
Malaysia’s industrial by-product <strong>and</strong> biogenic wastes.
338<br />
International <strong>Building</strong> & <strong>Infrastructure</strong> Technology Conference<br />
7-8 June 2011, Vistana Hotel, Penang, Malaysia<br />
2. MALAYSIA’S BIOGENIC WASTES AND INDUSTRIAL BY-PRODUCT<br />
There are many biogenic wastes such as wastes from palm oil industries, rice husk ash, are produced<br />
in Malaysia. It is estimated that about 0.3 million ton of POFA is generated per year in Malaysia. About<br />
2.6 million tonnes of solid waste in the form of oil palm shells is produced annually in Malaysia (Basri<br />
et al., 1999). It was reported that will be about 20 tons of nut shells, 7 tons of fibers, <strong>and</strong> 25 tons of<br />
empty bunches discharged from the mill for each of 100 tonnes in processing of fresh fruit bunches<br />
(Tay <strong>and</strong> show, 1995). About 650 million ton of rice produced in the world, of which 2.2 million is from<br />
Malaysia. After milling about 20% is converted to rice husk; <strong>and</strong> finally, 15-20% ash is produced as<br />
RHA, after burning (FAOSTAT, 2008). A huge amount of industrial by-products (slag, fly ash) are also<br />
produced from this country, as well as in the world. It is observed that, till to date, there are no<br />
remarkable uses of these ashes, the POFA. These ashes are only dumped into surroundings without<br />
any commercial feedback; hence contamination <strong>and</strong> disposal problem has also been observed. Slag,<br />
RHA, <strong>and</strong> AFT have also been claimed for similar trouble. It is already proven that all of these waste<br />
materials contain a high amount of silicon dioxide in amorphous form <strong>and</strong> they could be used as<br />
pozzolanic materials in concrete production. The physical <strong>and</strong> chemical properties of these materials,<br />
as documented in different literatures, are mentioned in Table 1. It is seen from the table that RHA<br />
contains maximum silica (about 90%), although POFA has more than 50% silica content. Los of<br />
ignition (LOI) value of POFA is large as compare to other materials, fineness value of the materials are<br />
also greater than 4000 cm 2 /gm. All of these properties are valuable for the production of blended<br />
cement <strong>and</strong> blended concrete as well as sustainable concrete, as suggested in different articles.<br />
Table 1. Chemical <strong>and</strong> Physical Properties of POFA, RHA <strong>and</strong> Slag (Wt. %)<br />
Material<br />
SiO2 Al2O3 Fe2O3<br />
Chemical Properties<br />
CaO MgO SO3 Na2O3 K2O LOI<br />
Reference<br />
43.60 11.50 4.70 8.40 4.80 2.80 0.39 3.50 18.0 Awal, 1997<br />
POFA<br />
63.60 1.60 1.40 7.60 3.90 0.20 0.10 6.90 9.6<br />
Chindaprasirt<br />
et. al., 2008<br />
87.6 0.68 0.93 1.30 0.35 - 0.12 2.37 -<br />
Givi et. al.,<br />
2010<br />
RHA<br />
92.5 a<br />
88.5 b<br />
1.2<br />
1.1<br />
2.1<br />
2.0<br />
0.9<br />
0.9<br />
0.4<br />
0.4<br />
0.1<br />
0.1<br />
2.0<br />
2.6<br />
0.0<br />
0.0<br />
0.9<br />
0.9<br />
Chatveera <strong>and</strong><br />
Lertwattanaruk,<br />
Slag 39.18 10.18 2.02 32.82 8.52 - 1.14 0.30 1.0<br />
2009<br />
Oner <strong>and</strong><br />
Akyuz, 2007<br />
Physical properties<br />
Material Specific gravity<br />
(gm/cm 3 )<br />
Mean particle size<br />
(µm)<br />
Fineness (Blaine) Reference<br />
2.22 - 519 (m 2 /kg) Awal, 1997<br />
POFA<br />
2.43 7.40 99.00 (retained 1%)<br />
Jaturapitakkul et<br />
al., 2007<br />
RHA 2.30 a ; 2.27 b - 4750(cm 2 /gm); 5750(cm 2 /gm)<br />
Slag 2.87 - 4250(cm 2 /gm)<br />
a, b - RHA obtained from electric power station <strong>and</strong> rice mill respectively<br />
Chatveera <strong>and</strong><br />
Lertwattanaruk2<br />
009<br />
Oner <strong>and</strong><br />
Akyuz, 2007<br />
3. SUSTAINABLE CONCRETE AND WASTES<br />
It is well known that sustainable concrete is a vital issue in concrete industry all over the world <strong>and</strong> its<br />
development could meet the following important matters: reduction of the amount of polluting <strong>and</strong> CO2<br />
gases emitted during the manufacture of concrete; more efficient use of waste materials; development<br />
of low-energy, long-lasting, flexible buildings <strong>and</strong> structures; exploiting the thermal mass of concrete in<br />
a structure to reduce energy dem<strong>and</strong>. Probably the most effective means of achieving significant<br />
reductions in CO2 emission lies in the replacement of Portl<strong>and</strong> cement clinker by other suitable<br />
materials. These replacement materials can be added separately to the concrete or used to replace<br />
the clinker in composite cements. The latter is more commonly the situation in Europe, whilst in the US<br />
replacement materials are more commonly added to the concrete. For sustainable concrete<br />
production, more efficient use of waste materials has been emphasized here in the following ways;<br />
Direct use of waste in cement: Waste materials from other industries are increasingly being used to<br />
replace the traditional raw materials used in the production of Portl<strong>and</strong> cement clinker. These include
339<br />
International <strong>Building</strong> & <strong>Infrastructure</strong> Technology Conference<br />
7-8 June 2011, Vistana Hotel, Penang, Malaysia<br />
foundry s<strong>and</strong>s, fly ash <strong>and</strong> bottom ash from coal fired power plants, spent catalysts <strong>and</strong> filter clays, mill<br />
scales, etc. For example, blast furnace slag (BFS) is rich in calcium oxide. The maximum level of<br />
limestone replacement by BFS is between 20 <strong>and</strong> 30%. In practice, replacement levels of about 10%<br />
are more commonly reported. When concomitant reductions in fuel consumption are also considered<br />
(since less heat is needed to de-carbonate the limestone), total CO2 reductions can in theory be as<br />
high as 25%. High CaO (class C) fly ashes can also be used to replace limestone by up to 10%.<br />
According to embodied CO2 study (2007), the embodied CO2 emission is reduced significantly due to<br />
incorporation of slag into cement. It was found that embodied CO2 emission is reduced by 56 kg/ton<br />
(36.6%) for addition of 50% slag. Ehrenberg <strong>and</strong> Geiseler (1997) concluded that the total CO2<br />
emission would be reduced by incorporation of slag in the cement manufacturing. They stated that<br />
total CO2 emission is reduced to 53.3% for 50% slag addition (for example: CEM I without slag, CO2<br />
emission is 1011 kg/ton but for 50% slag, emission is reduced to 539 kg/ton). This figure is much<br />
better for 75% slag replacement. They also mentioned the energy requirements for the cement<br />
manufacturing as shown in Table 2. It can easily be observed from this table that, 1587kWh/ton<br />
energy is required for CEM I (without slag), but for the addition of 30, 50 <strong>and</strong> 75% slag with cement<br />
the energy consumption is reduced to 1206, 938 <strong>and</strong> 602 kWh/ton respectively. In case of 50% slag<br />
replacement, energy requirement is reduced to 59.1% with comparison to CEM I (100%), alternatively,<br />
40.9% energy can be saved for the use of 50% slag. This quantity is much better for the 75% slag<br />
replacement (i.e., only 37.9% energy required as compared to CEM I that means 62.1% energy could<br />
be saved).<br />
Table 2. Energy Consumption in Cement Production (Ehrenberg <strong>and</strong> Geiseler 1997)<br />
Energy requirement<br />
Sl No. Type of cement<br />
Total<br />
(kWh/ton) (%)<br />
Electrical energy<br />
(%)<br />
Thermal energy (%)<br />
1 CEM I 1587 100.0 39.6 60.4<br />
2 CEM II/B-S with 30% slag 1206 76.0 44.6 55.6<br />
3 CEM III/A with 50% slag 938 59.1 48.9 51.1<br />
4 CEM III/B with 75% slag 602 37.9 60.2 39.8<br />
Utilization of waste in concrete: Although a huge amount of industrial by products are produced<br />
worldwide, for example 450 million ton of fly ash per year, but only a few quantity (35 million ton, less<br />
than 8%) is used (Mehta 1999). Similar trend have been happened for slag, only a small fraction of the<br />
100 million tons produced worldwide is used (Nehdi, 2001). These by products act as pozzolanic<br />
materials <strong>and</strong> could be used as supplement of cement in concrete as stated in different literatures.<br />
Slag is usually used in concrete due to the following benefits: it improves durability <strong>and</strong> reduces<br />
porosity; improves the interface with the aggregate; lowers cement requirement; saves energy; <strong>and</strong><br />
shows good performance as well as better engineering properties (Oner <strong>and</strong> Akyuz, 2007). Addition of<br />
fly ash increases strength of concrete (Memon et al., 2002; Oner et al., 2005). The POFA, RHA could<br />
be used as cement replacement materials in concrete production that are claimed by several<br />
researchers. Incorporation of RHA improves compressive strength (Givi et al., 2010) <strong>and</strong> resistance<br />
against sulfate attack (Chatveera <strong>and</strong> Lertwattanaruk, 2009).<br />
In some cases, their contributions not only save cement but also make better performance in the<br />
concrete properties – strength, durability. For example, POFA can be used as a cement replacement<br />
to produce good resistance against sulfate attack (Chindaprasirt et al., 2008; Jaturapitakkul et al.,<br />
2007). The simple equation is: more utilization of waste in cement or concrete which means less use<br />
of cement <strong>and</strong> hence saving fuel, clinker as well as reduction of CO2 emission; that are the objectives<br />
of sustainable concrete. It is underst<strong>and</strong>able from above discussion that incorporation of wastes (fly<br />
ash, POFA, slag, RHA) in cement or concrete is a great achievement in terms of CO2 reduction <strong>and</strong><br />
energy saving without sacrificing the strength of concrete.<br />
4. WAY OF SUSTAINABLE CONCRETE<br />
As a goal of sustainable concrete, the lower energy consumption <strong>and</strong> less CO2 emission should be<br />
established in sustainable concrete production. Lower energy requirement have been observed in a<br />
study of Ehrenberg <strong>and</strong> Geiseler (1997) for slag replacement in cement production as shown in Table
340<br />
International <strong>Building</strong> & <strong>Infrastructure</strong> Technology Conference<br />
7-8 June 2011, Vistana Hotel, Penang, Malaysia<br />
1. They found that energy requirements could be reduced by addition of wastes in cement production.<br />
This waste replacement method in cement production will be valuable <strong>and</strong> potential step for the<br />
production of sustainable concrete as well as sustainable development. Thus, the authors propose to<br />
produce sustainable concrete using locally available wastes in Malaysia in the following way (Fig. 1).<br />
As shown in flow diagram, sustainable concrete could be possible because of the following reasons:<br />
� Effective use of waste in cement <strong>and</strong> concrete<br />
� Lower utilization of cement, hence lower energy consumption<br />
� Reduction of CO2 emission due to less cement utilization<br />
It is relevant to mention here that POFA, RHA, AFT are produced at a temperature about 500-600 0 C<br />
but for burning clinker the required temperature is about 1400 0 C. Hence, at the preliminary<br />
investigation, it can be estimated that fuel energy could be saved. Besides, Ehrenberg <strong>and</strong> Geiseler<br />
(1997) findings also support this proposal regarding energy saving as well as sustainable concrete<br />
production.<br />
5. CONCLUSIONS<br />
*Need not to burn, could be directly used with clinker or in grinding<br />
Figure 1. Flow-chart of sustainable concrete production<br />
It is well known that the shifting of wet process to dry process of cement manufacturing, about 30%<br />
energy can be saved. Now involving high volume of biogenic wastes <strong>and</strong> industrial by-products in<br />
cement <strong>and</strong> concrete manufacturing will be promising venture in construction industry for the<br />
sustainable concrete production. This waste utilization process not only saves energy but also reduces<br />
the CO2 emission <strong>and</strong> global warming – a crucial issue facing by the inhabitants of the planet. Thus,<br />
for the production of sustainable concrete, consumption of these wastes in cement <strong>and</strong> concrete is<br />
rational, essential <strong>and</strong> valid issue for comfortable survival of human community in the world.<br />
REFERENCES<br />
Awal A.S.M.A. & Hussin M.W. (1997). The Effectiveness of Palm Oil Fuel Ash in Preventing<br />
Expansion Due to Alkali-Silica Reaction. Cement <strong>and</strong> Concrete Composites. Vol.19(4). pp. 367 – 72<br />
Basri H.B. Mannan M.A. & Zain M.F.M. (1999). Concrete Using Waste Oil Palm Shells as Aggregate.<br />
Cement <strong>and</strong> Concrete Research. 29. pp. 619 - 622
341<br />
International <strong>Building</strong> & <strong>Infrastructure</strong> Technology Conference<br />
7-8 June 2011, Vistana Hotel, Penang, Malaysia<br />
Chatveera B. & Lertwattanaruk P. (2009). Evaluation of Sulfate Resistance of Cement Mortars<br />
Containing Black Rice Husk Ash. Journal of Environmental Management. Vol. 90. pp 1435 – 1441<br />
Chindaprasirt P., Rukzon S., & Sirivivatnanon V. (2008). Resistance to Chloride Penetration of<br />
Blended Portl<strong>and</strong> Cement Mortar Containing Palm Oil Fuel Ash, Rice Hush Ash <strong>and</strong> Fly Ash.<br />
Construction <strong>and</strong> <strong>Building</strong> Material. Vol. 22(5). pp 932-938<br />
Ehrenberg, A., & Geiseler. (1997). Jokologische Eigenschaften von Hochofenzement, Bston-<br />
Informationen, 37(4): 51-63, In: Bensted <strong>and</strong> Barnes, Structure <strong>and</strong> Performance of Cement, Second<br />
Edition, Spon press London <strong>and</strong> New York, pp.310 – 325<br />
Embodied CO2 Study. (2007). Arup for BCA <strong>and</strong> The Concrete Centre; URL:<br />
http://www.emcbe.com/Club-Events/<strong>Sustainable</strong>%20Concrete.pdf<br />
FAOSTAT, Database, (2008). FAO, Rome. 22 Sep 2008 (FAO last access). Accessed on April 20,<br />
2011. Available in:<br />
http://beta.irri.org/solutions/index.php?option=com_content&task=view&id=250<br />
Givi, N.A., Rashid S.A., Aziz F.N.A. & Mohd S.M.A. (2010). Assessment of the Effects of Rice Husk<br />
Ash Particle Size on Strength, Water Permeability <strong>and</strong> Workability of Binary Blended Concrete.<br />
Constrution <strong>and</strong> <strong>Building</strong> Materials. Vol. 24. pp 2145 – 2150<br />
Jaturapitakkul, C., Kiattikomol K., Tangchirapat W. & Saeting T. (2007). Evaluation of the Sulfate<br />
Resistance of Concrete Containing Palm Oil Fuel Ash. Construction <strong>and</strong> <strong>Building</strong> Material. Vol. 21(7).<br />
pp 1399 - 1405<br />
Kartik, H.O., Russell L.H. & Ross S.M. (2003). HVFA Concrete - An Industry Perspective. Concrete<br />
International. Vol. 25(8). pp 29 - 34<br />
Malhotra, V.M. (2000). Role of Supplementary Cementing Materials in Reducing Greenhouse Gas<br />
Emissions. In: Gjorv OE, Sakai K, editors. Concrete technology for a sustainable development in the<br />
21st century. London: E&FN Spon. pp 226 – 235<br />
Mehta P.K. (1999). Concrete Technology for <strong>Sustainable</strong> Development. Concrete International. Vol.<br />
21(11). pp. 47 - 53<br />
Memon A.H., Radin S.S., Zain M.F.M. & Trottier J.F. (2002). Effect of Mineral <strong>and</strong> Chemical<br />
Admixtures on High-Strength Concrete In Seawater. Cement <strong>and</strong> Concrete Research. Vol. 32. pp 373<br />
– 377<br />
Nehdi M. (2001). Ternary <strong>and</strong> quarternary cements for sustainable development, Concrete<br />
International, April 200, pp 35-42<br />
Oner, A. Akyuz S. & Yildiz, R. (2005). An Experimental Study on Strength Development of Concrete<br />
Containing Fly Ash And Optimum Usage of Fly Ash in Concrete. Cement <strong>and</strong> Concrete Research, Vol.<br />
35, pp. 1165– 1171<br />
Oner, A. & Akyuz, S. (2007). An Experimental Study on Optimum Usage of GGBS for The<br />
Compressive Strength of Concrete, Cement <strong>and</strong> Concrete Composites, Vol. 29, pp. 505–514<br />
Tay, J.H. & Show K.Y. (1995). Use of Ash Derived from Oil-Palm Waste Incineration as a Cement<br />
Replacement Material. Resources, Conservation <strong>and</strong> Recycling, Vol.13, pp. 27-36
T188<br />
342<br />
International <strong>Building</strong> & <strong>Infrastructure</strong> Technology Conference<br />
7-8 June 2011, Vistana Hotel, Penang, Malaysia<br />
THE STATE-OF-ART OF DECISION SUPPORT SYSTEM DEVELOPMENT:<br />
PROGRESS OF REQUIREMENT ENGINEERING IN CONSTRUCTION<br />
Mohd Faizal Omar 1 , Bambang Trigunarsyah 2 <strong>and</strong> Johnny Wong 3<br />
1, 2, 3 School of Urban Development, Faculty of Built Environment & Engineering, Queensl<strong>and</strong><br />
University of Technology<br />
1 mfaizal.omar@gmail.com , 2 bambang.trigunarsyah@qut.edu.au , 3 johnny.wong@qut.edu.au<br />
ABSTRACT: Recent advances in decision making technology have spread into a wide <strong>and</strong> diverse<br />
area particularly in project management. A growing interest of Decision Support System (DSS) in<br />
construction project management has been identified as a promising <strong>and</strong> interesting research area.<br />
Much research have been conducted within construction project life cycle phase including the initiation,<br />
planning, design <strong>and</strong> development, detailed design, procurement, manufacture <strong>and</strong> construction,<br />
commissioning <strong>and</strong> operation <strong>and</strong> maintenance. However, most DSS model developed were lacked of<br />
many part of computing fundamental such as Requirement Engineering (RE). RE is particularly<br />
essential for a successful software development. The academic literature on DSS in construction is<br />
largely focused on applications area, <strong>and</strong> only a few articles examine RE issues. Thus, this paper<br />
reviews <strong>and</strong> summarizes current usage of DSS in construction, recent technology developments<br />
related to RE, <strong>and</strong> trends in the deployment of such systems.<br />
Keywords: Construction Project Management, Decision Support System, Software<br />
Engineering, Requirement Engineering<br />
1. INTRODUCTION<br />
Designing useful artefacts is complex due to the need for creative advances in domain areas in which<br />
existing theory is often insufficient as technical knowledge grows. IT is applied to a new application<br />
area that was not previously believed to be amenable to IT support (Hevner, March, Park, & Ram,<br />
2004). This is especially true in the construction industry today as the industry increasingly adopts<br />
information technology for use in new <strong>and</strong> innovative ways.<br />
In the area of Information System, DSS has a long history, started back in 1960’s. From time to time, it<br />
has widely grows to many application area. This includes construction project management.<br />
Significant efforts were done during 1990’s <strong>and</strong> it keep continuing in construction area. However, the<br />
trend only focusing on model development <strong>and</strong> discard many aspect of computing <strong>and</strong> DSS which<br />
essentially produce unusable model in this area. The purpose of this paper is to promote formal<br />
technique to DSS development in construction. In addition, the current practice of DSS in construction<br />
is also investigated. This paper will start from the historical perspectives of DSS. Later, it introduces<br />
some Software Engineering terminology such as Requirement Engineering which can be a useful tool<br />
to adopt in construction area. Later, this study investigates the current practice of DSS in construction<br />
<strong>and</strong> reveals some flaws from planning to operation <strong>and</strong> maintenance phase.<br />
2. HISTORICAL PERSPECTIVES OF DECISION SUPPORT SYSTEM<br />
Historically, DSS research began in the 1960’s where the emphasis of the researches was more on<br />
conceptual aspect of decision making (Simon, 1960, as cited in Angehrn & Jelassi, 1994; Anthony,<br />
1965, as cited in Shim et al., 2002). Later, a more refined decision support framework has been<br />
developed which incorporated categories of management activities <strong>and</strong> description of decision type<br />
(Gorry & Morton, 1989). This includes management activities such as strategic planning, management<br />
control <strong>and</strong> operational control. In addition, the propose framework is the combination of Antony’s
343<br />
International <strong>Building</strong> & <strong>Infrastructure</strong> Technology Conference<br />
7-8 June 2011, Vistana Hotel, Penang, Malaysia<br />
(1965) management activities <strong>and</strong> Simon’s (1960) explanation of decision types which consist of<br />
structured, unstructured <strong>and</strong> semi-structured.<br />
Since then, various DSS related researches have been carried out in diverse area to decision making<br />
problem. A dramatic DSS improvement <strong>and</strong> development have been evolved in nearly half century<br />
<strong>and</strong> it seems to be growing to application area <strong>and</strong> its supportive technologies. In 1970’s, researches<br />
were more concentrated heavily on decision model development <strong>and</strong> technology to support single<br />
user (Bhargava, Power, & Sun, 2007). Later, in mid 1980’s, Group Decision Support <strong>Systems</strong> (GDSS)<br />
or Group Support System (GSS) were developed to facilitate brainstorming, idea evaluation <strong>and</strong><br />
communication to support team problem solving (Shim, et al., 2002). Furthermore, the concept of<br />
Executive Information <strong>Systems</strong> (EIS) were established to exp<strong>and</strong> the concept of DSS to support<br />
decision making from personal use to small group or corporate level (Turban, Aronson, & Liang,<br />
2005). From 1990’s, the communication infrastructure has been enhanced by the concept of clientserver<br />
computing. Thus, this technology has influenced DSS research to adopt this technology <strong>and</strong><br />
the previous mainframe based DSS became obsolete (Bhargava, et al., 2007). In addition, several<br />
firms introduced a new kind of data-oriented decision support via the use of online analytical<br />
processing (OLAP) tools (Turban, et al., 2005). In the 21 st century, the vast usages of internet have<br />
influences DSS research to a new dimension. Within this period, a lot of supportive technologies have<br />
been developed. The integration concept of data warehouse, data visualization <strong>and</strong> Artificial<br />
Intelligence (AI) techniques have drawn attention many researchers from diverse area (Turban, et al.,<br />
2005). In the near future, the trend of DSS development are projected to experience a rapid growth on<br />
the application area <strong>and</strong> the supportive technologies (Bhargava, et al., 2007).<br />
According to a survey by Eom & Kim (Eom & Kim, 2006), the DSS application areas can be broadly<br />
divided into corporate functional management fields (73.33% of the total 210 applications articles) <strong>and</strong><br />
other areas (26.67%). In corporate area, DSS applications are developed for Production Operation<br />
<strong>and</strong> Management (44.16%) followed by marketing, transportation, <strong>and</strong> logistics (17.53%), MIS<br />
(13.64%), <strong>and</strong> multifunctional areas (8.44%). Meanwhile, in the non-corporate area, usage of DSSs<br />
was widely spread between two dominant sectors of government (19.64%) <strong>and</strong> educational institutions<br />
(16.07%). Other non-corporate areas are appears in miscellaneous, (14.29%), natural resources<br />
(12.5%), hospital <strong>and</strong> healthcare (12.50%), military (10.71%), urban/community planning <strong>and</strong><br />
administration (7.14%), <strong>and</strong> agriculture (7.14%). Figure 1 illustrates the distribution of DSS application<br />
area that exists in the literature. These results were compiled from two well-known online data<br />
sources: (1) The Global edition of ABI/INFORM, which is available on the web through ProQuest <strong>and</strong><br />
(2) Academic Search Premier database is the world’s largest scholarly which managed by the EBSCO<br />
information services. In Figure 1(a), all articles are broadly divided into corporate functional<br />
management (154 article) <strong>and</strong> non-corporate areas (56 article). Corporate functional management<br />
accounts for 73% of the application articles <strong>and</strong> is further divided into eight functional areas. Next, in<br />
Figure 1(b), 27% of the application concern non-corporate subjects <strong>and</strong> it is subdivided into eight<br />
areas.<br />
Based on the above result <strong>and</strong> due to the multidisciplinary nature of DSS research, we can assume<br />
that DSS for construction project management may lies in the area of strategic management,<br />
government, natural resources, urban/community planning <strong>and</strong> agriculture. These applications might<br />
include DSS for construction problems such as contractor selection, consultant selection, project<br />
procurement evaluation, preservation of civil infrastructure, etc. As a result, DSS has been proven to<br />
be a significant <strong>and</strong> popular approach to solve construction management decision making problem.<br />
Since most of researchers come from non-computing background, most DSS research in construction<br />
tend to focus in decision model development rather than computing aspect of DSS. Clearly, it is<br />
identified that computing aspects in DSS development for construction area are not well covered in the<br />
literature.
344<br />
International <strong>Building</strong> & <strong>Infrastructure</strong> Technology Conference<br />
7-8 June 2011, Vistana Hotel, Penang, Malaysia<br />
Figure 1. Distribution of DSS Application Area in the Literature (Eom & Kim, 2006)<br />
From the late 1990s onwards, it is obvious that contribution of DSS applications in construction project<br />
grows significantly. With faster hardware <strong>and</strong> advanced software, DSS has been used as a tool to<br />
support decision making throughout project delivery life cycle phase. Most of these researches have<br />
been applied in planning phase with different kind of applications <strong>and</strong> decision models. Yet, there were<br />
also efforts to deploy DSS in construction management stages such as at design (Sarka, Zavadskas,<br />
Ustinovicius, Sarkiene, & Ignatavicius, 2008; Tam, Tong, & Chiu, 2006), procurement (Kumaraswamy<br />
& Dissanayaka, 2001) <strong>and</strong> operation & maintenance phase (Oad, Garcia, Kinzli, Patterson, & Shafike,<br />
2009; Shen & Grivas, 1996). At this stage, combinations of Artificial Intelligence, multi criteria decision<br />
making <strong>and</strong> statistical techniques have been utilized. These decision models were explored<br />
extensively to solve a particular problem in construction. The recent practices of DSS in construction<br />
have shown that more complex decision models were deployed whereas there are only little<br />
computing aspect were discussed. Therefore, the following sections will illustrates some software<br />
issues for DSS in construction project management.<br />
3. THE FUNDAMENTAL IN REQUIREMENT ENGINEERING<br />
Few researches have shown that many large projects fail because of inadequate requirements (van<br />
Lamsweerde, 2000). These projects were found to have insufficient software specification. Software<br />
specification can be refer as a formulation in terms of objects manipulated by the software, in a<br />
vocabulary accessible to programmers (van Lamsweerde, 2000). They capture required relations<br />
between input <strong>and</strong> output software objects. In computing area, the process of capturing software<br />
requirement is fall under Software Engineering branch of discipline that so called Requirement<br />
Engineering (RE).<br />
According van Lamsweerde (2000), RE concerned with the identification of the goals to be achieved<br />
by the envisioned system, the operationalisation of such goals into services <strong>and</strong> constraints, <strong>and</strong> the<br />
assignment of responsibilities for the resulting requirements to agents such as humans, devices, <strong>and</strong><br />
software. Meanwhile, Nuseibeh & Easterbrook (2000) suggest RE is a process of discovering the<br />
purpose of the software, by identifying stakeholders <strong>and</strong> their needs, <strong>and</strong> documenting these in a form<br />
that is amendable to analysis, communication, <strong>and</strong> subsequent implementation. In short, RE is the<br />
process by which the requirements of the software are determined (B. H. C. Cheng & Atlee, 2007).<br />
Successful RE involves underst<strong>and</strong>ing the needs of users, customers, <strong>and</strong> other stakeholders;<br />
underst<strong>and</strong>ing the contexts in which the to-be-developed software will be used; modelling, analysing,<br />
negotiating <strong>and</strong> documenting the stockholder’s requirements; validating that the documented<br />
requirements match the negotiated requirements <strong>and</strong> managing requirement evolution (B. H. C.<br />
Cheng & Atlee, 2007). From these definitions, it is obvious that the quality of software require a step-
345<br />
International <strong>Building</strong> & <strong>Infrastructure</strong> Technology Conference<br />
7-8 June 2011, Vistana Hotel, Penang, Malaysia<br />
by-step or structured process of software development. Therefore, a framework of RE process has<br />
been proposed in Figure 2.<br />
Requirements<br />
elicitation<br />
Requirements<br />
Analysis<br />
Requirements<br />
Definition<br />
Requirements<br />
Prototyping<br />
Requirements<br />
review<br />
Figure 2. A Requirement Engineering Process (Tsui & Karam, 2007)<br />
Software<br />
Requirements<br />
Specifications<br />
Requirements<br />
agreement<br />
Based on Figure 2, there are six basic RE process i.e. Requirement Elicitation, Requirement Analysis,<br />
Requirement Definition, <strong>and</strong> Requirement Documentation. The first step is requirement elicitation.<br />
Elicitation of requirement can be regarded as an initial step in the RE process where the name itself<br />
suggest to “capture” the needs of problem domain. It is at this point the process where the needs of<br />
the users <strong>and</strong> goals for the system are determined. Requirement elicitation can be broadly defined as<br />
the acquisition of goals, constraints, <strong>and</strong> features for a proposed system by means of investigation<br />
<strong>and</strong> analysis (Coulin & Zowghi, 2005). Requirement analysis is the second step of requirement<br />
engineering. The purpose of this step is to develop software conceptual model <strong>and</strong> analysis for DSS<br />
system. Tsui & Karam (2007) reveal that even after the requirement are elicited <strong>and</strong> collected, there<br />
are still just an unorganized data <strong>and</strong> need to be analysed. Requirement analysis is rarely being<br />
discussed <strong>and</strong> not well defined in most DSS literature. Only a few attempts have been made to adopt<br />
requirement analysis for DSS in their implementation (Giorgini, Rizzi, & Garzetti, 2008; Lee & Rao).<br />
While many of DSS studies in different areas overlooked the importance of software engineering,<br />
Giorgini et al. (2008) have come out with a better framework to integrate conceptual modelling <strong>and</strong><br />
decision model in requirement analysis.<br />
Requirement definition is a technique before proceeding to the prototyping phase in a typical<br />
Information System development. According to Yeates & Wakefield (2004), as the requirements are<br />
identified, two models of the system are built. The first represents the processing necessary to meet<br />
those requirements, <strong>and</strong> the second portrays the underlying structure of the data that is needed to<br />
support this processing. Tsui & Karam (2007) suggest that these processes can be done after the<br />
requirement analysis. For each of these models the distinct techniques of Data Flow Modelling <strong>and</strong><br />
Logical Data Modelling are prescribed (Tsui & Karam, 2007; Yeates & Wakefield, 2004). Next is the<br />
Requirement Prototyping process. It is a process of building a model of a system <strong>and</strong> it is usually<br />
employed to help system designers build an information system that intuitive <strong>and</strong> easy to manipulate<br />
for end users. Prototyping comes in many forms - from low tech sketches or paper screens (pictive)<br />
from which users <strong>and</strong> developers can paste controls <strong>and</strong> objects, to high tech operational systems<br />
using CASE (computer-aided software engineering) or fourth generation languages <strong>and</strong> everywhere in<br />
between(Base, 2011). According to literature, there are many component of prototyping such as data<br />
management <strong>and</strong> data communication (Tsui & Karam, 2007).<br />
The rapid expansion of the software applications, specifically “tailor-made” software such as DSS has<br />
brought user-centred computing into prominence. The best practice of software development is to<br />
balance <strong>and</strong> sit in the middle between two distinct areas i.e human centred computing <strong>and</strong> software<br />
engineering. In order to achieve that, few study in software engineering literature adopt the usability
346<br />
International <strong>Building</strong> & <strong>Infrastructure</strong> Technology Conference<br />
7-8 June 2011, Vistana Hotel, Penang, Malaysia<br />
concept into RE process particularly for requirement review phase (Adikari, McDonald, & Collings,<br />
2006). Requirement review is usually performs after the prototyping process (Tsui & Karam, 2007).<br />
Reviews can be achieved by conducting the usability testing <strong>and</strong> obtained useful feedback from the<br />
domain expert (Adikari, et al., 2006; Komarkova, Visek, & Novak, 2007; Paech & Kohler, 2003). This<br />
can help to refine the software requirement specifications(Adikari, 2008). Lastly, the requirement<br />
agreement is a legitimate document between the end user <strong>and</strong> the software developer.<br />
By completing the aforementioned steps, it is anticipated that the software is ready to be developed as<br />
all the requirement has been compiled <strong>and</strong> will minimize issues or problems during post<br />
implementation <strong>and</strong> delivery period. Nevertheless, formal RE process is rarely discussed in<br />
construction area. Thus, the following section will investigate the current practice for DSS<br />
development in construction.<br />
4. REQUIREMENT ENGINEERING IN DSS FOR CONSTRUCTION PRACTICE<br />
In recent years, DSS researchers in construction are moving forward to solve MCDM problems<br />
particularly in planning phase. Typically, MCDM techniques such as Analytical Hierarchical Process<br />
(AHP), Analytical Network Process (ANP) <strong>and</strong> Technique for Order Preference by Similarity to Ideal<br />
Solution (TOPSIS) with a combination of fuzzy technique are the most utilized for qualitative based<br />
DSS. It is applied to a wide range of construction application such as project delivery selection (Al<br />
Khalil, 2002; E. W. L. Cheng & Li, 2005; Dey, 2006; Molenaar & Songer, 2001; Sarka, et al., 2008),<br />
contractor selection (Ibrahim, Mike, Sami, & Alex, 2002), supplier selection (Kahraman, Cebeci, &<br />
Ulukan, 2003), equipment selection (Shapira & Goldenberg, 2005), consultant selection (Al-Besher,<br />
1998; Cheung, Kuen, & Skitmore, 2002; Kit, 2005). Apart from that, there is also a DSS that has been<br />
implemented to evaluate concession project investment by using mathematical modelling <strong>and</strong> finance<br />
analysis (McCowan & Mohamed, 2002). Other applications were dedicated to selection of best value<br />
bid (Lin, Wang, & Yu, 2008) <strong>and</strong> to support value management workshop (Shichao, Qiping, & Kelly,<br />
2008). These full details of DSS applications have been listed in the Appendix.<br />
The current practices of DSS in construction have shown that more complex decision models were<br />
deployed whereas there are only little computing aspect were discussed. It is also identified that<br />
decision models were complex <strong>and</strong> does not represent a robust DSS as it heavily emphasis in<br />
decision model rather than the practical usage in real world i.e. via computerized system. Decision<br />
models were impractical <strong>and</strong> unused as it is complicated or difficult for a layman such as project<br />
manager to use it (Peters & Zelewski, 2008; Qijia, Jian, Jiazhi, Kwok, & Ou, 2005). It is desirable to<br />
hide the abstractions of decision models via DSS implementation. Theoretically, in order to develop a<br />
robust <strong>and</strong> complete program, DSS researcher should define <strong>and</strong> analyses the requirement of the<br />
system with a series of DSS prototypes development (Tsui & Karam, 2007). The deliverables of these<br />
activities is the software specifications which have been reviewed by the system users. The main<br />
problem is identified where most DSS in the area of construction project management were lacking of<br />
software specifications to encapsulate the abstraction of highly complex decision models.<br />
As mentioned in previous section, RE process consists of a few basic steps such as requirement<br />
elicitation, requirement analysis, requirement definitions, prototyping, requirement evaluation <strong>and</strong><br />
requirement specifications. These fundamentals in DSS development are often ignored by literatures<br />
in construction. In this research we have assess 20 articles that has been published in the area of<br />
DSS in construction. Most paper were compiled from major database such as Proquest, Emerald,<br />
Elsevier <strong>and</strong> ITcon open access journal. As a result based, huge gaps were identified in RE process<br />
for solving construction project management problems. Table 1 illustrates the situations. Some<br />
process were not executed, partially done or fully done. This table has been simplified from various<br />
DSS applications that have been developed within the infrastructure life cycle i.e. planning, design,<br />
procurement, operation <strong>and</strong> maintenance
347<br />
International <strong>Building</strong> & <strong>Infrastructure</strong> Technology Conference<br />
7-8 June 2011, Vistana Hotel, Penang, Malaysia<br />
Table 1. The Current State in RE Process for Construction Project Management Problems<br />
Project Mgmt.<br />
Phase<br />
Planning<br />
Design<br />
Procurement<br />
Operation &<br />
Maintenance<br />
Typical examples of<br />
construction problems<br />
Supplier selection (Boer,<br />
Wegen, & Telgen, 1998),<br />
consultant selection (Al-<br />
Besher, 1998), contractor<br />
selection (Sonmez, Holt,<br />
Yang, & Graham, 2002),<br />
project selection (Dey,<br />
2006), project delivery<br />
selection (Al Khalil, 2002),<br />
equipment selection<br />
(Shapira & Goldenberg,<br />
2005), personnel selection<br />
(Gungor, Serhadlioglu, &<br />
Kesen, 2009).<br />
DSS for design problem in<br />
construction (Tam, et al.,<br />
2006), A development of<br />
generic DSS model for<br />
construction management<br />
(Sarka, et al., 2008)<br />
DSS for building project<br />
procurement<br />
(Kumaraswamy<br />
Dissanayaka, 2001)<br />
&<br />
Preservation for civil<br />
infrastructure DSS (Shen &<br />
Grivas, 1996), DSS for<br />
Efficient Irrigation (Oad, et<br />
al., 2009)<br />
Req.<br />
Elici<br />
tatio<br />
n<br />
Requirement Engineering in Decision Support <strong>Systems</strong><br />
Software Requirement<br />
Analysis<br />
Conce<br />
ptual<br />
Model<br />
Decision Models<br />
AHP<br />
/ANP<br />
T<br />
O<br />
PS<br />
IS<br />
Ot<br />
he<br />
r<br />
Re<br />
q.<br />
De<br />
f.<br />
Prototypin<br />
g<br />
Dat<br />
a<br />
Mg<br />
mt<br />
Dat<br />
a<br />
Co<br />
mm.<br />
DSS<br />
Evaluati<br />
on<br />
Abbreviations: Mgmt.= Management; Req. = Requirement; Comm.=Communication Soft.= Software;<br />
Def.= Definition; Spec.= Specifications<br />
Legends: = Fully execution; = Partial execution<br />
Utili<br />
ty<br />
Us<br />
abi<br />
lity<br />
So<br />
ft.<br />
Sp<br />
ec
348<br />
International <strong>Building</strong> & <strong>Infrastructure</strong> Technology Conference<br />
7-8 June 2011, Vistana Hotel, Penang, Malaysia<br />
5. DISCUSSIONS AND FUTURE WORKS<br />
Sufficient software engineering efforts are vital to provide efficient <strong>and</strong> better software development.<br />
However, most literature overlooked the importance of software specification in construction. A<br />
number of studies show that systems fail due to an inadequate or insufficient underst<strong>and</strong>ing of the<br />
requirements they seek to address (van Lamsweerde, 2000). Furthermore, the amount of effort<br />
needed to fix these systems has been found to be very high (Johnson, 1995). RE process is dedicated<br />
to elicit, model, prototype, evaluate <strong>and</strong> specify the software requirements in a certain problem<br />
domain. However, most research in construction area does not exploit this aspect before proceed to<br />
the implementation phase of DSS. This scenario has led to the ignorance of many computing aspects.<br />
Throughout the project life cycle, requirement elicitation phase seems to be dominance as an initial<br />
step in DSS development. Most literature mentions their approach on the elicitation process <strong>and</strong> it is<br />
well covered. However, in the requirement analysis phase, most study discards the conceptual model<br />
where none of them describe on how to leverage the software modelling aspect together with the<br />
decision modelling. It is vital for a newly system to design by mapping the decision model to its<br />
environment such as actor, data, business logic, constraint, etc. Only a few literatures were identified<br />
to describe the requirement definitions for their DSS. However, the designs were just an ad-hoc<br />
integration of data management <strong>and</strong> data communication features. There are no details discussed on<br />
the conceptual model or design. Furthermore, researchers were only interested to evaluate the utility<br />
of the decision model rather than DSS as a whole. As a result, another gap was identified where there<br />
are no usability inspection has been conducted. For these reasons, most study in construction was<br />
incapable to figure out their software specifications that can be useful to hide the complexities of<br />
decision models in DSS. By considering these motivations, the next sections strive to illustrate the<br />
state-of-art in RE process which can be useful to guide the development of DSS. This investigation is<br />
the strategy to explore in depth on the RE process which will be utilized in the development of DSS for<br />
Consultant Selection Problem in the later chapters.<br />
At the moment, we are rapidly in the process of developing a program that so called consultDeSS.<br />
This software if a DSS based program that will be utilised to help client from public sector to select the<br />
best consultant for public sector infrastructure project. It is anticipated that the implementation process<br />
of this software will fill in the gaps <strong>and</strong> will follow a formal procedure of requirement engineering<br />
process<br />
6. CONCLUSIONS<br />
This paper explained the state-of-art in developing DSS from Software Engineering point of view.<br />
Research shows that many software programs failed due to lack of requirement. A requirement is<br />
necessary attribute in a system, a statement that identifies capabilities, characteristic, or quality factor<br />
of a system in order for it to have value <strong>and</strong> utility to a customer or user. Requirements are important<br />
because they provide the basis for all of the development work that follows. Once the requirements<br />
are set, developers initiate the other technical work: system design, development, testing,<br />
implementation, <strong>and</strong> operation. Therefore, RE process should be integrated in DSS development.<br />
Unfortunately, current practice of DSS in construction shows only little work that has been done to<br />
deploy RE in their research. Thus, this paper has demonstrated a huge gaps for RE process in<br />
construction DSS. It ranges from the inception of the construction project until operation <strong>and</strong><br />
maintenance phase. It is anticipated that this paper may encourage for more construction project<br />
management studies to be done for this promising area.<br />
REFERENCES<br />
Adikari, S. (2008). Usability Modelling For Requirements Engineering. Degree of Master of<br />
Engineering, University of Canberra, ACT.<br />
Adikari, S., McDonald, C., & Collings, P. (2006). A design science approach to an HCI research<br />
project. Paper presented at the 18th Australia conference on Computer-Human Interaction: Design:<br />
Activities, Artefacts <strong>and</strong> Environments (OZCHI '06).<br />
Al-Besher, M. F. S. (1998). A conceptual model for consultant selection in Saudi Arabia. Master of<br />
Science Master thesis, King Fadh University of Petroleum & Minerals, Dhahran.
349<br />
International <strong>Building</strong> & <strong>Infrastructure</strong> Technology Conference<br />
7-8 June 2011, Vistana Hotel, Penang, Malaysia<br />
Al Khalil, M. I. (2002). Selecting the appropriate project delivery method using AHP. International<br />
Journal of Project Management, 20(6), 464-469.<br />
Angehrn, A. A., & Jelassi, T. (1994). DSS research <strong>and</strong> practice in perspective. Decision Support<br />
<strong>Systems</strong>, 12(4), 267-275.<br />
Base, M. K. (2011). CASE (Computer Aided Software Engineering Tools) Retrieved 10th March 2011,<br />
2011, from http://www.mbaknol.com/management-information-systems/case-computer-aidedsoftware-engineering-tools/<br />
Bhargava, H. K., Power, D. J., & Sun, D. (2007). Progress in Web-based decision support<br />
technologies. Decision Support <strong>Systems</strong>, 43(4), 1083-1095.<br />
Boer, L. d., Wegen, L. v. d., & Telgen, J. (1998). Outranking methods in support of supplier selection.<br />
European Journal of Purchasing & Supply Management, 4(2-3), 109-118.<br />
Cheng, B. H. C., & Atlee, J. M. (2007). Research Directions in Requirements Engineering. Paper<br />
presented at the <strong>Future</strong> of Software Engineering (FOSE '07).<br />
http://portal.acm.org/citation.cfm?id=1253532.1254725&dl=ACM<br />
Cheng, E. W. L., & Li, H. (2005). Analytic network process applied to project selection. Journal of<br />
Construction Engineering <strong>and</strong> Management, 131(4), 459-466.<br />
Cheung, F., Kuen, J., & Skitmore, M. (2002). Multi-criteria evaluation model for the selection of<br />
architectural consultants. Construction Management <strong>and</strong> Economics, 20(7), 569-580.<br />
Coulin, C., & Zowghi, D. (2005). Requirements Elicitation for Complex <strong>Systems</strong>: Theory <strong>and</strong> Practice.<br />
In J. L. Mate & A. Silva (Eds.), Requirements Engineering For Sociotechnical <strong>Systems</strong>. Hershey, PA:<br />
Information Science Publishing.<br />
Dey, P. K. (2006). Integrated project evaluation <strong>and</strong> selection using multiple-attribute decision-making<br />
technique. International Journal of Production Economics, 103(1), 90.<br />
Eom, S., & Kim, E. (2006). A survey of decision support system applications (1995-2001). The Journal<br />
of the Operational Research Society, 57(11), 1264-1278.<br />
Giorgini, P., Rizzi, S., & Garzetti, M. (2008). GRAnD: A goal-oriented approach to requirement<br />
analysis in data warehouses. Decision Support <strong>Systems</strong>, 45(1), 4-21.<br />
Gorry, G. A., & Morton, M. S. S. (1989). A Framework For Management Information <strong>Systems</strong>. Sloan<br />
Management Review, 30(3), 49-61.<br />
Gungor, Z., Serhadlioglu, G., & Kesen, S. E. (2009). A fuzzy AHP approach to personnel selection<br />
problem. Applied Soft Computing Journal, 9(2), 641-646.<br />
Hevner, A., March, S., Park, J., & Ram, S. (2004). Design Science in Information <strong>Systems</strong> Research.<br />
MIS Quarterly, 28(1).<br />
Ibrahim, M. M., Mike, J. R., Sami, M. F., & Alex, P. A. (2002). A multi-criteria approach to contractor<br />
selection (Vol. 9, pp. 29-37).<br />
Johnson, J. (1995). Chaos: the dollar drain of IT project failures. Application Development Trends,<br />
2(1), pp. 41-47.<br />
Kahraman, C., Cebeci, U., & Ulukan, Z. (2003). Multi-criteria supplier selection using fuzzy AHP.<br />
Logistics Information Management, 16(6), 382-394.<br />
Kit, C. L. (2005). Incorporating Fuzzy Membership Functions <strong>and</strong> Gap Analysis Concept into<br />
Performance Evaluation of Engineering Consultants – Hong Kong Study. Degree of Doctor of<br />
Philosophy, University of Hong Kong, Hong Kong.<br />
Komarkova, J., Visek, O., & Novak, M. (2007). Heuristic Evaluation of Usability of GeoWeb Sites Web<br />
<strong>and</strong> Wireless Geographical Information <strong>Systems</strong> (Vol. 4857/2007, pp. 264-278): Springer Berlin /<br />
Heidelberg.<br />
Kumaraswamy, M. M., & Dissanayaka, S. M. (2001). Developing a decision support system for<br />
building project procurement. <strong>Building</strong> <strong>and</strong> Environment, 36(3), 337-349.
350<br />
International <strong>Building</strong> & <strong>Infrastructure</strong> Technology Conference<br />
7-8 June 2011, Vistana Hotel, Penang, Malaysia<br />
Lee, J., & Rao, H. R. Task Complexity <strong>and</strong> Different Decision Criteria for Online Service Acceptance:<br />
A Comparison of Two e-Government Compliance Service Domains. Decision Support <strong>Systems</strong>, In<br />
Press, Accepted Manuscript.<br />
Lin, C. C., Wang, W. C., & Yu, W. D. (2008). Improving AHP for construction with an adaptive AHP<br />
approach (A3). Automation in Construction, 17(2), 180-187.<br />
McCowan, A. K., & Mohamed, S. (2002). A classification of Decision Support System for the analysis<br />
<strong>and</strong> evaluation of concession project investment. Journal of Financial Management of Property <strong>and</strong><br />
Construction, 7(2), 127-137.<br />
Molenaar, K. R., & Songer, A. D. (2001). Web-based decision support systems: Case study in project<br />
delivery. Journal of Computing in Civil Engineering, 15(4), 259-267.<br />
Oad, R., Garcia, L., Kinzli, K. D., Patterson, D., & Shafike, N. (2009). Decision support systems for<br />
efficient irrigation in the middle Rio Gr<strong>and</strong>e valley. Journal of Irrigation <strong>and</strong> Drainage Engineering,<br />
135(2), 177-185.<br />
Paech, B., & Kohler, K. (2003). Usability Engineering Integrated with Requirements Engineering Paper<br />
presented at the Workshop on Bridging the Gaps Between Software Engineering <strong>and</strong> Human-<br />
Computer Interaction (ICSE 03), Portl<strong>and</strong>, Oregon, USA.<br />
Peters, M., & Zelewski, S. (2008). Pitfalls in the application of analytic hierarchy process to<br />
performance measurement. Management Decision, 46(7), 1039-1051.<br />
Qijia, T., Jian, M., Jiazhi, L., Kwok, R. C. W., & Ou, L. (2005). An organizational decision support<br />
system for effective R&D project selection. Decision Support <strong>Systems</strong>, 39(3), 403-413.<br />
Sarka, V., Zavadskas, E. K., Ustinovicius, L., Sarkiene, E., & Ignatavicius, C. (2008). System of project<br />
multicriteria decision synthesis in construction. Technological <strong>and</strong> Economic Development of<br />
Economy, 14(4), 546-565.<br />
Shapira, A., & Goldenberg, M. (2005). AHP-based equipment selection model for construction<br />
projects. [Article]. Journal of Construction Engineering <strong>and</strong> Management-Asce, 131(12), 1263-1273.<br />
Shen, Y. C., & Grivas, D. A. (1996). Decision-Support System for <strong>Infrastructure</strong> Preservation. Journal<br />
of Computing in Civil Engineering, 10(1), 40-49.<br />
Shichao, F., Qiping, S., & Kelly, J. (2008). Using group decision support system to support value<br />
management workshops. Journal of Computing in Civil Engineering, 22(2), 100-113.<br />
Shim, J. P., Warkentin, M., Courtney, J. F., Power, D. J., Sharda, R., & Carlsson, C. (2002). Past,<br />
present, <strong>and</strong> future of decision support technology. Decision Support <strong>Systems</strong>, 33(2), 111-126.<br />
Sonmez, M., Holt, G. D., Yang, J. B., & Graham, G. (2002). Applying evidential reasoning to<br />
prequalifying construction contractors. Journal of Management in Engineering, 18(3), 111-119.<br />
Tam, C. M., Tong, T. K. L., & Chiu, G. W. C. (2006). Comparing non-structural fuzzy decision support<br />
system <strong>and</strong> analytical hierarchy process in decision-making for construction problems. European<br />
Journal of Operational Research, 174(2), 1317-1324.<br />
Tsui, F., & Karam, O. (2007). Essentials of software engineering. Sudbury, Mass. :: Jones <strong>and</strong> Bartlett<br />
Publishers.<br />
Turban, E., Aronson, J. E., & Liang, T. P. (2005). Decision Support <strong>Systems</strong> <strong>and</strong> Intelligent <strong>Systems</strong><br />
(7th ed.). Upper Saddle River, New Jersey: Prentice Hall.<br />
van Lamsweerde, A. (2000). Requirements engineering in the year 00: a research perspective. Paper<br />
presented at the ICSE '00: Proceedings of the 22nd international conference on Software engineering.<br />
Yeates, D., & Wakefield, T. (2004). <strong>Systems</strong> Analysis <strong>and</strong> Design. Harlow: Prentice Hall
T189<br />
351<br />
International <strong>Building</strong> & <strong>Infrastructure</strong> Technology Conference<br />
7-8 June 2011, Vistana Hotel, Penang, Malaysia<br />
A REVIEW ON THERMAL PERFORMANCE OF ROOFING MATERIALS IN<br />
MALAYSIA<br />
Ahmad Al Yacouby 1 , Mohd Faris Khamidi 2 , Muhd Fadhil Nuruddin 3 , Arazi Idrus 4 ,<br />
Syed Ahmad Farhan 5 <strong>and</strong> Azrul Esf<strong>and</strong>y Razali 6<br />
1,2,3,4,5 Civil Engineering Department, Universiti Teknologi PETRONAS, B<strong>and</strong>ar Seri<br />
Isk<strong>and</strong>ar, 31750 Tronoh, Perak, Malaysia.<br />
6 Monier Sdn. Bhd., Lot 1908, Batu 7, Jalan Bukit Kemuning, 42450 Klang, Selangor,<br />
malaysia.<br />
1 aalyacouby@gmail.com<br />
ABSTRACT: Houses <strong>and</strong> residential buildings in Malaysia are experiencing overheating of roof space<br />
due to inappropriate selection of roofing systems <strong>and</strong> materials. Consequently, the indoor thermal<br />
comfort of housing is badly affected, especially for low rise buildings where the roof is representing<br />
around 70% of heat gain. The thermal performance of a building is affected by the solar absorbance of<br />
roof, during a clear sky conditions up to 1kW/m 2 of radiation can be incidental on a roof surface <strong>and</strong><br />
between 20% <strong>and</strong> 90% of this radiation is typically absorbed. This paper is intended to review the<br />
roofing materials <strong>and</strong> roof colors used in Malaysian building industry <strong>and</strong> determine whether they are<br />
suitable for the hot humid climate zone. The study aims to review the thermal performance of roofing<br />
materials in Malaysia. Roof colors on some existing buildings <strong>and</strong> home buyers preferred roof tiles’<br />
colors have been determined. A survey was conducted among home buyers in Malaysian to determine<br />
the most preferred roofing colors. The survey results suggest that blue <strong>and</strong> brown are the most<br />
preferred ones followed by red. The study also revealed that 70% of households in Malaysia are using<br />
air-conditioning. The observation survey on some existing buildings revealed that 90% of roof tiles are<br />
red followed by 10 % black color.<br />
Keywords: cool roof, hot humid climate, Malaysia, SRI, thermal comfort, white roof.<br />
1. INTRODUCTION<br />
Residential buildings in Malaysia are subject to significant cooling requirements due to high intensity of<br />
heat transmission from building envelope, especially for low rise buildings where the roof is<br />
representing around 70% of heat gain (Vijaykumar et al., 2007). Accordingly, the selection of<br />
appropriate roofing materials with higher performance in solar energy rejection will be a good<br />
alternative solution to make indoor temperature more comfortable <strong>and</strong> reduce the increasing dem<strong>and</strong><br />
in air conditioning by the building sector. The results of observation survey conducted by Allen et al.<br />
(2008) revealed that concrete roof tiles are the most commonly used roofing finish in Malaysia as it<br />
represents 85 % followed by clay tiles <strong>and</strong> metal deck with 10% <strong>and</strong> 5% respectively. In another<br />
observation survey conducted by the authors of this paper from October 2010 to February 2011 on<br />
roof color for residential buildings within Universiti Tcknologi PETRONAS (UTP) campus, Ipoh,<br />
Tronoh, Seri Isk<strong>and</strong>ar <strong>and</strong> Petaling Jaya in Malaysia suggests that 90% of roof tiles in residential<br />
buildings are red followed by black color roof tiles which represent around 10 %. White color roof tiles<br />
were found to be 0% in the surveyed areas. Hence, introducing alternative roofing materials with<br />
higher Solar Reflectance Index (SRI) became a top urgent necessity in Malaysia. SRI is a composed<br />
measure that accounts for surface’s solar reflectance <strong>and</strong> emittance measured on a dimensionless<br />
scale from 0 to1 (Marceau, 2007).
352<br />
International <strong>Building</strong> & <strong>Infrastructure</strong> Technology Conference<br />
7-8 June 2011, Vistana Hotel, Penang, Malaysia<br />
2. BACKGROUND<br />
2.1 <strong>Building</strong> Impact on the Environment<br />
Houses <strong>and</strong> buildings impact the environment in several ways as a result of both their energy use <strong>and</strong><br />
material consumption. The emission of greenhouse gases <strong>and</strong> the creation of heat isl<strong>and</strong>s in urban<br />
areas are among their major impacts. Therefore, the adoption of building design strategies <strong>and</strong><br />
construction materials that address these issues will lead to huge difference to global warming <strong>and</strong><br />
reductions in a building’s overall environmental impact. Further, the use of mechanical ventilation <strong>and</strong><br />
air conditioners in buildings is arising two major problems as shown in Figure 1. First, air conditioning<br />
system is consuming a lot of energy <strong>and</strong> consequently increasing the households in the utility bills.<br />
Second, the electricity generation from fossil fuels is increasing the greenhouse gases concentration in<br />
the atmosphere which affects the global warming <strong>and</strong> climate changes. This paper is intended to<br />
review the performance of roofing materials used in Malaysia in terms of solar heat rejection.<br />
Figure 1. Cause <strong>and</strong> Effect Diagram<br />
2.2 <strong>Building</strong> Envelope Heat Gain<br />
The concept of using cool roof in residential, commercial <strong>and</strong> industrial buildings is growing in the last<br />
decade as one of the most cost effective solutions to mitigate the global warming issue <strong>and</strong> reduce the<br />
greenhouse gases (GHG’s) emittence resulting from burning of fossil fuels in electricity generation.<br />
The thermal performance of a building is affected by the solar absorbance of roof. During a clear sky<br />
conditions up to about 1kW/m 2 of radiation can be incidental on a roof surface <strong>and</strong> between 20% <strong>and</strong><br />
90% of this radiation is typically absorbed ( Suehrcke, H., et al., 2008). Heat entering to the houses<br />
<strong>and</strong> low rise building’s structure is the major cause of discomfort in hot humid climate zone countries.<br />
The building roof is about 50-70% of the total heat entry of rooms as shown in Figure 2 (Vijaykumar et<br />
al., 2007). Further, In May 2009, Dr. Steven Chu Secretary of Energy " United States Department of<br />
Energy” advised that painting roofs white to reflect sunlight can make a huge difference to global<br />
warming (Mark, 2009). Hence, in order to meet challenges in mitigating global warming <strong>and</strong> climate<br />
change, the use of light color roofing materials with higher SRI would be highly recommended in<br />
Malaysia, as roof is the most important part of the building envelope which is exposed directly to sun<br />
light during the day.<br />
<strong>Building</strong> Envelop<br />
Walls<br />
Roof<br />
<strong>Building</strong> Envelop Heat Gain<br />
30%<br />
70%<br />
0% 20% 40%<br />
Heat Gain<br />
60% 80%<br />
Series1<br />
Figure 2. Low Rise <strong>Building</strong> Envelope Heat Gain
2.3 Review of Some Existing Literature<br />
353<br />
International <strong>Building</strong> & <strong>Infrastructure</strong> Technology Conference<br />
7-8 June 2011, Vistana Hotel, Penang, Malaysia<br />
The review of some existing literature has revealed that several successful researches on solar<br />
reflectance <strong>and</strong> heat transmittance of different materials have been conducted during the last decade.<br />
For instance, a research done by Lawrence Berkeley National Laboratory in 1997 revealed that a<br />
whiter roof results in savings of $ 51 per year per 1000ft 2 roof area of air conditioned buildings (<br />
Konopacki et al., 1997). Experiments in California <strong>and</strong> Florida have produced summer direct cooling<br />
energy savings of 10-70% (Sara <strong>and</strong> Akbari, 1997). On the other h<strong>and</strong> Suehrcke et al.(2008) using<br />
numerical simulation <strong>and</strong> deriving equations suggested that in hot climates a significant reduction in<br />
downward heat flow can be achieved by using a light or reflective roof color instead of a dark one.<br />
The benefits of using light color roofing materials have been noted by Jayasinghe et al. (2003),<br />
Levinson et al. (2005, 2010), Filho et al., (2010) <strong>and</strong> Bryan <strong>and</strong> Roth (2010). Furthermore, Levinson<br />
et al. (2007) have demonstrated in their research that non white near-infrared-reflective architectural<br />
coating can be applied in-situ to concrete or clay tile roofs to reduce temperature. The study suggests<br />
that under typical condition e.g. 1 KW/m 2 summer afternoon insolation, R-11 attic insulation, no<br />
radiant barrier, <strong>and</strong> 0.3 reduction in solar absorptance, absolute reduction of roof surface<br />
temperature, attic air temperature, <strong>and</strong> ceiling heat flux were about 12K, 6.2K <strong>and</strong> 3.7W/m 2<br />
respectively. In the same study Levinson et al. (2007) reported that for a typical 139m 2 houses with R-<br />
11 attic insulation <strong>and</strong> no radiant barrier, reducing the roof absorptance by 0.3 revealed whole house<br />
peak energy saving of 230W in Fresno, 210W in San Bernardino <strong>and</strong> 210W in San Diego. Detailed<br />
explanation on how does cool roofing help is also provided in Cool Roof Design Brief (2006). The<br />
above review of the literature raises the following questions:<br />
� Light color roofing materials reflect more sunlight <strong>and</strong> improve the indoor thermal comfort. Is this<br />
technique applied in Malaysian construction industry?<br />
� What is the most preferred roofing color by home buyers in Malaysia?<br />
� Is the necessary information related to benefits of using white color roof tiles in Malaysian<br />
building industry available?<br />
� More studies are needed to address the benefits of cool roofs in tropical climate zone where the<br />
average daily temperature is very hot all over the year, <strong>and</strong> experiencing high level of relative<br />
humidity. So what are the challenges facing the use of white roofs in Malaysia?<br />
3. METHODOLOGY<br />
In order to answer the questions mentioned above, this paper provides a systematic review <strong>and</strong><br />
evaluation of current roofing materials <strong>and</strong> roofing colors used in Malaysia. An observation survey<br />
was conducted to determine the roof colors on some exhibiting buildings. Another survey was<br />
conducted to determine the most preferred roofing color by home buyers in Malaysia. The usage of air<br />
conditioning in households was also covered in the survey. The survey results have been analyzed<br />
<strong>and</strong> compared with the global trends of white roof techniques introduced to mitigate the global<br />
warming <strong>and</strong> climate change. Finally, suitability of currently used roofing color for hot humid Malaysian<br />
climate was also discussed in this study.<br />
4. COMMONLY USED ROOFING MATERIALS IN MALAYSIA<br />
Concrete, clay, <strong>and</strong> metal sheets are the roofing material types that are available in the market <strong>and</strong><br />
widely used in hot humid climate zone; especially in Malaysia. The decision on roofing materials are<br />
normally made according to home buyer’s requirements <strong>and</strong> climatic conditions. The budget also plays<br />
an important role in selecting the type of roof tiles. However, the roof material’s ability to reject solar<br />
energy is not a governing factor during the selection of roof color. This is due to lack of information on<br />
the significant influence of roof color on thermal heat gain. As depicted in Table 1. below, an<br />
observation survey was conducted by Allen et al.,(2008) from December 2006 to March 2007 on<br />
roofing systems <strong>and</strong> materials for residential buildings within the state of Selangore <strong>and</strong> Wilayah<br />
Persekutuan Kuala Lumpur in Malaysia. The study revealed that 85% of residential uildings have<br />
concrete roof tiles, followed by 10% clay <strong>and</strong> 5% metal deck sheets used mainly in bungalow building<br />
types.
354<br />
International <strong>Building</strong> & <strong>Infrastructure</strong> Technology Conference<br />
7-8 June 2011, Vistana Hotel, Penang, Malaysia<br />
Table 1. Observation Survey on Roofing Materials in Malaysia. Source Allen et al. (2008)<br />
<strong>Building</strong> Types Concrete<br />
tiles<br />
Clay tiles Metal Deck<br />
Terrace Apartment 45% 2.5% -<br />
Semidetached 20% 2.5% -<br />
Cluster house 2.5% - -<br />
Bungalow 17.5% 5% 5%<br />
Total 85% 10% 5%<br />
5. HEAT TRANSFER<br />
a. Modes of Heat Transfer<br />
Where there is a temperature difference between two places heat tends to flow from the higher<br />
temperature to the lower <strong>and</strong> the heat transmission can occur in three ways; (1) conduction, (2)<br />
convection, <strong>and</strong> (3) radiation (Esmond, 1999) as described below:<br />
1) Conduction: Heat transfer due to temperature difference in a material (but it most often associated<br />
with solids).<br />
" T1<br />
� T2<br />
T1 T2<br />
q x � k =<br />
L R<br />
�<br />
(1)<br />
Mat<br />
2) Convection: Energy transfer from a solid surface due to a fluid (liquid or gas) in motion.<br />
''<br />
q � h c ( T s�T<br />
�)<br />
(2)<br />
3) Radiation: Energy transferred by electromagnetic waves as photons (Potter <strong>and</strong> Scott, 2004).<br />
''<br />
rad<br />
4<br />
sur<br />
4<br />
q � �� ( T �T<br />
)<br />
(3)<br />
Often the heat transfer is denoted as in equation 4 <strong>and</strong> has unit of W/m 2 .<br />
q �<br />
' '<br />
Q<br />
A<br />
The following terms are normally used to rate the materials insulation performance of building<br />
envelopes.<br />
� The thermal resistance (R) is a measure of a material's ability to resist heat transfer. It is the direct<br />
measure of its resistance to transfer energy or heat. R values are expressed using the metric units<br />
(m 2 .K/W).<br />
� Thermal conductivity (K) is defined as the ability of material to conduct heat; its unit is (W/m. K).<br />
� U-Value is defined as a measure of the rate of heat loss or gain through a material or assembly, it<br />
is the inverse of R, therefore, U =1/R <strong>and</strong> its unit is W/(m².K)<br />
b. Solar Reflectance Index (SRI)<br />
The Solar Reflectance Index (SRI) is defined as the ability of material to reject solar energy; it is a<br />
composed measure that accounts for surface’s solar reflectance <strong>and</strong> emittance (Marceau et al., 2007).<br />
The SRI is the fraction of the sun light that a surface reflects, sun light which is not reflected is<br />
absorbed as a heat (Bryan <strong>and</strong> Kurt, 2010). Solar reflectance is measured on a scale of 0 to 1. For<br />
example a surface that reflects 66% of sun light has a solar reflectance of 0.66. Most dark roof<br />
material reflects 5% to 20% on incoming sunlight, while light colored roof materials typically reflects<br />
55% to 90% (Bryan <strong>and</strong> Kurt, 2010). Solar reflectance has the biggest effect on keeping roof cool in<br />
the sun (Carolyn, 2008). Comparative solar heating properties for some common materials for steep<br />
roofing are provided in Table 2 (Edward, A., <strong>and</strong> Joseph, I., 2009)<br />
(4)
355<br />
International <strong>Building</strong> & <strong>Infrastructure</strong> Technology Conference<br />
7-8 June 2011, Vistana Hotel, Penang, Malaysia<br />
Table 2. Solar Heating Properties for Some Roofing Materials- Steep Roofing<br />
Material Description<br />
Metal Panel with Cool<br />
white coating<br />
Data source [Edward, A., <strong>and</strong> Joseph, I., 2009]<br />
Solar<br />
Reflectance<br />
Thermal<br />
emissivity<br />
Solar<br />
Reflectance<br />
Index (SRI)<br />
Roof Surface<br />
Temperature Rise<br />
0.70 0.85 85 25 o F(1 o C)<br />
Aluminum Uncoated 0.60 0.05 40 56 o F(31 o C)<br />
Red clay tile 0.35 0.90 35 60 o F(33 o C)<br />
Metal Panel with cool<br />
color coating.<br />
Unpainted concrete<br />
tiles<br />
0.30 0.85 30 66 o F(37 o C)<br />
0.25 0.90 25 70 o F(39 o C)<br />
Further, another survey was conducted by the authors to determine the home buyers’ most preferred<br />
roofing color in Malaysian. The survey was conducted during Malaysia Property Expo (MAPEX 2011).<br />
From 500 target population 204 participants have responded to the questionnaires survey. The<br />
preliminary analysis of study revealed that 32% of home buyers in Malaysia prefer blue color roof tiles,<br />
20% brawn color followed by 29% red, 15% green, 7% yellow <strong>and</strong> 5% for grey <strong>and</strong> white as shown in<br />
Figure 3.<br />
Percentage of<br />
Preference(%)<br />
35.0%<br />
30.0%<br />
25.0%<br />
20.0%<br />
15.0%<br />
10.0%<br />
5.0%<br />
0.0%<br />
Yellow<br />
Red<br />
Prefered Roof Color<br />
Prefered Roof Color<br />
Blue<br />
Green<br />
Roof Color<br />
Figure 3. Preferred Roofing Colors in Malaysia<br />
The majority of home buyers who decided to select dark colors roof tiles as their preferred color<br />
justified that this is because white color tiles are quite difficult for maintenance. As white color roof tiles<br />
tend to discoloration <strong>and</strong> fungi growth associated with monsoon <strong>and</strong> high level of humidity that<br />
characterize the Malaysian climate zone. However, this issue can be resolved by developing stainless<br />
light color roofing materials. In addition when we compare the preferred roof colors summarized in<br />
Figure 3 with some solar heating properties of roofing materials in Table 2, we can conclude that most<br />
of dark color roof tiles are falling within SRI value below 40. This indicates that the roofing colors used<br />
in Malaysia are not the optimum in terms of solar reflectance as most of them are dark materials. This<br />
means the solar performance of roofing materials in Malaysia are not in line with the global trends for<br />
light color roofing system implemented in USA <strong>and</strong> Europe in order to mitigate the global warming.<br />
c. Thermal Comfort<br />
Thermal comfort can be defined as the range of climatic condition considered comfortable <strong>and</strong><br />
acceptable, <strong>and</strong> in accordance with ANSI/ASHRAE St<strong>and</strong>ard, (2005) the thermal comfort is state of<br />
mind that expresses satisfaction with the surrounding environment. Thermal comfort is very important<br />
to many work-related factors. It can affect the distraction levels of the workers, <strong>and</strong> in turn affect their<br />
performance <strong>and</strong> productivity of their work. The thermal comfort might be affected by the (1)<br />
Grey<br />
Brown<br />
White
356<br />
International <strong>Building</strong> & <strong>Infrastructure</strong> Technology Conference<br />
7-8 June 2011, Vistana Hotel, Penang, Malaysia<br />
environmental (air <strong>and</strong> ambient) temperature, (2) humidity, (3) air speed, (4) clothing <strong>and</strong> metabolic<br />
rates. The thermal sensation of humans is mainly related to the thermal balance of the body as a<br />
whole. Thermal balance exists when the internal heat production in the body is equal to the loss of<br />
heat to the environment. PMV index (Predicted Mean Vote) <strong>and</strong> PPD index (Predicted Percentage<br />
Dissatisfied) are the most widely used indices in moderate thermal environment. Examples of recent<br />
studies in thermal comfort include Jorn (2005), Roonak et al. (2009) <strong>and</strong> Cao et al. (2010).<br />
6. ENERGY CONSUMPTION<br />
Electricity is a necessity factor for developing <strong>and</strong> civilization of nations, but the energy generation<br />
from fossil fuels has two major effects. On one h<strong>and</strong>, the fossil fuels reserves are depleting, for<br />
instance, in 2004, Malaysia was ranked 24 th in terms of worlds oil reserves <strong>and</strong> 13 th of natural gas,<br />
<strong>and</strong> in January 2007, PETRONAS reported that oil <strong>and</strong> gas reserves in Malaysia amounted to 20.18<br />
billion barrels equivalent. In accordance with the Malaysian<br />
government estimates; at the current production rate, Malaysia will be able to produce oil <strong>and</strong> gas up<br />
to 18 years <strong>and</strong> 35 years respectively (Cha <strong>and</strong> Oh, 2010) with respect to 2004 level. On the<br />
other h<strong>and</strong>, the process of electricity generation using fossil fuels is damaging the ecosystems by<br />
producing greenhouse gases (GHG’s). Further, in accordance with the International Energy Agency’s<br />
CO2 emission report published in 2010 (International Energy Agency, 2010). It is obviously evident<br />
that CO2 emission is related directly to electricity consumption, with China being the biggest CO2<br />
emitter in the word with 6508.24 MT of CO2 in 2008, followed by USA with 5595.92 MT of CO2.<br />
Numbers of Air Condioners<br />
1400000<br />
1200000<br />
1000000<br />
800000<br />
600000<br />
400000<br />
200000<br />
0<br />
A/C units in Malaysia<br />
Air conditioner units in Malaysia<br />
1999 2000 2001 2005 2009 2013 2015<br />
Years<br />
Figure 4. Air conditioner Units in Residential <strong>Building</strong> in Malaysia,<br />
Data source: Saidur. R., et al., (2007)<br />
Moreover, Ong et al. (2010) found that Malaysia’s energy sector is still heavily depending on non<br />
renewable fuels such as crude oil <strong>and</strong> natural gas <strong>and</strong> coal, <strong>and</strong> these non renewable fuels are<br />
gradually depleting <strong>and</strong> contribute huge amount of greenhouse gas emissions. In addition, Saidur et<br />
al. (2007) in their study on energy <strong>and</strong> associated greenhouse gas emissions from household<br />
appliances in Malaysia for estimated period of 17 years (1999-2015) suggested that refrigerator–<br />
freezer is the major energy consuming appliances followed by air conditioners. The number of air<br />
conditioner units in Malaysia was 493,082 in 1999 while the projected number of air conditioners in<br />
2015 is expected to reach 1,271,746 units (Saidur et al. ,2007), an increase of 68% compared to<br />
1999 level as shown in Figure 4. Further, in a recent study conduct by the others of this paper during<br />
MAPEX 2011 in Kuala Lumpur to determine the percentage of air condoning usage among Malaysian<br />
households. 500 questioners have been distributed to home buyers <strong>and</strong> 208 participants have<br />
responded. The preliminary analysis of study suggests that 75.5% of Malaysians households are<br />
using air conditioning, while about 24.5 % are depending on natural ventilation or fans.<br />
7. CONCLUSIONS<br />
The thermal performance of a building is affected by the solar absorptance of roof. During a clear sky<br />
conditions up to about 1kW/m 2 of radiation can be incidental on a roof surface <strong>and</strong> between 20% <strong>and</strong><br />
90% of this radiation is typically absorbed. Results of observation survey on roof colors suggest that<br />
90% of roof tiles in low rise Malaysian residential buildings are red followed by 10% black color tiles.<br />
In addition 32% of home buyers in Malaysia prefer blue color roof tiles, 20% brown color followed by<br />
29% red, 15% green, 7% yellow <strong>and</strong> 5% for grey <strong>and</strong> white. The preference of dark color roof tiles by<br />
home buyers is mainly due to lack of information as well as the absence of systematic researches
357<br />
International <strong>Building</strong> & <strong>Infrastructure</strong> Technology Conference<br />
7-8 June 2011, Vistana Hotel, Penang, Malaysia<br />
which address the benefits of light colors roofing materials in Malaysia. The maintenance difficulties<br />
associated with white color roofing system could also be another reason. Therefore, in order to make<br />
a total shift from dark color roof tiles to light color roofing system in Malaysia, private initiatives from<br />
researchers together with governmental support to conduct research on Solar Reflectance Index (SRI)<br />
of roof tiles <strong>and</strong> developing stainless light color roof tiles will be essential to make possible a<br />
sustainable development future.<br />
REFERENCES<br />
Allen, L. K. K., Elias S., <strong>and</strong> Lim, C.H., (2008). The thermal performance of evaluation of roofing<br />
systems <strong>and</strong> materials in Malaysian Residential Development, proceedings of SENVAR, ISESEE,<br />
Humanity <strong>and</strong> Technology.pp.387-395<br />
ANSI/ASHRAE St<strong>and</strong>ard 55, 2005: “Thermal Environmental Conditions for Human Occupancy”<br />
Bryan, U., <strong>and</strong> Kurt, R., (2010). Guide line for selecting cool roof, V1.2, DE-AC05-00R22725. US<br />
Department of Energy, <strong>Building</strong> Technology Program.<br />
Cao,B., Yingxin, Z., Qin, O., Xiang Z., <strong>and</strong> Li, H.,(2010). Field study on Human Thermal Comfort <strong>and</strong><br />
Thermal Adaptability during the summer <strong>and</strong> winter in Beijing, Energy <strong>and</strong><br />
<strong>Building</strong>s,dio:10.1016/j.enbuild.2010.09.025<br />
Carolyn, R., (2008). Energy Efficiency Fact sheet, WSUEEP08-006, Washington State University.<br />
Cha, S.C., <strong>and</strong> Oh, T.H., (2010). Review on Malaysia natural energy development: Key policies,<br />
agencies, programs, <strong>and</strong> international involvements. Renewable <strong>and</strong> <strong>Sustainable</strong> Energy Reviews<br />
(14) 2916-2925.<br />
Cool Roof Design Brief (2006). Pacific Gas <strong>and</strong> Electric Company, USA, Energy Design Resources.<br />
Edward, A., <strong>and</strong> Joseph, I., (2009). Roofing in “Fundamental of <strong>Building</strong> Construction Materials <strong>and</strong><br />
Methods”, Ch.16, pp.651-706<br />
Esmond, R., (1999). Enclosure in “Underst<strong>and</strong>ing <strong>Building</strong>s”. Singapore: Longman, Ch.2, pp.39-77.<br />
Filho, J.P.B., Henriquez, J.R., <strong>and</strong> Dutra, J.C.C., (2010): Effects of coefficients of solar reflectivity <strong>and</strong><br />
infrared emissivity on the temperature <strong>and</strong> heat flux on horizontal flat roofs of artificially conditioned<br />
non-residential buildings”, Energy <strong>and</strong> <strong>Building</strong>s: dio:10.1016/j/enbuild.2010.10.007<br />
International Energy Agency (2010). CO2 Emissions from fuel Combustion- H I G H L I G H T,<br />
France: International Energy Agency (IEA).<br />
Jayasinghe, M.T.R., Attalage R.A. <strong>and</strong> Jayawardena, A.I., (2003). Roof orientation, roofing materials<br />
<strong>and</strong> roof surface color. Energy for <strong>Sustainable</strong> Development (7)1, pp. 16-27.<br />
Jorn, T. (2005). Thermal Comfort Indices, CRC press, pp.63.1-63.10<br />
Konopacki, S., H. Akbari, M. Pomerrantz, S. Gaberssek, <strong>and</strong> L. Garl<strong>and</strong> (1997). Cooling Energy<br />
Savings Potential of Light-Colored Roof for Residential <strong>and</strong> commercial <strong>Building</strong>s in 11 U.S.<br />
Metropolitan Area. LBNL-39433, California, USA.<br />
Levinson R., Berdahl, P., Asefaw B., A., <strong>and</strong> Akbari, H.,(2005). Effects of soiling <strong>and</strong> cleaning on the<br />
reflectance <strong>and</strong> solar heat gain of a light-colored roofing membrane, Atmospheric Environment (39),<br />
pp. 7807–7824.<br />
Levinson, R., Hashem, A., <strong>and</strong> Joseph, C. R., (2007). Cooler tiles-roofed buildings with near- infrared<br />
–reflective non white coatings. <strong>Building</strong> <strong>and</strong> Environment (42), pp. 2591-2605<br />
Levinson, R. , Akbari, H., Berdahl, P., Wood, K., Skilton, W., Petersheim, J. (2010): A novel technique<br />
for the production of cool colored concrete tile <strong>and</strong> asphalt shingle roofing products: Solar Energy<br />
Materials <strong>and</strong> Solar Cells (94)6, pp.946-954.<br />
Marceau, M. L., <strong>and</strong> Martha, G.V. (2007). Solar Reflectance of concretes for LEED <strong>Sustainable</strong> Site<br />
Credit: Heat Isl<strong>and</strong> Effect , SN2982, Portl<strong>and</strong> Cement Association, Skokie, Illinois, USA<br />
Mark H., (2009). The Times, Professor Steven Chu: Paint the world white to fight global warming,<br />
[online], Available at:<br />
http://www.timesonline.co.uk/tol/news/environment/article6366639.ece > [Accessed 16 April 2011]
358<br />
International <strong>Building</strong> & <strong>Infrastructure</strong> Technology Conference<br />
7-8 June 2011, Vistana Hotel, Penang, Malaysia<br />
Ong H.C., Mahlia, T.M.I. <strong>and</strong> . Masjuki H.H, (2010). A review on energy scenario <strong>and</strong> sustainable<br />
energy in Malaysia. Renewable <strong>and</strong> <strong>Sustainable</strong> Energy Rev. dio:10.1016/J.rser.2010.09.043<br />
Potter, M.C., <strong>and</strong> E.P. (2004). Work <strong>and</strong> Heat in “Thermal Sciences” Belmont, CA: Thomson Learning,<br />
Ch.3, PP.47-68<br />
Roonak, D., Kamaruzzaman, S., <strong>and</strong> Jalil, M. (2009). Thermal comfort in naturally ventilated office<br />
under varied opening arrangement: Objective <strong>and</strong> subjective approach, European Journal of Science<br />
Research,(26)2, pp.260-276<br />
Sara, E., <strong>and</strong> Akbari, H. (1997). Long term Performance of Height- albedo roof coatings. Energy <strong>and</strong><br />
<strong>Building</strong>s (25) 159-167<br />
Saidur, R., Masjuki, H.H., Jamaluddin, M.Y., <strong>and</strong> Ahmed, S.,(2007). Energy <strong>and</strong> associated green<br />
houses gas emissions from household appliances in Malaysia. Energy Policy (35),pp.1648-1657<br />
Suehrcke, H., Eric, L. P., <strong>and</strong> Neville, S., (2008). Effect of roof solar reflectance on the building heat<br />
gain in a hot climate. Energy <strong>and</strong> <strong>Building</strong> (40)2224 -2235<br />
Vijaykumar, K.C.K. , Srinivasan, P.S.S. <strong>and</strong> Dh<strong>and</strong>apani, S.,(2007). A performance of hollow tiles<br />
clay (HTC) laid reinforced cement concrete (RCC) roof for tropical summer climates , Energy <strong>and</strong><br />
<strong>Building</strong>s (39),pp.886-892
T190<br />
359<br />
International <strong>Building</strong> & <strong>Infrastructure</strong> Technology Conference<br />
7-8 June 2011, Vistana Hotel, Penang, Malaysia<br />
ULTRA HIGH PERFORMANCE CONCRETE (UHPC) TECHNOLOGY FROM<br />
MATERIAL TO STRUCTURE: A REVIEW<br />
Behzad Nematollahi 1 , Raizal Saifulnaz M.R. 2 <strong>and</strong> Yen Lei Voo 3<br />
1,2 University Putra Malaysia, Serdang, Malaysia.<br />
3 Dura Technology Sdn. Bhd., Perak, Malaysia.<br />
1 behcom62@gmail.com , 2 raizal@eng.upm.edu.my , 3 vooyenlei@dura.com.my<br />
ABSTRACT: In the 21 st century, one of the significant breakthroughs in concrete technology is the<br />
development of Ultra High Performance Concrete (UHPC) with compressive strength over 150 MPa<br />
<strong>and</strong> flexural strength over 30 MPa; <strong>and</strong> enhanced durability similar to natural rocks. In brief, UHPC is a<br />
cementitious based composite material that consists of the distinctive characteristics of the ultra-high<br />
performance concrete <strong>and</strong> high tensile strength steel fibers. UHPC is a sustainable construction<br />
material with considerable amount of durability, ductility <strong>and</strong> tensile capacity. UHPC is mostly<br />
appropriate for the use in the fabrication of precast members in civil engineering, structural <strong>and</strong><br />
architectural applications. This paper presents an overview of the material characteristics of a<br />
Malaysian blend of UHPC (i.e. Dura ® ), the principles of UHPC development, its mix design, its<br />
advantages, <strong>and</strong> its applications.<br />
Keywords: ultra high performance concrete (UHPC), ductility, durability, sustainable<br />
construction material<br />
1. INTRODUCTION<br />
Since last two decades, astonishing advancements has been made in the field of concrete technology.<br />
One of the great break-through was the development of fiber reinforced reactive powder concrete<br />
(RPC), <strong>and</strong> more commonly known as the ultra-high performance concrete (UHPC). This advanced<br />
material was firstly introduced by Richard <strong>and</strong> Cheyrezy (1995) in the mid 1990’s with compressive<br />
strength greater than 200 MPa <strong>and</strong> modulus of rupture of 25-50 MPa. Although vast progress in UHPC<br />
technology has been achieved in recent decades (Voo & Foster 2009; Graybeal 2006; Schmidt,<br />
Fehling & Geisenhanslüke 2004); however, its application in many developing countries is still in its<br />
infant stages. So far many researchers around the world have developed such concretes that could be<br />
categorized as UHPC such as Ductal ® , Ceracem ® , BSI ® , Densit ® , Ducon ® <strong>and</strong> Dura ® . Although there<br />
are differences among these types of UHPC; however, there are many overall similarities (Dura<br />
Technology Sdn. Bhd. n.d.).<br />
2. MATERIAL CHARACTERISTICS OF UHPC<br />
Table 1 (Voo & Foster 2010, p.170) shows the material characteristics of two commercials UHPC<br />
blends known as Ductal ® <strong>and</strong> Dura ® compared against Normal Strength Concrete (NSC), <strong>and</strong> High<br />
Performance Concrete (HPC).<br />
The comparison shows that UHPC has higher mechanical properties over NSC <strong>and</strong> HSC in all<br />
disciplines (Voo & Foster 2010).<br />
HPC is a high strength, ductile, <strong>and</strong> sustainable construction material formulated by combining<br />
Portl<strong>and</strong> cement, silica fume, fine washed/sieved s<strong>and</strong>, superplasticizer, water, <strong>and</strong> steel fibers. UHPC<br />
is an extremely homogenous cementitious blend without using coarse aggregates that can attain<br />
compressive strength of 150 MPa <strong>and</strong> above (Voo & Poon 2009; Richard & Cheyrezy 1995).
360<br />
International <strong>Building</strong> & <strong>Infrastructure</strong> Technology Conference<br />
7-8 June 2011, Vistana Hotel, Penang, Malaysia<br />
Table 1. Material characteristics of UHPCs compared to Normal Strength Concrete (NSC) <strong>and</strong> High<br />
Performance Concrete (HPC)<br />
Characteristics<br />
Unit<br />
Codes/<br />
St<strong>and</strong>ards<br />
NSC HPC DURA DUCTAL<br />
Specific Density, kg/m 3 BS1881:Part 114-<br />
1983<br />
2300 2400 2350 – 2450<br />
2440 –<br />
2550<br />
Cylinder Compressive<br />
Strength, fcy<br />
MPa AS1012.9-1999 20 – 50 50 – 100 120 – 160 123 – 210<br />
Cube Compressive Strength,<br />
fcc<br />
MPa<br />
BS6319: Part 2-<br />
1983<br />
20 – 50 50 – 100 130 – 170 158 – 220<br />
Creep Coefficient at 28 days,<br />
cc<br />
AS1012.16-1996<br />
ASTM C512<br />
2 – 5 1 – 2 0.2 – 0.5 0.29 – 0.66<br />
Post Cured Shrinkage AS1012.16-1996 1000 – 2000 500 – 1000 < 100 0<br />
Modulus of Elasticity, Eo GPa BS1881:Part 121- 20 – 35 35 – 40 40 – 50 50 – 53<br />
Poisson’s Ratio,<br />
1983 0.2 0.2 0.18 – 0.2 0.2<br />
Split Cyl. Cracking Strength,<br />
ft<br />
Split Cyl. Ultimate Strength,<br />
MPa<br />
MPa<br />
BS:EN 12390-6-<br />
2000<br />
ASTM C496<br />
2 – 4<br />
2 – 4<br />
4 – 6<br />
4 – 6<br />
5 – 10<br />
10 – 18<br />
8.6 – 12.4<br />
18.3 – 26.5<br />
fsp<br />
Flexural 1st Cracking<br />
Strength, fcr,4P<br />
MPa 2.5 – 4 4 – 8 8 – 9.3 9 – 9.7<br />
Modulus of Rupture, fcf,4P MPa 2.5 – 4 4 – 8 18 – 35 40 – 50<br />
Bending Fracture Energy,<br />
N/mm ASTM C1018-1997 < 0.1 < 0.2 1 – 2.5 N/A<br />
Gf, =0.46mm<br />
Bending Fracture Energy,<br />
Gf, =3.0mm<br />
Bending Fracture Energy,<br />
Gf, =10mm<br />
Toughnes<br />
s Indexes<br />
N/mm (Four-Point Test<br />
on<br />
< 0.1 < 0.2 10 – 20 N/A<br />
N/mm Un-notched<br />
Specimen)<br />
< 0.1 < 0.2 15 – 30 N/A<br />
I5 1 1 4 – 6 5.3 – 6.2<br />
I10 1 1 10 – 15 11.8 – 14.4<br />
I20<br />
1 1 20 – 35 25.9 – 32.8<br />
Modulus of Rupture, fcf,3P MPa 2.5 – 4 4 – 8 18 – 35 40 – 50<br />
Bending Fracture Energy,<br />
Gf, =0.46mm<br />
Bending Fracture Energy,<br />
Gf, =3.0mm<br />
Bending Fracture Energy,<br />
N/mm<br />
N/mm<br />
N/mm<br />
JCI-S-002-2003<br />
(3-Point Test on<br />
Notched<br />
Specimen)<br />
361<br />
International <strong>Building</strong> & <strong>Infrastructure</strong> Technology Conference<br />
7-8 June 2011, Vistana Hotel, Penang, Malaysia<br />
Table 2. Mix design of st<strong>and</strong>ard UHPC (quantity in kg/m 3 )<br />
4. PRINCIPLES OF UHPC DEVELOPMENT<br />
Ingredient Mass (kg/m3)<br />
UHPC Premix 2100<br />
Superplasticizer 40<br />
Steel Fiber 157<br />
Free Water 144<br />
3% Moisture 30<br />
Targeted W/B Ratio 0.15<br />
Total Air Void < 4%<br />
UHPC is established on the principle that a material with a minimum of weaknesses such as microcracks<br />
<strong>and</strong> pore spaces shall be capable to reach a superior quantity of the potential ultimate load<br />
carrying capacity as defined by its component materials (Richard & Cheyrezy 1995).<br />
UHPC is founded on the four principles that can be summarized as follows: 1- Optimized granular<br />
packing which improves homogeneity <strong>and</strong> cause ultra-dense matrix. 2- Extremely low water cement<br />
ratio (W/C< 0.15) which reduces amount of pores <strong>and</strong> capillary, pore sizes, concrete cancer issues<br />
e.g. carbonation, improves impermeability, <strong>and</strong> results in remarkable durability <strong>and</strong> strength. 3-<br />
Inclusion of very high strength micro-fibers which enhances tensile strength <strong>and</strong> ductility, improves<br />
impact <strong>and</strong> abrasive resistance, <strong>and</strong> bridge micro-crack more effectively. 4- Steam cured for long<br />
period of time which accelerates all early <strong>and</strong> drying shrinkage, improves overall material properties<br />
which cause volumetrically stability, minimal creep, <strong>and</strong> negligible shrinkage.<br />
5. UHPC VS. CONVENTIONAL STEEL FIBER REINFORCED CONCRETE (CSFRC)<br />
UHPC, with respect to general mechanical characteristics, is superior to Conventional Steel Fiber<br />
reinforced Concrete (CSFRC). The steel fibers used in CSFRC have tensile strengths usually up to<br />
1000 MPa <strong>and</strong> the fiber fracture may take place during cracking; whereas the steel fibers used in<br />
UHPC have tensile strengths above 2300 MPa, hence fracturing of the fibers will never occur, which<br />
will result in ensuring that the UHPC matrix keeps high ductility during cracking. Due to its greater<br />
fracture properties, UHPC demonstrates “Strain-Hardening” <strong>and</strong> “Displacement Hardening” behaviors<br />
during tensile stresses, whereas such behavior is not revealed in CSFRC (Dura Technology Sdn. Bhd.<br />
n.d.).<br />
6. STEEL FIBER IN UHPC<br />
Even though UHPC demonstrates considerably improved compressive strength <strong>and</strong> lower porosity;<br />
however, UHPC matrices tend to be fragile. Thus, micro steel fibers with various dimensions <strong>and</strong><br />
mechanical properties are commonly used in UHPC at different concrete volume percentage to<br />
develop tensile <strong>and</strong> flexural strength, resistance to impact or toughness, cracking control, <strong>and</strong> modify<br />
the mode of collapse by escalating post cracking ductility (Victor, Lawrence & Kimberly 2009).<br />
Different type <strong>and</strong> volume of steel fibers are commonly used in UHPC which may result in different<br />
mechanical properties in which lf is the total length of the fiber, df the diameter of the fiber, αf the<br />
aspect ratio of the fiber (αf = lf / df), <strong>and</strong> σfu is the ultimate tensile strength of the fiber. For instance lf,<br />
df, αf, <strong>and</strong> σfu may vary from 13 to 35 mm, 0.20 to 0.50 mm, 60 to 80, 1200 to 2500 MPa respectively<br />
(Voo & Foster 2009).<br />
7. RUSTING OF STEEL FIBERS IN UHPC<br />
Generally, some rust staining may come into view on the outer surface or skin of the structural<br />
elements due to oxidation of steel fibers that lie right at the surface of the concrete. Corrosion of steel<br />
fibers at the surface or skin of the concrete is not structurally considerable. Experimental tests have<br />
shown that even in an aggressive environment with high potential corrosion, the steel fibers will not<br />
rust further than a depth of 2 mm from the outer surface or skin of the concrete, because the matrix of
362<br />
International <strong>Building</strong> & <strong>Infrastructure</strong> Technology Conference<br />
7-8 June 2011, Vistana Hotel, Penang, Malaysia<br />
UHPC is at least 20 times more impermeable in comparison to conventional concrete. Although, the<br />
steel fibers at the surface of the concrete will rust <strong>and</strong> exp<strong>and</strong> 30% of its original volume; however,<br />
due to the small size of the steel fibers, this increased volume due to the expansion will not produce<br />
adequate internal expansive stress to spall the contiguous ultra high strength concrete. Since rusting,<br />
i.e. iron oxide is water insoluble <strong>and</strong> does not conduct electricity; therefore rusting of steel fibers will<br />
stop further than the depth of the surface rust zone <strong>and</strong> will not develop further because oxygen,<br />
moisture <strong>and</strong> chloride ions are not able to penetrate deeper into the concrete. Hence, at serviceability<br />
conditions, the possibility of rusting of the internal steel fibers is insignificant (Dura Technology Sdn.<br />
Bhd. n.d.).<br />
8. ADVANTAGES OF USING UHPC<br />
Based on extraordinary characteristics of UHPC <strong>and</strong> as a new generation of sustainable construction<br />
material it offers remarkable benefits. For instance, using UHPC will result in elimination of the use of<br />
conventional steel reinforcement bars <strong>and</strong> stirrups which needs a considerable amount of human<br />
labors, supervision <strong>and</strong> quality control. Therefore, in terms of construction management, the<br />
construction time <strong>and</strong> labor costs may also be drastically reduced, which will result in saving<br />
immediate project costs. In addition, it will lead to save considerable maintenance costs <strong>and</strong> also longterm<br />
service costs (Voo & Foster 2009).<br />
Secondly, with using UHPC designers will have flexibility <strong>and</strong> freedom of innovative design which<br />
enables design of more interesting <strong>and</strong> aesthetically expressive concrete structures due to the<br />
absence of conventional reinforcement <strong>and</strong> the self-heating potential after cracking of UHPC. Also,<br />
UHPC elements are ultra-light weight, typically by a factor of two, in comparison to conventional<br />
reinforced concrete or prestressed concrete elements, which leads the ease in h<strong>and</strong>ling, transportation<br />
<strong>and</strong> installation. As a consequence, it will lead to additional cost savings <strong>and</strong> develop safety margins in<br />
the construction procedures. Besides, UHPC offers excellent durability, with high impermeability<br />
against physical <strong>and</strong> chemical aggressive environment, high resistance to corrosion, abrasion <strong>and</strong><br />
impact loads which will result longer service-life, minor maintenance <strong>and</strong> contribute to the sustainable<br />
development concept (Dura Technology Sdn. Bhd. n.d.).<br />
In terms of structural design, concerning long-term behavior, UHPC demonstrates remarkable<br />
characteristics such as low creep <strong>and</strong> shrinkage which enables the elimination of most of the design<br />
considerations associated with time dependent strains (Voo & Foster 2009; Cheyrezy 1999; Rechard<br />
& Cheyrezy 1995)<br />
9. FEATURES OF UHPC PRODUCTS<br />
Based on the material characteristics of UHPC, products made from UHPC are supposed to have the<br />
following features:<br />
9.1 Aesthetic<br />
In terms of aesthetic, based on the elimination of coarse aggregates, superior homogeneity <strong>and</strong><br />
granular packing distribution of the UHPC matrix, products made from UHPC are capable of achieving<br />
extraordinary finished surface in comparison to conventional concrete. Painting or coating is also not<br />
essential as the natural fair-face concrete finish will maintain its properties over time.<br />
9.2 Workability<br />
In regard to workability, with using UHPC, a water-binder ratio of 0.13 is possible. In order to have<br />
adequate flowability, an ultra high-range superplasticizer is used, which leads UHPC products behave<br />
like self-consolidating concrete. Some experts even refer to this as "liquid stone". This characteristic<br />
enables the opportunity of casting very slender elements.<br />
9.3 Durability<br />
Concerning durability, UHPC is a very impenetrable material with very small <strong>and</strong> discontinuous pores<br />
which avoid the movement of vapors within the concrete matrix. In another words, impermeability of
363<br />
International <strong>Building</strong> & <strong>Infrastructure</strong> Technology Conference<br />
7-8 June 2011, Vistana Hotel, Penang, Malaysia<br />
UHPC is less than one-tenth of conventional concrete. This chemical <strong>and</strong> physical composition results<br />
in a dense matrix with corrosion resistance greater than granite. Therefore, UHPC products are highly<br />
resistant to weathering, chemical attack, hydraulic scouring <strong>and</strong> salt-water entrance. Hence, coating or<br />
painting is not essential.<br />
9.4 Ductility<br />
Regarding ductility, the use of ultra-high strength steel fibers gives UHPC the flexural toughness<br />
property equivalent to structural steel. The flexural strength at first crack varies from 10 to 12 MPa,<br />
while ultimate flexural strength of 15 to 35 MPa can be reached. Experimental studies illustrate that<br />
the crack widths are not more than 0.05mm <strong>and</strong> 0.5mm at serviceability <strong>and</strong> ultimate limit states<br />
respectively. Besides, no fiber fracture has been observed at any stage of cracking.<br />
9.5 Engineering maximization<br />
In the matter of engineering maximization, unique material characteristics of UHPC facilitate the<br />
possibility of designing innovative structures, such as creating structures with longer span, <strong>and</strong><br />
irregular shapes which are thin <strong>and</strong> slender, light <strong>and</strong> with more pleasing view. Experts believe that<br />
with using UHPC technology in well designed <strong>and</strong> planned projects not only would lead to exceptional<br />
service life for 200 years or more, also would bring at least 70% discounts on the total life-cycle costs.<br />
9.6 Sustainability<br />
On the subject of sustainability, UHPC technology is a green technology which supports the visionary<br />
of sustainable development. In another words, using UHPC enables using less cement in the concrete<br />
<strong>and</strong> using less concrete in the products. According to shocking reports of many scientists worldwide,<br />
Global Warming is the most destructive problem which people encounter nowadays. Hence, with using<br />
UHPC some preliminary saving in terms of cost, lower energy consumption <strong>and</strong> waste emissions can<br />
be achieved in comparison to conventional concrete. In addition, in terms of life-cycle, its sustainability<br />
is even more considerable than others types of concrete (Dura Technology Sdn. Bhd. n.d.).<br />
10. COMMERCIAL UHPC BLENDS<br />
Within the last two decades, significant research projects had been conducted by the academics <strong>and</strong><br />
engineers around the world in order to industrialize UHPC technology as an alternative construction<br />
material that supports the concept of sustainable development (Voo & Poon 2009). As a consequence,<br />
so far there are five commercial UHPC blends in the world as shown in table 3<br />
Table 3. Commercial UHPC blends<br />
UHPC<br />
Blends<br />
Established Date Established Place<br />
DensitD ® Developed in 1960’s Denmark (Grout)<br />
Ductal ® mid1990’s-current France, license to Canada,<br />
Australia, Japan, Europe, USA<br />
Ceracem ® 2000-current France, Swiss<br />
Ducon ® 2004-current Germany<br />
Dura ® 2006-current 100% Malaysian owned<br />
11. Evolution <strong>and</strong> application of UHPC<br />
The first ultra high performance cementitious mortar recognized as Reactive Powder Concrete (RPC)<br />
was founded in the mid 1990’s, with concrete compressive strengths greater than 200 MPa. The first<br />
RPC filled steel tube composite footbridge in the world was built at Sherbrooke in Canada in 1997<br />
(Adeline et al. 1998). Also, the first fully RPC footbridge spanning 120 meters in the world was<br />
constructed in Seoul, South Korea in 2002 (Deem 2002). In Australia, the first RPC highway bridge at
364<br />
International <strong>Building</strong> & <strong>Infrastructure</strong> Technology Conference<br />
7-8 June 2011, Vistana Hotel, Penang, Malaysia<br />
Shepherds Gully Creek was designed by VSL (Australia), <strong>and</strong> was inaugurated to traffic in 2005 (Cavill<br />
& Chirgwin 2003) (Voo & Foster 2009). Figure 1 (Dura Technology Sdn. Bhd. n.d.) presents a<br />
schematic drawing showing the evolution of UHPC technology.<br />
Accomplished projects using UHPC such as Sherbrooke footbridge (in Canada in 1997), Seonyu<br />
footbridge (in South Korea in 2002), Bourg-Les-Valence Bridge (in France), <strong>and</strong> Shepherds Gully<br />
Creek Bridge (in Australia in 2005) emphasize the possible applications of UHPC in civil <strong>and</strong> infrastructural<br />
projects (Voo & Foster 2009).<br />
In terms of durability, low <strong>and</strong> non-continuous porosity of UHPC with minimum mass transfer will result<br />
in almost negligible penetration of liquid, gas or radioactive elements. Improved durability <strong>and</strong> abrasion<br />
resistance of UHPC in comparison to conventional <strong>and</strong> high strength concrete makes UHPC as a<br />
unique material suitable for the storage of nuclear waste or other dangerous materials (Voo & Foster<br />
2009; Matte & Moranville 1999; Torrenti et al. 1996; Rechard & Cheyrezy 1995)<br />
Figure 1. Evolution of UHPC Technology<br />
The exceptional properties of UHPC make it a distinctive sustainable material capable to use in a<br />
broad variety of structural <strong>and</strong> non-structural applications because of its superior strength <strong>and</strong> high<br />
durability in terms of corrosion protection in aggressive environments (Voo & Foster 2009; Matte &<br />
Moranville 1999; Roux et al. 1996; Torrenti et al. 1996; Rechard & Cheyrezy 1995).<br />
UHPC as a new generation of ultra-high performance sustainable construction material can be used in<br />
the fabrication of precast elements for civil engineering, structural <strong>and</strong> architectural applications (Voo<br />
<strong>and</strong> Poon, 2009). The application of UHPC can be classified into the following categories: 1-Infrastructural<br />
application such as ultra-light <strong>and</strong> slender section for pedestrian <strong>and</strong> highway bridges. 2-<br />
Impact resistance structures such as security panel against impact, seismic <strong>and</strong> blast loads, crash<br />
safety barriers. 3-Prestressed elements such as piles, culverts, retaining walls, pipes, safety vaults<br />
<strong>and</strong> etc. 4-<strong>Building</strong> application such as ultra-slender beam, slab <strong>and</strong> column systems, long span floors<br />
<strong>and</strong> roofs. 5-Other application such as architectural features, acoustic barrier, structural walls,<br />
marine/sea walls <strong>and</strong> decks, anchorage plates, leave in-place forms/moulds, container, storage tanks<br />
(Dura Technology Sdn. Bhd. n.d.).<br />
12. CONCLUSIONS<br />
During the last two decades incredible development had been made in concrete technology. One of<br />
the major progresses in 21st century is the development of a new generation of highly cementitious<br />
based composite material known as Ultra-High Performance Concrete (UHPC) with compressive<br />
strength over 150 MPa <strong>and</strong> flexural strength over 30 MPa <strong>and</strong> remarkably improvement in durability<br />
similar to natural rocks. Even though lots of research regarding the material characteristics <strong>and</strong>
365<br />
International <strong>Building</strong> & <strong>Infrastructure</strong> Technology Conference<br />
7-8 June 2011, Vistana Hotel, Penang, Malaysia<br />
application of UHPC has been done so far; however, there is a need for future research <strong>and</strong><br />
development in order to lead to the ordinary application of UHPC based on comprehensive technical<br />
regulations<br />
REFERENCES<br />
Adeline, R, lachemi, M & Blais, P (1998) ‘Design <strong>and</strong> behavior of the Sherbrooke Footbridge’,<br />
Proceedings of the International Symposium on High-Performance <strong>and</strong> Reactive Powder Concretes,<br />
editors Actin, PC & Delagrave, Y, Sherbrooke, Canada, Vol. 3, pp. 89-98.<br />
Bonneau, O, Lachemi, M, Dallaire, E, Dugat, J & Aïtcin, PC (1997) ‘Mechanical properties <strong>and</strong><br />
durability of two industrial reactive powder concretes’, ACI Materials Journal, vol. 94, no. 4, pp. 286–<br />
290.<br />
Cavill, B, & Chirgwin, G (2003) ‘The world’s First RPC Road Bridge at Shepherds Gully Creek, NSW’,<br />
21 st Biennial Conference of the Concrete Institute of Australia (CIA), NSW, Australia, pp. 89-98.<br />
Cheyrezy, M (1999) ‘Structural application of RPC’, Concrete, vol. 33, no. 1, pp. 20-23.<br />
Deem, S (2002) Concrete Attraction-Something New on the French Menu-Concrete, viewed 10 June<br />
2009, .<br />
Dura Technology Sdn. Bhd. n.d., Discover UHPC, viewed 10 February 2010,<br />
.<br />
Dura Technology Sdn. Bhd. n.d., DURA UHPdC, viewed 10 February 2010,<br />
.<br />
Dura Technology Sdn. Bhd. n.d., Frequent Asked Question, viewed 10 February 2010, <<br />
http://www.dura.com.my>.<br />
Gilbert, RI, Gowripalan, N & Cavill, B (2000) ‘On the Design of Precast, Prestressed Reactive Powder<br />
Concrete (Ductal) Girders’, Proceedings of 4 th Austroads Bridge Engineering Conference, Adelaide,<br />
Australia, vol. 3, pp. 313-324.<br />
Gowripalan, N, Dumitru, I, Smorchevsky, G, Marks, R & D’Souza, B (2000) ‘Development of Modified<br />
RPC for Precast Concrete Applications in Australia’, Proceedings of the 19 th Biennial Conference of<br />
the Concrete Institute of Australia, Sydney, Australia, pp. 105-112.<br />
Graybeal, BA (2006) Material Property Characterization of Ultra-High Performance Concrete, report<br />
no. FHWA-HRT-06-103, US Federal Highway Administration, McLean, VA, USA, viewed 4 March<br />
2010, .<br />
Graybeal, BA (2006) Structural Behavior of Ultra-High Performance Concrete Prestressed I-Girders,<br />
report no. FHWA–HRT–06–115, US Federal Highway Administration, McLean, VA, USA, viewed 10<br />
April 2010,.<br />
Graybeal, B. A & Tanesi, J (2007) ‘Durability of an Ultra high-Performance Concrete’, Journal of<br />
Materials in Civil Engineering, vol. 19, no. 10, pp. 848-854.<br />
JSCE (2006) Recommendations for design <strong>and</strong> construction of ultra high strength fiber reinforced<br />
concrete structures (Draft), Concrete Committee of Japan Society of Civil Engineers (JSCE), JSCE<br />
Guideline for Concrete, Japan.<br />
Matte, V, & Moranville, M (1999) ‘Durability of Reactive Powder Concrete: Influence of Silica Fume on<br />
the Leaching Properties of very Low Water/Binder Pastes’ Cement <strong>and</strong> Concrete Composite, vol. 21,<br />
no. 1, pp. 1-9.<br />
Richard, P & Cheyrezy, MH (1995) ‘Composition of reactive powder concretes’, Cement <strong>and</strong> Concrete<br />
Research, vol. 25, no. 7, pp. 1501-1511, viewed 20 June 2010, .<br />
Roux, N, Andrade, C & Sanjuan, M (1996) ‘Experimental study of durability of reactive powder<br />
concretes’, Journal of Material in Civil Engineering, vol. 8, no. 1, pp. 1-6.<br />
Schmidt, M, Fehling, E & Geisenhanslüke, C (eds) (2004) Proceedings of the International Symposium<br />
on Ultra High Performance Concrete, Kassel university press, Kassel, Germany.
366<br />
International <strong>Building</strong> & <strong>Infrastructure</strong> Technology Conference<br />
7-8 June 2011, Vistana Hotel, Penang, Malaysia<br />
Torrenti, JM, Matte, V, Maret, V & Richet, C (2005) ‘High Integrity Containers for Interim Storage of<br />
Nuclear Wastes Using Reactive Powder Concrete’, 4 th International Symposium on Utilization of High<br />
strength/High Performance Concrete, Paris (2005), Editors: F. de Larrard <strong>and</strong> R. Lacroix, Press de<br />
l’Ecole Naturale des Ponts et Chaussees, Vol.3, Paris, pp. 1407-1413.<br />
Victor, YG, Lawrence, FK & Kimberly, EK (2009) ‘Short-term tensile creep <strong>and</strong> shrinkage of ultra-high<br />
performance concrete’, Cement & Concrete Composites, vol. 31, pp. 147-152, viewed 14 June 2010,<br />
.<br />
Voo, YL & Foster, SJ (2009) Reactive powder concrete: analysis <strong>and</strong> design of RPC girders, Lambert<br />
Academic Publishing, Germany.<br />
Voo, YL & Foster, SJ (2010) ‘Characteristics of ultra-high performance 'ductile' concrete <strong>and</strong> its impact<br />
on sustainable construction’, The IES Journal Part A: Civil & Structural Engineering. vol. 3, no. 3, pp.<br />
168–187, viewed 14 October 2010, .<br />
Voo, YL & Poon, WK (2009) ‘Ultra High Performance ductile Concrete (UHPdC) For Bridge<br />
Engineering’, paper presented to the Conference <strong>and</strong> Exhibition on Bridge Engineering, Kuala<br />
Lumpur, November 2009.
T191<br />
367<br />
International <strong>Building</strong> & <strong>Infrastructure</strong> Technology Conference<br />
7-8 June 2011, Vistana Hotel, Penang, Malaysia<br />
RELATIONSHIP BETWEEN ROADSIDE DEVELOPMENTS AND ROAD TRAFFIC<br />
ACCIDENTS<br />
Intan Suhana Mohd Razelan 1 , Adnan Zulkiple 2 <strong>and</strong> Azlina Ismail 3<br />
1,2,3 Faculty of Civil Engineering <strong>and</strong> Earth Resources, Universiti Malaysia Pahang, 26300,<br />
Lebuhraya Tun Razak, Pahang, Malaysia<br />
1 intan@ump.edu.my, 2 adnanz@ump.edu.my , 3 azlinai@ump.edu.my<br />
ABSTRACT: Studies on the causes of traffic accidents that focus on the driver’s carelessness, road<br />
physical conditions <strong>and</strong> vehicle faultiness had been carried out extensively by the local authorities <strong>and</strong><br />
researchers. While accepting human behaviours as one of the traffic accidents causes, other factor<br />
such as the mismanaged of roadside area should not be set aside. This study intends to explore the<br />
relationship between rapid roadside development growth <strong>and</strong> number of accident cases along Federal<br />
Road 2, Jalan Kuantan-Gambang which is one of the gateways to Kuantan town. The research area<br />
covers of 24 kilometer stretch road where most of the roadside areas are residential areas, business<br />
areas <strong>and</strong> educational institutions. It is dual-carriageway roads which experiences a heavy traffic<br />
movement <strong>and</strong> consequently has recorded a high number of accidents from year to year. Based on<br />
these analyses, models are developed to represent the relationship between roadside developments<br />
<strong>and</strong> accident cases. In conclusion, it is proven that roadside development does have a positive<br />
relationship with an increased in number of accident cases along the studied area.<br />
Keywords: road safety, Federal Road, roadside development<br />
1. INTRODUCTION<br />
In year 2004, a total of 6,223 road fatalities recorded in Malaysia were caused by accidents part of<br />
which Pahang state recorded 445 cases. The major contributor was from cars <strong>and</strong> motorcycles with<br />
69.8% out of total vehicles involved in road accidents.<br />
Every year road <strong>and</strong> transportation agencies as well as local authorities have conducted a lot of<br />
awareness programs which involved the analysis of roadside feature as one of the methods in<br />
preventing accidents. As a result, from year 1990 to 2004, the number of accidents with fatalities has<br />
decreased from 4.6% in year 1990 to only 1.8% in year 2004.<br />
In Pahang State, total road accident rates showed a tremendous increase with 5,140 accidents cases<br />
in year 1994 to 13,349 cases in year 2004. This 160% increase mainly involved cars <strong>and</strong> motorcycles.<br />
These accidents normally occurred at certain sections of the road <strong>and</strong> this trend remained the same<br />
for five consecutive years starting from the year 2000 to 2005.<br />
In most cases, accidents occurred due to a number of reasons such as drivers’ fault, vehicle<br />
mechanical failure, road physical condition, the environment <strong>and</strong> weather condition (Kowtanapanich,<br />
2005). About 90% of the accidents were blamed on drivers’ fault which is an easy way out of the<br />
traumatic problem. The balance of 10% was shared by vehicle mechanical failure, road physical<br />
condition, the environment <strong>and</strong> weather condition. Vehicle manufacturers in particular those producing<br />
cars <strong>and</strong> motorcycles were developing better vehicle with improved safety features such as antilock<br />
brake system (ABS) that could minimized skidding incidents <strong>and</strong> safety bags that could prevent<br />
fatalities during accidents.<br />
The Government was also committed to focus on enforcing traffic management regulations such as<br />
reduction of vehicle operating speed by 10 km/h on the expressways <strong>and</strong> the highways. In addition to<br />
that, frequent surveillance by traffic police <strong>and</strong> road transport department officers was also conducted<br />
in the efforts to prevent reckless driving on the road. Road physical conditions were maintained<br />
through scheduled pavement resurfacing <strong>and</strong> improvement of the hazardous road sections, for
368<br />
International <strong>Building</strong> & <strong>Infrastructure</strong> Technology Conference<br />
7-8 June 2011, Vistana Hotel, Penang, Malaysia<br />
example by increasing the sight distance on the sharp corners <strong>and</strong> geometrically steep gradients road<br />
sections.<br />
Although various awareness programs have been introduced, however road accidents cases remain<br />
the same <strong>and</strong> surprisingly, the number of accident cases kept on increasing from year to year. This<br />
trend was believed to be contributed by other factors <strong>and</strong> one of them is an inefficient management of<br />
roadside area.<br />
Combining the State of Pahang’s accidents database obtained from Malaysian Royal Police (PDRM)<br />
<strong>and</strong> Kuantan development data from Kuantan Municipal Council (MPK), an initial study to examine the<br />
relationship between roadside development <strong>and</strong> accident rates focusing on Jalan Kuantan-Gambang<br />
was initiated.<br />
2. ISSUES ON UNCONTROLLED ROADSIDE DEVELOPMENT<br />
Roads in Malaysia can be classified according to its functions or jurisdictions. By functions, roads can<br />
be classified as primary, secondary <strong>and</strong> minor roads. By jurisdiction, roads can be classified as Toll<br />
Expressway, Highway, Federal, State <strong>and</strong> Municipal roads. Roads may also be classified as rural <strong>and</strong><br />
urban. Rural roads are roads outside the Municipality limits or if it is located 5 km away from the<br />
Municipality limits (A Guide on Geometric Design of Road, REAM, 2006).<br />
Otherwise, it is defined as urban roads that comprise of all roads within the gazette of the Municipality<br />
having a population of 10,000 <strong>and</strong> above. Accessibility from/to the roads is through proper channel<br />
such as junctions. There are two categories of access junction which is major <strong>and</strong> minor access. A<br />
major access is a properly designed junction catering all required traffic turning movements. Often<br />
these types of junction are signalized particularly if it is located along a Federal Routes.<br />
A minor access in form of ingress/egress <strong>and</strong> it is the lowest category of junctions that prohibit all<br />
types of right turning movements. As such, traffic will have to travel for about few kilometers before<br />
reaching the nearest u-turns or the signalized junction where u-turns is normally provided. This form of<br />
access causes the local traffic in particular motorcyclists to disobey the road’s regulations since they<br />
can make the u-turn at undesignated location which is convenience to them.<br />
Moreover, the motorcyclists are seem to go against the traffic flow (run-off the roadway) on the<br />
unpaved pedestrian walkway <strong>and</strong> more daring they use the outer lane endangering the other vehicle<br />
that flow in the opposite direction. This behaviour is the likely cause of run-off roadway accident as<br />
indicated by Lee <strong>and</strong> Mannering (2000). Run-off roadway accident severity is a complex interaction of<br />
the vehicle with roadside features such as the guardrails, fixed objects, signboards, trees <strong>and</strong> utility<br />
poles along the road (Lee <strong>and</strong> Mannering, 2000).<br />
3. METHODOLOGY<br />
3.1 Background of Study Area<br />
The proposed study area, Jalan Kuantan-Gambang was chosen as the study area after an intensive<br />
investigation on the road features were made in every possible aspect particularly on the level of<br />
safety of the route. Jalan Kuantan- Gambang that is forming part of Federal Route 2, falls under the<br />
category of rural <strong>and</strong> primary road when it was first constructed. As a primary road it functions as a<br />
major road, forms the backbone of the road network for the State of Pahang.<br />
Before the opening of the East Coast Expressway, Jalan Kuantan-Gambang was the only route to<br />
cater for Kuantan – Gambang corridor. It was upgraded from single lane road to dual 2-lane<br />
carriageway in mid 90’s. Since then, many residential developments have taken place along with<br />
business, shops, schools <strong>and</strong> shopping zones. The traffic flow also increased gradually with the<br />
increase in population along the roadside. At present, with similar road features in terms of speed<br />
limits <strong>and</strong> geometric design, the road has now becoming less effective to cater for the current needs of<br />
the road users. Figure 1 below shows the location of study area within Kuantan District.
Gambang<br />
Exit to LPT<br />
The Study Area<br />
369<br />
International <strong>Building</strong> & <strong>Infrastructure</strong> Technology Conference<br />
7-8 June 2011, Vistana Hotel, Penang, Malaysia<br />
Figure 1. Location of Study Area (Kuantan-Gambang road)<br />
As shown in Figure 1, the study area which is part of Jalan Kuantan-Gambang consists of 24 kilometre<br />
long 2-lane dual carriageway road connecting the 3-legged signalised junction at Jalan Wong Ah Jang<br />
<strong>and</strong> the 4-legged signalised junction at Jalan Muadzam Shah / access road to East Coast<br />
Expressway. This road is also connected to Jalan Kuantan-Pekan at KM 8 <strong>and</strong> Jalan Kuantan<br />
Kemaman at KM 14. As shows in figure 2, it is clearly explains that the traffic flow catered by Jalan<br />
Kuantan-Gambang is relatively heavy <strong>and</strong> becoming much heavier in festive seasons.<br />
Figure 2. Illustration of the existing Traffic Management along Federal Route 2 (Jalan Kuantan -<br />
Gambang)<br />
3.2 Road Accident Data<br />
Road accident data consisted details on the number of traffic accidents as reported to PDRM who kept<br />
the state-wide databases on traffic accidents occurred at all major roads in Pahang. The police report<br />
contains information on the number of traffic accidents happened on these roads for the whole year.<br />
Number of traffic accidents were defined as all type of accidents occurred along Jalan Kuantan-<br />
Gambang that caused death, injuries <strong>and</strong> damages (properties <strong>and</strong> facilities). In certain aspects, the<br />
number of traffic accidents was grouped in year to year basis <strong>and</strong> in other instance the number of<br />
traffic accidents was classified according to section by section basis. After all traffic accidents data<br />
were collected, the data were interpreted according to the needs <strong>and</strong> objectives of this study. For the
370<br />
International <strong>Building</strong> & <strong>Infrastructure</strong> Technology Conference<br />
7-8 June 2011, Vistana Hotel, Penang, Malaysia<br />
purpose of this study, only relevant data that suited the needs of the study were extracted from the<br />
records.<br />
The analysis considered only:a.<br />
Accidents that happened from KM 3 to KM 27 of the study route.<br />
b. Accidents happened on the residential area streets, roundabout areas, flyovers, factory areas <strong>and</strong><br />
at the alternative route were not counted as the valid number of traffic accidents.<br />
c. Police records without specifying the accident location were discarded from the datasets.<br />
3.3 Roadside Features Data<br />
Roadside features data in this study was categorised as datasets that was indirectly related to the<br />
intensity of developments along the study route. The inventory of roadside facilities available within the<br />
roadside areas (edge of roadway to the beginning of adjacent l<strong>and</strong>) was carried out to sort datasets for<br />
three roadside feature attributes mentioned above (rate of development, number of roadside facilities<br />
<strong>and</strong> number of access). The data were then enriched with Geographical Information System (GIS)<br />
data provided by Kuantan Municipal Council that comprised the essential digital maps.<br />
Most roadside features data have a strong association with type of l<strong>and</strong> use on the roadside areas <strong>and</strong><br />
significantly had a great impact on the number of traffic accidents as pointed out by Eckhardt, N. <strong>and</strong><br />
Thomas, I. (2004). The GIS data provides us with the information on the current population of the<br />
study area, location of the main road as well as the local roads.<br />
3.4 Roadside Developments Data<br />
The attribute by rate of development along the study route was referred to the index of development at<br />
the roadside area for every section. The index of development was presented in terms of percentage<br />
of developed l<strong>and</strong> against the total l<strong>and</strong> area. Higher percentage value meant to represent highly<br />
developed areas while low percentage value meant to represent less developed areas.<br />
The attribute by roadside facilities along the study route was referred to the existence of various<br />
facilities such as guardrail, trees in groups, utility poles, street lighting <strong>and</strong> big advertisement boards<br />
within the roadside areas for every section. In each section, for each items exists it was marked as<br />
one, if all these five features exists in that section, the roadside facilities for that section were counted<br />
as 5. At the end of the observation, a table consisted of number of roadside facilities existed in every<br />
section were produced.<br />
The attribute by number of access along the study route was referred to the number of paved<br />
unsignalized junctions i.e. access to/from residential area, shop lots <strong>and</strong> schools. Higher number of<br />
accesses <strong>and</strong> paralell roads would lead to heavy traffic flows <strong>and</strong> consequently higher risk of traffic<br />
accidents as suggested by Greibe, P. (2003).<br />
Population was chosen as one of the roadside development attributes since it directly related to the<br />
development impact along the study routes. Roadside areas along the study route had experienced<br />
significant increase in population in particular attraction from business activities <strong>and</strong> generation from<br />
residential development. The estimation for population was made by focusing on the populated area or<br />
residential areas where their access roads were directly connected to the study route.<br />
Traffic volume was chosen as one of the roadside development attributes since it also directly related<br />
to the development impact along the study routes in similar fashion as of population data. In some<br />
cases, traffic might not only generate from the study area l<strong>and</strong> development but also from outside of<br />
the study route especially during festive seasons. For instance, Section 7 which consisted of<br />
undeveloped l<strong>and</strong> was still recorded a high number of traffic accident contributed by the through traffic.<br />
Sources of data were obtained from Traffic Volume Malaysia by Highway Planning Units (HPU) at the<br />
following traffic counting station:a.<br />
Station CR 403 ( KM 23.3 of the study route )<br />
b. Station CR 404 ( KM 8.1 of the study route )<br />
Based on reported traffic volume at this two counting stations, traffic volume for year 2000 until year<br />
2005 in every section were then estimated using the yearly traffic growth factor.
4. DATA ANALYSIS<br />
371<br />
International <strong>Building</strong> & <strong>Infrastructure</strong> Technology Conference<br />
7-8 June 2011, Vistana Hotel, Penang, Malaysia<br />
4.1 Road Accident Analysis<br />
Traffic accidents data for the 24 kilometres route of Jalan Kuantan-Gambang starting from KM 3 <strong>and</strong><br />
ending at KM 27 were collected, interpreted <strong>and</strong> processed in eight similar sections (three kilometres<br />
interval).<br />
Table 1. Summary of Number of Traffic Accidents by Section (Year 2000 – 2005)<br />
2000 2001 2002 2003 2004 2005 Total<br />
Section 1 11 13 9 10 19 6 68<br />
Section 2 9 3 6 6 9 6 39<br />
Section 3 9 11 8 3 8 10 49<br />
Section 4 6 10 10 13 9 5 53<br />
Section 5 3 6 6 9 12 5 41<br />
Section 6 4 5 3 5 13 5 35<br />
Section 7 3 3 3 13 2 2 26<br />
Section 8 3 2 8 8 13 8 42<br />
Total 48 53 53 67 85 47 353<br />
With reference to Table 1, an average of 14.7 numbers of traffic accidents per kilometer in six year<br />
period or 2.5 numbers of traffic accidents / kilometer / year was recorded for the study route. Many<br />
factors contributed to high number of traffic accidents <strong>and</strong> one of this was the effect of roadside<br />
development along the study route.<br />
4.2 Relationship between Roadside Development <strong>and</strong> Number of Traffic Accidents<br />
Equation 1 represented the linear multiple regression for measuring the effect of roadside<br />
development to number of traffic accidents.<br />
Y1 = α + β1x1 + β2x2 + β3x3<br />
Where;<br />
(1)<br />
Y1 = Traffic Accidents (Numbers)<br />
ß, α1 = Parameters determined through regression analysis<br />
x1 = Population (Persons)<br />
x2 = Traffic Volume ( vehicle / day )<br />
x3 = Rate of Development ( % )<br />
The results of the multiple regression analysis were as per Table 2 below.<br />
Table 2: Results of Multiple Regression Analysis between Roadside Development <strong>and</strong> Number of<br />
Traffic Accidents<br />
Parameters Results<br />
St<strong>and</strong>ard Deviation 10.303<br />
Multiple Correlation, R 2 0.623<br />
As shown in Table 2, the st<strong>and</strong>ard deviation of this model was lower than the value of the simple<br />
regression model obtained earlier with lower number of variables (st<strong>and</strong>ard deviation value: 15),<br />
indicating that the variations amongst data were minimized. More importantly, the R 2 value of 0.623 for<br />
this multiple regression was much higher than that of the simple linear model (R 2 value: 0.137)<br />
indicating that the model had improved with the inclusion of two more variables.
372<br />
International <strong>Building</strong> & <strong>Infrastructure</strong> Technology Conference<br />
7-8 June 2011, Vistana Hotel, Penang, Malaysia<br />
Multiple linear model derived to predict number of traffic accidents using coefficients obtained from the<br />
analysis was presented as below;<br />
Y1 = 24.952 - 0.003x1 - 0.0002x2 + 0.633x3<br />
Where,<br />
(2)<br />
Y1 = Traffic Accidents (Numbers)<br />
x1 = Population (persons)<br />
x2 = Traffic Volume (vehicle / day)<br />
x3 = Rate of Developments (%)<br />
The model obtained could be used to measure the effect of roadside development on number of traffic<br />
accidents not only within the study area but also to other areas.<br />
However, applications to other study areas required prior works to study the patterns of traffic<br />
accidents as pre-requisite for providing supporting evidences to the results of the model.<br />
5. CONCLUSIONS<br />
In the first phase of the study, the investigation of the traffic accidents data between year 2000 to 2005<br />
showed that traffic accidents within those periods were able to be controlled since the number of traffic<br />
accidents for the study route in year 2000 <strong>and</strong> year 2005 was almost the same.<br />
Main objective of this research are to determine the relationship between roadside developments <strong>and</strong><br />
number of accident cases along the study route. With these findings, the investigation on the effect of<br />
roadside developments on the number of traffic accidents was narrowed down for the year 2005 only.<br />
For a simple linear model, number of traffic accidents was best estimated by the population data.<br />
However, the R 2 that represent the reliability of the model is too low (R 2 = 0.137). As such, a multiple<br />
linear model is developed by combining the population, traffic volume <strong>and</strong> rate of development as the<br />
independent variables.<br />
As a result, this model that gave R 2 of 0.657 improved the reliability of the estimated significantly.<br />
Therefore, it was recommended that the multiple model to be used for estimating number of traffic<br />
accident for the study route.<br />
REFERENCES<br />
Kowtanapanich, W., Tanaboriboon, Y., Chadbunchachai, W., 2005. Applying Public Participation<br />
Approach to Black Spot Identification Process – A Case Study in Thail<strong>and</strong>. IATSS Research, Vol.30<br />
No.1<br />
Lee, J. <strong>and</strong> Mannering, F., 2000. Impact of roadside feature on the frequency <strong>and</strong> severity of run-off<br />
roadway accidents: an empirical analysis. Accident Analysis <strong>and</strong> Prevention (34), pp. 149-161<br />
Jovic, A.V., Kern, J. <strong>and</strong> Biloglav, Z., 2005. Risk Factors in Urban Road Traffic Accidents. Journal of<br />
Safety Research (37), pp. 93 – 98<br />
Horberry, T. <strong>and</strong> Anderson, J. et al., 2005. Driver’s Distraction: The Effects of Concurrent in-Vehicle<br />
Tasks, Road Environment Complexity <strong>and</strong> Age on Driving Performance. Accident Analysis <strong>and</strong><br />
Prevention (38) pp. 185-191.<br />
Eckhardt, N. <strong>and</strong> Thomas, I., 2004. Spatial Nested Scales for Road Accidents in the Periphery of<br />
Brussels. IATSS Research Vol.29 No. 1<br />
Greibe, P., 2003. Accident Prediction Models for Urban Roads. Accident Analysis <strong>and</strong> Prevention<br />
(35), pp. 273-385<br />
Hussain, H., Radin Umar, R.S., Ahmad Farhan, M.S. <strong>and</strong> Dadang, M.M., 2004. Key Components of a<br />
Motorcycle Traffic System – A study along motorcycle path in Malaysia. IATSS Research, Vol.29, No.1
T192<br />
373<br />
International <strong>Building</strong> & <strong>Infrastructure</strong> Technology Conference<br />
7-8 June 2011, Vistana Hotel, Penang, Malaysia<br />
THE ENGINEERING PERFORMANCE OF SUPERPLASTICIZED CONCRETE<br />
Noor Faisal Abas 1 <strong>and</strong> Muhammad Naim Mahyuddin 2<br />
1,2 Universiti Sains Malaysia, Pulau Pinang, Malaysia<br />
1 nfaisal@usm.my<br />
ABSTRACT: Superplasticizers are used for the improving workability <strong>and</strong> reducing the water to<br />
cement ratio. The presence of superplasticizers in a concrete mixture is quite advantageous, in that<br />
they assist in the effective dispersion of cement particles <strong>and</strong> hence improving the workability of<br />
concrete. The purpose of this research study is to examine <strong>and</strong> study the influence of engineering<br />
performance of superplasticized concrete with a different percentage added. The types of<br />
superplasticizer that are going to be tested are the Conplast SP1000 which consists of sulphonated<br />
naphthalene polymers. Conplast SP1000 disperses the fine particles in the concrete mix, enabling the<br />
water content of the concrete to perform more effectively. Three different percentage of<br />
superplasticizer used are 1.75%, 2.25% <strong>and</strong> 3%. Every each percentage will reduce the quantity of<br />
water in the design mixture. Every specimen was tested on the duration of 7, 28 <strong>and</strong> 56 day with 3<br />
specimen cube <strong>and</strong> prism for every level.<br />
Keywords: superplasticizer, cement, concrete<br />
1. INTRODUCTION<br />
A superplasticizer is one of the admixtures which are widely used in concrete in increasing the<br />
performance of a concrete. Superplasticizers are playing an important role in the present development<br />
of ultrahigh-performance concrete. The new cement-based materials have a very low porosity, which<br />
is obtained by the addition in the formulation of very small reactive particles whose role is to fill the<br />
interstitial space between larger particles. This addition can lead to very dense, high strength,<br />
hardened materials. Another positive point of this addition is that the use of superplasticizers requires<br />
a small amount of water inside concrete mixture because only a small quantity of hydrates is<br />
necessary to bind together the dense stack of solid particles.<br />
In the nowadays of construction industry, it is imperative to have reinforced concrete structure made<br />
out of highly workable <strong>and</strong> durable concrete. The use of ordinary Portl<strong>and</strong> cement systems alone in<br />
severe environmental conditions may not be effective <strong>and</strong> cannot provide the solution in trying to<br />
produce high strength performance reinforced concrete. With that, adding an admixture is one of the<br />
solutions which not only increasing the workability of the concrete, but also increasing the durability,<br />
consistency <strong>and</strong> strength of the engineering performance of a reinforced concrete.<br />
Conplast SP1000 is a chloride free superplasticising admixture based on selected sulphonated<br />
naphthalene polymers. It is supplied as a brown solution which instantly disperses in water. Conplast<br />
SP1000 disperses the fine particles in the concrete mix, enabling the water content of the concrete to<br />
perform more effectively. The very high levels of water reduction possible allow major increases in<br />
strength to be obtained. The Conplast SP1000 st<strong>and</strong>ard complies with BS 5075 Part 3 <strong>and</strong> with ASTM<br />
C494 as Type F.<br />
The Conplast SP1000 is the superplasticizers that are use in this research where a different dosage<br />
percentage of this superplasticizer is used to see the performance, workability, durability <strong>and</strong> its fast<br />
reaction with the concrete mix. The Conplast SP1000 provide excellent acceleration of strength gain at<br />
early ages <strong>and</strong> major increases in strength at all ages by significantly reducing water dem<strong>and</strong> in a<br />
concrete mix. It’s also improve the workability of site mixed <strong>and</strong> precast concrete without increasing<br />
water dem<strong>and</strong> <strong>and</strong> also improved durability by increasing ultimate strengths <strong>and</strong> reducing concrete<br />
permeability.
374<br />
International <strong>Building</strong> & <strong>Infrastructure</strong> Technology Conference<br />
7-8 June 2011, Vistana Hotel, Penang, Malaysia<br />
For high strength, water reduced concrete the normal dosage range is from 0.80 to 2.20 liters/ 100kg<br />
of cementitious material, including PFA <strong>and</strong> microsilica. For high workability the normal dosage range<br />
is from0.80 to 1.50 liters/ 100kg of cementitious material.<br />
Advantages:<br />
i. Major increases in strength at early ages without increased cement contents are of particular<br />
benefit in precast concrete, allowing earlier stripping times.<br />
ii. Makes possible major reductions in water: cement ratio which allow the production of high<br />
strength concrete without excessive cement contents.<br />
iii. Use in production of flowing concrete permits easier construction with quicker placing <strong>and</strong><br />
compaction <strong>and</strong> reduced labour costs without increasing water contents.<br />
iv. Improved cohesion <strong>and</strong> particle dispersion minimizes segregation <strong>and</strong> bleeding <strong>and</strong> improves<br />
palpability.<br />
2. TYPES OF TESTS AND DESIGN MIX<br />
i. Types of Concrete Tests in This Research<br />
� Slump test<br />
� Density test<br />
� Compressive strength test<br />
� Flexural test<br />
� Ultrasonic Pulse Velocity test<br />
� Water absorption test<br />
� Oxygen permeability test<br />
ii. Design Mix Proposed<br />
Grade 50:<br />
� Target 50 + 10 = 60<br />
� Aggregate Size = 20 mm<br />
� w/c ratio = 0.44<br />
� Cement = 512 kg/m<br />
� Water = 210 kg/m<br />
� Density = 2400<br />
� Total Aggregate = 2400 – 512 – 210<br />
= 1678 kg/m<br />
Fine Aggregate = 35%<br />
35% x 1678 = 587<br />
Coarse Aggregate<br />
1678 – 587 = 1091
Table 1. Design Mix<br />
375<br />
International <strong>Building</strong> & <strong>Infrastructure</strong> Technology Conference<br />
7-8 June 2011, Vistana Hotel, Penang, Malaysia<br />
Mix Cement Water SP S<strong>and</strong> Aggregate<br />
Normal 512 kg/m 210 kg/m - 587 kg/m 1091 kg/m<br />
SP1 512 kg/m 210 kg/m 1.75% 587 kg/m 1091 kg/m<br />
SP2 512 kg/m 210 kg/m 2.25% 587 kg/m 1091 kg/m<br />
SP3 512 kg/m 210 kg/m 3% 587 kg/m 1091 kg/m<br />
Preparation Mixing:<br />
� Test for 7, 28 & 56 days<br />
� (9 x 0.001 ) + (9 x 0.005 ) + (0.15 x 0.024 ) = 0.0576<br />
Table 2. Mix Proportion<br />
Mix Cement Water SP S<strong>and</strong> Aggregate<br />
Normal 29 kg 12 kg - 34 kg 63 kg<br />
SP1 29 kg 12 kg 1.75% 34 kg 63 kg<br />
SP2 29 kg 12 kg 2.25% 34 kg 63 kg<br />
SP3 29 kg 12 kg 3% 34 kg 63 kg<br />
Admixture:<br />
Superplasticizer e.g:<br />
Cement x percentage of admixture<br />
� 29 kg x 1.75% = 500 gram<br />
� 29 kg x 2.25% = 650 gram<br />
� 29 kg x 3% = 870 gram<br />
3. RESULT ANALYSIS AND DISCUSSION<br />
3.1 Slump Test Result<br />
Figure 1. Weight of Water Used between Four Sample Specimens after Slump Test is done
376<br />
International <strong>Building</strong> & <strong>Infrastructure</strong> Technology Conference<br />
7-8 June 2011, Vistana Hotel, Penang, Malaysia<br />
Figure 2. Actual w/c Ratio to be used for Four Specimen Mix after the Weight of Water is divided by<br />
the Weight of Cement.<br />
From the result shown in the slump test analysis, 2.25% of superplaticizer used in concrete mix is one<br />
of the stable values which may reduce the use of water equally <strong>and</strong> at the same time increase the<br />
strength because of the workability which reacts in a great way in the concrete mixture. Although the<br />
3% of superplasticizer in concrete mix has reduced more water than the 2.25% of superplasticizer, but<br />
the main worried concern is on the strength of the concrete when it is tested. From this research,<br />
researcher has identified that the 3% of superplasticizer used in concrete mix has made an uneven<br />
mix between particles of cement, water <strong>and</strong> aggregate. When placing into the mould, the problems<br />
occurred when too much superplasticizer makes the concrete mixture bleed with overflow water <strong>and</strong><br />
drowning the aggregate further below the ground of the mould.<br />
3.2 Cube Density Test Result<br />
The bar chart concrete density of normal concrete, 1.75% <strong>and</strong> 3% superplasticized concrete shows<br />
the consistency of concrete density between 7 days, 28 days <strong>and</strong> 56 days even though there are a<br />
little amount of difference value between the age tested. For the 3% superplasticized concrete on the<br />
age of 7 days tested the density of the concrete slightly higher than the 28 <strong>and</strong> 56 days of tested.<br />
But as for 2.25% superplasticized concrete, a huge difference of density of the concrete occurs when it<br />
reaches to 28 days. The density of this concrete seems to be decreasing by leaving a big gap of 1000<br />
between 7 days <strong>and</strong> 56 days. The difference value of this density might be occurs because of<br />
compaction or vibration has not well compacted causing the particles to be trapped inside the concrete<br />
thus reduced the density of the concrete.<br />
This can be summarize as when increasing of the age of the specimen, the concrete density will be<br />
more increased even thought the increasing value is not so constant. This is because of the curing<br />
factor during the specimen is cured inside the water curing tank which cause the increasing weight of<br />
the specimen. The second factor is that the test specimen might not much be dry enough perfectly to<br />
obtain the dry weight. Therefore the inaccuracy actual value of concrete density specimen occurs for<br />
every concrete mix with the increase of the age.
377<br />
International <strong>Building</strong> & <strong>Infrastructure</strong> Technology Conference<br />
7-8 June 2011, Vistana Hotel, Penang, Malaysia<br />
Figure 3. Average result of density concrete between four sample specimens<br />
3.3 Ultrasonic Pulse Velocity Test Result<br />
Table 3 Shows the total average difference of the pulse velocity value between normal concrete,<br />
1.75% superplasticized concrete, 2.25% superplasticized concrete <strong>and</strong> 3% superplasticized concrete<br />
according to the age (days).<br />
Table 3. Pulse Velocity<br />
Types of Specimen<br />
7 days<br />
Age of sample (days)<br />
28 days 56 days<br />
Normal Concrete 3.81 (Good) 4.24 (Good) 5.09 (Excellent)<br />
1.75% Superplasticized Concrete 3.81 (Good) 4.27 (Good) 6.18 (Excellent)<br />
2.25% Superplasticized Concrete 3.82 (Good) 4.16 (Good) 7.10 (Excellent)<br />
3% Superplasticized Concrete 4.09 (Good) 4.34 (Good) 7.22 (Excellent)<br />
From the experiment <strong>and</strong> the data result shows that the value for all concrete specimens is in good<br />
<strong>and</strong> excellent rate. Starting from 7 days to 28 days shows the results of good rating, <strong>and</strong> by the age of<br />
56 days of tests, it increase up going for an excellent rate. This shows that the more increase the<br />
density of the concrete, the higher will be for the pulse velocity of the concrete.<br />
In ensuring an accurate reading is obtained, the surface of the concrete must free from dust <strong>and</strong> is<br />
applied grease. The ultrasonic pulse velocity equipment may occur in error <strong>and</strong> inconsistent if the<br />
equipment is not calibrated well every time the test is conducted. However, every grade <strong>and</strong> design<br />
shows the increase of the pulse velocity reading, so it shows that the concrete density is increased by<br />
time.
3.4 Water Absorption Test Result<br />
378<br />
International <strong>Building</strong> & <strong>Infrastructure</strong> Technology Conference<br />
7-8 June 2011, Vistana Hotel, Penang, Malaysia<br />
Figure 4. Average value of water absorption between four types of specimen<br />
Figure 4 shown the most types of specimens that absorbs more water is the 2.25% superplasticized<br />
concrete which increase up to 6% when it reaches the age of 56 days. As for normal concrete, the<br />
increase of the water absorption is on 28 days but when it reaches the age of 56 days of tests, it<br />
decreased to 2.82%.<br />
According to the bar chart above shown, the result shown for the four types of specimen is quietly<br />
inconsistent. This may be caused by the risk of cracking of vibration during the coring work is<br />
conducted. Another factor which may occurs the problem is that the specimen is put inside the oven to<br />
dry for too long which cause the specimen to shrink <strong>and</strong> lost its particles of strength connection.<br />
3.5 Compressive Strength Test<br />
The compressive strength test is one of the important tests for the concrete mix. This is because a<br />
concrete is really good at compressive strength <strong>and</strong> weak in flexural strength. This test will show the<br />
capability of the concrete strength towards the mix design in various types by using a different<br />
percentage of superplasticizers.<br />
According to the figure 5 from the bar chart as shown, the value of compressive strength for normal<br />
concrete has increase in a normal way according to the age tested <strong>and</strong> that is on 7, 28 <strong>and</strong> 56 days.<br />
Compare to 1.75% superplasticized concrete, the value strength which actually increase more than<br />
the normal concrete on 7 <strong>and</strong> 28 days. But when it reaches the age 56 days it’s constantly reach the<br />
strength of the same as the normal concrete.<br />
According to the bar chart on result of 2.25% superplasticized concrete, the value of compressive<br />
strength has magnificently increase far beyond the expectation of the other three specimen. On the 7<br />
days of age, this sample has increase the strength as nearly reach the strength of 28 days. By the age<br />
of 28 days, the value of compressive strength has increase passing the value strength of normal <strong>and</strong><br />
1.75% superplasticized concrete. When it comes to 56 days, the strength rise up more than what has<br />
been expected reaching to grade 80 . This may be occurred because of the curing process<br />
where the concrete reacts in hydrolysis <strong>and</strong> hydration process.<br />
Eventually the 3% superplasticized concrete has not increase in a great strength value as the 2.25%<br />
superplasticized concrete. But when it reaches the age of 56 days, the value strength has slightly
379<br />
International <strong>Building</strong> & <strong>Infrastructure</strong> Technology Conference<br />
7-8 June 2011, Vistana Hotel, Penang, Malaysia<br />
increased rather fast. From the result recorded, this may be concluded that the optimum percentage<br />
use of superplasticizer for the concrete design mix can only be limited to 2.25%. The fact is that when<br />
using more percentage of superplasticizer in concrete design mix, it increases the strength thus<br />
reducing the percentage of water use <strong>and</strong> increase the workability. But when too much<br />
superplasticizer is added, it can be over limit of the design where the mixture will not evenly distributed<br />
whether too much bleeding occurs or the mixture is not well mixed thoroughly when not much water<br />
can be use if the superplasticizer is too much added.<br />
Figure 5. Average value of Compressive strength between four sample specimens.<br />
3.6 Flexural Test Result<br />
Even though that the flexural test is rarely done to determine strength of a concrete design nowadays<br />
but it is also one of the important aspect especially when it involves in slab structure. The flexural force<br />
of a slab is needed especially for the construction of airport to determine the flexural strength of slab<br />
constructed. The performance of flexural strength usually more depends on the density <strong>and</strong> the<br />
strength of the concrete where the obtaining weight before flexural test is run shows the tested<br />
concrete density is in good condition.<br />
From the data analysis obtained, flexural strength too experiences the increase of strength process.<br />
According to the figure 6 from the bar chart shows that the equal increase of strength between 7 days,<br />
28 days to 56 days is the normal concrete. Compared to 2.25% <strong>and</strong> 3% superplasticized concrete, on<br />
the beginning 7 days of tested the flexural strength increase more than the normal concrete. When it<br />
reaches 28 days of tests, the flexural strength of the both specimen increases more especially for the<br />
3% superplasticized concrete where it rises over the 2.25% superplasticized concrete. But when it<br />
comes to the age of 56 days of tests, the 3% superplasticized concrete shows the decreased of the<br />
flexural strength around 1 while 2.25% superplasticized concrete only increase about<br />
0.007 . From the 56 days of tests result shows that the stronger concrete in flexural strength is<br />
the normal concrete.<br />
According to the bar chart, the 1.75% superplasticized concrete has not much shown its performance<br />
when it comes to flexural strength test. The result shows that this specimen has been proven to be the<br />
weakest concrete in flexural strength.<br />
The increasing of flexural strength which is inconsistent has given a guide where if there is an<br />
existence of different quantity types of cement content in every specimen mix, then the features or the
380<br />
International <strong>Building</strong> & <strong>Infrastructure</strong> Technology Conference<br />
7-8 June 2011, Vistana Hotel, Penang, Malaysia<br />
characteristics of the strength will be also different between one to another. A material of concrete<br />
mixture which plays the important role in concrete strength is the aggregate <strong>and</strong> cement. So, if there is<br />
a change in the quantity of cement content, then there will also be a change of the reading strength.<br />
Figure 6. Total average value of flexural strength for four types of specimen<br />
3.7 Oxygen Permeability Test<br />
Oxygen permeability test is one of the important tests to determine the durability of the concrete<br />
whether the specimen is easily penetrated by small air or not. A concrete which has the fine particles<br />
of holes which finds it hard for the air flow through inside the concrete is one of the best chosen criteria<br />
that is needed for a quality concrete.<br />
According to the figure 7 as shown from the bar chart, it shows that the highest value of oxygen<br />
permeability goes to the normal concrete. This is maybe because of the concrete which reacts in<br />
normal condition without the addition of superplasticizer. Comparing with adding a superplasticizer<br />
according to the percentage added, the superplasticizer helps increase the workability <strong>and</strong> the<br />
durability of the concrete by closing any entrapped air inside the concrete mix <strong>and</strong> reducing the<br />
possibilities of concrete bleeding according to the certain amount of superplasticizer. The 2.25%<br />
superplasticized concrete is the concrete which has the least amount of oxygen permeability. This<br />
shows that this type of concrete has a high durability.
381<br />
International <strong>Building</strong> & <strong>Infrastructure</strong> Technology Conference<br />
7-8 June 2011, Vistana Hotel, Penang, Malaysia<br />
Figure 7. Average value of oxygen permeability between four types of specimen.<br />
4. CONCLUSIONS<br />
The engineering performance of superplasticized concrete is one of the main topics of this research.<br />
By testing each different percentage of superplasticizer in concrete mix, the performance of each<br />
concrete mixture according to the percentage of superplasticizer added has shown magnificent<br />
performance <strong>and</strong> unbelievable result. The sample specimen used in this research are consists of four<br />
types of specimen <strong>and</strong> that is the normal concrete, 1.75% superplasticized concrete, 2.25%<br />
superplasticized concrete <strong>and</strong> 3% superplasticized concrete which is used to tests on the age of 7, 28<br />
<strong>and</strong> 56 days. The design grade of the concrete in this research is grade 60.<br />
From the test series that has been done towards the four types of design specimen, this can be<br />
concluded that the superplasticizer used in concrete mixture has made the following occurs:<br />
� With the additional of 1.75%, 2.25% <strong>and</strong> 3% of superplasticizer inside the concrete mix, the<br />
density of the concrete increase more when comparing with the normal concrete. This can be<br />
concluded that when the more percentage of superplasticizer is added inside the concrete<br />
mixture, the more increase the density <strong>and</strong> its workability because the function of superplasticizer<br />
is to reduce the use of water inside the mixture thus reduced the existence of air bubble inside the<br />
concrete mix making the concrete more durable <strong>and</strong> strong.<br />
� The concrete mix design which used different percentage of superplasticizer has showed an<br />
extremely increased of compressive strength than the normal design mix without superplasticizer.<br />
From chapter 5 table 5.6 (e), shows the total average of the four specimen which can identify the<br />
most perform concrete in this research. The 2.25% superplasticized concrete shows the most<br />
increase value strength than the other three specimens from the age tests of 7 days, 28 days to<br />
56 days. However, the 3% superplasticized concrete does not perform well when tested in<br />
compressive strength. This can be concluded that the maximum limit of superplasticizer which can<br />
only be added is around 2.25% to 2.5%. This is because if superplasticizer is added within the<br />
percentage of an over limit of the requirement design which has been set, the concrete mix will fail<br />
<strong>and</strong> inconsistent mixture will occur between aggregate, s<strong>and</strong>, water <strong>and</strong> cement such as<br />
segregation.<br />
� A concrete with no reinforcement usually cannot withst<strong>and</strong> with the strength of flexural. In flexural<br />
strength test, the 2.25% superplasticizer concrete shows the highest value of flexural strength<br />
among the three types of specimen. The performance of flexural strength usually more depends<br />
on the density <strong>and</strong> the strength of the concrete.
382<br />
International <strong>Building</strong> & <strong>Infrastructure</strong> Technology Conference<br />
7-8 June 2011, Vistana Hotel, Penang, Malaysia<br />
Overall, clearly shows that the used of superplasticizer in concrete mixture has influence the<br />
properties <strong>and</strong> the characteristics of concrete engineering. However, the actual percentage of<br />
superplasticizer that can be use only limited to 2.25% to 2.5% in gaining a high performance<br />
superplasticized concrete.<br />
REFERENCES<br />
G. Barnbrook, E. Dore, A.H. Jeffery, R. Keen, J.D. Parkinson, D.L. Sawtell, B.W. Shacklock, B.H.<br />
Spratt. (1975), Concrete Practice.<br />
Rozainal Bin Rosli. (2006), Rekabentuk Sistem Konkrit Prestasi Tinggi Terhadap Ciri-Ciri Ketahanan.<br />
Mahyuddin Ramli. (1991), Teknologi Konkrit Dan Pembinaan.<br />
British St<strong>and</strong>ard BS 1881: Part 101. (1983), Method of Sampling Fresh Concrete on Site.<br />
British St<strong>and</strong>ard BS 1881: Part 102. (1983), Method For Determination Of Slump.<br />
British St<strong>and</strong>ard BS 1881: Part 111. (1983), Method of Normal Curing Of Test Specimen.<br />
British St<strong>and</strong>ard BS 1881: Part 113. (1983), Method For Making And Curing of Test Cube.<br />
British St<strong>and</strong>ard BS 1881: Part 116. (1983), Method For Determination Of Compressive Strength Of<br />
Concrete Cubes.<br />
British St<strong>and</strong>ard BS 1881: Part 118. (1983), Method For Determination Of Flexural Strength.<br />
Malaysia St<strong>and</strong>ard (MS) 523. (1993). Bahagian 1<br />
http://www.cement.org/basics/concretebasics_chemical.asp<br />
http://www.fhwa.dot.gov/infrastructure/materialsgrp/suprplz.htm
T193<br />
383<br />
International <strong>Building</strong> & <strong>Infrastructure</strong> Technology Conference<br />
7-8 June 2011, Vistana Hotel, Penang, Malaysia<br />
USE OF RAW CLAY OF LABU SAYONG AS A PARTIAL CEMENT<br />
REPLACEMENT IN CONCRETE: ENGINEERING PROPERTIES<br />
Zulazril bin Idris 1 , Noor Faisal bin Abas 2<br />
1,2 Universiti Sains Malaysia, Pulau Pinang, Malaysia<br />
1 zhuthyca_5535@yahoo.com.my, 2 nfaisal@usm.my<br />
ABSTRACT: The use of pozzolanic materials as admixtures in partial replacement of Portl<strong>and</strong> cement<br />
in mortars <strong>and</strong> concrete increased significantly in the last 20 years. Some pozzolanic materials, such<br />
as silica fume, fly ash, <strong>and</strong> rice husk ash, are by-products of industrial <strong>and</strong> agro industrial processes,<br />
which further contribute to reduce both environmental <strong>and</strong> economical problems that would be<br />
associated with their disposal. The study has been taken to investigate the engineering properties of<br />
concrete with partial cement replacement of raw clay of labu sayong. Five different concrete design<br />
mix by replacing the cement content with raw clay of labu sayong in the ratio 5%, 10%, 15% <strong>and</strong> 20%.<br />
The concrete grade 50 was designed in this study as a control mix. The study shows that, replacing<br />
cement in the range of 5% to 20% with raw clay result in increasing the long term development of<br />
compressive <strong>and</strong> flexural strength. The design mix of 5% replacement of cement with raw clay has the<br />
highest compressive strength at the all age of specimen compared with the other mix.<br />
Keywords: Pozzolanic material, Environmental problems, Cement replacement, Compressive<br />
strength, Flexural strength.<br />
1. INTRODUCTION<br />
The world is now more concerned about the pollution occurred. Many agencies are increasingly<br />
concerned over the environmental quality in the world. This awareness is also felt in the construction<br />
industry. For example, an architect board has introduced the index of green building (GBI) as a way to<br />
reduce the greenhouse effect in the design <strong>and</strong> use of building materials for the building. This<br />
awareness also has led many researchers to carry out research to produce new building materials<br />
that’s more environmentally friendly. One of building materials to receive serious attention in the<br />
research study is concrete.<br />
The main ingredient in the production of concrete is cement. Production of cement by the cement<br />
factory plant has contributed many environmental pollutants. T. W. Bremner on his thesis of<br />
environmental aspects of concrete was stated that there is a numbers of environmental problems<br />
come from cement industries such as carbon dioxide (CO2) emissions, nitrous oxide emissions, noise<br />
pollution, water pollution <strong>and</strong> particulate air emissions. The carbon dioxide <strong>and</strong> nitrous oxide are<br />
among the greenhouse gases. The emission of these two gases to the atmosphere will cause the<br />
greenhouse effect to our earth.<br />
Rationally, there are 2 simple solutions for the all environmental problem above. Firstly is by reducing<br />
the production of cement <strong>and</strong> secondly is by replacing the cement content in concrete with viable<br />
alternatives where is possible. However, it seems impossible for the cement manufacturers to reduce<br />
their total production of cement because the cement dem<strong>and</strong> is increasing every year. This method<br />
may not be agreed upon by most of the cement as it will impact the amount of their income. Therefore,<br />
the method of replacement of cement with other substances that have characteristics similar or almost<br />
similar to the characteristics of cement is seen as the most effective solution for manufacturers of<br />
cement.<br />
Many studies have been conducted by the researchers in the past 2 or 3 decade to utilize effectively<br />
wastes material <strong>and</strong> find a suitable alternative for partial cement replacement in concrete without<br />
decreasing the strength <strong>and</strong> durability of the conventional concrete. The use of waste material as
384<br />
International <strong>Building</strong> & <strong>Infrastructure</strong> Technology Conference<br />
7-8 June 2011, Vistana Hotel, Penang, Malaysia<br />
partial replacement of cement in concrete also can preserve the environment <strong>and</strong> get to solve<br />
problems of waste disposal from industry.<br />
The use of pozzolanic materials as admixtures in partial replacement of Portl<strong>and</strong> cement in mortars<br />
<strong>and</strong> concrete increased significantly in the last 20 years. The name of pozzolan was taken in<br />
conjunction with the name of the village, Pozzuoli, near Napoli in Italy (Sersale, 1958 cited in<br />
Kitsopoulos, 1996, p. 576). Some pozzolanic materials, such as silica fume, fly ash, <strong>and</strong> rice husk ash,<br />
are by-products of industrial <strong>and</strong> agro industrial processes, which further contribute to reduce both<br />
environmental <strong>and</strong> economical problems that would be associated with their disposal (G. C. Cordeiro,<br />
2008).<br />
Metakaolin is one of the examples of pozzolanic material. It is obtained from calcining the kaolin (clay)<br />
within the certain temperature. Thermal activation of clay minerals between 600–900 °C by<br />
dehydroxylation leads to the breaking down or partial break down of the structure forming a transition<br />
phase with high reactivity (Ambroise et al., 1986 <strong>and</strong> Sayanam et al., 1989 cited in R. Siddique, 2009,<br />
p. 393). Metakaolin is poorly crystallized transition phase obtained by calcining kaolin in the<br />
temperature range 700 – 800 °C (M. Murat, 1983 <strong>and</strong> J. Ambroise, 1989 cited in Ambroise et al.,<br />
1994, p. 161)<br />
The mechanical properties of concrete with partial cement replacement with metakaolin were<br />
improved compared to the normal concrete using 100% ordinary Portl<strong>and</strong> cement. The previous<br />
research has reported, the compressive strength of concrete will increased by replacing 5% to 15%<br />
weight of cement with metakaolin. C. –S. Poon et al. 2001 was reported that the cement pastes<br />
containing 5% to 20% metakaolin had higher compressive strength than the control at all ages of test.<br />
The use of metakaolin from different origin also will affect the performance of the concrete. The clay<br />
from the different resources had a different chemical content. It is one of the reasons why the concrete<br />
with partial cement replacement of cement with metakaolin from different origin had different<br />
compressive strength. F. Curcio et al., 1998 in the research on metakaolin as pozzolanic microfiller for<br />
high performance mortars was using the four different origin of metakaolin. He found that the use of<br />
metakaolin from the different origin at the similar percentage replacement will contribute the different<br />
compressive strength. Based on the above reason, this paper will discuss the mechanical properties of<br />
concrete with partial cement replacement with raw clay of labu sayong. The aims of this paper are to<br />
study the compressive strength <strong>and</strong> flexural strength of concrete containing partial cement<br />
replacement of raw clay of labu sayong.<br />
2. METHODOLOGY<br />
2.1 Material used<br />
ASTM Type I ordinary Portl<strong>and</strong> cement was used in all concrete mixtures. Mineral admixture that was<br />
used in this research is raw clay of labu sayong in the form of yellowish powder, collected from the<br />
area of Sayong, Perak. The chemical composition of ordinary Portl<strong>and</strong> cement <strong>and</strong> raw clay of labu<br />
sayong is given in Table 1<br />
Table 1. Chemical composition of cement <strong>and</strong> mineral admixture<br />
Chemical composition % Formula Portl<strong>and</strong> cement type 1 Raw clay<br />
Silicon dioxide SiO2 20.90 53.40<br />
Aluminum oxide Al2O3 4.76 27.78<br />
Iron oxide Fe2O3 3.41 2.16<br />
Calcium oxide CaO 65.41 0.11<br />
Magnesium oxide MgO 1.25 0.12<br />
Sulphur trioxide SO3 2.71 0.13<br />
SiO2 + Al2O3 + Fe2O3 - 83.34<br />
The coarse aggregate used in this study is the locally available aggregate with nominal size greater<br />
than 5.00mm <strong>and</strong> less than 20.00mm. The fine aggregate which is used in the concrete mix for this<br />
research is from river s<strong>and</strong>. The range size of the river s<strong>and</strong> particles used in concrete mix design is
385<br />
International <strong>Building</strong> & <strong>Infrastructure</strong> Technology Conference<br />
7-8 June 2011, Vistana Hotel, Penang, Malaysia<br />
around 5 mm below. Sieve analysis test is done according to the British st<strong>and</strong>ard specification BS 882:<br />
1982 <strong>and</strong> that is with the sieve size of between 5 mm to 0.15 mm.<br />
2.2 Sample preparation<br />
The concrete specimens were prepared in this study. The concrete grade 50 (the compressive<br />
strength at 28 days is >50 N/mm²) is used as the control specimen. Than the concrete with raw clay of<br />
labu sayong as a partial cement replacement in different ratio namely C2 (5%), C3 (10%), C4 (15%),<br />
<strong>and</strong> C5 (20%) were prepared. The mix proportions of the concrete are shown in Table 2 below.<br />
Sample<br />
name<br />
Concrete<br />
grade<br />
(N/mm²)<br />
Table 2. Mix proportion of concrete<br />
w/c ratio w/b ratio Portl<strong>and</strong><br />
cement<br />
Mix proportion kg/m³<br />
Aggregate Admixture<br />
Course Fine Raw clay<br />
Water (w/c<br />
+ w/b)<br />
Super<br />
plasticizer<br />
C1 50 0.44 - 477.00 959.28 753.72 - 210 4.77<br />
C2 50 0.44 0.61 453.15 959.28 753.72 23.85 224.55 4.53<br />
C3 50 0.44 0.61 429.30 959.28 753.72 47.70 239.10 4.29<br />
C4 50 0.44 0.61 405.45 959.28 753.72 71.55 253.65 4.05<br />
C5 50 0.44 0.61 381.60 959.28 753.72 95.40 268.19 3.82<br />
2.3 Experimental program<br />
a. Compressive Strength<br />
Concrete cube with dimension 100 x 100 x 100mm was used to determine the compressive strength.<br />
The concrete were casting using Portl<strong>and</strong> cement with partial cement replacement of raw clay at 5%,<br />
10%, 15%, <strong>and</strong> 20%.the specimens were vibrated using vibrator table to assist the compaction. The<br />
concrete samples were demoulded after 24 hours (1 day) casting <strong>and</strong> cured in water until the testing<br />
age. The compressive strength of all concrete specimens was determined at ages of 3, 7, 14, 28 <strong>and</strong><br />
60 days. Three cubes were used for each test.<br />
b. Flexural Strength<br />
Concrete prism with dimension 100 x 100 x 500mm was used to determine the flexural strength. The<br />
concrete were casting using Portl<strong>and</strong> cement with partial cement replacement of raw clay at 5%, 10%,<br />
15%, <strong>and</strong> 20%.the specimens were vibrated using vibrator table to assist compaction. The concrete<br />
samples were demoulded after 24 hours (1 day) casting <strong>and</strong> cured in water until the testing age. The<br />
compressive strength of all concrete specimens was determined at ages of 3, 7, 14, 28 <strong>and</strong> 60 days.<br />
Three cubes were used for each test.<br />
3. RESULT AND DISCUSSION<br />
The result of compressive strength test of concrete with partial cement replacement of raw clay was<br />
shown in Figure 1. The value of compressive strength is the average value of three cubes for each<br />
age. Figures 1 show that the compressive strength of concrete with 5% replacement of cement with<br />
raw clay (C2) has highest result. The compressive strength increased 74.34%, increased 41.20%,<br />
increased 47.03%, increased 50.67% <strong>and</strong> increased 52.29% respectively at 3days, 7days, 14days,<br />
28days <strong>and</strong> 60days of specimen ages.<br />
The development strength of C3 (concrete with 10% replacement of raw clay) is slightly below the<br />
control mix for the early age of curing, but it is become higher than the control mix after 28 days of<br />
curing. At the age of 60 days, the compressive strength of C3 is 23.36% higher than the control mix.<br />
While the C4 <strong>and</strong> C5 compressive strength are below the compressive strength of control mix at every<br />
age of specimen. However, the different of strength are decreasing when the age of specimen
386<br />
International <strong>Building</strong> & <strong>Infrastructure</strong> Technology Conference<br />
7-8 June 2011, Vistana Hotel, Penang, Malaysia<br />
increase. The C4 mix (concrete with 15% replacement of raw clay) has slightly the same strength with<br />
the control mix.<br />
Based on the Figure 1 below, it looks like the concrete with replacement 5% to 20% of cement with<br />
raw clay will become same or maybe higher than the control mix strength when the age of specimen<br />
increased. The graph of C3 to C5 is still increased while the C1 was start decreased or remain<br />
constant after the age of 60 days.<br />
Figure 1. Compressive strength of concrete grade 50 (N/mm 2 )<br />
The result of flexural strength test of concrete with partial cement replacement of raw clay was shown<br />
in Figure 2. The value of flexural strength is the average value of two prisms for each age of specimen.<br />
From the result below, the average flexural strength varies from 2.20 to 5.47 N/mm². Figure 2 show<br />
that the distributions of flexural strength of concrete with replacement 5% to 20% of cement with raw<br />
clay are inconsistent at the early age of specimen compared the control mix. However, the flexural<br />
strength was more consistent at the age of 28days <strong>and</strong> above. C2 show the highest development of<br />
flexural strength compared to the other mixes. At the age of 60days, C2 has exceeding 21.56% of<br />
control mix strength.<br />
The C3, C4, <strong>and</strong> C5 mixes however still have the lower flexural strength than the control mix. Even the<br />
flexural strength still lower than control, but the strength is indirectly perpendicular with the age of<br />
specimen increase. That means when the age of specimen increase, the different of strength between<br />
the C3, C4, <strong>and</strong> C5 with the control mix decrease. Besides, the C2, C3, C4, <strong>and</strong> C5 shows that their<br />
strength will still increase after the 60days curing period while the control mix does not show that it will<br />
be increased in strength after 60days.
4. CONCLUSIONS<br />
387<br />
International <strong>Building</strong> & <strong>Infrastructure</strong> Technology Conference<br />
7-8 June 2011, Vistana Hotel, Penang, Malaysia<br />
Figure 2. Flexural strength of concrete grade 50 (N/mm 2 )<br />
Based on the results indicate that, an increase of compressive strength <strong>and</strong> flexural strength of<br />
concrete is definitely noticed with the addition of mineral admixtures (raw clay of labu sayong). The<br />
result also show that, by replacing 5% t0 15% of cement with raw clay will increasing the long term<br />
strength development of compressive <strong>and</strong> flexural strength. Thus, it will improve the engineering<br />
properties of the concrete. The concrete with 5% replacement of cement with raw clay has the highest<br />
compressive strength at all the age of specimen.<br />
REFERENCES<br />
Bremner, T. W. (2001). Environmental Aspects of Concrete: Problem And Solutions 1 st All – Russian<br />
Conference on Concrete <strong>and</strong> Reinforced Concrete. 9 – 14 September 2001.<br />
Heul<strong>and</strong>ite <strong>and</strong> mordenite – rich tuffs from Greece: a potential source for pozzolanic materials.<br />
Cordeiro, G. C. Filho, R. D. T. Tavares, L. M. Fairbairn, E. M. R. (2009) Ultrafine Grinding of Sugar<br />
Cane Bagasse Ash for Application as Pozzolanic Admixture<br />
In Concrete. Cement <strong>and</strong> Concrete Research. (39), pp. 110–115.<br />
Ambroise, J. Maximilien, S. Pera, J. (1994). Properties of metakaolin blended<br />
cement. Advanced Cement Based Materials (1), pp. 161 – 168.<br />
Siddique, R. Klaus, J. (2008). Influence of metakaolin on the properties of mortar <strong>and</strong> concrete: A<br />
review. Applied Clay Science, (43), pp. 392 – 400.<br />
Rate of pozzolanic reaction of metakaolin in high-performance cement pastes.<br />
Curcio, F. DeAngelis, B.A. Pagliolico, S. (1998). Metakaolin as a pozzolanic microfiller for highperformance<br />
mortars. Cement <strong>and</strong> Concrete Research. 28, (6), pp. 803–809.
T194<br />
388<br />
International <strong>Building</strong> & <strong>Infrastructure</strong> Technology Conference<br />
7-8 June 2011, Vistana Hotel, Penang, Malaysia<br />
A REVIEW ON MECHANICAL AND THERMAL PROPERTIES OF LIGHTWEIGHT<br />
FOAMED CONCRETE AT AMBIENT TEMPERATURE<br />
Md Azree Othuman Mydin 1 , Hanizam Awang 2<br />
1,2 School of Housing, <strong>Building</strong> <strong>and</strong> Planning, Universiti Sains Malaysia, 11800, Penang<br />
1 azree@usm.my , 2 hanizam@usm.my<br />
ABSTRACT: In recent years, the construction industry has shown significant interest in the use of<br />
lightweight foamed concrete (LFC) as a building material due to its many favourable characteristics<br />
such as lighter weight, easy to fabricate, durable <strong>and</strong> cost effective. LFC is a material consisting of<br />
Portl<strong>and</strong> cement paste or cement filler matrix (mortar) with a homogeneous pore structure created by<br />
introducing air in the form of small bubbles. With a proper control in dosage of foam <strong>and</strong> methods of<br />
production, a wide range of densities (400 – 1600 kg/m 3 ) of LFC can be produced thus providing<br />
flexibility for application such as structural elements, partition, insulating materials <strong>and</strong> filling grades.<br />
LFC has so far been applied primarily as a filler material in civil engineering works. However, its good<br />
thermal <strong>and</strong> acoustic performance indicates its strong potential as a material in building construction.<br />
The focus of this paper is to classify literature on foam concrete in terms of its mechanical <strong>and</strong> thermal<br />
properties at ambient temperature.<br />
Keywords: foamed concrete, thermal properties, mechanical properties<br />
1. INTRODUCTION<br />
LFC is defined as a cementitious material having a minimum of 20 per cent by volume of mechanically<br />
entrained foam in the mortar slurry (Van Deijk, 1992) in which air-pores are entrapped in the matrix by<br />
means of a suitable foaming agent. The air-pores are initiated by agitating air with a foaming agent<br />
diluted with water; the foam then carefully mixes together with the cement slurry to form LFC.<br />
Integrating the air-pores into the base matrix gives a low self-weight, high workability, but lower<br />
strength in contrast to normal weight concrete. LFC can be fabricated anywhere in any shape or<br />
building unit size. Table 1 shows the range of densities suitable for different applications.<br />
2. CONSTITUENTS MATERIAL OF LFC<br />
LFC with low density, i.e. having a dry density of up to about 600 kg/m 3 , is frequently formed from<br />
cement (to which other binders could be added), water <strong>and</strong> stable foam whilst denser LFC will<br />
incorporate fine s<strong>and</strong> in the mix. The requirements of each constituent of LFC are explained below.<br />
2.1 Cement<br />
Portl<strong>and</strong> cement SEM1 is typically used as the main binder for LFC. Additionally, rapid hardening<br />
Portl<strong>and</strong> cement (Kearsley <strong>and</strong> Wainwright, 2001), calcium sulfoaluminate <strong>and</strong> high alumina cement<br />
(Turner, 2001) have also been used to reduce the setting time <strong>and</strong> to obtain better early strength of<br />
LFC. There was also an attempt to decrease the cost of production by using fly ash (Kearsley <strong>and</strong><br />
Wainwright, 2001) as cement replacement to enhance consistency of the mix <strong>and</strong> to reduce heat of<br />
hydration while contributing for long term strength.<br />
2.2 Fillers (s<strong>and</strong>)<br />
Sach <strong>and</strong> Seifert (1999) suggested that only fine s<strong>and</strong>s having particle sizes up to about 4mm <strong>and</strong><br />
with an even distribution of sizes should be used for LFC. This is primarily because coarser aggregate
389<br />
International <strong>Building</strong> & <strong>Infrastructure</strong> Technology Conference<br />
7-8 June 2011, Vistana Hotel, Penang, Malaysia<br />
might lead to collapse of the foam during the mixing process. Coarse pulverised fuel ash (PFA) also<br />
can be used as a partial or total replacement for s<strong>and</strong> to make LFC with a dry density below about<br />
1400 kg/m 3 .<br />
2.3 Water<br />
The amount of water to be added to the mix depends on the composition of the mix design. Generally<br />
for lighter densities, when the amount of foam is increased, the amount of water can be decreased.<br />
The water-cement ratio must be kept as low as possible in order to avoid unnecessary shrinkage in<br />
the moulds. However, if the amount of water added to cement <strong>and</strong> s<strong>and</strong> is too low, the necessary<br />
moisture to make a workable mix will have to be extracted from the foam after it is added, thereby<br />
destroying some of the foam in the mix. The range of water-cement ratio used in LFC is between 0.4<br />
to 1.25 (Kearsley, 1996), the appropriate value will be depending on the amount of cement in the mix,<br />
use of chemical admixtures <strong>and</strong> consistence requirement.<br />
2.4 Surfactants (foaming agent)<br />
There is an extensive choice of surfactants (foaming agent) available in the market. Generally two<br />
types of surfactants can be used to produce foam: protein <strong>and</strong> synthetic based surfactants. Protein<br />
based surfactants are produced from refined animal products such as hoof, horn <strong>and</strong> skin whilst<br />
synthetic based surfactants are produced using man made chemicals such as the ones used in<br />
shampoos, soap powders <strong>and</strong> soaps (Md Azree, 2004). The surfactant solution typically consists of<br />
one part of surfactant <strong>and</strong> between 5 <strong>and</strong> 40 parts of water but the optimum value is a function of the<br />
type of surfactant <strong>and</strong> the technique of production. It is very important to store all surfactants<br />
accordingly because they are inclined to deterioration at low temperatures. According to McGovern<br />
(2000), foams formed from protein based surfactants have smaller bubble size, are more stable <strong>and</strong><br />
have a stronger closed bubble structure compared to the foam produced using synthetic surfactants.<br />
Therefore, protein based surfactants would be best suited for the production of LFC of comparatively<br />
high density <strong>and</strong> high strength.<br />
3. DESIGN PROCEDURE<br />
At the moment, there is no st<strong>and</strong>ard method for designing LFC mix. For normal weight concrete, the<br />
user would signify a certain compressive strength <strong>and</strong> the water-cement ratio would be adjusted to<br />
meet the requirement. As far as LFC is concerned, not only the strength is specified, but also the<br />
density. It is not an easy task to achieve an accurate measurement of the density of LFC on site<br />
because of the hardened density of LFC depends on the saturation intensity in its pores. According to<br />
Jones <strong>and</strong> McCarthy (2005), it is difficult to achieve the design density of LFC because it has a<br />
tendency to lose between 50 <strong>and</strong> 200 kg/m 3 of the total mix water because it depends on the concrete<br />
fresh density, early curing regime <strong>and</strong> exposure conditions.<br />
4. RELEVANT STUDIES ON PROPERTIES OF LFC<br />
There is a lack of published information on LFC. Among the LFC related literature collected by the<br />
author, majority of these were published within the last 10 years <strong>and</strong> most of these previous studies on<br />
LFC were aimed at characterizing the ambient temperature properties of LFC. This section will review<br />
previous studies on properties of hardened LFC, including physical properties (density, air-void system<br />
<strong>and</strong> porosity), mechanical properties (compressive strength, tensile strength <strong>and</strong> modulus of<br />
elasticity), thermal properties <strong>and</strong> fire resistance performance.<br />
4.1 Density of LFC<br />
The relationship between dry density <strong>and</strong> casting density between 600 kg/m 3 <strong>and</strong> 1200 kg/m 3 can be<br />
calculated using the following linear equation (Kearsley <strong>and</strong> Mostert, 2005):<br />
� 1. 034�<br />
�101.<br />
96 …. (1)<br />
m<br />
� dry<br />
where � m is the target casting density (kg/m 3 ) <strong>and</strong> � dry is the dry density (kg/m 3 )
390<br />
International <strong>Building</strong> & <strong>Infrastructure</strong> Technology Conference<br />
7-8 June 2011, Vistana Hotel, Penang, Malaysia<br />
4.2 Air-void system <strong>and</strong> porosity of LFC<br />
Porosity <strong>and</strong> the pore structure will have significant effects on thermal conductivity <strong>and</strong> mechanical<br />
properties of LFC. High porosity is highly detrimental to the strength of LFC, particularly if the pores<br />
are of large diameter. Large pores also result in high thermal conductivity. As a cement-based<br />
material, LFC consists of gel-pores (dimensions from 0.0005μm up to 0.01μm), capillary-pores<br />
(0.01μm to 10μm) <strong>and</strong> air-pores (air entrained <strong>and</strong> entrapped pores) (Visagie <strong>and</strong> Kearsely, 2002).<br />
The gel-pores occupy between 40 to 55% of total pore volume but they are not active in permeating<br />
water through cement paste <strong>and</strong> they do not influence the strength (Br<strong>and</strong>t, 1995). However, the water<br />
in the gel-pores is physically bonded to cement <strong>and</strong> directly controls shrinkage <strong>and</strong> creep properties of<br />
LFC.<br />
Figure 1. Porosity of LFC as a function of dry density (Kearsley <strong>and</strong> Wainwright, 2001)<br />
Air-pores in hardened LFC can be entrained or entrapped. Entrapped air-pores occur inadvertently<br />
during the mixing <strong>and</strong> placing of concrete. As LFC is a self-flowing <strong>and</strong> self-compacting concrete <strong>and</strong><br />
exclusive of any coarse aggregate, the possibility of entrapped air is insignificant. In contrast,<br />
entrained air-pores are introduced intentionally during production of LFC by using an air-entraining<br />
chemical admixture (surfactants). Entrained air-pores are discrete <strong>and</strong> individual bubbles of spherical<br />
shape. They are uniformly distributed throughout the cement paste <strong>and</strong> are not interconnected with<br />
each other <strong>and</strong> therefore do not affect the permeability of LFC (Kalliopi, 2006). The total volume of<br />
capillary-pores <strong>and</strong> air-pores affects the strength of LFC.<br />
Kearsley <strong>and</strong> Wainwright (2001) carried out research to investigate the relationship between porosity<br />
<strong>and</strong> dry density of LFC. In this study, they utilized a large amount of both classified <strong>and</strong> unclassified fly<br />
ash (pulverised <strong>and</strong> pozz-fill) as a cement replacement up to 75% by weight. Figure 1 shows the<br />
relationship between porosity <strong>and</strong> dry density of LFC obtained from their research. It can be seen from<br />
Figure 1 that there is a strong relationship between porosity <strong>and</strong> dry density of LFC. They found that<br />
the porosity of LFC is the combination of entrained air-pores <strong>and</strong> the pores within the paste <strong>and</strong> the<br />
porosity was found to be dependant primarily on dry density of LFC <strong>and</strong> not on fly ash type <strong>and</strong><br />
content. Kearsley <strong>and</strong> Wainwright proposed an equation to link the porosity <strong>and</strong> dry density of LFC<br />
(based on Figure 1) as follows:<br />
�0.<br />
85<br />
� � 18700�<br />
dry ……(2)<br />
where � is the porosity (%) <strong>and</strong> � dry is the dry density (kg/m 3 )
4.3 Compressive strength of LFC<br />
391<br />
International <strong>Building</strong> & <strong>Infrastructure</strong> Technology Conference<br />
7-8 June 2011, Vistana Hotel, Penang, Malaysia<br />
Table 1. A review of LFC mixes, compressive strengths <strong>and</strong> density ranges (Ramamurthy et al., 2009)<br />
Authors<br />
Van Deijk<br />
(1991)<br />
Durack <strong>and</strong><br />
Weiqing<br />
Proportion of<br />
cement (kg/m<br />
Ratios<br />
3 ) or<br />
composition S/C W/C F/C<br />
Cement-s<strong>and</strong>/ fly<br />
ash<br />
270–398<br />
Density<br />
range<br />
kg/m 3<br />
- - - 280-1200<br />
1.23-<br />
2.5<br />
(1998) 137-380 -<br />
Kearsley <strong>and</strong><br />
Wainwright<br />
(2001)<br />
Jones <strong>and</strong><br />
McCarthy<br />
Cement-fly ash<br />
replacement<br />
193-577<br />
500<br />
-<br />
1.5-<br />
2.3<br />
(2005) 500 -<br />
0.61-<br />
0.82<br />
0.48-<br />
0.70<br />
0.6-<br />
1.17<br />
-<br />
1.48-<br />
2.50<br />
982-1185<br />
(DD)<br />
541-1003<br />
(DD)<br />
Compressive<br />
strength<br />
(28 days)<br />
N/mm 2<br />
0.6 -10.0<br />
(91 days)<br />
1.0-6.0<br />
3.0-15.0<br />
(77 days)<br />
- 1000-1500 2.0-18.0<br />
0.3 - 1400-1800 10.0-26.0<br />
0.65-<br />
0.83<br />
1.15-<br />
1.77<br />
1400-1800 20.0-43.0<br />
Nambiar <strong>and</strong><br />
Ramamurthy<br />
(2006)<br />
Cement-s<strong>and</strong> mix<br />
(coarse)<br />
Cement-s<strong>and</strong> mix<br />
(fine)<br />
Cement-s<strong>and</strong>-fly<br />
ash mix<br />
With filler-cement ratio<br />
varied from 1 to 3 <strong>and</strong><br />
fly ash replacement for<br />
s<strong>and</strong> varied from 0% to<br />
100%<br />
800-1350<br />
(DD)<br />
650-1200<br />
(DD)<br />
1.0-7.0<br />
2.0-11.0<br />
4.0-19.0<br />
* S/C: s<strong>and</strong>–cement ratio; F/C: fly ash–cement ratio; W/C: water–cement ratio; DD: dry density<br />
The compressive strength of LFC reduces with decreasing density. Table 1 shows a summary of the<br />
range of compressive strength of LFC for various mixture composition <strong>and</strong> densities reported in<br />
literature. For mixes with similar constituents, the density-strength relations should be reasonably<br />
comparable. But, because the constituents in LFC mixtures can differ widely, density is not necessarily<br />
a dependable indicator of the compressive strength of LFC. The other main factors that influence the<br />
strength of LFC are cement-s<strong>and</strong> ratio, water-cement ratio, type of cement <strong>and</strong> content, pore size <strong>and</strong><br />
distribution, type of surfactants (foaming agents) <strong>and</strong> curing regime (Aldridge, 2005), (Hamidah et al.,<br />
2005). Higher s<strong>and</strong>-cement ratios result in LFC with lower compressive strength. The strength of lower<br />
density LFC can be increased to equal that of higher density LFC by increasing the amount of cement<br />
content in the mix.<br />
The effect of water-cement ratio on compressive strength of LFC is imprecise. Dransfield (2000)<br />
reported that the strength of LFC decreases with reduction in water-cement ratio. Whilst an other<br />
report indicates that the compressive strength of LFC reduces with increasing water-cement ratio up to<br />
0.45, an opposite trend is noted above this value (between 0.5 <strong>and</strong> 1.0) (De Rose <strong>and</strong> Morris, 1999).<br />
When cement is combined with silica fume (Kearsley, 1996) <strong>and</strong> fly ash (De Rose <strong>and</strong> Morris, 1999),<br />
higher compressive strength is achieved in the long term, owing to their pozzolanic reaction <strong>and</strong> filler<br />
characteristics, with a more marked effect at high LFC densities. Kearsley <strong>and</strong> Wainwright (2001)<br />
carried out a study on the effect of replacing large volumes of cement (up to 75% by weight) by both<br />
classified <strong>and</strong> unclassified fly ash on strength of LFC. They found that up to 67% of the cement could<br />
be replaced with ungraded <strong>and</strong> graded fly ash without any significant reduction in compressive<br />
strength. The results signify that the compressive strength of LFC is principally a function of dry<br />
density, <strong>and</strong> LFC mixes with high fly ash content needed a longer time to reach their maximum<br />
strength which was observed to be higher than that attained using only cement.<br />
In terms of the influence of fillers on strength of LFC, better strength is obtained when finer s<strong>and</strong> is<br />
used. For a given density, the mix with fine s<strong>and</strong> results in higher strength than the mix with coarse<br />
s<strong>and</strong> <strong>and</strong> the variation is higher at higher density. This higher strength-density ratio is credited to the<br />
moderately uniform distribution of pore in LFC with fine s<strong>and</strong>, while the pores were larger <strong>and</strong> irregular<br />
for mixes with coarse s<strong>and</strong> (Nambiar <strong>and</strong> Ramamurthy, 2006). Similar behaviour was observed when<br />
s<strong>and</strong> was replaced by fine fly ash.
392<br />
International <strong>Building</strong> & <strong>Infrastructure</strong> Technology Conference<br />
7-8 June 2011, Vistana Hotel, Penang, Malaysia<br />
Jones <strong>and</strong> McCarthy (2005) performed an extensive experimental exploration into the effect of<br />
utilization of unprocessed, run-of-station, low-lime fly ash in LFC, as a substitution for s<strong>and</strong> on the<br />
rheological, strength development <strong>and</strong> permeation/durability properties for LFC with plastic densities<br />
ranging between 1000 <strong>and</strong> 1400 kg/m 3 . They found that the use of fly ash in LFC considerably<br />
benefited the compressive strength growth, mainly after 28 days. At a known age, the fly ash coarse<br />
concretes were up to 6 times stronger than equivalent s<strong>and</strong> concretes.<br />
The enhancement of strength with fly ash as filler is not pronounced at lower density range especially<br />
at earlier ages. This is due to the fact that at lower density range, the foam volume controls the<br />
strength rather than the material properties (Nambiar <strong>and</strong> Ramamurthy, 2006). The utilization of lime,<br />
demolition fines, recycled glass as fine aggregate has slight or no effect on compressive strength of<br />
LFC, while some decrease in strength was reported when crumb rubber, used foundry s<strong>and</strong>, china<br />
clay s<strong>and</strong> <strong>and</strong> quarry fines were used (De Rose <strong>and</strong> Morris, 1999).<br />
The compressive strength of LFC decreases with an increase in pore diameter for dry density of LFC<br />
between 500 <strong>and</strong> 1000 kg/m 3 . Nevertheless for densities higher than 1000 kg/m 3 , as the air-pores are<br />
far apart to have an influence on the compressive strength, the composition of the paste determines<br />
the compressive strength (Visagie <strong>and</strong> Kearsely, 2002). The type of surfactant (foaming agent) also<br />
has major effect on the compressive strength of LFC. An increased of strength up to 70% was found<br />
with the used of protein based foaming agent rather than synthetic foaming agent (Dransfield, 2000).<br />
In terms of curing regime, autoclaving increases the compressive strength. Hamidah et al. (2005)<br />
carried out an investigation to produce cost-effective mix for LFC by optimising the amount of s<strong>and</strong> in<br />
LFC mix by using different s<strong>and</strong>-cement ratio <strong>and</strong> curing conditions. In this study, a series of LFC of<br />
four different densities ranging from 1300 to 1600 kg/m 3 was fabricated using the appropriate mix<br />
proportions <strong>and</strong> a series of s<strong>and</strong>-cement ratios varying from zero to 2.0 for each series of density was<br />
attempted. Hamidah et al. found that water cured samples of LFC attained higher strength than those<br />
cured in air.<br />
4.4 Flexural <strong>and</strong> tensile strength of LFC<br />
The ratio of flexural strength to compressive strength of LFC is in the range of 0.06–0.10 <strong>and</strong> this ratio<br />
was also found to reduce with increasing water-cement ratios <strong>and</strong> decreasing densities (Van Deijk,<br />
1991). The splitting tensile strengths of LFC mixes are higher for mixes with s<strong>and</strong> than those with fly<br />
ash. This is attributed to the improved shear capacity between s<strong>and</strong> particles <strong>and</strong> the paste phase<br />
(Jones <strong>and</strong> McCarthy, 2005). The introduction of polypropylene fibers in LFC has been reported to<br />
improve the tensile <strong>and</strong> flexural strength of LFC, provided this does not affect the fresh concrete<br />
behavior <strong>and</strong> self-compaction (Kearsely <strong>and</strong> Mostert, 1997).<br />
4.5 Modulus of elasticity of LFC<br />
As a porous material, the static modulus of elasticity of LFC is expected to be considerably lower than<br />
that of normal weight concrete for dry densities between 500 <strong>and</strong> 1500 kg/m 3 with values typically<br />
varying from 1.0 to 8.0 kN/mm 2 , respectively (Jones <strong>and</strong> McCarthy, 2005). LFC mix containing fly ash<br />
as fine aggregate is reported to show lower modulus of elasticity value than that of LFC with s<strong>and</strong>.<br />
Jones <strong>and</strong> McCarthy (2005) reported that the utilization of polypropylene fibers in LFC mix could<br />
enhance the value of modulus of elasticity of LFC between two <strong>and</strong> four times. They proposed two<br />
relationships to predict the modulus of elasticity of LFC as follows:<br />
S<strong>and</strong> as fine aggregate<br />
Fly ash as fine aggregate<br />
1.<br />
18<br />
Ec � 0. 42 f c …. (3)<br />
0.<br />
67<br />
Ec � 0. 99 f c …. (4)<br />
where c E is the modulus of elasticity (kN/mm2 ) <strong>and</strong> fc is the compressive strength (N/mm 2 ).
Modulus of elasticity (kN/mm 2 )<br />
25<br />
20<br />
15<br />
10<br />
5<br />
0<br />
S<strong>and</strong> as fine aggregate<br />
Fly ash as fine aggregate<br />
393<br />
International <strong>Building</strong> & <strong>Infrastructure</strong> Technology Conference<br />
7-8 June 2011, Vistana Hotel, Penang, Malaysia<br />
0 5 10 15 20 25 30 35<br />
Compressive Strength (N/mm 2 )<br />
Figure 2. Relationship between modulus of elasticity <strong>and</strong> compressive strength of LFC<br />
Figure 2 shows a plot of modulus of elasticity against compressive strength based on Equation 3 <strong>and</strong><br />
Equation 4. From Figure 2, it can be seen that for the same compressive strength (fc), s<strong>and</strong> as<br />
aggregate gives higher modulus of elasticity values compared to fly ash aggregate. This difference is<br />
attributed to the high amount of fine aggregate in s<strong>and</strong> mix compared to fly ash mix, which contains<br />
completely paste with no aggregate (Jones, 2001).<br />
4.6 Thermal properties of LFC<br />
Thermal properties are required in two design considerations: to provide thermal insulation at ambient<br />
temperature <strong>and</strong> to provide fire resistance.<br />
4.6.1 Ambient temperature thermal properties<br />
The cellular microstructure of LFC provides it with low thermal conductivity. According to BCA (1994)<br />
<strong>and</strong> Jones <strong>and</strong> McCarthy (2005), the thermal conductivity of LFC typically is 5 to 30% of that of normal<br />
weight concrete <strong>and</strong> range from between 0.1 <strong>and</strong> 0.7 W/mK for dry density values of 600 to 1600<br />
kg/m 3 respectively. As pointed out by Kessler (1998), in practical terms normal weight concrete would<br />
have to be 5 times thicker than LFC ones to achieve similar thermal insulation. The thermal<br />
conductivity of LFC with 1000 kg/m 3 density is reported to be one-sixth the value of typical cements<strong>and</strong><br />
mortar (Aldridge <strong>and</strong> Ansell, 2001). Since LFC is made by injecting air into a cement based<br />
mixture, the density of LFC is directly a function of the air inside LFC. Expectedly, the density of LFC<br />
should play an important role in determining its thermal properties. According to Weigler <strong>and</strong> Karl<br />
(1980), a reduction in LFC density by 100 kg/m 3 results in a lessening in its thermal conductivity by<br />
0.04 W/mK.<br />
In addition to use more air to reduce the thermal conductivity of LFC, it is possible to reduce the<br />
thermal conductivity of LFC by using pulverized fuel ash. For example, as reported by Giannakou <strong>and</strong><br />
Jones (2002), a reduction in thermal conductivity by 12-38% was attained with the introduction of 30%<br />
pulverized fuel ash in the mix compared to the LFC with only Portl<strong>and</strong> cement SEM1 as binder<br />
material. This was attributed to the lower density of fly ash particles.<br />
5. CONCLUSIONS<br />
The review presented in paper clearly indicates that most of the investigations on LFC so far have<br />
focused on its ambient temperature properties only. Among these, the majority are about mechanical<br />
properties of LFC with only a very few on its thermal properties. Quantitative information on fire<br />
resistance performance is extremely sparse. Nevertheless the reviewed literature does give some
394<br />
International <strong>Building</strong> & <strong>Infrastructure</strong> Technology Conference<br />
7-8 June 2011, Vistana Hotel, Penang, Malaysia<br />
useful data of LFC mechanical <strong>and</strong> thermal properties at ambient temperature which can be used as<br />
the basis for further research.<br />
ACKNOWLEDGMENTS<br />
The authors would like to thank to Universiti Sains Malaysia providing grant <strong>USM</strong>-RU-PGRS Grant No.<br />
1001/PPBGN/814073 as financial support for this research work.<br />
REFERENCES<br />
Aldridge, D. (2005). Introduction to foamed concrete: What, Why, <strong>and</strong> How?, In: Dhir, R. K., Newl<strong>and</strong>s,<br />
M.D., McCarthy, A., Editors: Use of foamed concrete in construction. pp 1-14. London: Thomas<br />
Telford.<br />
Aldridge, D. & Ansell, T. (2001). Foamed concrete: production <strong>and</strong> equipment design, properties,<br />
applications <strong>and</strong> potential. In: Proceedings of one day seminar on foamed concrete: Properties,<br />
applications <strong>and</strong> latest technological developments. Loughborough University.<br />
Brady, K.C., Watts, G.R.A. & Jones, M.R. (2001). Specification for foamed concrete. Prepared for<br />
Quality Services. Civil Engineering. Highways Agency.<br />
British Cement Association. (1994). Foamed concrete: Composition <strong>and</strong> properties. Report Ref.<br />
46.042. Slough: BCA.<br />
Dransfield, J.M. (2000). Foamed concrete: Introduction to the product <strong>and</strong> its properties. One day<br />
awareness seminar on ‘Foamed concrete: properties, applications <strong>and</strong> potential’ held at University of<br />
Dundee, Scotl<strong>and</strong>.<br />
Gallé, C. & Sercombe J. (2001). Permeability <strong>and</strong> pore structure evolution of silico-calcareous <strong>and</strong><br />
hematite high-strength concretes submitted to high temperatures. J. Mater. Struct., 34 (10), pp 619-<br />
628.<br />
Giannakou, A. & Jones, M.R. (2002). Potentials of foamed concrete to enhance the thermal<br />
performance of low rise dwellings. In: Dhir, R. K., Hewelett, P.C., Csetenyi, L.J., Editors: Innovations<br />
<strong>and</strong> development in concrete materials <strong>and</strong> construction. pp 533-544. Thomas Telford: United<br />
Kingdom.<br />
Hamidah, M.S, Azmi, I., Ruslan, M.R.A., Kartini, K., & Fadhil, N.M. (2005). Optimisation of foamed<br />
concrete mix of different s<strong>and</strong>-cement ratio <strong>and</strong> curing conditions. In: Dhir, R.K., Newl<strong>and</strong>s, M.D.,<br />
McCarthy, A., Editors: Use of foamed concrete in construction. pp 37-44. Thomas: London.<br />
Jones, M.R. (2001). Foamed concrete for structural use. In: Proceedings of one day seminar on<br />
foamed concrete: properties, applications <strong>and</strong> latest technological developments. pp 27-60.<br />
Loughborough University.<br />
Jones, M.R. & McCarthy, A. (2005). Preliminary views on the potential of foamed concrete as a<br />
structural material. Mag. Concr. Res. 57 (1), pp 21-31.<br />
Jones, M.R. & McCarthy, A. (2005). Utilising unprocessed low-lime coal fly ash in foamed concrete.<br />
Fuel. 84 (11), pp 1398-1409.<br />
Jones, M.R. & Carthy, A. (2005). Behaviour <strong>and</strong> assessment of foamed concrete for construction<br />
applications. In: Dhir, R.K., Newl<strong>and</strong>s, M.D., McCarthy, A. Editors: Use of foamed concrete in<br />
construction. pp 61-88. Thomas: London.<br />
Kearsley, E.P. (1996). The use of foamed concrete for affordable development in third world<br />
countries. In: Dhir R.K., McCarthy M.J. Editors: Appropriate concrete technology. pp 233-243. E&FN<br />
Spon: London.
395<br />
International <strong>Building</strong> & <strong>Infrastructure</strong> Technology Conference<br />
7-8 June 2011, Vistana Hotel, Penang, Malaysia<br />
Kearsley, E.P. & Mostert, H.F. (1997). Use of foam concrete in Southern Africa. In: Proceedings from<br />
the ACI international conference on high performance concrete. SP. 172 (48), pp 919-934.<br />
Kearsley, E.P. & Mostert, H.F. (2005). Opportunities for exp<strong>and</strong>ing the use of foamed concrete in the<br />
construction industry. In: Dhir, R.K., Newl<strong>and</strong>s, M.D., McCarthy, A. Editors: Use of foamed concrete in<br />
construction. pp 143-154. Thomas: London.<br />
Kearsley, E.P. & Wainwright P.J. (2001). The effect of high fly ash content on the compressive<br />
strength of foamed concrete. J. Cement Concr. Res. 31 (1), pp 105-112.<br />
Kearsley, E.P. & Wainwright P.J. (2001). Porosity <strong>and</strong> permeability of foamed concrete. J. Cement<br />
Concr. Res., 31 (5), pp 805-812.<br />
Kearsley, E.P. & Wainwright P.J. (2002). The effect of porosity on the strength of foamed concrete. J.<br />
Cement Concr. Res., 32 (2), pp 233-239.<br />
Kessler, H.G. (1998). Cellular lightweight concrete. pp 56-60. Concrete Engineering International.<br />
Nambiar, E.K.K. & Ramamurthy, K. (2006). Models relating mixture composition to the density <strong>and</strong><br />
strength of foam concrete using response surface methodology. J. Cement Concr. Compos. 28 (9), pp<br />
752-760.<br />
Nambiar, E.K.K. & Ramamurthy, K. (2006). Influence of filler type on the properties of foam concrete.<br />
J. Cement Concr. Res. 28 (5), pp 475-80.<br />
Narayanan, N. & Ramamurthy, K. (2000). Prediction relations based on gel-pore parameters for the<br />
compressive strength of aerated concrete. Concr. Sc. Eng. 1 (2), pp 206-212.<br />
Ramamurthy, K., Nambiar, E.K.K. & <strong>and</strong> Ranjani G.I.S. (2009). A classification of studies on properties<br />
of foam concrete. J. Cement Concr. Compos. 31 (6), pp 388-396.<br />
Sach, J. & Seifert, H. (1999). Foamed concrete technology: possibilities for thermal insulation at high<br />
temperatures. CFI Forum of Technology. DKG. 76 (9), pp 23-30.<br />
Valore, R.C. (1954). Cellular concrete Part 1 Composition <strong>and</strong> methods of production. J. American<br />
Concrete Institute. 50, pp 773-796.<br />
Van Deijk, S. (1991). Foamed Concrete. Concrete. pp 49-54, July/August.<br />
Van Deijk, S. (1992). Foamed Concrete. A Dutch View. Pp 2-8. BRE.<br />
Visagie, M., <strong>and</strong> Kearsely E.P. (2002). Properties of foamed concrete as influenced by air-void<br />
parameters. pp 8-14. Concrete/Beton.
T195<br />
396<br />
International <strong>Building</strong> & <strong>Infrastructure</strong> Technology Conference<br />
7-8 June 2011, Vistana Hotel, Penang, Malaysia<br />
DEFECT MANAGEMENT FOR THE HIGH RISE OFFICE TOWER<br />
Idris Othman 1 <strong>and</strong> Nadia Azman 2<br />
1,2 Universiti Teknologi Petronas, Malaysia<br />
1 idrisothman@yahoo.com<br />
ABSTRACT: Construction defects had addresses as big issues in construction industries. It has been<br />
proved many big projects have a history of failure with non-completion, massive delay <strong>and</strong> cost<br />
overruns. Too excessive defects in the building incurred high cost for maintenance. Commonly major<br />
defects which keep happening must be managed correctly or else it will become worse. Many factors<br />
actually contributed to the occurrence of defects, <strong>and</strong> these factors need to be well managed in order<br />
to reduce defective works. Moreover, the issues <strong>and</strong> problem faced by building professional when they<br />
deal with defects become one of the obstacles in managing defects. Thus, good construction defect<br />
management must be adopted by all the building professional because excessive cost of defects may<br />
be reduced or eliminated by only putting some effort <strong>and</strong> investing small amount of money at initial<br />
stage.<br />
Keywords: construction defects, maintenance, building professional<br />
1. INTRODUCTION<br />
Major construction works are often crucial to the success of the individual enterprises <strong>and</strong> to society as<br />
a whole. Such society often embraces the building, civil <strong>and</strong> heavy engineering sectors. Many major<br />
construction works have a history of failure with non-completion, or massive delay <strong>and</strong> cost overruns.<br />
Some completed projects have too many defects <strong>and</strong> raise the construction cost because defects<br />
were continuous. Ignorance in construction defects management from the beginning cause big losses<br />
in the project. Excessive major defects happened in the building will incurred high maintenance cost<br />
for rectification works <strong>and</strong> directly raise the construction cost. In fact, this high maintenance cost may<br />
be eliminated by only investing small amount of money at the initial stage if the designers really<br />
underst<strong>and</strong> the root cause of this matter.Moreover, there were many problem faced by the developer,<br />
contractor <strong>and</strong> other building professional when they deal with defects. This problem includes those<br />
from management side <strong>and</strong> construction side. If these problems left without any solution, it will make<br />
the defects problem become worse. Too many defects in the building will lower down the aesthetic<br />
value of the building <strong>and</strong> the occupier in the building will feel uncomfortable. Hence, construction<br />
defects management is very vital <strong>and</strong> essential in every project to ensure the success completion of<br />
the building.<br />
2. BACKGROUND<br />
2.1 Construction Defects<br />
Robert (2007) stated that the trial courts have recognized that construction defects are tangible <strong>and</strong><br />
can typically be grouped into the following three major categories:<br />
a) Design Deficiencies<br />
Poor performance of the design professionals, such as architects or engineers. The motivation for the<br />
design may be form, function, aesthetics, or cost considerations, but the completed design could result<br />
into a defect. Typical problem identified are related to roofing which due to their design complexity,<br />
pitched or flat, which make them prone to leaks. A majority of roofing problems are a direct result of
397<br />
International <strong>Building</strong> & <strong>Infrastructure</strong> Technology Conference<br />
7-8 June 2011, Vistana Hotel, Penang, Malaysia<br />
the improper specification of building materials, which can result in water penetration, intrusion or<br />
other problems.<br />
b) Material Deficiencies<br />
Inferior building material used might cause significant problems <strong>and</strong> fail to perform even when it had<br />
installed properly. Leaking windows are a common defect <strong>and</strong> prevention requires good workmanship.<br />
Window leaks can result from many things including, rough framing not being flush with outside at<br />
openings, improperly flashed windows, improperly applied building paper, window frame racked during<br />
storage or moving, lack of sheet metal drip edge above window header <strong>and</strong> other causes. Common<br />
manufacturer problems with building materials can include deteriorating flashing, building paper,<br />
waterproofing membranes, asphalt roofing shingles, particle board, inferior drywall <strong>and</strong> other wall<br />
products used in wet <strong>and</strong>/or damp areas, such as bathrooms <strong>and</strong> laundry rooms.<br />
c) Construction Deficiencies (Poor Quality or Subst<strong>and</strong>ard Workmanship)<br />
Poor quality of workmanship often results in water intrusion through some portion of the building<br />
structure. Cracks in foundations, floor slabs, walls, dry rotting of wood or other building materials,<br />
termite or other pest infestations, electrical <strong>and</strong> mechanical problems, <strong>and</strong> plumbing leaks.<br />
d) Subsurface / Geotechnical Problems<br />
Soil investigation has to be done properly to determine the type of soil before any development can<br />
begin. This important to ensure the stable <strong>and</strong> strong foundation is provided. Moreover, problems such<br />
as subsidence, expansion, slope failure, flooding <strong>and</strong> l<strong>and</strong>slide will take place if the subsurface<br />
condition is not well determined. These types of conditions typically lead to cracked foundations, floor<br />
slabs, <strong>and</strong> other damage to a building. A worst-case scenario in some instances could render a<br />
building uninhabitable, as well as uninsurable.<br />
2.2 Major Construction Defects<br />
There are many types of existed construction defects which include structural, architectural, <strong>and</strong><br />
mechanical <strong>and</strong> electrical defects. Some of the defects are occurred in less number, however some of<br />
them occur so frequently. This type of defect known as major defects. Web dictionary also defined<br />
major defect as defects which cause serious malfunctioning of a product. Additionally, defects are<br />
common in construction projects <strong>and</strong> it will definitely happen no matter how much care design<br />
professional has taken. But, what matter the most is when the defects occurs so excessively. These<br />
might lead to severe problems as the result of major defects. One of defects that listed under major<br />
defects was water issues related problems such as water intrusion <strong>and</strong> water leaking.<br />
Chew et al. (1993) describe many defects have escalated with the growing dem<strong>and</strong>s of buildings. The<br />
fragmented nature of the building <strong>and</strong> the construction process was found to be the major contributing<br />
factor.<strong>Building</strong> defects was an issue if the defects are too excessive which include rain penetration,<br />
condensation, cracking <strong>and</strong> detachment. Wet area of high rise building in Singapore has recorded<br />
escalating numbers of defects <strong>and</strong> has become the bane of the effective building maintenance within<br />
the limited budget set by the building’s owners. Average of 35%-50% of annual maintenance cost<br />
needed for building maintenance from the total maintenance cost. This matter indicates that excessive<br />
defects problem may lead to the increase in project cost.According to research done by Chew et al,<br />
(1993) on maintainability of wet area of non residential building (National University of Singapore).<br />
From their study, they discussed on some important findings which are the implication of key factors of<br />
building maintainability <strong>and</strong> the occurrence of 14 most common defects found in wet area. Problems<br />
area evaluated includes water leakage from ceiling, staining or discoloration, paint defects, fungi <strong>and</strong><br />
algae growth, pipe leakage <strong>and</strong> corrosion, <strong>and</strong> cracking of concrete. From this study, it can be<br />
concluded that water issues problem was listed as one of the major defects which normally occurred in<br />
the building. This can be proven by the figure below which shown the fourteen (14) major construction<br />
defects that has been identified.
398<br />
International <strong>Building</strong> & <strong>Infrastructure</strong> Technology Conference<br />
7-8 June 2011, Vistana Hotel, Penang, Malaysia<br />
Figure 1. Frequency of the major construction defects identified.<br />
Figure 1 shows the frequency of the major construction defects identified in wet area. Water leakage<br />
defects are listed in 3 categories out of 14 most major defects identified in wet area, these includes<br />
water defects through cracks, pipe penetration, <strong>and</strong> joints.They also did an analysis of variance<br />
(ANOVA) to test the equality of different population means <strong>and</strong> to examine the extend of defects in<br />
different types of building. This statistical analysis was conducted with the help of Statistical Package<br />
for Social Sciences (SPSS).<br />
Figure 2. The extend of defects
399<br />
International <strong>Building</strong> & <strong>Infrastructure</strong> Technology Conference<br />
7-8 June 2011, Vistana Hotel, Penang, Malaysia<br />
From the Figure 2 above regarding the analysis of the extend of defects, water issues related defects<br />
did recorded high value of extend which means these defects may grow severe if no correct action<br />
taken by the owner. This study has shown that water leakage extend of defects has ranked the<br />
highest, followed by corrosion of pipes <strong>and</strong> spalling of concrete. By these findings, it may serves as<br />
benchmark for building professional to underst<strong>and</strong> the defects at the initial stage to prevent <strong>and</strong><br />
minimize its occurrence later <strong>and</strong> hence reduce wastage on the necessary maintenance work.<br />
Wong et al.(2005) had done a research on water seepage in multi storey buildings had addressed the<br />
major issues <strong>and</strong> suggests the solution to solve the water seepage <strong>and</strong> health related problems in high<br />
rise building. From this study, they concluded that water seepage complaint was difficult to be h<strong>and</strong>led<br />
by the government. There was a consent that causes of the defects are very difficult to be traced <strong>and</strong><br />
lack of cooperation among individual owners lead to building neglect. Moreover, effective research on<br />
“Performance of Constructed Facilities” done by Chong (2006) had looked on the failure mechanism<br />
that caused design related-defects <strong>and</strong> the design parameters that could prevent these defects. It was<br />
found that three most design related failure causes were load <strong>and</strong> moisture from wet area, weather<br />
impact <strong>and</strong> impact from occupants after a 9-month building survey was conducted on 74 buildings.<br />
They also found that insufficient consideration for these failures causes to be the key in preventing<br />
these defects. The design strategies that could successfully prevent triggering these defects include<br />
aligning material performance against adverse weather condition, preventing impacts from occupant<br />
<strong>and</strong> loads <strong>and</strong> also, preventing water leakage, improve specification <strong>and</strong> improved design clarity. From<br />
this research, they conclude that defects continue to be repeated as designers failed to obtain<br />
important feedback from property managers. Designer also should encourage themselves to explore<br />
new ideas <strong>and</strong> keep the database whereby defects could be traces <strong>and</strong> mistakes avoided in their next<br />
design.<br />
3. METHODOLOGY<br />
3.1 Research Methodology<br />
The research methodology adopted for this projects are shown in Figure 3. The methodology was<br />
divided into three phase which are preliminary phase, data collection phase, <strong>and</strong> data analysis phase.<br />
In preliminary phase, the related problem will be identified by go through the literature review <strong>and</strong><br />
research paper of previous study. Next, the primary <strong>and</strong> secondary data will be collected to be<br />
analyzed in the data collection phase. Finally, all the data collected will be analyzed to achieve the<br />
objective <strong>and</strong> the required results.<br />
PRELIMINARY PHASE<br />
Identify Problem Related<br />
Literature Review<br />
Objective Problem Statement Scope of Study<br />
Primary Data<br />
(Interview/Survey + Site<br />
Inspection)<br />
RESEARCH METHODOLOGY<br />
DATA COLLECTION PHASE<br />
DATA ANALYSIS PHASE<br />
•Objective achieve<br />
•Result <strong>and</strong> Discussion<br />
•Thesis Writing<br />
Figure 3. Research Methodology<br />
3.2 Interview <strong>and</strong> Survey Questions<br />
Secondary Data<br />
(Literature Review)<br />
The secondary data was obtained by conduct the case study is by interviewing, distributing survey<br />
question, <strong>and</strong> site inspection. An informal interview has been arranged with the project manager,<br />
contractors <strong>and</strong> parties which involved in this project during the construction phase to identify in detail
400<br />
International <strong>Building</strong> & <strong>Infrastructure</strong> Technology Conference<br />
7-8 June 2011, Vistana Hotel, Penang, Malaysia<br />
about the construction defect, how the defect occurs <strong>and</strong> solution taken. Project Managers also will be<br />
interviewed to obtain his opinion regarding management approaches of overcoming construction<br />
defects problems. On top of that, architect, interior designer, <strong>and</strong> other professional firm that involved<br />
in the construction project will also be interviewed to gain a broad underst<strong>and</strong>ing on construction<br />
defects regarding on their respective fields. Among the contractor, developer, architect firm, quantity<br />
surveyor <strong>and</strong> other firm that involved in the said project. From the survey, the issues, problem faced<br />
<strong>and</strong> factor that related to defects may be analyzed. The analysis will adopted qualitative measurement<br />
by the Average Index rating where respondent has been asked to answers the surveys according to<br />
the level of agreement which rating from:<br />
From the survey, the analysis of the defects problem will be completed by using the Average Index<br />
formula which is shown in Equation 1:<br />
Average Index (AI) = � * n<br />
Equation 1<br />
Where :- � is the weighing given to each factor by respondent<br />
n is the frequency of the respondents<br />
N is the total number of respondents<br />
With the rating scale as below (Majid & McCaffer, 1997)<br />
1 = Never/Totally disagree (1.00 Average Index < 1.50)<br />
2 = rarely/disagree (1.50 Average Index < 2.50)<br />
3 = Sometimes/Neutral (2.50 Average Index < 3.50)<br />
4 = Often/agree (3.50 Average Index < 4.50)<br />
5 = Very often/strongly agree (4.50 Average Index < 5.00)<br />
3.3 Site Inspection<br />
The author participates in site inspection held by the developer. The defect inspection involves the<br />
building owner, contractor, architect, <strong>and</strong> consultants. From the defect inspection, all parties involved<br />
analyzed <strong>and</strong> discussing the existing defect occurs in the building. The argument happens on how the<br />
rectification method will be <strong>and</strong> when it can be taken. The inspection was done for each floor levels.<br />
When defects were detected, it will be noted on the floor plan drawings for the reporting purpose.<br />
4. Result <strong>and</strong> Discussion<br />
4.1 Site Defect Inspection<br />
1 Strongly disagree<br />
2 Disagree<br />
3 Moderately<br />
4 Agree<br />
5 Strongly agree<br />
From the case study of the said project which the author had analyzed, the Author had found that<br />
there were many commonly major construction defects which usually occurred in new building. The<br />
construction defects include defects in structural, utilities <strong>and</strong> appliances, building codes <strong>and</strong><br />
construction, internal <strong>and</strong> external building, <strong>and</strong> facade.<br />
N
401<br />
International <strong>Building</strong> & <strong>Infrastructure</strong> Technology Conference<br />
7-8 June 2011, Vistana Hotel, Penang, Malaysia<br />
As stated in the scope of study, the author identifies the commonly major construction defects. The<br />
elaborations below indicate the certain construction defects exist at the case study area during the<br />
inspection of defect work attended by the client <strong>and</strong> developer.<br />
� RCC Construction Defects<br />
It is necessary to achieve the perfect quality of RCC after castig.RCC can fail due to inadequate<br />
strength or reduction of durability due to improper casting, <strong>and</strong> some of the structures are not properly<br />
watertight. These lead to the intrusion of water. All structural members as beams, slabs, columns,<br />
retaining walls must retained their full strength <strong>and</strong> need to be water tight.<br />
� Windows<br />
Defects associated with windows most often have to do with leaks, which can be a result of poor<br />
installation. This means the windows were not flashed properly, or the window product itself is<br />
defective <strong>and</strong> leaking. In many homes windows are difficult to operate. This can be a sign of soil<br />
settlement, structural deficiencies or just a bad product. <strong>Building</strong> inspector investigates the windows by<br />
performing several different tests to determine whether or not a particular window is leaking. If it leaks,<br />
we then remove a small area of stucco or siding to better underst<strong>and</strong> the cause of the leak<br />
� Brick walls-subst<strong>and</strong>ard<br />
Quality of masonary work, poor workmanship <strong>and</strong> lack of supervision will cause the cracks in<br />
masonary work,give dampness to the structure, create an unleveled surface as shown in Figure 4.<br />
Figure 4. Brick wall cracks<br />
� Plumbing <strong>and</strong> pump defects<br />
Plumbing defects are commonly found include dripping faucets, leaking fixtures, slow drains. There<br />
are several pressure inlets <strong>and</strong> outlets in sewer <strong>and</strong> water lines consisting of several plumbing fixtures,<br />
T bends, Lbends, several traps, <strong>and</strong> so on. All this sources <strong>and</strong> junctions are to be properly sealed,<br />
ass otherwise there is every possibility of corrosion as shown in Figure 5 <strong>and</strong> Figure 6.<br />
Figure 5. Pump in water pump room leaks.(Image courtesy from MRCB Eng Sdn Bhd)
402<br />
International <strong>Building</strong> & <strong>Infrastructure</strong> Technology Conference<br />
7-8 June 2011, Vistana Hotel, Penang, Malaysia<br />
Figure 6. The sprinkler point at office area broke <strong>and</strong> flooded the whole office levels.(Image courtesy<br />
of MRCB Eng Sdn Bhd)<br />
� Floor trap clogging<br />
� Ceiling access opening off position<br />
� Water seep through the slap(pipe sleeve)<br />
� Ceiling stains<br />
Caused by past or present leaks, ceiling stains are very common. It can be difficult to tell whether the<br />
stains are from leaks still present, or were caused by leaks which have since been repaired.<br />
� Electrical hazards<br />
Most common in older homes, but often found in newer homes as well. Electrical hazards come in<br />
many forms, from ungrounded outlets, subst<strong>and</strong>ard use of materials, incorrect wiring by the electrician<br />
- Power surges. Causes flickering of lights.<br />
- Breakers tripped.<br />
- Bulb burn out on power up.<br />
- GFCI breakers are not wired. Incorrect wiring.<br />
- Receptacles do not work.<br />
- Switches do not work<br />
- Inadequate loading over the entire building.<br />
- Burning smell<br />
� Rotted wood caused by being wet for extended periods of time, most commonly found around<br />
tubs, showers <strong>and</strong> toilets inside.<br />
� These are the set of miscellaneous defects.<br />
- Mold growth. Growth throughout the home from various causes.<br />
- House built with defective products (Masonite). Siding, plumbing, roofing materials many with<br />
recalls or lawsuits against them.<br />
From the Inspection of Defects Work form collected, all major <strong>and</strong> minor defects are summarized in<br />
this form. Since the author study only limited to major construction defects which involved water issues<br />
related problem, hence the defects list are simplified into major construction defects occur at the case<br />
study area.For the month of April 2010, there were 26 major defects reported <strong>and</strong> 12 cases out of 26<br />
are related to water issues problem. This give the percentage of water issued related defects is<br />
46.15%, approaching nearly half of the total defects occurred.(refer to the appendices).The result<br />
obtained indicates the percentage of water issues related defects which exist at the case study area.<br />
Even though the results are quite apparent, it is proven that water issues related defects are creating<br />
major problem in the building. Thus, detail survey need to be done to obtained more accurate <strong>and</strong><br />
competitive result.From the survey question distributed to all the respondent, the outcomes are<br />
summarized in Table 1.
Table 1. Problems <strong>and</strong> Issues Related to Defects<br />
No. Problems <strong>and</strong> issues related to defects<br />
403<br />
International <strong>Building</strong> & <strong>Infrastructure</strong> Technology Conference<br />
7-8 June 2011, Vistana Hotel, Penang, Malaysia<br />
Average<br />
Index<br />
1 Clogging Problem(Floor Traps, Sanitary Fittings <strong>and</strong> others) 3.9 4<br />
2 Waterproofing Failure 4 3<br />
3 Mechanical <strong>and</strong> Electrical Equipment Breakdown 3.3 7<br />
4 Water seeps through structures(wall, slab, floor <strong>and</strong> others) 4.6 1<br />
5 Leakage(Sprinkler Pipe, Pipe, Plumbing, interior <strong>and</strong> others) 4.1 2<br />
6 Construction Joint failure 3.4 6<br />
7 Structural Cracks 3.8 5<br />
8 Unevenness(wall, column, slab <strong>and</strong> others) 3.1 9<br />
9 Stained mark(bubbling plaster/water stain <strong>and</strong> others) 3 10<br />
10 Chipped or Spalling 3.2 8<br />
Rank<br />
The problems <strong>and</strong> issues related to defects are presented by the Figure 4.4 below to give clear view of<br />
the Average Index value<br />
Figure 6. Average Index on Problem <strong>and</strong> Issues Related to Defects<br />
According to Table 1 <strong>and</strong> Figure 6, all the respondents agrees that the entire problems <strong>and</strong> issues<br />
related to defects which listed are the major defects that happen at the site, where average index from<br />
3 to 4.6 was achieved. Noted also that water related defects are the most commonly major defects<br />
that happened at the site where it achieved Average Index (AI) from 3.9 to 4.6 which includes under:<br />
� Water seeps through the structures(wall, slab floor)<br />
� Leakage problem(Pipe, plumbing, interior leakage)<br />
� Water proofing failure<br />
� Clogging problems(Floor Traps, Sanitary Fittings <strong>and</strong> others)
404<br />
International <strong>Building</strong> & <strong>Infrastructure</strong> Technology Conference<br />
7-8 June 2011, Vistana Hotel, Penang, Malaysia<br />
The occurrence commonly major defects in the building bring many problems to the building<br />
professionals. Thus well defects management have to be adopted by these parties.<br />
5. CONCLUSIONS<br />
As the conclusion, this study has achieved all the objectives that have been stated earlier. Most of the<br />
respondents agree that the entire problems listed are the major defects that occurred at the building.<br />
Out of that, water defect related issues rated as the major defects which mostly happened with<br />
Average Index value from 3.9 to 4.6 was obtained. Moreover, this study also achieves the objective to<br />
determine the problems faced by the building professional. All the respondents agreed that most of the<br />
problems listed are really the problems which they faced except for unsuitable rectification works<br />
adopted. These problems have to be solved <strong>and</strong> well manage in order to reduce defects.<br />
REFERENCES<br />
Abdul-Rahman, H. (1993), capturing the cost of quality failures in civil engineering, International<br />
Journal of Quality & Reliability Management, Vol. 10 No. 3,<br />
Abdulmohsen A.H <strong>and</strong> Sadi A.(1997), The effect of faulty design on building maintenance, King Fahd<br />
University of Petroleum <strong>and</strong> Minerals, Saudi Arabia.<br />
Australian St<strong>and</strong>ard AS 4349.1 (1995), Inspection of <strong>Building</strong>s: Part 1: Property Inspections<br />
Residential <strong>Building</strong>s, St<strong>and</strong>ards Association of Australia, Australia.<br />
Chung H.W. (1999), Underst<strong>and</strong>ing Quality Assurance in Construction; A Practical Guide to ISO 9000”<br />
E & FN SPON, New York.<br />
Robert S.M, (2007), Defect Free <strong>Building</strong>: A Construction Manual for Quality Control <strong>and</strong> Conflict<br />
Resolution, New York: McGraw-Hill Book Co.<br />
Seow E.O (1997), <strong>Building</strong> defects, warranties <strong>and</strong> project financing, MCB University Press,<br />
Chong W.K, Low S.P. (2006), Performance of construction facilities:Latent <strong>Building</strong> Defects:Causes<br />
<strong>and</strong> Design to Prevent Them, vol 20, no 3.<br />
Chew M.Y.L, Nayanthara D.S, Tan S.S.(1993) , Maintainability of wet area of non-residential building,<br />
Department of <strong>Building</strong>, National University of Singapore, Singapore<br />
Walters M <strong>and</strong> Hasting E.M. (1998), The Problem of Managing Multi-ownership <strong>Building</strong>s in Hong<br />
Kong, Property Management, Vol 16, No 4,<br />
Joe T.Y, Wong, Eddie C.M. (2005), Water Seepage in Multi-Storey <strong>Building</strong>s,pg 595-596, Department<br />
of <strong>Building</strong> <strong>and</strong> Real Estate, The Hong Kong Polytechnic University, Hong Kong.<br />
Marcolini C.I,( 13 Sept 2010).<br />
(http://www.resource4constructiondefects.com/topics/whatareconstructiondefects.htm)<br />
Amaratunga, D. & Baldry, D. (2000). Theory <strong>Building</strong> in Facilities Management Research: Case Study<br />
Methodology. Proceedings of the Bizarre Fruit Postgraduate Conference. pp 107 – 123. University of<br />
Salford.UK<br />
Marsh, P., Rosser, E., Harre, R. (1978). The Rules of Disorder. London: Routledge <strong>and</strong> Kegan Paul.
T196<br />
405<br />
International <strong>Building</strong> & <strong>Infrastructure</strong> Technology Conference<br />
7-8 June 2011, Vistana Hotel, Penang, Malaysia<br />
ESTABLISHMENT AND DEVELOPMENT OF IBS IN MALAYSIA<br />
Mohammad Abedi 1 , Mohamad Syazli Fathi 2 <strong>and</strong> Abdul Karim Mirasa 3<br />
1,2,3 UTM RAZAK School of Engineering & Advanced Technology, Universti Teknologi<br />
Malaysia, International Campus, Kuala Lumpur, Malaysia<br />
1 abedm1385@yahoo.com, 2 syazli@ic.utm.my, 3 abdkarim@ic.utm.my<br />
ABSTRACT: Government of Malaysia has done a lot of effort to promote the usage of Industrialised<br />
<strong>Building</strong> System (IBS) as an alternative construction methods compare to conventional building<br />
system which is a more labour intensive. This paper describes the experiences of Malaysia in the<br />
adoption of industrialised building system (IBS) from the first level of establishment until its<br />
development along with various IBS definitions <strong>and</strong> categories. A comprehensive literature review<br />
from various sources was made to carry out the study. The idea of using IBS in Malaysia was first<br />
developed during the early sixties when the Minister of Housing <strong>and</strong> Local Government visited several<br />
European countries <strong>and</strong> evaluated their building systems performance. Then, in 1964, the government<br />
took a significant decision to implement one pilot projects using IBS concept which was launched on<br />
1966. The findings of this research illustrated the timeline of IBS establishment <strong>and</strong> development in<br />
Malaysia along with the significant consequences of IBS implementation in construction industry.<br />
Therefore, it is hoped that the finding of this research could assist professional parties in construction<br />
industry in providing a better knowledge ground for improving decisions making to achieve the<br />
success of IBS construction projects implementation that could be along with attaining the project<br />
objectives in terms of predetermined objectives that are mostly within the time, specified budget <strong>and</strong><br />
st<strong>and</strong>ard quality.<br />
Keywords: Industrialised <strong>Building</strong> System, Malaysia, IBS Roadmap, Project Objectives, CIDB.<br />
1. DEFINITION OF IBS<br />
Government of Malaysia has done a lot of effort to promote the usage of Industrialised <strong>Building</strong><br />
System (IBS) as an alternative construction method. Since the first project of IBS in year 1966, there<br />
has not been one absolute definition on Industrialised <strong>Building</strong> System (IBS) that could be describes<br />
the entire building construction system. However, there are several definitions by researchers who<br />
studied into building construction emphasizing on the concept on off-site construction (Pan, 2008) offsite<br />
production (Blismas, 2006), industrialized <strong>and</strong> automated construction (Warszawski, 1999), off-site<br />
manufacturing, prefabricated building, pre-assembled building (Gibb, 2003). Furthermore, IBS could<br />
be more elaborated by other definitions such as pre-cast building, pre-cast construction, nontraditional<br />
building, innovative building solutions <strong>and</strong> a Modern Method of Construction (MMC)<br />
(Goodier et al., 2007). Different definitions of IBS have been established by many researchers as<br />
illustrated in Table 1.
Table 1. Definitions of IBS<br />
Author IBS Definition<br />
Chung (2007)<br />
Rahman <strong>and</strong><br />
Omar (2006)<br />
Lessing et al.,<br />
(2005)<br />
Gibb (1999)<br />
Trikha (1999)<br />
Warszawski<br />
(1999)<br />
Esa <strong>and</strong> Nurudin<br />
(1998)<br />
Parid Wardi<br />
(1997)<br />
Junid (1986)<br />
Dietz, A.G.H<br />
(1971)<br />
406<br />
International <strong>Building</strong> & <strong>Infrastructure</strong> Technology Conference<br />
7-8 June 2011, Vistana Hotel, Penang, Malaysia<br />
Mass production of building components either in a factory or at site<br />
according to specifications with st<strong>and</strong>ard shapes <strong>and</strong> dimensions <strong>and</strong><br />
which are then transported to the construction site to be re-arranged with<br />
certain st<strong>and</strong>ards to form a building.<br />
A construction system that is built using pre-fabricated components. The<br />
manufacturing of the components is systematically done using machine,<br />
formworks <strong>and</strong> other forms of mechanical equipment.<br />
An integrated manufacturing <strong>and</strong> construction process with well planned<br />
organization for efficient management, preparation <strong>and</strong> control over<br />
resources used, activities <strong>and</strong> results supported by the used of highly<br />
developed components.<br />
Preassembly for a given piece of work; the organization <strong>and</strong> completion of<br />
a substantial proportion of its final assembly work before installation in its<br />
final position including forming any temporary work or pre-assembly <strong>and</strong> it<br />
can also be carried out on or offsite which would involve the st<strong>and</strong>ard<br />
coordination.<br />
Two definitions have been created:<br />
1) A system of construction that has been made to be mainly industrialized<br />
in its manner <strong>and</strong> process, such as the manufacturing of automotive<br />
components <strong>and</strong> furniture.<br />
2) A system in which concrete components are prefabricated at site or in a<br />
factory <strong>and</strong> are assembled to form the structure with minimum on-site<br />
construction.<br />
A set of interrelated elements that act together to enable the designated<br />
performance of the building.<br />
A continuum beginning from utilizing craftsmen for every aspect of<br />
construction to a system that make use of manufacturing production in<br />
order to minimize resource wastage <strong>and</strong> enhance value for end users.<br />
A system which uses industrialised production techniques either in the<br />
production of components or assembly of the building or both.<br />
A process, by which components of a building are conceived, planned <strong>and</strong><br />
fabricated, transported <strong>and</strong> erected at site. The system includes a balanced<br />
combination between software <strong>and</strong> hardware component. The software<br />
element includes system design, which is a complex process of studying<br />
the requirement of the end user, market analysis <strong>and</strong> the development of<br />
st<strong>and</strong>ardized components.<br />
Total integration of all subsystem <strong>and</strong> components into overall process fully<br />
utilizing industrialized production, transportation <strong>and</strong> assembly technique.<br />
The most significant, feasible <strong>and</strong> practical definition of IBS in Malaysia was introduced by the<br />
Construction Industry Development Board in Malaysia’s Roadmap of IBS (CIDB, 2003). CIDB defines<br />
IBS as a construction technique in which components are manufactured in a controlled environment<br />
(on or off site), transported, positioned <strong>and</strong> assembled into a structure with minimal additional site<br />
works. This research will use the definition by CIDB in categorising the building construction system.<br />
However, Industrialised <strong>Building</strong> System (IBS) is not new to the construction industry because it has<br />
just again become feasible <strong>and</strong> visible in Malaysia as a valuable solution to improve the construction<br />
industry mainly in terms of efficiency <strong>and</strong> productivity. In a larger view <strong>and</strong> open minded perception,<br />
IBS is further than implementing the construction project through prefabricated methods. According to<br />
Kamar et al., (2009), IBS is about the changing of conventional mindset, enhancing the capability,<br />
competency <strong>and</strong> value of human capital, developing better cooperation, team working <strong>and</strong> trust among<br />
the parties in construction industry, promoting intelligibility, innovation, transparency <strong>and</strong> most<br />
significantly the high integrity that will eventually enhance the productivity <strong>and</strong> efficiency within the<br />
construction industry. IBS has been identified as a potential method to improve overall construction<br />
performance in Malaysia in term of quality, cost effectiveness, safety <strong>and</strong> health, waste reduction,<br />
efficiency <strong>and</strong> productivity.
407<br />
International <strong>Building</strong> & <strong>Infrastructure</strong> Technology Conference<br />
7-8 June 2011, Vistana Hotel, Penang, Malaysia<br />
There are many benefits of Industrialised <strong>Building</strong> System (IBS) as a modern method of construction<br />
such as reduction in construction time, less site materials, better site management, minimal wastage,<br />
cleaner <strong>and</strong> neater environment, controlled quality, reduction of labour intensity, construction<br />
st<strong>and</strong>ardization, quality improvement <strong>and</strong> lower total construction costs that will eventually produce<br />
better products for the parties such as clients <strong>and</strong> contractors in construction industry (Kamar et al.,<br />
2009). The Malaysian government have implemented a lot of various significant efforts in to bringing<br />
the IBS for all professionals involved in the construction industry. One of these significant efforts is the<br />
establishment of IBS Roadmap 2003 -2010 that has been endorsed by the Government to be the<br />
blueprint document for the industrialisation of the Malaysian construction sector. The effort to promote<br />
the usage of IBS as a valuable (efficient <strong>and</strong> effective) alternative compare to conventional <strong>and</strong> labour<br />
intensive construction method should be more emphasized by the CIDB of Malaysia. Also, Kamar et<br />
al., (2009) asserted that although members of the industry are open to the idea, a major portion of the<br />
industry stakeholders are indifferent, perhaps due to resistance towards change, insufficient<br />
information <strong>and</strong> lack of technology transfer methods to support the feasibility of change to IBS.<br />
Successful IBS projects are Sekisui Home (Japan), Living Solution (United Kingdom), Open House<br />
(Sweden) <strong>and</strong> Wenswonen (Netherl<strong>and</strong>s) (Oostra & Joonson, 2007).<br />
According to Astr<strong>and</strong> (2002), the existing process of selecting innovative building systems or IBS can<br />
be divided into two main stages which are pre-occupancy <strong>and</strong> occupancy. Abdullah <strong>and</strong> Egbu (2010)<br />
stated that the decisions in pre-occupancy stage, (pre-design stage <strong>and</strong> design stage) are significantly<br />
valuable in terms of efficiency, effectiveness <strong>and</strong> productivity that will be made by stakeholders. These<br />
valuable decisions can be considered as combined, shared, united <strong>and</strong> consensus decision-making,<br />
because there is an efficient <strong>and</strong> well organized cooperation between the design teams <strong>and</strong> clients<br />
that will eventually discuss the best alternative for the building system to be implemented in the<br />
construction project. Furthermore, providing efficient, proper <strong>and</strong> adequate information beside the<br />
project knowledge will lead us to create <strong>and</strong> develop the best decision-making process. Knowledge<br />
based decision-making can reduce uncertainty for successful implementation of risk management that<br />
will facilitate the construction project parties to achieve the project objectives in terms of time, cost <strong>and</strong><br />
quality to eventually enhance the success of construction projects.<br />
2. ESTABLISHMENT AND DEVELOPMENT OF IBS IN MALAYSIA<br />
IBS in Malaysia has been established, introduced <strong>and</strong> applied in construction industry in order to deal<br />
with a growing dem<strong>and</strong> of affordable housing, solving issues associated with foreign workers <strong>and</strong><br />
improving quality, efficiency <strong>and</strong> productivity of construction industry. Nowadays, IBS has evolved <strong>and</strong><br />
implemented in hybrid construction projects to build national l<strong>and</strong>mark as significant valuable national<br />
assets. From the comprehensive literature review, establishment <strong>and</strong> development of IBS have been<br />
illustrated through the timeline as shown in Figure 1.<br />
First Pilot Project<br />
on IBS in Jalan<br />
Pekeliling, Kuala<br />
Lumpur<br />
1<br />
9<br />
6<br />
0<br />
1<br />
9<br />
6<br />
6<br />
1<br />
9<br />
6<br />
8<br />
1<br />
9<br />
7<br />
8<br />
1<br />
9<br />
7<br />
8<br />
Second Pilot IBS<br />
Project in<br />
Jalan Rifle Range,<br />
Penang<br />
The Idea of<br />
IBS in<br />
Malaysia<br />
Was<br />
Created<br />
The Ministry of Defense Build<br />
2800 Unit of Living Quarters<br />
at Lumut Naval Base<br />
MS 1064:<br />
Modular<br />
Coordination as<br />
Guideline for<br />
<strong>Building</strong> Design<br />
Tam an Tun<br />
Sardon, Penang<br />
1<br />
9<br />
8<br />
0<br />
1<br />
9<br />
9<br />
9<br />
IBS<br />
Strategic<br />
Plan<br />
The Penang<br />
State<br />
Government<br />
Launched<br />
Another 1200<br />
Units of<br />
Housing<br />
2<br />
0<br />
0<br />
1<br />
2<br />
0<br />
0<br />
3<br />
Manual for IBS<br />
Content<br />
Scoring<br />
Diterbitkan<br />
2<br />
0<br />
0<br />
4<br />
2<br />
0<br />
0<br />
6<br />
Construction Industry Master<br />
Plan 2006-1015<br />
IBS Roadmap 2003-2010<br />
IBS Roadmap<br />
Review 2008-2010<br />
IBS Centre<br />
Manual for IBS<br />
Content Scoring<br />
CIS 18 2010:<br />
Diterbitkan<br />
2<br />
0<br />
0<br />
7<br />
2<br />
0<br />
0<br />
8<br />
2<br />
0<br />
1<br />
0<br />
2<br />
0<br />
1<br />
1<br />
2<br />
0<br />
1<br />
5<br />
Approved by<br />
Cabinet on 9<br />
July 2010<br />
IBS Roadmap 2011-2015<br />
Figure 1. Establishment <strong>and</strong> Development of IBS Timeline in Malaysia
408<br />
International <strong>Building</strong> & <strong>Infrastructure</strong> Technology Conference<br />
7-8 June 2011, Vistana Hotel, Penang, Malaysia<br />
According to figure 1, various efforts have been adopted since the establishment of IBS in Malaysia on<br />
the early 1960’s. Furthermore, these efforts has been reviewed <strong>and</strong> improved for enhancing the<br />
efficiency, effectiveness <strong>and</strong> successful implementation of IBS until 2015.<br />
The usage of IBS in Malaysia has begun since early 1960’s in a low cost housing scheme when<br />
Ministry of Housing <strong>and</strong> Local Government of Malaysia visited several European countries <strong>and</strong><br />
evaluated their housing development program (Thanoon et al., 2003). After their visit in 1964, the<br />
Government had launched first pilot project on IBS to speed up the delivery time <strong>and</strong> built affordable<br />
<strong>and</strong> quality houses. Almost, 22.7 acres of l<strong>and</strong> along Jalan Pekeliling, Kuala Lumpur was dedicated to<br />
the project comprising seven blocks of 17-storey flats (3,000 units of low-cost flat <strong>and</strong> 40 shops lot).<br />
This project was awarded to JV Gammon & Larsen <strong>and</strong> Nielsen using Danish System of large panel<br />
pre-cast concrete wall <strong>and</strong> plank slabs. The project was completed within 27 months from 1966 to<br />
1968 including the time taken in the construction of the RM 2.5 million casting yard at Jalan<br />
Damansara (CIDB, 2006; CIDB, 2003 <strong>and</strong> Thanoon et al., 2003). In 1968, the Government of<br />
Malaysia launched a second housing project which was a six block of 17-storey flats <strong>and</strong> three blocks<br />
of 18-storey flats at Jalan Rifle Range, Penang. The project was awarded to Hochtief/ Chee Seng<br />
using French Estoit System (CIDB, 2006; CIDB, 2003 <strong>and</strong> Din, 1984).<br />
According to the two pilot projects, a performance comparison between the IBS system <strong>and</strong><br />
conventional system has been carried by Thanoon et al., (2003) in terms of cost, productivity, <strong>and</strong><br />
quality. It was discovered that the first pilot project incurred 8.1% higher cost than a similar building<br />
using conventional construction method, while the second project was 2.6% lower than conventional<br />
construction method. In term of construction speed, both projects required 27 months to complete,<br />
inclusive of time required to set up the recasting factories. Also, it was found that the quality of building<br />
finishes was better than the conventional construction method.<br />
Precast concrete is one of the main IBS category built in Malaysia since 1960s. However, according to<br />
Rahman <strong>and</strong> Omar (2006) these buildings were normally associated with pre-fabricated mass<br />
construction method, low quality buildings, leakages, ab<strong>and</strong>oned projects, unpleasant architectural<br />
appearances <strong>and</strong> other drawbacks. Among the earliest housing development project using IBS was at<br />
Taman Tun Sardon, Penang in 1978, (1,000 units of five-storey walk up flat). IBS pre-cast component<br />
<strong>and</strong> system in the project was designed by British Research Establishment for low cost housing in<br />
tropical countries (BRECAST system). A similar system was constructed almost at the same time at<br />
Edmonton, North London <strong>and</strong> about 20,000 BRECAST dwellings were constructed through out UK<br />
from 1964 to 1974 (CIDB, 2006).<br />
Rahman <strong>and</strong> Omar (2006) also indicated that due to the poor architectural design, the old prefabricated<br />
buildings have given the public, bad impression about precast concrete. There have been<br />
quite a number of cases where the use of IBS had lead to such drawbacks such as, in the case of<br />
Pekeliling Flats in Kuala Lumpur <strong>and</strong> Taman Tun Sardon, Gelugor, Penang. These two early prefabricated<br />
flats were constructed in mass to produce low cost accommodation for lower income<br />
groups. In the case of Taman Tun Sardon the design was very basic <strong>and</strong> not considering the aspect of<br />
serviceability such as the need for wet toilets <strong>and</strong> bathrooms. Lacking in this design consideration<br />
leads to problems of leakage that becomes the common issue with precast buildings. In addition, in<br />
many cases the low cost housing was not maintained properly, thus contributing further to the poor<br />
image of IBS buildings. Other important aspect is the quality inspection which in housing construction<br />
is one of the major factors that general contractors have to consider for improving customer<br />
satisfaction <strong>and</strong> raising their intake in the industry (Kim, Oha, et al., 2008).<br />
In 1978, the Penang State Government launched another 1200 units of housing using prefabrication<br />
technology. Two years later, the Ministry of Defense adopted large prefabricated panel construction<br />
system to build 2800 unit of living quarters at Lumut Naval Base (Trikha <strong>and</strong> Ali, 2004).<br />
Nevertheless, the industrialisation of construction at its beginning stage on the early 1960’s was never<br />
sustained. This issue could be due to failure of early closed fabricated system which made the<br />
professional parties in construction industry afraid of changing their construction method. Furthermore,<br />
other overseas systems that were introduced during 60s <strong>and</strong> 70s were found unsuitable for the<br />
Malaysia climate <strong>and</strong> social practices. Hence, newer technologies were constantly being introduced to<br />
the market such as wet joint systems that were identified to be more suitable choice for Malaysia<br />
tropical climate. For instance, it was better to utilise the bathroom types which were comparatively<br />
wetter than those types in the European countries (CIDB, 2005). In the period of 1980 till 1994 there is<br />
a huge gap of discontinuous <strong>and</strong> decreasing the IBS utilization towards developing <strong>and</strong> implementing<br />
the IBS. This could be because of problems in the leakage of IBS design that eventually contributing to
409<br />
International <strong>Building</strong> & <strong>Infrastructure</strong> Technology Conference<br />
7-8 June 2011, Vistana Hotel, Penang, Malaysia<br />
poor image of IBS buildings for construction industry. Also, this gap could be due to lack of clients <strong>and</strong><br />
contractors trust <strong>and</strong> interest to these IBS systems. IBS was not popular in 1980 to 1994. However,<br />
IBs become more popular in 1990’s when many Malaysian infrastructure <strong>and</strong> mega projects were build<br />
especially for the Commonwealth games in 1998. As a result in Malaysian construction industry during<br />
1994-1997, pre-cast, steel frame <strong>and</strong> other IBS were used as hybrid construction method to build<br />
national l<strong>and</strong>marks such as Bukit Jalil Sport Complex, Kuala Lumpur Convention Centre, Lightweight<br />
Railway Train (LRT) <strong>and</strong> Petronas Twin Towers (Kamar et al., 2009 <strong>and</strong> CIDB, 2006).<br />
According to Construction Industry Development Board (CIDB, 2005) based on the resolution which<br />
was made during the Colloquium of Industrialised Construction System in 1998, the CIDB eventually<br />
formed the IBS Steering Committee on 1999 for the effort to bring to the forefront all the IBS related<br />
issues in a framework to promote the greater usage of IBS in the construction industry <strong>and</strong> to drive the<br />
industry forward. The IBS Strategic Plan in 1999 was published as a result for establishment of this<br />
committee. After this significant effort in 2001, one early initiative was the introduction of the Modular<br />
Coordination Guideline for <strong>Building</strong> Designs (“MS1064”) which is essential for the adoption of IBS in<br />
the industry. This guideline was a public-private joint effort towards st<strong>and</strong>ardisation through modular<br />
coordination. However, this guideline was not made compulsory. The Construction Industry Master<br />
Plan 2006-2015 (CIMP 2006-2015) has been published in December 2006 as means to chart the<br />
future direction of the Malaysian Construction Industry. The importance <strong>and</strong> effort to promote IBS is<br />
highlighted under Strategic Thrust 5: Innovate through R&D to adopt new construction methods such<br />
as IBS in the Construction Industry Master Plan 2006-2015 (CIDB, 2007).<br />
These various significant efforts by the government to promote the usage of IBS as an alternative<br />
compare to the conventional method did not made significant progress. Therefore, the IBS Roadmap<br />
2003-2010 was developed <strong>and</strong> published to steer the direction of IBS implementation <strong>and</strong> promotion<br />
activities, guide the practitioners <strong>and</strong> policy makers on IBS related issues in ensuring the global<br />
competitiveness of Malaysian construction players through the efficient <strong>and</strong> effective usage of IBS. It is<br />
a systematic <strong>and</strong> coordinated blueprint which is mainly focused towards achieving totally an<br />
industrialized construction industry for Malaysia <strong>and</strong> achieving open building systems concept by the<br />
year 2010. The formulated roadmap is a comprehensive document that divided the IBS programme<br />
into a 5-M strategy (five main focus areas) that reflects the inputs needed to drive the programme<br />
which are Manpower, Materials, Management, Monetary <strong>and</strong> Marketing (CIDB, 2003).<br />
The various efforts by the government to promote the usage of IBS such as IBS Roadmap 2003-2010<br />
as a significant valuable alternative for construction industry on the end of 2010 did not achieve the<br />
goals of this roadmap. According to CIDB in Malaysia (CIDB, 2011), only one KPI (Monetary) out of<br />
the 5 measurable KPI’s was achieved. The KPI’s was categorized to Manpower (Reducing the<br />
percentage of foreign workers), Monetary (Enhancing the percentage of governmental construction<br />
projects using IBS), Materials (Increasing the numbers of IBS Manufacturers), Bumiputera<br />
Development (Increasing the numbers of Bumiputera IBS Manufacturers), Bumiputera Development<br />
(Increasing the numbers of Bumiputera IBS contractors or Installers). Hence, the new IBS Roadmap<br />
2011-2015 is developed by CIDB under consultation with the industry players to chart the way forward<br />
for IBS industry. On the other h<strong>and</strong>, Construction Industry Development Board (CIDB, 2011) have<br />
emphasized on four policy objectives including quality, efficiency, competency <strong>and</strong> sustainability<br />
leading to a sustainable IBS industry that will eventually contribute to the competitiveness of<br />
construction industry in Malaysia.<br />
The main goals for this IBS Roadmap 2011-2015 were encapsulated below:<br />
i. To sustain the existing momentum of 70% IBS content for public sector building projects<br />
through to 2015.<br />
ii. To increase the existing IBS content to 50% for private sector building projects by 2015.<br />
3. CLASSIFICATION OF IBS SYSTEM IN MALAYSIA<br />
In Malaysia, Construction Industry Development Board (CIDB, 2003) has classified the IBS system<br />
into 5 categories as follows:<br />
i). Precast concrete framed buildings,<br />
ii). Precast concrete wall system,<br />
iii). Reinforced concrete buildings with precast concrete slab,<br />
iv). Steel formwork system <strong>and</strong> v). Steel framed buildings <strong>and</strong> roof trusses.
4. ADVANTAGES AND DISADVANTAGES OF IBS<br />
410<br />
International <strong>Building</strong> & <strong>Infrastructure</strong> Technology Conference<br />
7-8 June 2011, Vistana Hotel, Penang, Malaysia<br />
Despite its plausible advantages <strong>and</strong> systematic implementation plan established trough the IBS<br />
Roadmap, numbers of barriers were identified as being potential hurdles to the implementation. One of<br />
the most important barriers to IBS Implementation in Malaysia is Awareness <strong>and</strong> Knowledge (Kamar<br />
et al., 2009). According to IBS Roadmap Review (CIDB, 2007) report, the adoption of IBS in Malaysia<br />
is a client driven. Client with a good knowledge <strong>and</strong> awareness of IBS benefit will surely encourage<br />
appointed designers to design building according to IBS. However, lack of awareness program to<br />
underst<strong>and</strong> client needs <strong>and</strong> giving correct information on IBS has contributing to a lack of interest<br />
from the client <strong>and</strong> decision makers (Rahman & Omar, 2006). Relatively, the low labor cost in<br />
Malaysia is the main root cause of the construction industry failing to reform <strong>and</strong> being complacent<br />
with the current systems of IBS, which if implemented will eventually enhance the level of productivity,<br />
efficiency, quality <strong>and</strong> safety (CIDB; IBS Roadmap Review, 2007). However, to be competitive at<br />
the international level <strong>and</strong> become globalized, it is important for the Malaysia construction industry to<br />
evolve, be well organized <strong>and</strong> prepared. This aim will be facilitated <strong>and</strong> achieved through enhancing<br />
the productivity, efficiency, quality <strong>and</strong> safety of construction industry. The advantages <strong>and</strong><br />
disadvantages of IBS can be also compared <strong>and</strong> justified with the conventional system, whereas,<br />
conventional construction methods that have proven to be more time consuming , wasteful, dangerous<br />
<strong>and</strong> messy are illustrated in table 2.<br />
Advantages of<br />
Industrialized<br />
<strong>Building</strong><br />
<strong>Systems</strong><br />
Disadvantages<br />
of<br />
Industrialized<br />
<strong>Building</strong><br />
<strong>Systems</strong><br />
Table 2. Advantages <strong>and</strong> Disadvantages of IBS<br />
1. Achieving Higher Quality through careful selection of material, use of<br />
advanced technology <strong>and</strong> strict quality assurance control (Thanoon et al.,<br />
2003).<br />
2. Faster Construction Time: Wisam (2005) asserted that faster completion of<br />
projects will be achieved due to advance off-site preparations <strong>and</strong> simplified<br />
installation process.<br />
3. High Cost Saving: Control in using materials, such as: steel, s<strong>and</strong>, <strong>and</strong><br />
timber will contribute in savings in material cost <strong>and</strong> savings in labor cost that<br />
will ultimately result in substantial savings on the overall cost of the project<br />
(Bing et al., 2001).<br />
4. Reduction of Unskilled Workers <strong>and</strong> Fewer Site Workers: Warszawski,<br />
(1999) indicated that IBS <strong>and</strong> particularly prefabrication takes place at a<br />
centralised factory, thus reducing labour requirement at site.<br />
5. Enhancing the Social Benefits: Reducing the dependency on foreign workers<br />
<strong>and</strong> reducing the money outflow <strong>and</strong> their social problems, low quality works,<br />
delays, <strong>and</strong> diseases (CIDB, 2009).<br />
6. Increased Environmental <strong>and</strong> Construction Site Cleanliness: According to<br />
Wisam (2005), this could be achieved through reduction of construction<br />
material at site <strong>and</strong> reduction of waste materials at site duo to casting in factory.<br />
7. Increasing the Safety: Implementing IBS will promote safe <strong>and</strong> systematic<br />
factory working environment as minimal workers, materials <strong>and</strong> construction<br />
waste is required on-site (CIDB, 2003).<br />
1. Higher Initial Investment Cost: IBS requires high initial investment capital for<br />
pre-casters to purchase new machinery, mould, importing foreign technology<br />
<strong>and</strong> wages of skilled workers (IBS Steering Committee, 2006; Thanoon et al.,<br />
2003; Rahman & Omar, 2006).<br />
2. The Industry is Uncompetitive Due to Lack of Open Collaboration:<br />
Contractors in Malaysia are obligate to close system <strong>and</strong> getting supply from<br />
the same manufacture throughout the construction (Chung & Kadir, 2007).<br />
3. Specialized Skills which Require more Time <strong>and</strong> Investment: This is due to<br />
intensive training <strong>and</strong> apprenticeship such as system integrator or assemblers<br />
(Thanoon et al., 2003; IBS Steering Committee, 2006; Rahman & Omar, 2006).
5. CONCLUSIONS<br />
411<br />
International <strong>Building</strong> & <strong>Infrastructure</strong> Technology Conference<br />
7-8 June 2011, Vistana Hotel, Penang, Malaysia<br />
Industrialised <strong>Building</strong> <strong>Systems</strong> (IBS) is a construction process that utilizes techniques, products,<br />
components, or building systems which involves mainly the prefabricated components <strong>and</strong> onsite<br />
installation. Successful <strong>and</strong> effective implementation of IBS in Malaysia construction industry can offer<br />
various benefits compare to conventional in-situ systems. Those are: the speed of construction, less<br />
wastage of materials which means cost savings, reduction of unskilled workers, better quality control<br />
of construction, increased site cleanliness <strong>and</strong> safety in construction projects. These are very<br />
important aspects in achieving the efficient <strong>and</strong> effective construction industry which will enhance the<br />
market share of construction industry as well as contributing to the Malaysian economy. The<br />
government has done a lot of efforts to enhance the current conventional, labor-intensive activities to a<br />
more technologically advanced method of construction such as by developing the Industrialised<br />
<strong>Building</strong> <strong>Systems</strong> (IBS) through the Construction Industry Development Board (CIDB). The<br />
government had efforts in creating the 1 st <strong>and</strong> 2 nd IBS Roadmap to put Malaysia construction industry<br />
in producing fast, cost effective <strong>and</strong> high quality construction products <strong>and</strong> able to compete with the<br />
global construction market.<br />
REFERENCES<br />
Astr<strong>and</strong>, N. (2002). Selection Model to Choose Innovation <strong>Building</strong> System for Progressive Housing.<br />
Unpublished PhD Thesis, Canada, National Library of Canada.<br />
Abdullah, M R <strong>and</strong> Egbu, C. (2010). Selection criteria framework for choosing industrialized building<br />
systems for housing projects. 26th Annual ARCOM Conference, Leeds, UK, Association of<br />
Researchers in Construction Management, 1131-1139.<br />
Blismas,N., Christine Pasquire <strong>and</strong> Alistair Gibb. (2006). Benefits evaluation for off-site production in<br />
construction. Construction Management <strong>and</strong> Economics, 24, 121-130.<br />
Bing, L., Kwong, Y.W., <strong>and</strong> Hao, K.J. (2001). Seismic behaviour of connection between precast<br />
concrete beams. CSE Research Bulletin, No.14.<br />
Chung, L. P. & Kadir, A. M. (2007). Implementation Strategy for Industrialized <strong>Building</strong> System. PhD<br />
thesis, Universiti Teknologi Malaysia (UTM), Johor Bahr.<br />
CIDB Malaysia. (2003). IBS Roadmap (2003-2010), Construction Industry Development Board (CIDB),<br />
Kuala Lumpur, Malaysia.<br />
CIDB Malaysia. (2003). IBS Survey, Construction Industry Development Board (CIDB), Kuala Lumpur,<br />
Malaysia.<br />
CIDB Malaysia. (2005). Modular Construction in Construction Industry; IBS Digest. CIDB, Kuala<br />
Lumpur, Malaysia.<br />
CIDB Malaysia. (2006). IBS Survey 2005: Survey on Malaysian Architects’ Experience in IBS<br />
Construction, Kuala Lumpur. Kuala Lumpur: Construction Industry Development Board, Malaysia.<br />
CIDB Malaysia. (2006). Industrialised <strong>Building</strong> <strong>Systems</strong> in Malaysia. Construction Industry<br />
Development Board, Malaysia.<br />
CIDB Malaysia. (2006). Minute Meeting of IBS Steering Committee. Construction Industry<br />
Development Board (CIDB), Kuala Lumpur, Malaysia (unpublished).<br />
Construction Industry Development Board (CIDB). (2007). “Construction Industry Master Plan (CIMP<br />
2006- 2010).” Construction Industry Development Board (CIDB), Kuala Lumpur, Malaysia.<br />
CIDB Malaysia. (2007). IBS Roadmap Review (Final Report), IBS Centre, Construction<br />
Industry Development Board (CIDB), Kuala Lumpur, Malaysia (unpublished).<br />
CIDB Malaysia. (2009). Manual for IBS Content Scoring System (IBS SCORE). Construction Industry<br />
Development Board (CIDB), Kuala Lumpur, Malaysia.<br />
Construction Industry Development Board (CIDB). (2011). Transformation of Construction Industry<br />
through Industrialized <strong>Building</strong> System (IBS) Roadmap (2011-2015). Available at:<br />
http://www.pam.org.my/Library/notes/ibs_roadmap_2011-2015_-_PAM_21122010.pdf [Accessed 28<br />
April 2011].
412<br />
International <strong>Building</strong> & <strong>Infrastructure</strong> Technology Conference<br />
7-8 June 2011, Vistana Hotel, Penang, Malaysia<br />
Dietz, A.G.H. (1971). As stated in Jaafar, S., et al. (2003), Global Trends in Research, Development<br />
<strong>and</strong> Construction. Proceeding of The International Conference On Industrilised <strong>Building</strong> System (IBS<br />
2003), CIDB.<br />
Esa, H., And Nurudin.M.M. (1998). Policy on Industrialized <strong>Building</strong> System in Collocoqium, R. O.<br />
(Ed.) Kuala Lumpur, CIDB.<br />
Gibb, A. (1999). Offsite Fabrication, Whittles Publishing, Scotl<strong>and</strong>, UK.<br />
Gibb, A. G. F. <strong>and</strong> Isack, F. (2003). Re-engineering through pre-assembly: client expectations <strong>and</strong><br />
drivers. <strong>Building</strong> Research <strong>and</strong> Information, 31(2), 146-60.<br />
Goodier C. & Gibb, A. (2007). <strong>Future</strong> opportunities for off-site in the UK. Construction Management<br />
<strong>and</strong> Economic, 25 (6), 585-595.<br />
Hassim, S., M.S. Jaafar <strong>and</strong> S.A.A.H. Sazalli. (2009). The contractor perception towers industrialized<br />
building system risk in construction projects in Malaysia. American Journal of Applied Sciences, 6 (5),<br />
937-942.<br />
Junid, S. (1986). Industrilised <strong>Building</strong> System. Proceeding of UNESCO/FEISEAP regional workshop.<br />
Kamar, K. A. M. , Alshawi, M. <strong>and</strong> Hamid, Z. (2009). Barriers to industrialized building system (IBS):<br />
the case of Malaysia. Paper Proceedings in BuHu 9th International Postgraduate Research<br />
Conference (IPGRC) Salford, United Kingdom.<br />
Kim, Y.S., S.W.Oha, et al. (2008). “A PDA <strong>and</strong> wireless Web-Integrated System for Quality Inspection<br />
<strong>and</strong> Defect Management of Apartment Housing Projects.” Automation in Construction, 17(2), 163-179.<br />
Lessing, J., Ekholm, A. <strong>and</strong> Stehn, L. (2005). Industrialized Housing – Definition <strong>and</strong> Categorization of<br />
the Concept. 13th International Group for Lean Construction, Australia, Sydney.<br />
Oostra, M., Joonson, C., C. (2007). Best practices: Lesson Learned on <strong>Building</strong> Concept (edited by)<br />
Kazi, A. S., Hannus, M., Boudjabeur, S., Malone, A. (2007), Open <strong>Building</strong> Manufacturing – Core<br />
Concept <strong>and</strong> Industrial Requirement’, Manubuild Consortium <strong>and</strong> VTT Finl<strong>and</strong> Publication, Finl<strong>and</strong>.<br />
Pan W., Gibb, A., Dainty, A. R. J. (2008). Perspectives of UK housebuilders on the use of offsite<br />
modern method of construction. Construction Management <strong>and</strong> Economic, 25 (2), 183-194.<br />
Parid Wardi. (1997). As stated in Jaafar, S., et al., (2003), Global Trends in Research, Development<br />
<strong>and</strong> Construction. Proceeding of The International conference On Industrilised <strong>Building</strong> System (IBS<br />
2003), CIDB.<br />
Rahman, A. B., And Omar.W. (2006). Issues <strong>and</strong> Challenge in the Implementation of IBS in Malaysia.<br />
6th Asia Pacific Structural Engineering <strong>and</strong> Construction Conference (ASPEC 2006). Kuala Lumpur,<br />
Malaysia.<br />
Thanoon , W. A. M., Peng, L. W., Abdul Kadir, M.R., Jaafar, M.S <strong>and</strong> Salit, M.S. (2003). The<br />
Experiences of Malaysia <strong>and</strong> Other Countries in Industrialised <strong>and</strong> Automated <strong>Building</strong> System in<br />
Malaysia. Proceeding on IBS Seminar, UPM, Malaysia.<br />
Trikha, D. N., <strong>and</strong> Ali, A. A. A. (2004). Industrialized <strong>Building</strong> System (First ed.). Kuala Lumpur:<br />
Universiti Putra Malaysia Press.<br />
Trikha, D.N. (1999). Industrilised building system: prospects in Malaysia. Proceeding of World<br />
Engineering Congress, Kuala Lumpur, Malaysia.<br />
Warszawski, A. (1999). Industrialized <strong>and</strong> Automated <strong>Building</strong> <strong>Systems</strong>: E <strong>and</strong> F N Spoon.<br />
Wisam Mohamed S. Masod. (2007). Simulation of allocation activities of logistic for semi precast<br />
concrete construction. Case Study, UTM, Johor, Malaysia.
T197<br />
413<br />
International <strong>Building</strong> & <strong>Infrastructure</strong> Technology Conference<br />
7-8 June 2011, Vistana Hotel, Penang, Malaysia<br />
PROPERTIES OF GYPSUM PLASTERBOARDS AT ELEVATED TEMPERATURES<br />
Hanizam Awang 1 , Md Azree Othuman Mydin 2<br />
1,2 School of Housing, <strong>Building</strong> <strong>and</strong> Planning, Universiti Sains Malaysia, 11800, Penang<br />
1 hanizam@usm.my , 2 azree@usm.my<br />
ABSTRACT: Gypsum plasterboard based systems are among those now extensively used, as walls<br />
or ceilings. Gypsum plasterboards are principally employed as lining material in light-weight<br />
construction, which is a competent <strong>and</strong> cost effective technique of providing flexible partitioning<br />
assemblies in commercial <strong>and</strong> residential buildings. The thickness of the gypsum plasterboard lining<br />
<strong>and</strong> the configuration of the framing can be flexibly changed to meet specified fire performance<br />
requirements. The use of such systems is increasing every day <strong>and</strong> there dem<strong>and</strong>s to be more<br />
research on their properties <strong>and</strong> behaviour. This paper will presents the properties of gypsum board<br />
which will includes the assemblies <strong>and</strong> st<strong>and</strong>ard fire tests <strong>and</strong> the thermal properties of gypsum in<br />
general <strong>and</strong> includes suggested properties of gypsum by different researchers.<br />
Keywords: gypsum board, thermal properties, elevated temperatures, fire<br />
1. INTRODUCTION<br />
Gypsum plasterboards are mainly used as sheet material lining in light-weight constructions, namely<br />
Light Steel Framing (LSF) <strong>and</strong> Light Timber Framing (LTF). A typical wall assembly of drywall<br />
construction is shown in Figure 1. Such walling systems consist of steel studs or wood studs with one<br />
or two gypsum plasterboards fixed to each side of the studs. The cavity between the boards are filled<br />
with insulation layers or left empty. The insulation materials commonly used in the cavity are glass<br />
fibre, rock wool <strong>and</strong> cellulose fibre.<br />
Figure 1. A typical gypsum plasterboards wall assembly<br />
Each board is composed of a non-combustible gypsum core with paper-laminated surfaces which<br />
provide tensile strength to the lining. Gypsum contains chemically bound water <strong>and</strong> a small
414<br />
International <strong>Building</strong> & <strong>Infrastructure</strong> Technology Conference<br />
7-8 June 2011, Vistana Hotel, Penang, Malaysia<br />
amount of free water, which play a key role in the performance of the assembly at elevated<br />
temperatures.<br />
During a fire, when gypsum plasterboards is heated up to about 100°C, a great amount of heat is<br />
absorbed to drive off water. This process therefore delays the development of temperature rise<br />
through gypsum until the entire board is dehydrated. The consequent temperature plateau is the<br />
basis of gypsum plasterboards systems fire resistance as shown in Figure 2.<br />
Figure 2. Temperature development on the unexposed side of a gypsum plasterboard with 25mm<br />
thickness subjected to a st<strong>and</strong>ard cellulosic fire.<br />
2. FIRE RESISTANCE<br />
To identify fire resistance of a system, building codes <strong>and</strong> regulations rely on st<strong>and</strong>ard fire test<br />
procedures. Fire resistance is then defined as the duration for which a fire protection system can<br />
endure a st<strong>and</strong>ard fire test until it reaches failure criteria. Failure is considered as loss of either fire<br />
separating function or load bearing function <strong>and</strong> categorized as insulation (excessive temperature rise<br />
on the unexposed surface), integrity (fire spread through fissures <strong>and</strong> openings) <strong>and</strong> stability<br />
(structural collapse) criteria.<br />
Figure 3. Time-temperature curves for st<strong>and</strong>ard fires according to BS476<br />
In a st<strong>and</strong>ard fire test, the elements of interest are subjected to increasing temperatures governed by a<br />
specified temperature-time relationship (BS476, 1987). It should be noted that st<strong>and</strong>ard fire curves are<br />
attempts to classify construction elements, although they might not represent fire scenarios in real<br />
world. In general building uses, the cellulosic fire condition is applied. Hydrocarbon fires are more
415<br />
International <strong>Building</strong> & <strong>Infrastructure</strong> Technology Conference<br />
7-8 June 2011, Vistana Hotel, Penang, Malaysia<br />
likely to occur in petrochemical industry. The two fire curves are plotted in Figure 3. As can be seen<br />
from the plots, hydrocarbon fire has a steep initial temperature rise to 1100°C, simulating fast reaction<br />
of hydrocarbons.<br />
3. HEAT TRANSFER<br />
Heat transfer through drywall assembly is a combination of all three modes of conduction, convection<br />
<strong>and</strong> radiation (Figure 4) as below:<br />
� Path 1: Heat transfer from the furnace (fire) to the exposed side of gypsum is by convection <strong>and</strong><br />
radiation, with radiation being the more dominating.<br />
� Path 2: Heat transfer through gypsum is by conduction. However, as gypsum is a porous material,<br />
heat transfer through gypsum is a combination of all three modes: conduction through the solid<br />
<strong>and</strong> convection <strong>and</strong> radiation through the pores. Therefore thermal conductivity of porous<br />
materials like gypsum is an empirical factor that helps to describe the combined heat transfer<br />
based on Fourier law (conduction), <strong>and</strong> it might be called the effective thermal conductivity. This<br />
effective thermal conductivity can be affected by many factors, such as temperature, density,<br />
moisture content <strong>and</strong> porosity of the material. Such sensitivity then describes the diverse data<br />
reported by several research studies directed towards the determination of the effective<br />
conductivity of these materials. Developing a method to quantify the effective thermal conductivity<br />
of gypsum is one of the main objectives of this research.<br />
� Path 3: Heat transfer from the cavity side of the exposed gypsum to the cavity gas is by<br />
convection <strong>and</strong> radiation.<br />
� Path 4: Heat transfer from the cavity gas to the cavity side of the unexposed gypsum is again by<br />
convection <strong>and</strong> radiation.<br />
� Path 4: Heat transfer through the unexposed gypsum is by conduction.<br />
� Path 5: Heat transfer from the unexposed gypsum to ambient environment is by convection <strong>and</strong><br />
radiation, with convection dominating at lower temperatures.<br />
It should be noted that in insulated assemblies, the insulation materials also contribute to heat<br />
transfer through the system. However, their change in volume should be considered in the<br />
analysis, since they burn away easily after a certain temperature is reached (depending on the<br />
material used).<br />
Figure 4. Heat transfer modes through gypsum plasterboard assemblies.<br />
4. PROPERTIES OF GYPSUM PLASTERBOARDS AT ELEVATED TEMPERATURES<br />
The key material in drywall construction which provides the fire resistance is gypsum. Therefore it is<br />
important to study thermal <strong>and</strong> material properties of gypsum. This section first describes some of<br />
gypsum’s main thermal properties as studied by various researchers.
416<br />
International <strong>Building</strong> & <strong>Infrastructure</strong> Technology Conference<br />
7-8 June 2011, Vistana Hotel, Penang, Malaysia<br />
4.1 SPECIFIC HEAT<br />
The specific heat of gypsum at different temperatures has been investigated by several researchers<br />
(Figure 5). Having known water dissociates from gypsum in two phases, it is not surprising that<br />
specific heat experiences two peaks. The results from different studies agree well on the first peak<br />
(corresponding to the first reaction) to occur at about 100°C. However, there is inconsistency on the<br />
temperature at which the second reaction takes place as well as the value of the peaks.<br />
Figure 5. Specific heat of gypsum plasterboards according to various researchers (Thomas, 2002)<br />
Harmathy (1998) reports a peak of 7.32 kJ/kg.°C at 100°C <strong>and</strong> although he does not give<br />
measurements over 630°C, his results shows a peak of 2 kJ/kg.°C at this temperature which indicates<br />
the second reaction. Andersson <strong>and</strong> Jansson (1987) provide peak values of 52.2 kJ/kg.°C <strong>and</strong> 19.2<br />
kJ/kg.°C at 110°C <strong>and</strong> 210°C, respectively. Mehaffey et al (1994) first conditioned the specimens at<br />
40°C for 24 hours in an attempt to drive off free moisture <strong>and</strong> then used a differential scanning<br />
calorimeter at two scanning rates of 2°C/min <strong>and</strong> 20°C/min. The results showed a peak of 29 kJ/kg.°C<br />
at 95°C when the slower scanning rate was used, <strong>and</strong> a peak of 14 kJ/kg.°C at 140°C when the faster<br />
scanning rate was employed, while the area under both peaks was about 500 kJ/kg, corresponding<br />
closely to the values in section 2.5.1 (100+356=456 kJ per kg of gypsum). Mehaffy et al measured<br />
specific heat up to 200°C, thus no second peak was observed. Sultan reports the first peak of 18.5<br />
kJ/kg.°C occurring at 125°C <strong>and</strong> the second peak of 3.07 kJ/kg.°C at 670°C. The specific heat at<br />
ambient temperature is the base value when no reaction occurs. This base value is reported to be<br />
0.88 kJ/kg.°C by Harmathy, 0.95 kJ/kg.°C by Mehaffey et al <strong>and</strong> taken as 0.7 kJ/kg.°C by Andersson<br />
<strong>and</strong> Jansson. Since specific heat of gypsum shows sharp peaks, in some finite element modelling, the<br />
use of enthalpy is preferred to separate values for specific heat <strong>and</strong> density to avoid numerical<br />
instability (Thomas, 2002).<br />
4.2 DENSITY<br />
Mehaffey et al (1994) used thermogravimetric analysis (TGA) at a scanning rate of was 20°C/min to<br />
determine the changes in mass of 10-30 mg specimens of gypsum (Type X) with temperature. The<br />
result is demonstrated in Figure 6. As can be seen, between 100°C to 160°C about 17.5% of the initial<br />
mass is lost, which indicates the first dehydration reaction <strong>and</strong> the release of water of crystallization<br />
(0.75x21%=15.75%) as well as the evaporation of the free water (less than 3%). They also noticed a<br />
mass loss at 650°C which corresponds to the second dehydration reaction.
417<br />
International <strong>Building</strong> & <strong>Infrastructure</strong> Technology Conference<br />
7-8 June 2011, Vistana Hotel, Penang, Malaysia<br />
Figure 6. Mass loss in gypsum with rising temperatures (Mehaffey et al, 1994)<br />
Mehaffey et al (1994) report the initial density of the 15.9mm Type X gypsum plasterboard as 648<br />
kg/m 3 . However, the density of the gypsum core of different gypsum plasterboards at ambient<br />
condition varies from type to type <strong>and</strong> also from different manufacturers. A study by Thomas at al<br />
(2005) on a large number of Type X gypsum plasterboard samples shows that the density of 12.5mm<br />
<strong>and</strong> 15.8mm boards varies largely both within <strong>and</strong> between manufacturers. The mean value of the<br />
densities ranges from 687 kg/m 3 to 811 kg/m 3 .<br />
4.3 THERMAL CONDUCTIVITY<br />
The determination of the thermal conductivity of gypsum is quite complicated due to the effects of<br />
moisture <strong>and</strong> radiation in the pores. Gypsum from different sources or manufacturers varies in<br />
microstructure, <strong>and</strong> methods employed to measure its thermal conductivity also differ. As a result the<br />
values reported by different studied vary widely (especially at temperatures above 500°C);<br />
nevertheless follow a similar trend. Figure 7 shows thermal conductivity of gypsum versus temperature<br />
given by a few studies. The symbols represent measured values <strong>and</strong> the lines represent modified<br />
curves used in models to provide good calibration between numerical <strong>and</strong> experimental results.<br />
Andersson <strong>and</strong> Jansson (1987) used the Transient Hot Strip (THS) method which measures the<br />
resistance of a metal strip embedded in the material <strong>and</strong> derives the thermal conductivity of the<br />
material. Their results for thermal conductivity of gypsum is quite isolated compared to others.<br />
Harmathy (1988) used a variable state scanning technique with relatively small temperature gradients.<br />
His results are very much in agreement with Mehaffey at al’s who used the TC-31 thermal conductivity<br />
meter (Mehaffey et al, 1994).<br />
Figure 7. Thermal conductivity of gypsum versus temperature (Thomas, 2002)
418<br />
International <strong>Building</strong> & <strong>Infrastructure</strong> Technology Conference<br />
7-8 June 2011, Vistana Hotel, Penang, Malaysia<br />
Thomas (2002) mentions that the significant increase in thermal conductivity of gypsum at<br />
temperatures above 800°C is to allow for the opening of cracks <strong>and</strong> ablation of gypsum, since the<br />
testing method used by Mehaffey at al prevents the cracks from opening up in the board. It can also<br />
cover accelerated radiations in the voids at high temperatures: As mentioned before, heat transfers<br />
through the pores of gypsum is by convection <strong>and</strong> radiation. At high temperatures water is migrated<br />
from pores <strong>and</strong> the radiation through pores becomes significant (since it is proportional to temperature<br />
to the power three), which highly improves the heat transfer.<br />
4.4 EXPANSION (SHRINKAGE)<br />
Figure 8. Contraction of gypsum as a function of temperature (Mehaffey et al, 1994)<br />
Figure 8 shows the shrinkage of gypsum plasterboard <strong>and</strong> gypsum core against temperature<br />
according to NRCC (National Research Council of Canada). When subjected to high temperatures,<br />
gypsum core experiences significant shrinkage. In addition, at temperature range of about 200-350°C<br />
the paper laminates on the sides of gypsum core burn off. Thus the thickness of the board (gypsum<br />
<strong>and</strong> paper) is also reduced. This significant reduction needs to be considered when modelling the<br />
structure, since it will eventually cause the formation of cracks as well as the opening of the joints.<br />
Both these effects might hugely influence the heat transfer through the system.<br />
Vermiculite, a natural mineral, is commonly used as an additive to the gypsum core to mitigate the<br />
effect of shrinkage. Vermiculite exp<strong>and</strong>s with the application of heat, partly offsets the contraction of<br />
gypsum <strong>and</strong> therefore enhances the performance of the system in fire. Glass fibre is also a reinforcing<br />
agent which bridges shrinkage cracks <strong>and</strong> attempts to sustain the integrity of gypsum plasterboard<br />
during calcinations (Gerlich, 1995).<br />
4.5 ABLATION<br />
Given sufficient time under heat or exposure to fire, some materials undergo physical <strong>and</strong> chemical<br />
changes, which results in bonding reduction of the material <strong>and</strong> removal of successive thin layers from<br />
its surface. This process is referred to as ablation. With rising temperatures the exposed surface of<br />
gypsum loses water <strong>and</strong> turns into calcium sulphate anhydrite, which falls off the unaltered substrate.<br />
As heat penetrates through the thickness, more material transforms to anhydrite powder <strong>and</strong><br />
consecutive layers are shed. Using glass fibre reinforcements delays the ablation of the exposed<br />
surface. Thomas (2002) observed ablation at about 700°C for normal gypsum plasterboard <strong>and</strong><br />
1000°C for fibre reinforced board. It is also worth noting that ablation is of greater importance for thin<br />
boards compared to thick ones, as a larger proportion of the material is shed off. To include ablation in<br />
numerical analysis, one can simulate the reduction in thickness of the material, however, it is more<br />
convenient to modify thermal conductivity value (increase the value at high temperatures) to allow for
419<br />
International <strong>Building</strong> & <strong>Infrastructure</strong> Technology Conference<br />
7-8 June 2011, Vistana Hotel, Penang, Malaysia<br />
the effects of ablation. Nevertheless, since ablation occurs at high temperatures, its effect would be<br />
small.<br />
5. CONCLUSIONS<br />
This chapter has provided a review of relevant literature on fire resistance of gypsum systems,<br />
focusing on the determination of gypsum thermal properties. There exist quite a large number of<br />
studies on this subject, each considering some aspects of the problem, which verifies the breadth of<br />
the matter <strong>and</strong> ongoing dem<strong>and</strong> for more accurate <strong>and</strong> efficient approaches.<br />
It is clear that there are large discrepancies in results of thermal properties of gypsum from different<br />
investigators <strong>and</strong> there is a need to develop a method to help manufacturers to extract relevant<br />
specific thermal properties of their specific gypsum products. These thermal properties can then be<br />
implemented in numerical models to generate results to evaluate the effectiveness of different new<br />
products before committing great resources to expensive full scale fire testing, which is the current<br />
practice. Since these properties are mainly to be used in numerical modelling, they do not need to<br />
represent the precise actual values. Provided the numerical analysis procedure is correct, the thermal<br />
property values used in numerical modelling should be those which give calculation results in<br />
agreement with experimental results of temperature developments in gypsum. This will often require<br />
an iterative process, therefore, the closer the thermal properties of gypsum to their actual values are<br />
used in numerical analysis, the better the agreement between numerical <strong>and</strong> experimental results.<br />
ACKNOWLEDGMENTS<br />
The authors would like to acknowledge Universiti Sains Malaysia (<strong>USM</strong>) as a funding body for this<br />
study under <strong>USM</strong>-RU Grant No. 1001/PPBGN/814073. Acknowledgement is also made to the<br />
academic members <strong>and</strong> staff of the School of Housing, <strong>Building</strong> <strong>and</strong> Planning, Universiti Sains<br />
Malaysia for all their supports <strong>and</strong> guidance.<br />
REFERENCES<br />
Andersson, L. <strong>and</strong> Jansson, B. (1987). Analytical Fire Design with Gypsum; A Theoretical <strong>and</strong><br />
Experimental Study. Lund: Institute of Fire Safety Design.<br />
BS476. (1987) Fire tests on building materials <strong>and</strong> structures, Part 20: Method for determination of the<br />
fire resistance of elements of construction (general principles).<br />
Gerlich, J.T. (1995). Design of Loadbearing Light Steel Frame Walls for Fire Resistance. Fire<br />
Engineering Research Report 95/3, School of Engineering, University of Canterbury<br />
Harmathy, T.Z. (1988). The SFPE H<strong>and</strong>book of Fire Protection Engineering. Society of Fire Protection<br />
Engineers/National Fire Protection Association: Boston.<br />
Mehaffey, J.R., Cuerrier, P., <strong>and</strong> Carisse, G.A. (1994). A Model for Predicting Heat Transfer through<br />
Gypsum-Board/Wood-Stud Walls Exposed to Fire. Fire <strong>and</strong> Materials, Volume 18, pp 297-305.<br />
Thomas, G. (2002). Thermal Properties of Gypsum Plasterboard at High Temperatures. Fire <strong>and</strong><br />
Materials. 26, pp 37-45.<br />
Thomas, R., Sultan, M., <strong>and</strong> Latour, J. (2005). Impact of the Variability of Type X Gypsum Board. Fire<br />
Research NRCC-47635, National Council of Canada
T198<br />
420<br />
International <strong>Building</strong> & <strong>Infrastructure</strong> Technology Conference<br />
7-8 June 2011, Vistana Hotel, Penang, Malaysia<br />
INVESTIGATING THE STRENGTH OF SELF COMPACTING CONCRETE<br />
INCORPORATING LOW AND MODERATE VOLUME CEMENT REPLACEMENT<br />
USING RAW RICE HUSK ASH<br />
Md Nor Atan 1 <strong>and</strong> Hanizam Awang 2<br />
1,2 Universiti Sains Malaysia, Pulau Pinang, Malaysia<br />
1 mdnor_atan@yahoo.com , 2 hanizam@usm.my<br />
ABSTRACT: This paper investigates the use of ‘raw’ rice husk ash in binary <strong>and</strong> ternary selfcompacting<br />
concrete mixtures. Raw ash is preferred in this study, as against treated ash used in most<br />
other studies, for its economic advantage as well as for ensuring the robustness of self-compacting<br />
concrete mixtures. It is found that replacing 15% by mass of ordinary Portl<strong>and</strong> cement with raw rice<br />
husk ash produces comparable strengths with normal concrete. It is also found that replacing 30% by<br />
mass of ordinary Portl<strong>and</strong> cement with blends of raw rice husk ash-limestone powder <strong>and</strong> raw rice<br />
husk ash-pulverized fuel ash produce almost similar strengths as the 15% replacement with raw rice<br />
husk ash. It is concluded that rice husk ash may be employed in its raw form to replace ordinary<br />
Portl<strong>and</strong> cement in low <strong>and</strong> medium volume cement replacement.<br />
Keywords: self-compacting concrete, ternary blend, mineral additives<br />
1. INTRODUCTION<br />
Concrete is the most widely used material in the construction industry because it is mouldable <strong>and</strong><br />
versatility; it bears excellent fire <strong>and</strong> weather resistant property, it is good in compression <strong>and</strong> although<br />
weak in tension but can be strengthened with reinforcements <strong>and</strong> above all, it is relatively cheap. But,<br />
when faced with issues of productivity, economy, quality <strong>and</strong> environment, concrete must meet new<br />
<strong>and</strong> higher dem<strong>and</strong>s. One direction in this evolution is towards self-compacting concrete (SCC), a<br />
modified product that without any additional compaction energy, flows <strong>and</strong> consolidate under the<br />
influence of its own weight. SCC offers many advantages for the precast <strong>and</strong> pre-stressed concrete<br />
industry as well as cast in-situ construction such as; low noise-level in the plants <strong>and</strong> construction<br />
sites, elimination of problems associated with vibration, less labour involved, faster construction<br />
duration, improved quality <strong>and</strong> durability <strong>and</strong> higher strength (Ouchi et al., 2003).<br />
However, fresh SCC is a sensitive mix strongly dependent on the composition <strong>and</strong> characteristics of<br />
its constituents. It has to possess the incompatible properties between high flow-ability <strong>and</strong> high<br />
segregation resistance. This balance is made possible by the dispersing effect of high-range waterreducing<br />
admixture combined with the cohesiveness produced by a high concentration of fine particles<br />
(Esping, 2007). The latter is achievable by incorporating inert mineral filler <strong>and</strong>/or supplementary<br />
cementitious materials (SCM), collectively termed as mineral additives.<br />
Incorporating mineral additive in SCC production allows the cement content to be regulated, which<br />
helps protect <strong>and</strong> preserve the environment from greenhouse gases associated with cement<br />
production process. In terms of fresh SCC rheology; regulating the cement content reduces heat of<br />
hydration <strong>and</strong> thermal shrinkage (The European Project Group, 2005). Furthermore, some additives<br />
are found in by-products of other processes <strong>and</strong> their use in concrete production keeps these<br />
materials from l<strong>and</strong> fill (Neuwald, 2010).<br />
Fine limestone powder (LP) is most commonly used as mineral filler material due to its ability in<br />
enhancing many aspects of cement-based system through its physical or chemical characteristics.<br />
The physical characteristic is associated with the fineness of its individual particles which enhances<br />
packing density <strong>and</strong> reduces interstitial voids. The chemical aspect includes supplying ions into the<br />
phase solution which modifies the kinetics of hydration <strong>and</strong> the morphology of the hydration products<br />
(Turkel <strong>and</strong> Altuntas, 2009). An investigation has shown that partial replacement of cement by equal
421<br />
International <strong>Building</strong> & <strong>Infrastructure</strong> Technology Conference<br />
7-8 June 2011, Vistana Hotel, Penang, Malaysia<br />
volume of LP varying from 5% to 20% resulted in enhanced fluidity <strong>and</strong> reduced yield stress (Yahia et<br />
al. 1999 cited in Turkel <strong>and</strong> Altuntas, 2009).<br />
On the h<strong>and</strong>, SCM is a class of mineral based material which possess pozzolanic reactivity <strong>and</strong>/or<br />
latent hydraulic reactivity (Kurtis, 2002). Hydraulic cement reacts chemically with water to form hydrate<br />
compounds (C-S-H) that have cementing property <strong>and</strong> calcium hydroxide (lime) that does not<br />
contribute to cementing property. Pozzolanic reaction is a chemical reaction with calcium hydroxide<br />
(lime) <strong>and</strong> water that leads to the formation of cementitious product, C-S-H. Many of the beneficial<br />
effects of SCM are the effects they have on the pore structure through micro-filler effect (increased<br />
packing of cementitious particles), increased C-S-H (replacing porous lime with C-S-H) <strong>and</strong> wall effect<br />
(densifying the interfacial transition zone at the cement-aggregate interface <strong>and</strong> pore blocking (which<br />
occurs because of the combination of the former two factors).<br />
There are two types of SCM; processed/manufactured (e.g. fly ash, silica fume <strong>and</strong> slag) <strong>and</strong> natural<br />
(produced from natural mineral deposits <strong>and</strong> e.g. volcanic ash, shales etc or requires heat treatment<br />
e.g. rice husk ash, metakaolin, calcined clay etc). Fly ash (FA), also called pulverized-fuel ash, is a byproduct<br />
of coal burning power plants. FA has a slow rate of hydration thus provides very little<br />
cementing values at early age but at later ages cementing activity becomes apparent <strong>and</strong><br />
considerable. Because of this FA is sometimes used to reduce heat of hydration <strong>and</strong> to lengthen<br />
setting time. The spherical particle shape produces ball bearing effect which increases fluidity <strong>and</strong><br />
reduces water requirement (Kurtis 2002).<br />
Rice husk ash (RHA) is by-product of rice husk used as bio-fuel for the parboiling process in rice<br />
milling plants. It is a highly reactive SCM classified as super pozzolan (silica content > 85%). The way<br />
in which RHA improves workability is as follows; if well distributed in the cement paste, RHA particles<br />
segment the bleed water channels <strong>and</strong> consequently prevent bleeding <strong>and</strong> segregation. The physical<br />
effect, follows the chemical effect involving the pozzolanic reaction, fills up empty spaces <strong>and</strong> causes<br />
densification (pore refinement) <strong>and</strong> strengthening of the microstructure, particularly in high porous <strong>and</strong><br />
least cracking resistant interfacial zone in the vicinity of coarse aggregate particles (Sinhania, 2004). It<br />
was reported that replacement up to 20% of cement with RHA improves the quality of concrete at age<br />
above 60 days (Ahmadi et al., 2007).<br />
However, the use of single additive component (binary mix) could also pose some issues with<br />
workability <strong>and</strong> strength development (Kurtis, 2002). In order to hinder the disadvantages of single<br />
additive component (especially in high volume cement replacement), one or more mineral additives<br />
can also be added forming ternary or quaternary mixtures (Sahmaran et al., 2006). The main purpose<br />
for using multiple additives, especially in high volume cement replacement (HVCR) is to enhance<br />
particles packing. This is because HVCR could result in strength reduction because even when SCM<br />
is used to replace cement, its pozzolanic reaction alone may not be sufficient to offset for the strength<br />
loss (Kurtis, 2002). For example, FA particles are not much smaller than cement particles; by adding<br />
particles smaller than those of cement <strong>and</strong> FA (such as silica fume or limestone powder), enhances<br />
the particle packing because the intermediate spaces between cement <strong>and</strong> FA particles could only be<br />
filled by smaller particles. Enhanced particle packing could provide significant effect on strength <strong>and</strong><br />
durability performances of HVCR concrete.<br />
The main objective of this study is to investigate the effects of replacing ordinary Portl<strong>and</strong> cement<br />
(OPC) with rice husk ash (RHA) in binary <strong>and</strong> ternary mixtures. In binary mixtures, 15% by mass of<br />
OPC is replaced with RHA while in ternary mixtures, 30% by mass of OPC is replaced with RHA/LP<br />
<strong>and</strong> RHA/FA blends. In order to evaluate the effect of RHA addition (replacement), one control mix<br />
without mineral additive <strong>and</strong> two binary SCC mixes without RHA were also prepared.<br />
The uniqueness of this study is in the use of ‘raw’ RHA instead of ‘ground’ RHA as used in most other<br />
studies. Raw RHA is obtained direct from milling plant <strong>and</strong> used in its original form without undergoing<br />
further treatment (grinding or sieving). The use of raw RHA is hoped to produce a robust SCC product<br />
i.e. a product which is not susceptible to minor variation in physical <strong>and</strong> chemical composition of its<br />
constituent materials.<br />
Rice husk ash (raw or ground) is a renewable agro by-product. Its application in SCC production<br />
provides economical <strong>and</strong> environmental benefits in terms of cost effectiveness, waste management<br />
<strong>and</strong> reduction of atmospheric pollution. Hence the Author strongly suggests that stakeholders of<br />
cement <strong>and</strong> concrete industry should at least review with renewed interest, studies that have been<br />
done pertaining to the use of RHA in cement <strong>and</strong> concrete production processes.
422<br />
International <strong>Building</strong> & <strong>Infrastructure</strong> Technology Conference<br />
7-8 June 2011, Vistana Hotel, Penang, Malaysia<br />
2. METHODOLOGY<br />
The basic materials for SCC are binder paste, aggregates <strong>and</strong> high-range water-reducing agent<br />
(superplasticizer). In this study, the binder paste comprises of ordinary Portl<strong>and</strong> cement (OPC), mixing<br />
water, <strong>and</strong> three types of mineral additive i.e. inert mineral filler (LP), pozzolanic mineral byproduct<br />
(FA) <strong>and</strong> pozzolanalic natural byproduct (RHA). All materials were used as received from the<br />
respective local sources. The typical properties of OPC, LP, FA <strong>and</strong> RHA are as shown in Table 1.<br />
Crushed granite (G) was used as coarse aggregate with 4.75/12.75 grading <strong>and</strong> washed river s<strong>and</strong> (S)<br />
used as fine aggregate with 0/4.75 grading. Crushed granite content was fixed at 40% of the total<br />
aggregate content while the remainder 60% was washed river s<strong>and</strong>. Higher fine aggregate fraction as<br />
compared with coarse aggregate was employed so as to provide high volume of fine materials that<br />
would improve the stability SCC mixture. The chemical admixture used in this study was ADVA 181; a<br />
high range water-reducing polymer-based superplasticizer (SP) formulated in accordance with<br />
BS5075 Part 3:1985 specification.<br />
Table 1.The oxide compositions <strong>and</strong> the physical properties of ordinary Portl<strong>and</strong> cement (OPC), fine<br />
limestone powder (LP), pulverized fuel ash (FA) <strong>and</strong> rice husk ash (RHA)<br />
Oxide Composition (%)<br />
Silicone dioxide (SiO2)<br />
Aluminium oxide (Al2O3)<br />
Ferric oxide (Fe2O3)<br />
Calcium oxide (CaO)<br />
Magnesium oxide (MgO)<br />
Sulphur trioxide (SO3)<br />
Physical properties<br />
Specific gravity<br />
Specific surface area (m²/kg)<br />
Loss on ignition (%)<br />
Particle size (µm)<br />
Density (kg/m 3 )<br />
OPC LP FA RHA<br />
21.28<br />
5.60<br />
3.36<br />
64.64<br />
2.06<br />
2.1<br />
3.15<br />
295<br />
1.05<br />
5 - 45<br />
1506<br />
1.84<br />
1.37<br />
0.14<br />
52.98<br />
0.42<br />
0.08<br />
2.65<br />
320<br />
42.92<br />
10 - 1000<br />
1201<br />
56.2<br />
20.17<br />
6.69<br />
4.24<br />
1.92<br />
0.49<br />
2.2 – 2.4<br />
440<br />
1.34<br />
8.08 (mean)<br />
540 - 860<br />
92.99<br />
0.18<br />
0.43<br />
1.03<br />
0.35<br />
0.10<br />
2.13<br />
1620<br />
-<br />
25<br />
530<br />
The principles for the selection <strong>and</strong> proportioning of SCC constituents were based on guidelines laid<br />
out by the European Project Group while mix design was based on the rational method (EPG, 2005<br />
<strong>and</strong> Okamura et al., 2003). The mass of OPC for the control mix was fixed at 475 kg/m³.<br />
Subsequently; 15% of OPC was replaced with LP, FA or RRHA in binary mixes <strong>and</strong> 30% of OPC was<br />
replaced with blends of two mineral additives from LP, FA <strong>and</strong> RHA. Water content <strong>and</strong> SP dosage<br />
were adjusted so as to achieve class SF1 slump-flow with acceptance criteria ≥ 520 mm <strong>and</strong> ≤ 700<br />
(EPG, 2005). Once the paste volume was determined, the aggregate volume fraction was calculated.<br />
Control <strong>and</strong> SCC mixture compositions are as shown in Table 2.
423<br />
International <strong>Building</strong> & <strong>Infrastructure</strong> Technology Conference<br />
7-8 June 2011, Vistana Hotel, Penang, Malaysia<br />
Table 2. Mixture compositions for control mix, binary SCC mixes <strong>and</strong> ternary SCC mixes<br />
Mix No. Mix Description<br />
* OPC = ordinary Portl<strong>and</strong> cement; LP = fine limestone powder; FA = pulverized fuel ash; RHA =<br />
raw rice husk ash; S<strong>and</strong> = washed river s<strong>and</strong> graded 0/4.75 mm; granite = crushed granite graded<br />
4.75/12.0 mm<br />
CM = Control mix; OPC content is 475 kg/m³<br />
BM = SCC incorporating binary blends of OPC (85% mass/mass) with single mineral additive<br />
(15% mass/mass) comprising of LP, FA <strong>and</strong> RHA<br />
TM = SCC mixes incorporating ternary blends of OPC (70% mass/mass) with two mineral additive<br />
components (15% mass/mass each) comprising of LP, FA <strong>and</strong> RHA<br />
2.4 Experimental programmes<br />
c. Testing fresh properties of the control mix <strong>and</strong> SCC mixes.<br />
Immediately after mixing, slump flow tests were carried on each SCC mix in accordance with BS EN<br />
12350-8:2009 (No slump-flow test was carried out on the control mix).<br />
d. Testing the hardened properties of the control mix <strong>and</strong> SCC mixe<br />
Fresh concrete mix was cast into six 100 mm cubic moulds <strong>and</strong> six 100 mm x 100 mm x 500 mm<br />
prismatic moulds <strong>and</strong> left to st<strong>and</strong> for 24 hours. Subsequently, the hardened specimens were<br />
demoulded <strong>and</strong> immersed in water for curing. Dry density, compressive strength, flexural strength <strong>and</strong><br />
ultrasonic pulse velocity tests were performed after 7, 14, 28, 60 <strong>and</strong> 90 days of water curing.<br />
3. RESULTS AND DISCUSSION<br />
OPC LP FA RHA S<strong>and</strong> Granite<br />
Kg/m 3<br />
CM 100C 475 - - - 1047 712<br />
BM1 85C/15LP<br />
403.75 71.25 - - 1041 708<br />
BM2<br />
85C/15FA<br />
403.75 - 71.25 - 1028 698<br />
BM3<br />
85C/15RHA<br />
403.75 - - 71.25 1027 698<br />
TM1 70C/15LP/15FA 332.5 71.25 71.25 - 1022 695<br />
TM2 70C/15LP/15RHA 332.5 71.25 - 71.25 1023 695<br />
TM3 70C/15FA/15RHA 332.5 - 71.25 71.25 1007 686<br />
3.1 Fresh properties<br />
Fresh property tests are presented in Table 3. Binary mix, BM3 (85C/15RHA) <strong>and</strong> ternary mixes TM1<br />
(70C/15LP/15RHA) <strong>and</strong> TM3 (70C/15FA/15RHA) which incorporate 15% replacement of OPC with<br />
RHA <strong>and</strong> 30% replacement of OPC with LP/RHA <strong>and</strong> FA/RHA blends respectively, exhibit up to 38%<br />
higher water dem<strong>and</strong> as compared with the control mix.
424<br />
International <strong>Building</strong> & <strong>Infrastructure</strong> Technology Conference<br />
7-8 June 2011, Vistana Hotel, Penang, Malaysia<br />
Table 3. Fresh properties of the control mix <strong>and</strong> the binary & ternary SCC mixes<br />
Mix No. Mix Description<br />
Mixing Water<br />
(L/m³)<br />
CM 100C<br />
185<br />
BM1 85C/15LP<br />
175<br />
BM2 85C/15FA<br />
194<br />
BM3 85C/15RHA<br />
255<br />
TM1 70C/15LP/15FA<br />
185<br />
TM2 70C/15LP/15RHA<br />
255<br />
TM3 70C/15FA/15RHA<br />
245<br />
* No slump-flow test was performed on the control mix<br />
Superplasticizer<br />
(L/m³)<br />
10.5<br />
3.75<br />
5.7<br />
10.5<br />
5.6<br />
11.3<br />
11.0<br />
Slump-flow<br />
(mm)<br />
*-<br />
610<br />
640<br />
640<br />
580<br />
640<br />
600<br />
The cellular structure of RHA particles, as shown in Figure 1, is responsible for its high specific surface<br />
area even when the particles are not small in size (Mehta, P.Q., 1994, cited in Sampaio et al., n.d., p.<br />
2). Since the ratio of surface area to volume increases exponentially with particles irregularity, this<br />
parameter has a predominant effect on fresh SCC. When particles provide large surface area, high<br />
quantity of water is absorbed on the particles’ surfaces <strong>and</strong> less water will be available to lubricate <strong>and</strong><br />
disperse the particles for flowability (Esping, 2007).<br />
Figure 1. Rice husk ash cellular structure responsible for high its surface area<br />
3.2 Compressive strength<br />
Compressive strength tests were performed on hardened concrete specimens after 7, 14, 28, 60 <strong>and</strong><br />
90 days in accordance with BS EN 12390-3:2009. Compressive strength development for the control<br />
mix <strong>and</strong> SCC mixes are presented in Table 4. All SCC mixes which incorporate 15% replacement of<br />
OPC with RHA (BM3, TM2 <strong>and</strong> TM3) produce G40 class concrete, similar with the control mix. The<br />
best performance is shown by ternary mix TM3 (85C/15FA/15RHA) which is shown to produce a 90day<br />
compressive of 43.4 MPa; 3% lower as compared with the control mix. Binary mix BM2<br />
(85C/15FA) is the only SCC mix which does not incorporate RHA that obtains comparable<br />
compressive strength with mixes that incorporate RHA.<br />
As mentioned in the literature, RHA is classified as super pozzolan <strong>and</strong> therefore it is highly reactive.<br />
High water content helps to disperse RHA particles hence maximizing RHA-lime pozzolanic reaction.<br />
As shown in Table 4, the effect of RHA-lime pozzolanic reaction on compressive strength development<br />
is noticeable after 14 days. The chemical reaction then generates a momentum of strength increase<br />
through physical densification <strong>and</strong> strengthening of microstructure effects which enhances<br />
compressive strength development up to the ultimate 90-day age (Sinhania, 2004).
Consider the following 90-day compressive strength tests:<br />
425<br />
International <strong>Building</strong> & <strong>Infrastructure</strong> Technology Conference<br />
7-8 June 2011, Vistana Hotel, Penang, Malaysia<br />
Case 1;<br />
Replacing 15% OPC with LP produces - 36.7 MPa<br />
Replacing 15% OPC with RHA produces - 42.5 MPa<br />
Replacing 30% OPC with LP/RHA produces - 42.4 MPa<br />
It is shown that higher OPC replacement level is possible by incorporating LP/RHA blend, while still<br />
able to achieve equivalent compressive strength as compared lower level of replacement.<br />
Case 2;<br />
Replacing 15% OPC with FA produces - 39.4 MPa<br />
Replacing 15% OPC with RHA produces - 42.5 MPa<br />
Replacing 30% OPC with FA/RHA produces - 43.4 MPa<br />
It is shown that higher compressive is obtained at higher OPC replacement level by incorporating two<br />
mineral additives components comprising LP <strong>and</strong> RHA as compared with lower replacement level<br />
incorporating either FA or RHA. As explained in the literature, the physical effect of LP particles <strong>and</strong><br />
both physical <strong>and</strong> chemical effects of FA particles, improves the effects of RHA enabling higher level<br />
of OPC replacement while still maintaining comparable compressive strength as compared with<br />
concrete without OPC replacement.<br />
Case 3;<br />
Replacing 15% OPC with LP produces - 36.7 MPa<br />
Replacing 15% OPC with FA produces - 39.4 MPa<br />
Replacing 30% OPC with LP/FA produces - 28.5 MPa<br />
Case 3 shows that higher OPC replacement level by incorporating two mineral additive components of<br />
LP/FA producer lower compressive strength as compared with lower replacement level using either LP<br />
or FA.<br />
The above analyses suggest that raw RHA is the prime factor that generates enhanced compressive<br />
strength performance. The characteristic that differentiate RHA from LP <strong>and</strong> RHA is its high SiO 2<br />
content making it highly reactive. The possible deduction which could be made is that when<br />
compressive strength is the concern in high volume cement replacement, chemical reactivity of the<br />
mineral additive is the prime factor that affects strength performance. This deduction is based on<br />
compressive strength tests that show all SCC mixes that involve replacement of OPC with raw RHA,<br />
either in single additive component system or in two additive component systems, are able to produce<br />
comparable results with concrete without OPC replacement.<br />
Table 4. Compressive strength development for the control mix, the binary <strong>and</strong> ternary SCC mixes<br />
Mix<br />
No.<br />
Mix Description<br />
7 days<br />
Compressive strength (MPa)<br />
14 days 28 days 60 days 90-day<br />
CM 100C<br />
36.5 37.6 37.8 45.4 44.7<br />
BM1 85C/15LP<br />
27.4 34.2 37.1 33.4 36.7<br />
BM2 85C/15FA<br />
33.3 37.0 37.9 38.9 39.4<br />
BM3 85C/15RHA<br />
22.7 29.6 39.8 41.9 42.5<br />
TM1 70C/15LP/15FA 22.1 24.6 24.9 30.8 28.5<br />
TM2 70C/15LP/15RHA 20.7 29.4 30.9 38.5 42.4<br />
TM3 70C/15FA/15RHA 24.3 32.3 38.9 42.7 43.4<br />
3.3 Flexural strength<br />
Flexural strength tests were performed on 100 mm x 100 mm x 500 mm prismatic concrete specimens<br />
after 7, 14, 28, 60 <strong>and</strong> 90 days in accordance with BS EN 12390-5:2009. Flexural strength<br />
development for the control mix <strong>and</strong> SCC mixes are as shown in Table 5. Binary <strong>and</strong> ternary SCC
426<br />
International <strong>Building</strong> & <strong>Infrastructure</strong> Technology Conference<br />
7-8 June 2011, Vistana Hotel, Penang, Malaysia<br />
mixes which incorporate RHA partially replacing OPC, exhibit improved flexural strength development<br />
as compared with the control mix.<br />
Flexural strength tests performed on day 90 reveal that binary mix BM3 (85C/15RHA) produces 14%<br />
higher flexural strength as compared with the control mix. Similarly, ternary mixes TM2<br />
(70C/15LP/15RHA) <strong>and</strong> TM3 (70C/15FA/15RHA) produce 9% <strong>and</strong> 2% higher flexural strength<br />
respectively, as compared with the control mix. These results indicate that RHA addition improves<br />
inter-particle cohesiveness which enhances SCC’s flexural performance.<br />
Table 5. Flexural strength development for the control mix, the binary <strong>and</strong> ternary SCC mixes<br />
Flexural strength (MPa)<br />
Mix No. Mix Description<br />
CM<br />
BM1<br />
BM2<br />
BM3<br />
TM1<br />
TM2<br />
TM3<br />
100C<br />
85C/15LP<br />
85C/15FA<br />
85C/15RHA<br />
70C/15LP/15FA<br />
70C/15LP/15RHA<br />
70C/15FA/15RHA<br />
7-day 14-day 28-day 60-day 90-day<br />
4.5<br />
4.0<br />
4.0<br />
3.2<br />
2.9<br />
3.4<br />
2.7<br />
3.4 Dry density <strong>and</strong> ultrasonic pulse velocity (UPV)<br />
Dry density <strong>and</strong> ultrasonic pulse velocity tests are presented in Table 6. All SCC mixes are shown to<br />
possess lower density as compared with the control mix. This is because all additives used in the<br />
experiment possess lower bulk density than that of OPC. The bulk density of RHA is between 70 to<br />
110 kg/m 3 whereas the bulk density of OPC is between 830 to 1050 kg/m 3 , therefore when OPC is<br />
replaced with RHA it is bound to produce lighter concrete. In order to non-destructively assess the<br />
internal structure of concrete, UPV tests are performed on test specimens (Sahmaran et al., 2006).<br />
The grading for UPV values is as shown in Table 6. Since all SCC mixes which incorporate RHA<br />
addition obtain UPV values greater than 4.3 km/s, the internal structure may be classified as being<br />
close to excellent.<br />
Table 6. The average dry density <strong>and</strong> ultrasonic pulse velocity of the control mix, the binary <strong>and</strong><br />
ternary SCC mixes <strong>and</strong> grading for ultrasonic pulse velocity<br />
Mix<br />
No.<br />
CM<br />
BM1<br />
BM2<br />
BM3<br />
TM1<br />
TM2<br />
TM3<br />
Mix Description<br />
100C<br />
85C/15LP<br />
85C/15FA<br />
85C/15RHA<br />
70C/15LP/15FA<br />
70C/15LP/15RHA<br />
70C/15FA/15RHA<br />
4. CONCLUSIONS<br />
Average Dry Density<br />
(kg/m³)<br />
2287<br />
2223<br />
2290<br />
2268<br />
2196<br />
2279<br />
2260<br />
Based on this study the following conclusions are made:<br />
� replacement of OPC with RHA results in high requirement for mixing water in order to produce<br />
acceptable slump-flow,<br />
� low volume cement replacement with RHA <strong>and</strong> moderate volume cement replacement with<br />
RHA/LP blend produce comparable compressive strength with that of normal concrete <strong>and</strong><br />
improved flexural strength,<br />
� moderate volume cement replacement with RHA/FA blend produces compressive <strong>and</strong> flexural<br />
strengths comparable with normal concrete <strong>and</strong><br />
� partially replacing OPC with RHA <strong>and</strong> with blends of LP/RHA <strong>and</strong> FA/RHA, produce better<br />
strength development than replacement with LP, FA or LP/FA blend.<br />
4.7<br />
4.1<br />
4.7<br />
3.5<br />
3.4<br />
3.8<br />
3.8<br />
UPV<br />
(km/s)<br />
4.53<br />
4.12<br />
4.40<br />
4.39<br />
4.62<br />
4.41<br />
4.31<br />
5.7<br />
4.7<br />
5.0<br />
4.0<br />
3.4<br />
4.1<br />
3.7<br />
5.8<br />
4.5<br />
5.3<br />
6.1<br />
4.2<br />
5.3<br />
6.0<br />
UPV<br />
(km/s)<br />
> 4.5<br />
3.5 to 4.5<br />
3.0 to 3.5<br />
< 3.0<br />
5.7<br />
4.9<br />
5.6<br />
6.5<br />
3.9<br />
6.2<br />
5.8<br />
Grading<br />
Excellent<br />
Good<br />
Medium<br />
Doubtful
REFERENCES<br />
427<br />
International <strong>Building</strong> & <strong>Infrastructure</strong> Technology Conference<br />
7-8 June 2011, Vistana Hotel, Penang, Malaysia<br />
Ahmadi, M.A. et al., (2007). Development of Mechanical Properties of Self-compacting Concrete<br />
Containing Rice Husk Ash. World Academy of Science, Engineering <strong>and</strong> Technology, (34), pp. 168-<br />
171<br />
British St<strong>and</strong>ards Institution, (2007). Draft prEN 12350-8. Testing Fresh Concrete Part 8: Selfcompacting<br />
Concrete – Slump-flow Test. Bsigroup.com: BSI<br />
British St<strong>and</strong>ards Institution, (2009). BS EN 12390-7:2009. Testing Hardened Concrete Part 7: Density<br />
of hardened concrete. Bsigroup.com: BSI<br />
British St<strong>and</strong>ards Institution, (2009). BS EN 12390-3:2009 Testing Hardened Concrete Part 3:<br />
Compressive Strength of Test Specimens. Bsigroup.com: BSI<br />
British St<strong>and</strong>ards Institution, (2009). BS EN 12390-5:2009. Testing Hardened Concrete Part 5:<br />
Flexural Strength Test Specimens. Bsigroup.com: BSI<br />
British St<strong>and</strong>ards Institution, (2004). BS EN 12504-4:2004. Testing concrete Part 4: Determination of<br />
Ultrasonic Pulse Velocity. Bsigroup.com: BSI<br />
Esping, O., (2007). Early Age Properties of Self-compacting Concrete –Effects of Fine Aggregate <strong>and</strong><br />
Limestone Filler. Thesis for the Degree of Doctor of Philisophy. Department of Civil <strong>and</strong> Environmental<br />
Engineering, <strong>Building</strong> Technology, Chalmers University of Technology, Goteborg, Sweden<br />
Kurtis, K., (2002). Supplementary Cementitious Materials. School of Civil <strong>and</strong> Environmental<br />
Engineering, Georgia Institute of Technology, Atlanta USA<br />
Ouchi, M. et al., (2003). Application of Self-compacting Concrete in Japan, Europe <strong>and</strong> the United<br />
States. ISHPC, pp. 1-20<br />
Portl<strong>and</strong> Cement Association, (2010). Green in Practice 107 – Supplementary Cementitious Materials<br />
(SCMs). info@cement.org, Illinois, USA<br />
National Ready Mix Concrete Association, (2004). Chicago, USA, www.nrmca.org<br />
Neuwald, A.D., (2010). Supplementary Cementitious Materials. National Precast Concrete<br />
Association, Indianapolis, USA.<br />
Sahmaran, M. Et al., (2006). The effect of chemical admixtures <strong>and</strong> mineral additives on self<br />
compacting mortar. Cement <strong>and</strong> Concrete composites, (28), pp. 432-440<br />
Sampaio, J. Et al., n.d. Portuguese rice husk ash as partial cement replacement. Department of Civil<br />
Engineering, FEUP, Universidade do Porto, Portugal<br />
Singhania, N.P., (2004). Rice Husk Ash. The Institute of Concrete Technology, (55), Autumn 2004.<br />
www.ictech.org<br />
The European Project Group, (2005). The Eropean Guideline for Self-compactinf Concrete. SCC<br />
European Project Group:EPG<br />
Turkel, S. <strong>and</strong> Altuntas, Y., (2009). The effect of limestone powder, fly ash <strong>and</strong> silica fume on the<br />
properties of self-compacting repair mortar. Sadhana, Vol. 34, Part 2, pp. 331-343
T199<br />
428<br />
International <strong>Building</strong> & <strong>Infrastructure</strong> Technology Conference<br />
7-8 June 2011, Vistana Hotel, Penang, Malaysia<br />
PROBLEMS OF PRIVATE RESIDENTIAL PROPERTY DEVELOPMENT IN<br />
MAKAMA JAHUN NEIGHBOURHOOD OF BAUCHI METROPOLIS, NIGERIA<br />
Aliyu Ahmad Aliyu 1 , Rozilah Kasim 2 <strong>and</strong> David Martin 3<br />
1,2,3 Faculty of Technology Management, Business <strong>and</strong> Entrepreneurships, Universiti Tun<br />
Hussein Onn Malaysia, Johor, Malaysia<br />
1 aaaliyu1978@yahoo.com , 2 rozilah@uthm.edu.my , 3 martin@uthm.edu.my<br />
ABSTRACT: This study was designed to investigate <strong>and</strong> examine the problems encountered by<br />
private residential property developers in developing their residential accommodation in Makama<br />
Jahun neighbourhood of Bauchi Metropolis.Two hundred respondents were selected through stratified<br />
r<strong>and</strong>om sampling. Data were presented using simple percentage distribution tables <strong>and</strong> complete<br />
theoretical analyses were used to analyze data that are not numerical in nature. The analysis revealed<br />
that high cost of building materials, non-use of local building materials, low income of the majority of<br />
the respondents <strong>and</strong> poor source finance amongst others were discovered to be the major constraints<br />
to residential property development in the study area. Others are problem of l<strong>and</strong> acquisition <strong>and</strong><br />
statutory regulation which were also among the obstacles faced by the respondents.In other to make a<br />
meaningful <strong>and</strong> adequate coverage the study is limited to Makama Jahun area of Bauchi<br />
metropolis.This paper represents the first work that analyse the problems of rivate residential property<br />
development in MakamaJjahun neighbourhood of Bauchi metropolis, Nigeria.To arrest this situation,<br />
the use of local building materials should be encouraged by the respondents. Financial institutions<br />
should scale down on their stringent lending requirements for a building loan. The chains of schedule<br />
in formal l<strong>and</strong> acquisition should be reduced by the government <strong>and</strong> thereby quicken acquisition<br />
process. If these are followed, it will help to combat residential development problems identified in the<br />
study area <strong>and</strong> other similar blighter neighbourhoods.<br />
Keywords: development, neighbourhood, Nigeria private residential property, problem<br />
1. INTRODUCTION<br />
One of the greatest problems in the world today is that of provision of shelter. Shelter must not be only<br />
adequate for the population but also habitable. This problem is more pronounced in the urban areas<br />
where population pressure is on the increase. The problem of looking for shelter leads to invasion of<br />
l<strong>and</strong> for the purpose of building (Jinadu, 2008)<br />
In Nigeria, the urban housing situation continues to deteriorate in the absence of an adequate<br />
arrangements to ensure that housing facilities exp<strong>and</strong>ed in line with the rapidly population growth.<br />
Despite the past efforts of the nations housing problem, it was evident that the combined effort of the<br />
public <strong>and</strong> private sectors over the past successive government plans had continued to fall far short of<br />
housing need (Agbola, 2007). Past governments had tended to leave this important sector almost<br />
entirely to private effort, concentrating itself on the provision of limited number of residential quarters<br />
for its deserving officers. Abdul (2008) noted that the major symptoms of urban housing problems<br />
include:-<br />
(i) An absolute shortage of housing units.<br />
(ii) The emergence <strong>and</strong> proliferation of slums <strong>and</strong> squatter settlement especially in large cities.<br />
(iii) Rising house rents; <strong>and</strong><br />
(iv) A growing inability of citizens to buy or build their own houses.<br />
Individual effort to build or own a residence becomes quits difficult by the majority of the people<br />
subject to number of constraints. As a matter of fact the quality of life in any given environment is
429<br />
International <strong>Building</strong> & <strong>Infrastructure</strong> Technology Conference<br />
7-8 June 2011, Vistana Hotel, Penang, Malaysia<br />
greatly influenced by the nature <strong>and</strong> st<strong>and</strong>ard of built up structures particularly residential properties.<br />
Agbola (2009)A cursory look at past housing policies <strong>and</strong> programmes in Nigeria reveals that effective<br />
solutions to housing problems in general <strong>and</strong> low income housing in particular are yet to be found. The<br />
housing situation has deteriorated continuously due to rapid natural population growth, increasing<br />
rural-urban migration etc. It is now generally agreed that most Nigerian states are facing a housing<br />
“crisis” of major proportion <strong>and</strong> a bounteous number of statistics <strong>and</strong> studies are available supporting<br />
this view (Abiodun 2008).<br />
It is evident in Nigeria that in most cases objectives designed for a particular project are hardly ever<br />
realised. This is especially so when a critical look is made of the various government housing policies.<br />
For instance, Liman (2007) assessed the effectiveness of public low income housing programme in<br />
metropolitan Kano, which showed that the overall contribution of the programme in terms of increasing<br />
the supply of new housing required in metropolitan Kano was 50% of the planned target of 77,852<br />
housing units for the period between 1975 <strong>and</strong> 1980. In addition, the low income group for whom the<br />
programme was meant did not constitute a substantial proportion of the eventual beneficiaries.<br />
2. RESEARCH METHODOLOGY<br />
The entire layout (Makama Jahun area) was stratified into eighteen clusters by the Ministry of L<strong>and</strong><br />
<strong>and</strong> Survey, Bauchi. The number of plots vary from one cluster to another, the largest being S: 13 with<br />
a total of 262 plots while cluster S: 14 has the least number with 13 plots. Each cluster represents a<br />
stratum that can be studied independently from others. Having stratified the layout, 10% of the plots i.e<br />
partially developed <strong>and</strong> undeveloped plots from each cluster were selected r<strong>and</strong>omly using the table of<br />
r<strong>and</strong>om digits.(see table 1 below).<br />
This is necessary to achieve a reasonable spread in the location of interviews <strong>and</strong> questionnaires to<br />
be able to obtain a cross-section of problems experienced in the development process in different<br />
parts of the study area. This is imperative because of local variations in problems.<br />
Table 1. Makama Jahun Layout<br />
S/NO Layout No.<br />
Total No.<br />
of plots<br />
No. of Fully<br />
Developed Plots<br />
No. of Partially<br />
Developed Plots<br />
No. of Undeveloped<br />
Plots<br />
1 S:1 116 15 65 36<br />
2 S:2 80 7 40 33<br />
3 S:3 83 9 44 30<br />
4 S:4 104 12 61 31<br />
5 S:5 144 14 82 48<br />
6 S:6 114 11 74 29<br />
7 S:7 283 21 185 77<br />
8 S:8 15 2 8 5<br />
9 S:9 90 9 47 34<br />
10 S:10 55 5 28 22<br />
11 S:11 198 18 118 62<br />
12 S:12 132 15 67 50<br />
13 S:13 120 12 62 46<br />
14 S:14 159 16 87 56<br />
15 S:15 238 28 153 57<br />
16 S:16 155 18 77 60<br />
17 S:17 28 3 15 10<br />
18 S:18 157 17 87 53<br />
Total 2271 232 1300 739<br />
Source: Field Survey (2010)
430<br />
International <strong>Building</strong> & <strong>Infrastructure</strong> Technology Conference<br />
7-8 June 2011, Vistana Hotel, Penang, Malaysia<br />
Table 2. Ten Percent Samples Drawn from Each Layout<br />
S/NO Layout (Cluster) No.<br />
Total No. of plots<br />
(partially & undeveloped plots)<br />
Samples Drawn<br />
1 S:1 101 10<br />
2 S:2 73 7<br />
3 S:3 74 7<br />
4 S:4 92 9<br />
5 S:5 130 13<br />
6 S:6 103 10<br />
7 S:7 262 26<br />
8 S:8 13 1<br />
9 S:9 81 8<br />
10 S:10 50 5<br />
11 S:11 180 18<br />
12 S:12 117 11<br />
13 S:13 108 10<br />
14 S:14 143 14<br />
15 S:15 210 21<br />
16 S:16 137 13<br />
17 S:17 25 3<br />
18 S:18 140 14<br />
Total 2039 200<br />
Source: Field Survey (2010)<br />
In all, a total of 200 plot allotees representing about 10% of the total number of plots (2033) on the<br />
area were selected <strong>and</strong> administered with the questionnaires. Two types of questionnaires were<br />
administered. The first one was administered to the property developers in the study area. The second<br />
one was administered to Federal Mortgage Bank of Nigeria Bauchi Branch. The content <strong>and</strong> scope of<br />
the questionnaires are broad. For the property developers, it touches on socio-economic<br />
characteristics of the respondents their source of finance, problems encountered during l<strong>and</strong><br />
acquisition etc. For the Mortgage Bank it touch on the procedures for the issuance of the loan, interest<br />
rate chargeable, class of people that the Bank gives loan for private residential property development<br />
<strong>and</strong> classes of people that benefited from the Bank loan scheme among others.<br />
Interviews were held with the head of planning unit of Bauchi State Urban Development Board,<br />
practicing estate surveyors <strong>and</strong> valuers, l<strong>and</strong> officers, private developers, builders etc on information<br />
about building regulations, planning st<strong>and</strong>ards, etc. To have sufficient ground of balancing these<br />
observations, legal practitioners were also contacted using the same unstructured interview pattern.<br />
The aim of this was to find out the frequency at which they h<strong>and</strong>le l<strong>and</strong>-related cases in the study<br />
area, especially as it relate residential l<strong>and</strong> <strong>and</strong> how these cases are finally resolved.<br />
3. RESULTS AND DISCUSSIONS<br />
3.1 Duration of Plot Acquisition Process by the Respondents<br />
Though there is no official guidelines as regard how long l<strong>and</strong> acquisition for residential purposes<br />
should take; it is expected that a minimum delay is associated with l<strong>and</strong> transaction, especially for<br />
residential needs. This is because acquisition of l<strong>and</strong> is the basis upon which all l<strong>and</strong> use rest. Table 3<br />
below is an analysis of duration experienced by respondents before they could get their titles<br />
registered in case of the formal plot allotees.
431<br />
International <strong>Building</strong> & <strong>Infrastructure</strong> Technology Conference<br />
7-8 June 2011, Vistana Hotel, Penang, Malaysia<br />
Table 3. Time taken to acquire registered Plots by the respondents<br />
Time Taken Number of Respondents % Frequency<br />
1-3 Months 14 7<br />
3-6 Months 48 24<br />
6-12 Months 64 32<br />
After one year 74 37<br />
Total 200 100<br />
Source: Field Survey (2010)<br />
From table 3 above, it is evidenced that in the study area, the official plot allotees could not finally<br />
document their l<strong>and</strong> acquisition formalities until after about one year (37%). This period is indeed<br />
frustrating to so many people wishing to acquire l<strong>and</strong> for residential purposes. The duration that is<br />
considered by many respondents as reasonable is the period between one to three months <strong>and</strong> as it<br />
can be seen from the table, this is represented by a small percentage (14%). Greater respondents in<br />
the study area were not able to register their l<strong>and</strong> between three to six months <strong>and</strong> six months to one<br />
year of application. Other findings revealed that those plot owners that were able to register their titles<br />
between 1-3 months had either used the influence of their position or wealth.<br />
Observations have shown that because of the individual interest, sentiments <strong>and</strong> values attached to<br />
the l<strong>and</strong> in the study area, acquisition for public <strong>and</strong> private purposes has always been difficult,<br />
protracted <strong>and</strong> frustrating affair which is worth mentioning here. It is because of this, in addition to the<br />
earlier reasons that l<strong>and</strong> transaction in the study area become problematic <strong>and</strong> cumbersome.<br />
Furthermore it is because of these reasons that l<strong>and</strong> transaction has to vary considerably from place<br />
to place. The attractive quality of a place where plot is situated could also influence the speed of<br />
registering such titles.<br />
3.2 Difficulties Experienced by Respondents in the Study Area<br />
L<strong>and</strong> acquisition process in the state start by filling the prescribed application form, processing the<br />
application <strong>and</strong> registering of the title as already observed in this write up. The process is not without<br />
its difficulties, <strong>and</strong> these are differently experienced by plot owners in the study area. These difficulties<br />
range from high fees to staff attitude.<br />
Table 4. Difficulties Experienced by Respondents in the Study Area.<br />
Difficulties Number of Respondents % Frequency<br />
Deposit fee 19 9.5<br />
Processing fee 11 5.5<br />
Reproduction of building plan 53 26.5<br />
Reproduction of deeds 7 3.5<br />
Conversion process 29 14.5<br />
Staff attitude 17 8.5<br />
All of the above 64 32<br />
Total 200 100<br />
Source: Field Survey (2010)<br />
Table 4 above showed that in Makama Jahun area, the entire respondents experienced problem at all<br />
levels; the greatest problem experienced by these respondents was production of building plans.<br />
Though, they had already acquired the l<strong>and</strong>, they maintained that it was one of the stages that delayed<br />
the regulation of their plot. 5.5% of the respondents in the study area experienced the difficulty of<br />
processing fee; this is the fee that plot allotees have to settle in survey, town planning <strong>and</strong> l<strong>and</strong><br />
division before registering their titles. 8.5% however, suffered the problem that emanate from staff<br />
attitude. This is the attitude of staff in the three units of l<strong>and</strong>s, survey <strong>and</strong> town planning.
432<br />
International <strong>Building</strong> & <strong>Infrastructure</strong> Technology Conference<br />
7-8 June 2011, Vistana Hotel, Penang, Malaysia<br />
This staff attitude manifest itself in the way <strong>and</strong> manners staffs deliberately delay acquisition of l<strong>and</strong> in<br />
order to frustrate the efforts of applicants. This was discovered to be reasons why many respondents<br />
could not carry their l<strong>and</strong> acquisition process to an end; in the contrary they often stopped at the level<br />
of issuing a grant right. In the same vein, 14.5% encountered difficulties of conversion process; this is<br />
the process of regularising l<strong>and</strong>s that had earlier on, been given or acquired through the procedure of<br />
either ward head or local governments. 3.5% of the respondents in the study area faced problem of<br />
deed registration in l<strong>and</strong> department.The nature of the building plan problem is in the number<br />
applicants are required to include in their application files. A minimum of eight building plans,<br />
according to many respondents are too much for residential purposes <strong>and</strong> consequently delay l<strong>and</strong><br />
acquisition process, more so that they are often rejected on the ground of non-conformity with the<br />
planning regulations.<br />
3.4 Degree to which various procedures are exploited in L<strong>and</strong> Acquisition<br />
Table 5. Analysis of various Procedures for L<strong>and</strong> Acquisition<br />
S/N Various Procedures of L<strong>and</strong> Acquisition No. of Respondents % Frequency<br />
1 Through informal acquisition 63 31.5<br />
2 Through local government 19 9.5<br />
3 Through sale 51 25.5<br />
4 Through wardhead 21 10.5<br />
5 Through gift 7 3.5<br />
6 Through inheritance 13 6.5<br />
7 Through lease 8 4<br />
8 Through sublease 12 6<br />
9 Through pledge 6 3<br />
Total 200 100<br />
Source: Field Survey (2010)<br />
Above finding revealed that the most used procedure is through informal acquisition in the study area.<br />
This is followed by those who acquired their l<strong>and</strong> through sale; that is, people acquired their l<strong>and</strong><br />
through purchase from hoarders. The least used procedure in l<strong>and</strong> acquisition is that of gift. The<br />
procedure of sublease is fairly used too.Now that the procedure of informal acquisition is seen to be<br />
dominant among all the rest method, the degree to which this method is properly observed becomes<br />
problematic because of the high prices charged by the l<strong>and</strong> speculators. Most of the respondents who<br />
acquired their l<strong>and</strong> through sublease indicated that the official consent process has not been<br />
formalised. This is a negation of the section 21 <strong>and</strong> 22 of the 1978 l<strong>and</strong> use decree.<br />
3.5 General assessment of L<strong>and</strong> Acquisition Process by respondents<br />
To assess a phenomenon of this kind, there is bound to be varying opinion since it is not possible to<br />
have the same acquisitioned experience. Parameters of simple, very simple, fair, difficult <strong>and</strong> very<br />
difficult is therefore adopted for easy reference point of assessment.<br />
Table 6. Assessment of Residential L<strong>and</strong> Acquisition Process by the Property Developers<br />
Assessment Formula Number of Respondents % Frequency<br />
Very simple 2 1<br />
Simple 3 1.5<br />
Fair 21 10.5<br />
Difficult 82 41<br />
Very difficult 92 46<br />
Total<br />
Source: Field Survey (2010)<br />
200 100
433<br />
International <strong>Building</strong> & <strong>Infrastructure</strong> Technology Conference<br />
7-8 June 2011, Vistana Hotel, Penang, Malaysia<br />
From the above table almost half of the respondents e assessed the general l<strong>and</strong> acquisition process<br />
to be very difficult (92%). This is followed by those respondents who assessed the process as difficult<br />
(82%). Putting these together, there are many respondents in the study area whose experience in l<strong>and</strong><br />
acquisition is not favourable. On the whole, therefore, majority of respondents in the study area had<br />
assessed l<strong>and</strong> acquisition process to be either difficult or very difficult. This is a great obstacle to<br />
residential property development in the study area.<br />
Due to urbanisation, many people are moving from the rural to the urban areas where modern facilities<br />
are available; population pressure in cities <strong>and</strong> towns had made residential accommodation in<br />
particular a problem. Furthermore, the congested urban places are in need of expansion, but l<strong>and</strong><br />
where this expansion is to be made is scarce. L<strong>and</strong> has become of great marketable value <strong>and</strong> no<br />
longer the ordinary l<strong>and</strong> known to African tradition as a gift of nature to mankind. This observation has<br />
probably acted as a catalyst to the promulgation of the 1978 L<strong>and</strong> Use Decree to have a unified<br />
system of l<strong>and</strong> acquisition <strong>and</strong> most importantly to reduce the activities of l<strong>and</strong> speculators. This, from<br />
policy view, should have taken care of all or at least some of the irregularities in urban l<strong>and</strong><br />
acquisition.The involvement of ward heads in l<strong>and</strong> transaction in the study area have been established<br />
through this finding to be due to lack of adequate settling of the affected people through<br />
compensation, <strong>and</strong> even where compensation issues is adequately addressed, they are still found in<br />
l<strong>and</strong> transactions in the study area.<br />
3.6 Duration in Formal L<strong>and</strong> Acquisition<br />
Table 7, Time Taken in Formal L<strong>and</strong> Acquisition<br />
Period Taken Number of Respondents % Frequency<br />
1-3 months 1 0.5<br />
3-6 months 7 3.5<br />
6-12 months 14 7<br />
After one year 178 89<br />
Total<br />
Source: Field Survey (2010)<br />
200 100<br />
It can be seen here that most respondents generally acquired their l<strong>and</strong> with difficulties in the formal<br />
method. This picture is more conspicuously revealed looking at the table critically. 89% of the<br />
respondents acquired their l<strong>and</strong> after one year. Invariably, therefore, people will continue to prefer<br />
other method of l<strong>and</strong> acquisition not mindings the high financial involvement but for its fast nature.<br />
3.7 Reason for Acquiring L<strong>and</strong> Informally<br />
The delay <strong>and</strong> uncertainties that is associated with government official procedures of l<strong>and</strong> acquisition<br />
has been the general reason for people opting for other alternatives of l<strong>and</strong> acquisition. Investigation<br />
had discovered that there are other specific reasons which range from being cheap, easy to costly<br />
depending on the source.<br />
Table 8. Reasons for Informal L<strong>and</strong> Acquisition<br />
Reasons Number of respondents % frequency<br />
Easy, cheap <strong>and</strong> fast 11 5.5<br />
Easy, costly but fast 40 20<br />
Cheap <strong>and</strong> fast only 4 2<br />
Easy <strong>and</strong> fast only 10 5<br />
Easy <strong>and</strong> cheap only 9 4.5<br />
Costly <strong>and</strong> fast only 126 63<br />
Total<br />
Source: Field Survey (2010)<br />
200 100
434<br />
International <strong>Building</strong> & <strong>Infrastructure</strong> Technology Conference<br />
7-8 June 2011, Vistana Hotel, Penang, Malaysia<br />
The table showed that the respondents who gave reasons of costly <strong>and</strong> fast (i.e 63%) are the highest<br />
in the study area. Representation of other reasons is indeed small, <strong>and</strong> this as the findings showed is<br />
in respect of l<strong>and</strong>s that are acquired through warhead, inheritance <strong>and</strong> alienation among others. In the<br />
same vein, those respondents who gave reasons of costly <strong>and</strong> fast are those plot owners who<br />
acquired them through either vendors or l<strong>and</strong> speculators as revealed through this research.<br />
This research had discovered that the amount involved in this informal l<strong>and</strong> acquisition is several times<br />
higher than what is involved in the government official procedure. The only advantage which the<br />
formal acquisition procedure has over this is that of legality. This however is not a threat to the<br />
patronisers of informal process. It is in the light of the above observations that James (2001) was quick<br />
to conclude that accumulation of l<strong>and</strong>s by speculators who are protected by the law indirectly hinders<br />
acquisition of l<strong>and</strong>s by individuals <strong>and</strong> public agencies for execution of development plans.<br />
3.8 Cost of <strong>Building</strong> Materials<br />
<strong>Building</strong> materials normally are over half of the total cost of a building. The period since the mid 1990s<br />
has witnessed an increasing upsurge in the cost of construction materials. The property developers in<br />
the study area face high cost of building materials caused by the unprecedented inflation rates in the<br />
economy. Even as far back as 1987 when prices were relatively lower, unless one had a “five digit”<br />
savings, he could not think of embarking on a building project. This is purely because of the high cost<br />
of construction materials. For example, the rising cost of building materials based on market survey of<br />
some materials is on the table below.<br />
Table 9. Prices of Some <strong>Building</strong> Materials from 2008-2009 in Muda Lawal Market Bauchi<br />
Materials/Item Br<strong>and</strong> Quantity<br />
CEMENT<br />
S<strong>and</strong>crete block<br />
S<strong>and</strong>crete block<br />
Gravel<br />
Sharp<br />
Laterite<br />
REINFORCEMENT<br />
Rods<br />
16mm<br />
12mm<br />
13mm<br />
DOORS<br />
Plush doors<br />
Wood doors<br />
Wood doors<br />
Iron doors<br />
Iron doors<br />
TILES<br />
Ceramic tiles<br />
P.V.C. Tiles<br />
Portl<strong>and</strong><br />
9 inch<br />
6 inch<br />
Aggregate<br />
S<strong>and</strong><br />
S<strong>and</strong><br />
Smooth<br />
Smooth<br />
Smooth<br />
Big/small<br />
Big<br />
Small<br />
Big<br />
Small<br />
Ceramic<br />
6 x 6 wall<br />
tiles<br />
8x8per square<br />
Rubber tiles<br />
Per 50kg bag<br />
Per 1<br />
Per 1<br />
Per tipper<br />
Per tipper<br />
Per price<br />
Per price<br />
Per price<br />
Per 1<br />
Per 1<br />
Per 1<br />
Per 1<br />
Per 1<br />
72 pieces<br />
Per carton<br />
<strong>Building</strong><br />
Materials<br />
Prices as at<br />
January,<br />
2008 (N)<br />
1,600<br />
70<br />
50<br />
1,200<br />
7,000<br />
6,000<br />
2000<br />
1,000<br />
1500<br />
2,600<br />
9,000<br />
7,000<br />
20,000<br />
12,000<br />
600<br />
800<br />
10,000<br />
<strong>Building</strong><br />
Materials<br />
Price as at<br />
December,<br />
2009 (N)<br />
1,800<br />
90<br />
60<br />
1,500<br />
8,000<br />
6,000<br />
2,500<br />
1,200<br />
2000<br />
3,000<br />
12,000<br />
10,000<br />
22,000<br />
13,000<br />
800<br />
1,000<br />
12,000
FITTINGS<br />
Wash h<strong>and</strong> basin<br />
Wash h<strong>and</strong> basin<br />
Bath tub<br />
Water heater<br />
Water closet<br />
St<strong>and</strong>ard shower<br />
Shower tray<br />
Shower tray<br />
Abeokuta product<br />
Engl<strong>and</strong><br />
Aristone<br />
Aristone<br />
Abeokuta<br />
Engl<strong>and</strong><br />
With<br />
Mixer<br />
Deep type<br />
Fat type<br />
ROOFING SHEET Swan Zinc<br />
Star Zinc<br />
H<strong>and</strong> Print<br />
GLASS WORK<br />
Louvre Blades<br />
PAINTINGS<br />
Emulsion paint<br />
Gloss oil paint<br />
WOODS<br />
Planks<br />
Elephant<br />
4 blades<br />
6 blades<br />
8 blades<br />
2 ft plain<br />
2 ft tinted<br />
3 ft plain<br />
3 ft tinted<br />
Saclux coloured<br />
Saclux coloured<br />
Soft 2 x 3 x 12<br />
Hard 2 x 3 x 12<br />
Source: Market Survey (2010)<br />
Per 1<br />
Per 1<br />
Per 1<br />
Per 1<br />
Per 1<br />
Per 1<br />
Per Bundle<br />
“<br />
“<br />
“<br />
Per pair<br />
Per pair<br />
Per pair<br />
Per pair<br />
Per pair<br />
Per 4 lit tin<br />
Per 4 lit tin<br />
Per 1<br />
Per 1<br />
435<br />
International <strong>Building</strong> & <strong>Infrastructure</strong> Technology Conference<br />
7-8 June 2011, Vistana Hotel, Penang, Malaysia<br />
7,000<br />
8,000<br />
6,000<br />
16,500<br />
7,000<br />
10,000<br />
4,000<br />
6,000<br />
6,500<br />
8,500<br />
9,000<br />
8,500<br />
9,000<br />
400<br />
550<br />
750<br />
100<br />
150<br />
180<br />
200<br />
500<br />
2,000<br />
950<br />
1,100<br />
8,000<br />
10,000<br />
7,000<br />
18,000<br />
8,000<br />
12,000<br />
5,000<br />
7,000<br />
8,000<br />
10,000<br />
10,500<br />
10,000<br />
11,000<br />
500<br />
650<br />
900<br />
200<br />
250<br />
300<br />
350<br />
600<br />
2,300<br />
1,100<br />
1,300<br />
The frequent increase in prices of building materials constitute a factor affecting housing development<br />
since developers cannot afford the high quality materials due to exorbitant rates. Therefore, the<br />
research work revealed that prices of building materials rise up continuously. The market survey as<br />
at 2009 on building materials shows the instability in prices of building materials.<br />
It was also established through this study that masons charge N 50 per single block laying <strong>and</strong><br />
labourers were paid from N 600 to N 700 per day. The carpenters charge between N 1,500- N 1,700<br />
for fixing windows <strong>and</strong> doors frames in addition to their actual prices of N 1,200 <strong>and</strong> N 1,300 <strong>and</strong> an<br />
averagely build cement toilet cost not less than N 100,000. Electricity fittings, wall decoration (paints)<br />
<strong>and</strong> bugler proof fixtures will be necessary for a house to meet urban st<strong>and</strong>ard. This will not cost less<br />
than N 300,000 for a 2 bedroom house. A conservative estimate by 2 building technology experts<br />
revealed that for a 2 bedroom core unit house to reach its occupancy stage, it will require the sum of N<br />
800,000 to N1,000,000,000.00.<br />
3.9 State of Development <strong>and</strong> Rent in the study area<br />
A larger proportion of the respondents (57.3%) are still constructing their residential accommodation<br />
32.5% have not even started developing their plots. While 10.2% have completed their residential<br />
accommodation (See table 1). In the study area, monthly rent ranged between N 2,000 to 3,000 for a<br />
single room (normally very small- 6m 2 ). But in cases of self contained flats- a 3- modern bedroom flat<br />
cost between N 140,000 to N 200,000 per annum. These high rentals are reflective of the shortage of<br />
housing accommodation. In some cases a self contained room <strong>and</strong> parlor was being rented at N<br />
230,000 per year while a 2-bedroom self- contained flat was N 250,000.
436<br />
International <strong>Building</strong> & <strong>Infrastructure</strong> Technology Conference<br />
7-8 June 2011, Vistana Hotel, Penang, Malaysia<br />
4. CONCLUSION AND RECOMMENDATIONS<br />
This research work has attempted a description <strong>and</strong> explanation of the problems of private residential<br />
property development in Makama Jahun neighbourhood of Bauchi metropolis. Through the study<br />
carried out, it was realised that among the most important or prevailing problems affecting private<br />
residential property development in the study area include:- Problem of l<strong>and</strong> acquisition, housing<br />
finance, building materials, statutory regulation among others.<br />
L<strong>and</strong> virtually remains a factor negatively affecting housing development in the study area due to<br />
incessant failure of developers to get title to l<strong>and</strong>. The long period of awaiting Right of Occupancy (R<br />
of O) <strong>and</strong> Certificate of Occupancy (C of O) is an outst<strong>and</strong>ing obstacle to residential property<br />
development in the study area.The payment of numerous fees by developers at various stages of<br />
preparation of the legal document discourages developers to continue with the struggle for l<strong>and</strong><br />
acquisition. Eventually, some of the respondents resort to informal way of l<strong>and</strong> acquisition which is<br />
financially cumbersome.<br />
The activities of hoarders also discourage l<strong>and</strong> development in the study area. The l<strong>and</strong>owners that<br />
are not capable of developing them are not willing to sell their l<strong>and</strong>s to the potential developers<br />
because they want to sell it at an exorbitant price. . The remaining available l<strong>and</strong> for sale attracts high<br />
price. This excessive rate shorts up development costs. High cost of building materials has been<br />
identified as one of the major problems militating against adequate residential property development in<br />
the study area. Generally, the problems have included that of scarcity <strong>and</strong> high cost of imported<br />
building materials or those with foreign components.<br />
In the study area, most developers do travel out to buy building materials in bulk to enable them<br />
realise some discounts as there is no building materials industry in Bauchi apart from asbestos roofing<br />
sheet industry. As earlier mentioned, this is due to the inflationary pressure in the economy which<br />
contributed excessively to the present rise in the cost of building materials, most especially when the<br />
building materials are imported.<br />
Unless these problems are taken as challenges or are addressed promptly in the study area, the<br />
problem of residential property development in Makama area is likely to remain for sometime. Indeed,<br />
without the total commitment <strong>and</strong> involvement of both private <strong>and</strong> public sector, there will be no long<br />
lasting solution to the identified problems. Thus, while trying to provide a long lasting solution to the<br />
problems in the study area, it is advised <strong>and</strong> hope that those involved in the provision of residential<br />
accommodation would look at it as a challenge as well as race that is fast moving ahead of time in the<br />
study area. For the purpose of overcoming the problems of private residential property development in<br />
Makama Jahun area, the following recommendations <strong>and</strong> suggestions are made:-<br />
1) There is a need to reduce the level of bureaucracy associated with l<strong>and</strong> acquisition <strong>and</strong> thereby<br />
quicken acquisition process in the study area. It is necessary to reduce the chain of schedule in formal<br />
l<strong>and</strong> acquisition. This will go a long way to facilitate efficient residential property development in the<br />
study area. This may not however be possible until when l<strong>and</strong> officers are exposed to broad training<br />
on simple map interpretations in cadastral surveying. This can enable them to confirm space under<br />
application, instead of forwarding that to survey department. Survey department can however continue<br />
with its traditional function of charting the layout <strong>and</strong> monitoring of such charts too.<br />
2). For effective <strong>and</strong> efficient l<strong>and</strong> acquisition to be put in place in the study area, there is the need to<br />
revisit the issue of l<strong>and</strong> fees charged currently <strong>and</strong> the basis of determination, especially in respect of<br />
residential need. The fixing of l<strong>and</strong> fees by the state chief executive should rather be h<strong>and</strong>led by a<br />
special committee that should be made up of professionals in l<strong>and</strong>- related disciplines. This is<br />
necessary because most of the state chief executives who are m<strong>and</strong>ated by the l<strong>and</strong> use decree to fix<br />
l<strong>and</strong> charges are not all professionals <strong>and</strong> therefore lack the professional skill with which to assess<br />
l<strong>and</strong> values.<br />
3). The use of local building materials should be encouraged by the government. The property<br />
developers should on their own use such building materials in the construction of their houses to<br />
demonstrate to the society that they are functional <strong>and</strong> durable. Also the government should grant<br />
subsidy to the industries manufacturing such local building materials until the society develops enough<br />
taste for such product to stimulate substantial dem<strong>and</strong>.<br />
4). Emphasis should be on functional design with economy of material uppermost by the property<br />
developers in the study area. Design type obviously has a direct effect on development cost, the<br />
realities of our time does not give any room for flamboyancy in design if we actually appreciate the<br />
meaning of residential property.
437<br />
International <strong>Building</strong> & <strong>Infrastructure</strong> Technology Conference<br />
7-8 June 2011, Vistana Hotel, Penang, Malaysia<br />
(5) Enforcing penalty for none development of allocated plots:- This measures will be taken in order to<br />
reduce the problem of l<strong>and</strong> speculation which is one of the important factors explaining the delay in the<br />
development of residential plots in the study area. Government should enforce a strict compliance with<br />
the conditions stated in the allocation paper. Where allottee fails to effect development on his plot after<br />
five years, the title to such l<strong>and</strong> should be revoked. This measure becomes necessary because the<br />
two years development, period is too short considering the present economic condition of the country,<br />
<strong>and</strong> the rate at which the plots are left undeveloped in different residential layouts within the<br />
metropolis.<br />
(6). Delay in disposing urban l<strong>and</strong>: - The Government should avoid unnecessary delay in disposing<br />
urban residential l<strong>and</strong> to genuine developers. In order to implement this effectively, right measures<br />
have to be taken in allocating the residential plots to most deserving applicants not to those who use<br />
the avenue as opportunity for making fortune. In addition to this, government <strong>and</strong> other financial<br />
institutions, should introduce <strong>and</strong> give out soft loan to developers, to facilitate plot development,<br />
particularly, the low income these groups. To implement this successfully loan should be inform of<br />
some building materials, such as cements roofing sheet etc.<br />
REFERENCES<br />
Abdul, A.A. (2008). Time Lag in the Development of Urban Residential Plots in Kano Metropolis. An<br />
Unpublished M.Sc. Thesis, Geography Department, Bayero University Kano.<br />
Abiodun. J. (2008). Housing Problems in Nigerian Cities. National Institute of Social <strong>and</strong> Economic<br />
Research (NISER). Intec Printers, Ibadan.<br />
Abraham, C. (2006). Man’s Struggle for Shelter in an Urbanising World. Massachusetts Institute of<br />
Technology Press, U.S.A.<br />
Adamu, E.O. (2007). The Private Development of Residential L<strong>and</strong> Subject to Statutory Title in<br />
Makurdi, Benue State, Nigeria. Unpublished M. Sc Thesis. Bayero University, Kano.<br />
Adebayo, A. <strong>and</strong> Rowling, L. (2007). Management Problems of Rapid Urbanisation in Nigeria.<br />
University of Ife Press, Ile –Ife, Nigeria.<br />
Ademola, T.S. (2006). Nigeria’s Housing Policies <strong>and</strong> Programmes: A Preliminary Assessments.<br />
Butgers University, U.S.A.<br />
Adeniyi, E.O. (2008) Challenges of Provision of Housing in Nigeria’s Urban Centres. Third<br />
International Conference on Housing. Years of Housing Development in Africa: Paper 1CH/12<br />
Kaduna.<br />
Adeniyi, E.O. (2007). Housing <strong>and</strong> the Construction Industry in Nigeria, Nigerian Institute of Social <strong>and</strong><br />
Economic Research (NISER) Intec Printers, Ibadan<br />
Agbola, T. Alabi, O. (2007). Major Problems of Housing in Nigeria .A Paper resented at the<br />
Workshop on Housing Organised by Bobabin Nig. Ltd, Held at Grennspring Hotel, Ibadan.<br />
Agbola, T. (2009). Projection of Urban Housing Needs NISER, Ibadan.<br />
Bourne, L.S. (2007) A Geography of Housing. Edward Arnold, London<br />
Bowyer, J. (2008) <strong>Building</strong> Technology. The Butterwort Group, United Kingdom<br />
Chatterjee, E. (2008) Urbanisation Trends <strong>and</strong> Problems of Urban Housing in Nigeria. Ibadan<br />
University Press, Ibadan.<br />
Clois, E.K. <strong>and</strong> Joan, C.K. (2009) Residential Housing. The Goodheart Willcox Company, Inc. South<br />
Holl<strong>and</strong> Illinois.<br />
Dwyer, D.J. (2005) People <strong>and</strong> Housing in Third World Cities. Longman Group Limited, London.<br />
Egunjobi, L. (2007) Housing Affordability <strong>and</strong> the Nigerian Poor. A Paper Presented at the<br />
Staff/Postgraduate Students Seminar 1997/1998 Session, Geography Department, University of<br />
Ibadan, Ibadan.<br />
Gilbert, A. (2007) The Housing of the Poor. In Gilbert A. <strong>and</strong> Gugler J. (ed) Cities, Poverty <strong>and</strong><br />
Development: Urbanisation in the Third World. Oxford University Press.
438<br />
International <strong>Building</strong> & <strong>Infrastructure</strong> Technology Conference<br />
7-8 June 2011, Vistana Hotel, Penang, Malaysia<br />
Jinadu, A.M. (2008) Underst<strong>and</strong>ing the Basic Issues of Housing. Federal University of Technology<br />
Minna Press. Minna<br />
John, R.J. (2009) L<strong>and</strong> Values, Housing Prices <strong>and</strong> Housing Shortages: A Geographical Perspective.<br />
In Lonegrams, D.A. <strong>and</strong> Palre, R (eds). An Invitation to Geography. Cambridge University Press,<br />
United Kingdom.<br />
Josephine, O.A. (2008) The Provision of Housing <strong>and</strong> Urban Environment Problems in Nigeria. In<br />
Josephine, O.A (ed), Urban <strong>and</strong> Regional Problems in Nigeria. University of Ife Press Ltd, Ile-Ife<br />
Nigeria.<br />
Liman, M. A. (2007) Low- Cost Housing system for the Urban Poor. In Fahd, D.D. (ed),<br />
Housing Problems in Developing Countries. John Wiley <strong>and</strong> Sons New York.<br />
Lawal, M.I. (2000) Principle <strong>and</strong> Practice of Housing Management. Environmental Design <strong>and</strong><br />
Management Series. ILCO Books <strong>and</strong> Publishers Taofik (Nig.) Ltd, Lagos.<br />
Sintia, I.B. (2008) A Solution to the Problem of Low-Income Housing in Developing Countries by Use<br />
of Pre-fabricated System. In Fahd D.D. (ed) Op Cit.<br />
Tipple, A. (2005) Self- help Housing Policy in a Zambian Mining Town. Journal of Urban Studies. 13(2)<br />
38-42.<br />
Tugyan, D. (2007) Low-Income Housing <strong>Systems</strong>. In Fahd D.D. (ed), Op Cit. NISER, Ibadan.
T200<br />
439<br />
International <strong>Building</strong> & <strong>Infrastructure</strong> Technology Conference<br />
7-8 June 2011, Vistana Hotel, Penang, Malaysia<br />
FIRE DESIGN FOR HOLLOWCORE CONCRETE FLOORING<br />
Md Azree Othuman Mydin<br />
School of Housing, <strong>Building</strong> <strong>and</strong> Planning, Universiti Sains Malaysia, 11800, Penang<br />
azree@usm.my<br />
ABSTRACT: In Malaysia <strong>and</strong> many other countries, the use of precast hollowcore concrete flooring<br />
systems in multi-storey buildings are very common. This is due to low onsite labour cost <strong>and</strong> high<br />
quality control. Among different precast flooring systems, prestressed hollowcore concrete slabs are<br />
the most popular because of their lightweight nature <strong>and</strong> the economical utilization of concrete.<br />
Nevertheless the structural behaviour of such systems under fire exposure is not straightforward to be<br />
envisaged because of the multifaceted geometry, composite construction <strong>and</strong> a extensive range of<br />
possible support conditions. This paper will describe the characteristics of hollowcore slabs <strong>and</strong> the<br />
advantages <strong>and</strong> disadvantages of hollowcore flooring systems. In addition, assessment on the<br />
requirements <strong>and</strong> recommendations to the fire design of concrete slabs from different st<strong>and</strong>ards will<br />
also be presented. These requirements will form the framework of future research focuses on<br />
providing a new method for the fire design of structures with hollowcore concrete flooring systems.<br />
Keywords: fire design, hollowcore slab, concrete flooring<br />
1. INTRODUCTION<br />
Multi-storey buildings with precast concrete flooring systems are becoming more popular <strong>and</strong> well<br />
accepted in Malaysia <strong>and</strong> in many other countries owing to low onsite labour cost <strong>and</strong> high quality<br />
control. Among diverse precast concrete flooring systems, prestressed hollowcore concrete slabs are<br />
among the popular because of their light weight <strong>and</strong> the economical use of concrete. Hollowcore<br />
concrete flooring systems are precast <strong>and</strong> pre-tensioned concrete slabs. Dimensions of every unit is<br />
1.2m wide, the depths of available unit in Malaysia are 150mm, 200mm, 300mm or 400mm, <strong>and</strong> the<br />
span length can be up to 20m for 400mm deep units. The units span one-way, <strong>and</strong> the current practice<br />
in Malaysia <strong>and</strong> most of other countries requires a layer of cast in-situ topping concrete which<br />
increases the shear strength <strong>and</strong> connects the hollowcore concrete units together laterally. The<br />
topping concrete can provide the completed floor some two-way spanning capability.<br />
There are two different processes that can be used to produce the voids within the hollowcore<br />
concrete units: extrusion or slip form. In this process, zero slump concrete is pierced by an extrusion<br />
machine which creates the voids (Matthews, 2004). Due to the nature of this process, it is not possible<br />
to include reinforcement in the hollowcore concrete units. The prestressing str<strong>and</strong>s are placed in the<br />
casting bed <strong>and</strong> stressed before the concrete is cast. With pre-tensioned concrete, anchorages for the<br />
prestressing steel are not used <strong>and</strong> the prestressing force in the str<strong>and</strong>s is transmitted to the concrete<br />
only by bond stresses (Fellinger, 2004).<br />
It is very important to distinguish the fire resistance of the floor slabs in multi-storey building design. If<br />
the given fire resistance of the floor slabs is less than the worst predictable fire severity, the outcome<br />
can be disastrous once the fire happens. Whilst the trend in the world of fire engineering is changing<br />
towards performance-based design, the present method to establish the fire resistance of hollowcore<br />
concrete system is still using tabulated data from the concrete st<strong>and</strong>ards, which in many countries are<br />
based upon equivalent slab thickness <strong>and</strong> not actual experimental results. It is quick <strong>and</strong> simple for<br />
designers to use tabulated data for the fire design of hollowcore concrete slabs. Because tabulated<br />
data is not performance based, by using it the designers decide to pay no attention to the structural<br />
behaviour of hollowcore flooring systems under fire.<br />
The structural behaviour of a hollowcore flooring system under fire is complex, <strong>and</strong> conducting fire<br />
experiments with large hollowcore floor slab sub-assemblies is almost impracticable. Accurate<br />
computer models for simulating the structural behaviour of hollowcore slabs under fires have been
440<br />
International <strong>Building</strong> & <strong>Infrastructure</strong> Technology Conference<br />
7-8 June 2011, Vistana Hotel, Penang, Malaysia<br />
developed to perk up the underst<strong>and</strong>ing of this behaviour (Fellinger, 2004), though; such analyses are<br />
too time-consuming to be relevant in the day-to-day design process. At the other end of the spectrum,<br />
simplistic approaches using straightforward code rules are insufficient to capture the thermal<br />
expansion across the units, the effects of the support conditions, or two-way behaviour. Hence, it is<br />
essential to develop a straightforward yet satisfactorily precise means for designers to model the<br />
structural fire behaviour of hollowcore slabs. For that reason, this research will focus on the<br />
characteristics of the hollowcore slabs which include the advantages <strong>and</strong> disadvantages. Additionally,<br />
this particular research will also compares the requirements <strong>and</strong> recommendations to the fire design of<br />
concrete slabs from different countries <strong>and</strong> code of practice.<br />
2. REQUIREMENTS AND RECOMMENDATIONS FOR FIRE DESIGN OF CONCRETE SLABS<br />
2.1 REQUIREMENTS FOR FIRE DESIGN OF CONCRETE SLABS<br />
All building codes requires that, in terms of the structural stability <strong>and</strong> safeguard against fire spread,<br />
the structural members exposed to fire shall allow sufficient time for people to evacuate securely <strong>and</strong><br />
also allow fire service personnel to undertake rescue <strong>and</strong> fire fighting operations. This is achieved by<br />
providing structural members with a fire resistance rating in accordance with ISO834 (ISO834, 1999).<br />
Within the claimed duration of fire resistance under the ISO834 st<strong>and</strong>ard fire shown in Figure 1, the<br />
load capacity of the floor should be maintained, flames or hot gases should not penetrate the slabs,<br />
<strong>and</strong> the floor should prevent an average temperature rise of 140°C or a local maximum of 180°C on<br />
the unexposed face. These three requirements, in such order, are also known as the stability, integrity<br />
<strong>and</strong> insulation criteria for the structural members.<br />
Figure 1. ISO 834 st<strong>and</strong>ard temperature-time curve (ISO834, 1999)<br />
In Europe, the performance requirement of the structures in fire is defined in Eurocode 1 (EC1, 2002)<br />
which includes an adequate level of load bearing ability, as well as integrity <strong>and</strong> insulation of the<br />
structural members to allow the evacuation of the occupants <strong>and</strong> the rescue operation by the firefighters.<br />
2.2 RECOMMENDATIONS FROM EUROCODES<br />
Eurocode 2 (EC2, 2002) for the design of concrete structures re-states the idea of retaining stability,<br />
integrity <strong>and</strong> insulation of the structural members as stated in Eurocode 1, but with much more detail.<br />
Other than using engineering design, Eurocode 2 also provides information on concrete slabs to fulfil<br />
there criterions which are stability, integrity <strong>and</strong> insulation. Stability is the st<strong>and</strong>ard specifies a<br />
minimum concrete cover to the tendons to achieve a particular fire resistance rating. This is also<br />
affected by the rotational restraints at the supports. Hence the fire resistance of continuous slabs are<br />
considered separately, <strong>and</strong> the two-way supported slabs are considered separately from one-way<br />
supported slabs <strong>and</strong> have different fire resistance based on the aspect ratio. Integrity is the st<strong>and</strong>ard<br />
states that a slab has a fire resistance rating for integrity if it meets the requirements for both insulation<br />
<strong>and</strong> stability for that rating. Finally insulation is the criterion which depends on the effective thickness<br />
of the slabs <strong>and</strong> the type of aggregate of the concrete. The effective thickness of hollowcore slabs is<br />
the net cross-sectional area divided by the width of the cross section. In addition, Eurocode 2 also<br />
provides three alternative design methods for calculating the fire resistance:
441<br />
International <strong>Building</strong> & <strong>Infrastructure</strong> Technology Conference<br />
7-8 June 2011, Vistana Hotel, Penang, Malaysia<br />
Simplified calculation methods – Eurocode 2 suggests two simplified calculation methods for<br />
assessing the ultimate load-bearing capacity of heated concrete members: 500°C isotherm method<br />
<strong>and</strong> zone method. The first method disregards the part of the cross section with concrete heated<br />
above 500°C <strong>and</strong> full strength is used for the remaining cross-section. In the second method the cross<br />
section of the element is divided into zones, each with a different amount of strength.<br />
Advanced calculation methods - Advanced calculation methods are based upon the fundamental<br />
physical behaviour aiming to provide a reliable approximation of the expected structural behaviour<br />
under fire. Both thermal <strong>and</strong> mechanical analysis should consider the temperature dependent<br />
properties of the materials. The result should be verified against relevant test results.<br />
Tabulated data – This tabulated data gives st<strong>and</strong>ard fire resistance based on minimum slab thickness<br />
<strong>and</strong> cover to the reinforcement.<br />
These design methods from Eurocode 2 are illustrated in Figure 2.<br />
Figure 2. Design methods for st<strong>and</strong>ard fire (Hietanen, 2005)<br />
2.3 RECOMMENDATIONS FROM ASTM E119<br />
ASTM E119 (ASTM, 1999) specifies laboratory procedures <strong>and</strong> criteria for determining fire resistance<br />
ratings of different proprietary floor systems. Fire testing of concrete members or assemblies<br />
according to ASTM E119 is often decided on the following two criteria (Phan, 2005):<br />
Heat transmission – This criterion limits the temperature rise of the unexposed surface. To meet this<br />
criterion, the walls, floors or roofs are required to have a sufficient thickness.<br />
Load carrying ability – This criterion limits the thermally reduced yield strength of steel reinforcement<br />
be at least 50% of the yield strength at ambient temperature. This is achieved by providing sufficient<br />
thickness of concrete cover. ASTME119 also recognises the difference in the fire resistance of<br />
concrete floor slabs caused by the restraint conditions at the supports. For a precast flooring system to<br />
be qualified as restrained, ASTM119 states the must that the space between the ends of precast units<br />
<strong>and</strong> the vertical faces of the supports, or between the ends of solid or hollow-core slab units does not<br />
exceed 0.25 percent of the length for normal weight concrete members or 0.1 percent of the length for<br />
structural lightweight concrete members. This definition is schematically illustrated in Figure 3.<br />
Figure 3. Definition of restraint by ASTM E119 for precast systems
442<br />
International <strong>Building</strong> & <strong>Infrastructure</strong> Technology Conference<br />
7-8 June 2011, Vistana Hotel, Penang, Malaysia<br />
2.4 RECOMMENDATIONS FROM PRESTRESSED CONCRETE INSTITUTE (PCI)<br />
The 1989 design manual from PCI Fire Committee provided some calculation methods to evaluate the<br />
fire resistance of structures with precast <strong>and</strong> prestressed concrete but not specifically for hollowcore<br />
slabs (Gustaferro et al., 1989). The st<strong>and</strong>ard fire follows ASTM E119, in which the time-temperature<br />
curve is shown along with the ISO834 st<strong>and</strong>ard fire in Figure 4.<br />
Figure 4. St<strong>and</strong>ard fire temperature curves<br />
The manual considers different restraint conditions on the slabs. In simply supported slabs the ends of<br />
the slab are free to rotate <strong>and</strong> move. The recommended calculation method focuses on the flexural<br />
failure mode; this is reflecting the fact that in all the fire tests none of the simply supported prestressed<br />
slabs designed according to ACI 318 has failed in shear. This flexure calculation method considers the<br />
loss of moment capacity during fire, resulting from the reduction of tensile strength in the prestressed<br />
str<strong>and</strong>s <strong>and</strong> not by the loss of compressive strength in concrete. This is because the compression<br />
zone, which is near the top of the slab, remains at low temperatures during fires. The steel or concrete<br />
temperature with different cover thickness or depth after different time of exposure is obtained from<br />
experimental results <strong>and</strong> given as graphs in the manual. The continuous slab is taken as having an<br />
intermediate support in the simply supported slab, therefore both ends of the slab can still rotate <strong>and</strong><br />
displace freely, but the bending moment diagram is different due to the presence of the intermediate<br />
support. The schematic drawing of a continuous slab, as well as the bending moment diagrams before<br />
<strong>and</strong> after the exposure of fire are shown in Figure 5. In the continuous slab the topping is used to<br />
provide continuity across the support, but it has been observed that the reinforcing bars in the topping<br />
around the support, which are the negative moment reinforcement, yield early during the fire tests <strong>and</strong><br />
cause the redistribution of bending moments (Gustaferro, 1970). The behaviour of continuous beams<br />
<strong>and</strong> slabs in fire was tested on a series of 300mm by 350mm deep beams. At the support there are six<br />
no.6 (20mm diameter) reinforcement bars at the top <strong>and</strong> two at the bottom, at the midspan there are<br />
two bars at the top <strong>and</strong> four bars at the bottom.<br />
Figure 5. Schematic drawing of a continuous slab; the bending moment diagram at cold condition <strong>and</strong><br />
after 3 hours of the ASTM E119 st<strong>and</strong>ard fire
443<br />
International <strong>Building</strong> & <strong>Infrastructure</strong> Technology Conference<br />
7-8 June 2011, Vistana Hotel, Penang, Malaysia<br />
During the fire test the bottom of the beams was hotter than the top, therefore it exp<strong>and</strong>ed more <strong>and</strong><br />
created thermal bowing. The thermal bowing caused the ends of the beam to lift from their supports<br />
<strong>and</strong> consequently increased the reaction at the interior supports causing a redistribution of moments.<br />
In summary, thermal bowing increases the negative moment along the length of the beam.<br />
When the negative moment reinforcement yields, the negative bending moment capacity is reached,<br />
hence the amount of moment redistribution depends upon the amount of negative moment<br />
reinforcement. It is important to limit the negative moment reinforcement so that compression failure in<br />
the negative moment region does not occur. Furthermore, the length of the negative moment<br />
reinforcement must be long enough to accommodate the complete redistributed moment <strong>and</strong> change<br />
in the inflection points. Therefore it is recommended that at least 20% of the maximum negative<br />
moment reinforcement is extended throughout the span.<br />
This design method indicates that the positive bending moment capacity can be designed as for<br />
simply supported slab, <strong>and</strong> the negative bending moment capacity should be designed as the total<br />
bending moment minus the positive bending moment. The total moment is the maximum bending<br />
moment the beam or slab would encounter if it is simply supported, for uniformly distributed load that<br />
means wL 2 /8, where w is the uniformly distributed load <strong>and</strong> L is the length of the span; the positive<br />
bending moment can be obtained from the figures in the appendix of PCI Design for Fire Resistance of<br />
Precast Prestressed Concrete (Gustaferro et al., 1989) or tables in Chapter 5 of PCI Design H<strong>and</strong>book<br />
(Martin et al., 2004). Gustaferro et al. (1989) also provides the calculation method for the minimum<br />
length of the negative moment reinforcement. The manual also provides the calculation method for the<br />
minimum length of the negative moment reinforcement.<br />
3. ENGINEERING DESIGN METHOD<br />
All the st<strong>and</strong>ards mentioned above allow for using an engineering design method to calculate the<br />
required dimensions for structural members to meet the desired fire resistance. There are several<br />
computer programs available to analyse the behaviour of concrete structures under fire conditions, in<br />
both micro <strong>and</strong> macro scale. Due to the advancing of computational power, finite element programs<br />
such as Vulcan (Huang et al., 2006) <strong>and</strong> SAFIR (Franssen, 2002) are used not only for research or<br />
forensic analysis purposes but also for design by industry. Nevertheless, in terms of fire design of<br />
hollowcore concrete slabs, to the author’s knowledge there is no ideal computer model for such<br />
purpose so far, hence one of the aims of this research is to create such a model.<br />
4. PROPRIETARY FIRE RATING OF HOLLOWCORE UNITS<br />
Proprietary fire rating is the fire resistance rating of proprietary products made by specific<br />
manufacturers. These ratings are obtained by either testing or by calculation depending on the<br />
manufacturers, <strong>and</strong> the engineer should consult the manufacturer to confirm the accuracy of the fire<br />
rating. In the US, Underwriters Laboratories has conducted more than 30 st<strong>and</strong>ard fire tests on<br />
hollowcore floor assemblies <strong>and</strong> published the results for more than 50 designs of hollowcore slabs<br />
which qualify for ratings of 1 to 4 hours. For hollowcore units not found in the Underwriters<br />
Laboratories ratings, the fire resistance rating can be obtained by conducting st<strong>and</strong>ard fire tests in<br />
accordance with ASTM E119 (ASTM, 1999) as mentioned before or by using the effective thickness<br />
method described in the PCI Manual (Gustaferro et al., 1989). Engineers should give different levels of<br />
caution to the prescribed fire ratings depending on the methods used.<br />
5. CONCLUSIONS<br />
This paper has discussed some important characteristics of the hollowcore slabs <strong>and</strong><br />
recommendations <strong>and</strong> requirements to the fire design of from different countries <strong>and</strong> code of practice.<br />
It is vital to distinguish the fire resistance of the floor slabs in multi-storey building design. If the given<br />
fire resistance of the floor slabs is less than the worst expected fire sternness, the result can be<br />
devastating once the fire occurs. It is expected that the obligations <strong>and</strong> requirements discussed in this<br />
paper will shape the framework of potential <strong>and</strong> future research focuses on providing a new means for<br />
the fire design of structures with hollowcore concrete flooring systems.
444<br />
International <strong>Building</strong> & <strong>Infrastructure</strong> Technology Conference<br />
7-8 June 2011, Vistana Hotel, Penang, Malaysia<br />
ACKNOWLEDGMENTS<br />
The author would like to acknowledge Universiti Sains Malaysia (<strong>USM</strong>) as a funding body for this<br />
study under <strong>USM</strong> Incentive Grant (Ref. No. 2011/0348). Acknowledgement is also made to the<br />
academic members <strong>and</strong> staff of the School of Housing, <strong>Building</strong> <strong>and</strong> Planning, Universiti Sains<br />
Malaysia for all their supports <strong>and</strong> assistance.<br />
REFERENCES<br />
ASTM (1999) St<strong>and</strong>ard Test Methods for Fire Tests of <strong>Building</strong> Construction <strong>and</strong> Materials, E119-98,<br />
American Society for Testing <strong>and</strong> Materials, Philadelphia, USA<br />
EC1 (2002) Eurocode 1: Actions on structures. PrEN 1991-1-2: Actions on structures exposed to fire,<br />
European Committee for St<strong>and</strong>ardization, Brussels<br />
EC2 (2002) Eurocode 2: Design of concrete structures. PrEN 1992-1-2: General rules- Structural fire<br />
design, European Committee for St<strong>and</strong>ardization, Brussels<br />
Fellinger, J.H.H (2004) Shear <strong>and</strong> Anchorage Behaviour of Fire Exposed Hollow Core Slabs, DUP<br />
Science, the Netherl<strong>and</strong>s<br />
Franssen, J.M., Kodur, V.K.R. & Mason, J. (2002) User’s Manual for SAFIR2001 Free : A Computer<br />
Program for Analysis of Structures at Elevated Temperature Conditions, Service Ponts et Charpentes,<br />
Department Structures du Génie Civil, University of Liège, Belgium<br />
Gustaferro, A.H. & Martin, L.D. (1989) Design for Fire Resistance of Precast Prestressed Concrete,<br />
2nd Ed., Prestressed Concrete Institute, Illinois, USA<br />
Gustaferro, A.H. (1970) Temperature Criteria at Failure, Fire Test Performance, ASTM STP 464,<br />
American Society for Testing <strong>and</strong> Materials, pp. 68-84<br />
Hietanen, T. (2005) Actual state of the codes on fire design in Europe, Proceedings of the Workshop<br />
Fire Design of Concrete Structures: What now? What Next?, Milan, Italy, 2005, pp.21-24<br />
Huang, Z. Burgess, I.W. & Plank, R.J. (2006) Behaviour of Reinforced Concrete Structures in Fire, 4th<br />
international Workshop Structures in Fire, Aveiro, Portugal, 2006, pp. 561-572<br />
ISO 834 (1999) Fire Resistance Test – Elements of <strong>Building</strong> Construction, International Organization<br />
for St<strong>and</strong>ardization, Geneva<br />
Martin, L.D. & Perry, C.J. (ed.) (2004), PCI Design H<strong>and</strong>book - Precast <strong>and</strong> Prestressed Concrete, 6th<br />
Ed., Precast/Prestressed Concrete Institute, Chicago<br />
Matthews, J. (2004) Alternative Load Paths for Floor Diaphragm Forces Following Severe Damage to<br />
the Supporting Beams, Thesis (PhD), University of Canterbury, New Zeal<strong>and</strong><br />
Phan, L. (2005) Codes <strong>and</strong> st<strong>and</strong>ards for fire safety design of concrete structures in the U.S.,<br />
Proceedings of the Workshop Fire Design of Concrete Structures: What now? What Next?, Milan,<br />
2005, pp.25-34
T119<br />
445<br />
International <strong>Building</strong> & <strong>Infrastructure</strong> Technology Conference<br />
7-8 June 2011, Vistana Hotel, Penang, Malaysia<br />
INNOVATIVE SEISMIC BASE ISOLATION TECHNIQUE<br />
Shivam R. Mishra 1 <strong>and</strong> Sameer S. Dhuri 2<br />
1,2 Civil Engineering, VJTI, Mumbai, India<br />
1 shivam18@gmail.com<br />
ABSTRACT: Design of earthquake-resistant low to medium-rise structures is quite a challenging task.<br />
It is necessary <strong>and</strong> important to dissipate the energy which is generated from an earthquake. Base<br />
isolation technique is one of the advanced methods. By deploying this technique, the earthquake<br />
energy can be dissipated <strong>and</strong> the structure can be made earthquake resistant. Conventional energy<br />
dissipation techniques involve the use of Rubber Bearings. The disadvantages of currently available<br />
isolators are high cost of devices <strong>and</strong> their installation, short life span of bearings (high maintenance)<br />
<strong>and</strong> last but not the least, in case of Lead Rubber Bearings the toxic nature of lead makes it difficult to<br />
dispose-off, posing severe environmental issues <strong>and</strong> health hazards. In the present work, an<br />
experimental study has been carried out by conducting series of tests on multi-storeyed scaled<br />
building model by incorporating a viscous fluid <strong>and</strong> springs. This system basically comprises of two<br />
components viz. a highly viscous incompressible fluid present below the super-structure <strong>and</strong> a spring<br />
as stiffness element installed at the sides of the superstructure. This innovative design is an alternative<br />
to isolation system with Rubber Bearings. The building model is tested under seismic excitations<br />
generated by shake-table. Significant reductions in displacement <strong>and</strong> acceleration response quantities<br />
are found for the building with proposed isolation technique as compared to the non-isolated building.<br />
This isolation system has shown notable reduction in base displacement <strong>and</strong> inter-storey drifts as<br />
compared to non-isolated cases. The proposed technique provides good protection to both, the<br />
structure <strong>and</strong> its non-structural components over a wide range of earthquake ground motions.<br />
Keywords: earthquake, energy dissipation, base isolation, viscous fluid, spring<br />
1. INTRODUCTION<br />
Seismic isolation has emerged as one of the most promising techniques for retrofitting strategies to<br />
improve the seismic performance of existing structures. It is also a practical solution for new<br />
construction when conventional design is not suitable or economical. In the seismic isolation<br />
approach, the superstructure mass is decoupled from seismic ground motions. It uses special types of<br />
bearings known as seismic isolation bearings which are placed below the superstructure <strong>and</strong> on top of<br />
the substructure piers <strong>and</strong>/or abutments. Under normal conditions, these bearings behave like<br />
conventional bearings. However, in the event of a strong earthquake, they add flexibility to the<br />
structure by elongating its period <strong>and</strong> dissipating input energy. This permits the superstructure to<br />
oscillate at a lower frequency than the piers resulting in large relative displacements across the<br />
isolator interface.<br />
However, these large displacements can be controlled by incorporating damping elements in the<br />
bearing or by adding supplemental dampers. Seismic isolation provides two significant design features<br />
for a structure, viz. (1) it can reduce the seismic forces substantially, <strong>and</strong> (2) it can control the<br />
distribution of these reduced lateral forces among the substructures <strong>and</strong> foundations to further<br />
enhance the overall economy <strong>and</strong> effectiveness of new <strong>and</strong> retrofit designs. Seismic isolation is a<br />
proven design idea. This technique proposes to decouple the structure or part of it, or even the<br />
equipment placed in the structure from destructive effects of ground-motions. One of the aims of<br />
seismic isolation is to shift the fundamental frequency of the structure away from the dominant<br />
frequencies of earthquake induced ground-motion <strong>and</strong> the fundamental frequency of the fixed base<br />
superstructure. The other purpose of an isolation system is to provide an additional mean of energy<br />
dissipation, thereby reducing the transmitted acceleration into the superstructure. This innovative<br />
design approach is aimed mainly at the isolation of a structure from the supporting ground. This is<br />
commonly deployed in the horizontal direction so as to reduce the transmission of shear forces to the<br />
structure.
Super-structure<br />
Spring<br />
Figure 1. Schematic Diagram<br />
446<br />
International <strong>Building</strong> & <strong>Infrastructure</strong> Technology Conference<br />
7-8 June 2011, Vistana Hotel, Penang, Malaysia<br />
Viscous Fluid<br />
1.1 Objective of current study<br />
The protection of civil structures, including material content <strong>and</strong> human occupants is a worldwide<br />
priority. The extent of protection may range from reliable operation <strong>and</strong> occupant comfort to human<br />
<strong>and</strong> structural survivability. Civil structures, including the existing <strong>and</strong> future buildings, towers <strong>and</strong><br />
bridges must be adequately protected from a variety of events. This includes earthquakes, wind, traffic<br />
<strong>and</strong> other dynamic loads. Use of passive, active <strong>and</strong> semi-active structural control devices to mitigate<br />
undesired responses to dynamic loads is the worldwide subject of research. However, even in<br />
controlled structures, it can be expected that large seismic events, such as the Northridge (1994) <strong>and</strong><br />
the Kobe (1995) earthquakes, will cause structural members to exceed the elastic limit. Recent<br />
devastating earthquakes around the world have confirmed the importance of control devices in<br />
protection of civil structures. Structural control devices have been developed mainly in civil<br />
engineering structures to dissipate energy from earthquake <strong>and</strong> reduce vibrations in structures. This<br />
also reduces human <strong>and</strong> material losses. This technique helps in reducing the effective shear forces<br />
acting on the superstructure <strong>and</strong> hence minimising the chances of failure of a building during an<br />
earthquake. The main idea behind developing or proposing an isolation system is to propose a system<br />
which increases the time period of oscillation, reduces the frequency <strong>and</strong> shear force coefficient. The<br />
motivation behind developing this system is to make a highly economical <strong>and</strong> cost effective system.<br />
The key objective is to develop an intelligent damping system that not only provides damping in lateral<br />
but also in vertical direction in order to maintain stability. The primary idea of this technique is to<br />
reduce the collapse potential of a building <strong>and</strong> enhance its structural safety. This greatly improves the<br />
serviceability of the structures, resulting in higher returns on investments in case of mega-structures.<br />
Thus the objective of the new proposed system is to isolate the superstructure from the intense ground<br />
vibrations during an earthquake. This is basically done by dissipating the high energy seismic waves<br />
<strong>and</strong> reducing the intensity of vibrations for the structure during an earthquake. The structure is thus<br />
ensured of having lesser or negligible damage <strong>and</strong> higher bearing capacity.<br />
1.2 Proposed innovative technique<br />
Existing systems make use of bearings for isolations which have few disadvantages. The proposed<br />
system attempts to overcome these short-falls. The superstructure is fundamentally isolated by means<br />
of a thin layer of viscous fluid <strong>and</strong> springs. The springs are deployed at the sides, of which one end is<br />
fastened to the moat <strong>and</strong> the other end to the super structure. There exists a thin layer between the<br />
base slab of the isolated structure <strong>and</strong> the ground.<br />
1.3 Concept <strong>and</strong> working of system<br />
The seismic surface waves travel with high energies <strong>and</strong> are known be the most destructive waves.<br />
These high energy waves are responsible for most of the structural <strong>and</strong> non-structural damage. In<br />
order to minimize the destructive forces induced at the advent of the seismic waves, it is of paramount<br />
importance to dissipate this energy. This energy is dissipated by providing adequate isolation to the<br />
structure. The structure to be isolated is provided with a base slab. The base slabs are provided with
447<br />
International <strong>Building</strong> & <strong>Infrastructure</strong> Technology Conference<br />
7-8 June 2011, Vistana Hotel, Penang, Malaysia<br />
calculated air columns/cavities as buoyant units. A layer of incompressible viscous fluid is provided<br />
between this slab <strong>and</strong> the raft of its foundation. The base slab is appended with number of heavy duty<br />
springs. The other end of the springs is secured on the retaining walls of the moat. At the advent of<br />
seismic waves, most of the energy of the surface waves are absorbed <strong>and</strong> dissipated to large extent<br />
with the help of combined damping action of the springs <strong>and</strong> the viscous fluid. This increases<br />
horizontal as well as vertical flexibility of the isolated structure. This considerably reduces the amount<br />
of shear forces transmitted to the superstructure. Thus, it helps in increasing the time period of<br />
structural vibration <strong>and</strong> reduces the drift acceleration with respect to the ground.<br />
1.4 Advantage of proposed system<br />
The Maintenance of this system is minimal as compared to the existing primitive systems. The existing<br />
systems do not isolate the structure from vertical vibrations. The proposed technique is capable of<br />
providing both lateral <strong>and</strong> vertical damping. The technique can allow economic design of structural<br />
members as the lateral forces for which the members have to be designed are relatively less.<br />
Reduced overall capital cost - the structure can be designed more economically. For example, in case<br />
of the St Francis Towers project, there was a net saving of at least US$ 4mn. For most of the tall<br />
building projects over 200m high that had been reviewed by structural engineers <strong>and</strong> experts, there<br />
had been a net cost saving when a isolation outrigger system or similar was used. Due to reduction in<br />
design forces, the columns can be designed in economical sizes. This results in a considerable<br />
increase in net floor areas. This typically leads to 0.5-2% more net floor area. This may sound small,<br />
but its value can often exceed the capital cost savings made. Unlike many existing systems, the<br />
proposed technique is effective for minor quakes <strong>and</strong> wind pressures.<br />
1.5 Applications<br />
As mentioned, the proposed technique has numerous advantages over the existing systems. The<br />
technique being economical <strong>and</strong> maintenance free can be applied to all important structures as well as<br />
other residential <strong>and</strong> commercial structures in seismically active zones. The system can be easily<br />
applied to both - existing structures for retrofitting <strong>and</strong> new construction.<br />
2. MATHEMATICAL MODEL<br />
Figure 2. Modelling of Isolated Structure<br />
Governing Equation for Isolation in Horizontal Plane:<br />
Governing Equation for Isolation in Vertical Plane:
The equations can be written in matrix form as:<br />
448<br />
International <strong>Building</strong> & <strong>Infrastructure</strong> Technology Conference<br />
7-8 June 2011, Vistana Hotel, Penang, Malaysia<br />
3. SCALED PROTOTYPE DESCRIPTION<br />
As mentioned, the proposed isolation technique mainly consists of two components viz. viscous fluid<br />
<strong>and</strong> the heavy duty helical springs at the sides. A 2 storeyed scaled model was prepared using mild<br />
steel plates <strong>and</strong> threaded rods. The slabs are represented by 3 mm thick 16x16 cm mild steel metal<br />
plates <strong>and</strong> the columns are represented by the 6 mm diameter threaded rods. Appropriate inter-storey<br />
height was chosen conforming to required structural stiffness <strong>and</strong> natural frequency<br />
Figure 3. Model fixed on Shake Table<br />
The substructure was also prepared using mild steel which was required to represent the moat. It was<br />
made leak-proof to avoid leakage of any viscous fluid which was to be used during experiments. A pair<br />
of spring was fixed with one of its ends on the moat wall <strong>and</strong> other end on the 2-storeyed structure.<br />
The superstructure was allowed to rest on a thin layer of viscous oil. The complete prototype<br />
assemblage was fastened on to the shake-table by means of bolts. The shake-table had a capacity of<br />
generating frequencies in the range of 5-50 Hz.<br />
4. EXPERIMENTAL ANALYSIS<br />
Figure 4. Isolated Structure Model<br />
The 2-storey model was clamped <strong>and</strong> two accelerometers were attached in the middle <strong>and</strong> top storey.<br />
It was subjected to r<strong>and</strong>om excitation. The natural frequency of the structure was found out by freevibration<br />
method. The response was analysed using FFT (Fast Fourier Transform). The two modal<br />
frequencies were found out to be 13 Hz <strong>and</strong> 38 Hz. Same model was then fixed on the shake table for<br />
testing under dynamic conditions. The model was subjected to a forced harmonic vibration of 0.1g.<br />
Accelerations of the middle <strong>and</strong> top slab were measured using accelerometers. The forced
449<br />
International <strong>Building</strong> & <strong>Infrastructure</strong> Technology Conference<br />
7-8 June 2011, Vistana Hotel, Penang, Malaysia<br />
frequencies generated by the shake-table were increased from 5Hz to 45Hz <strong>and</strong> corresponding<br />
accelerations were noted for the slabs. The results were tabulated <strong>and</strong> a graph was plotted.<br />
The scaled model was decoupled from shake table using the proposed isolation system. The<br />
assemblage was then subjected to same forced harmonic vibrations. Similar procedure was adopted<br />
for measuring <strong>and</strong> noting the behaviour of system for ascending frequencies of the shake table.<br />
The natural frequency of isolation system was found out by free vibration response using FFT. This<br />
frequency was found to be 3 Hz.<br />
5. EXPERIMENTAL RESULTS<br />
The FFT analysis was carried out by placing accelerometers at the first <strong>and</strong> second storey. The<br />
readings for accelerations were compiled. ‘Transmissibility Ratios’ were calculated for corresponding<br />
‘Forcing Frequencies’ for both fixed <strong>and</strong> isolated conditions. The frequency response for the two<br />
conditions was obtained graphically.<br />
The experimental findings are depicted as below:<br />
Chart 1. Frequency response for middle storey<br />
Chart 2. Frequency response for top storey<br />
The damping ratios (�) were calculated for both middle <strong>and</strong> top storey under fixed <strong>and</strong> isolated<br />
conditions. The damping ratios for fixed <strong>and</strong> isolated structures under different modes can be given as:<br />
The damping ratios for middle storey in 1 st mode were found as:<br />
The damping ratios for middle storey in 2 nd mode were found as:
The damping ratios for top storey in 1 st mode were found as:<br />
The damping ratios for top storey in 2nd mode were found as:<br />
450<br />
International <strong>Building</strong> & <strong>Infrastructure</strong> Technology Conference<br />
7-8 June 2011, Vistana Hotel, Penang, Malaysia<br />
6. DISCUSSION<br />
The effectiveness of the proposed isolation system is very much evident from the experimental results.<br />
The average damping ratio of (�) 20.5% in the first mode is more than that of LRB, N-Z systems <strong>and</strong><br />
few other isolators.<br />
There was an unanticipated downcast of damping ratio under 2 nd mode i.e. 37 Hz. This could be<br />
explained by knowing the fact that; the springs used for experiments had a natural frequency of 37.1<br />
Hz. (Spring Stiffness = 1418 N/m; Spring Mass = 26.1 gm.). During experimental tests, when the<br />
‘Forcing Frequency’ equaled the natural frequency of the springs, (i.e. under resonance condition) the<br />
springs failed to dissipate the energy of vibration effectively.<br />
This can easily be avoided by designing the springs accordingly. And hence, same damping ratio<br />
(20%) can be maintained under different dynamic <strong>and</strong> modal conditions.<br />
Knowing that the technique is still in its primitive <strong>and</strong> crude stage, <strong>and</strong> the experiments were done<br />
under limited resources, the results are encouraging. The performance of the proposed technique can<br />
be ameliorated by further research <strong>and</strong> experiments with better resources.<br />
7. CONCLUSIONS<br />
Thus we conclude that the above mentioned system can lead to substantial saving of lives <strong>and</strong> cost<br />
incurred due to damage of structures when implemented on a large scale. The limitations of the<br />
existing systems being excessive operating <strong>and</strong> maintenance cost, which can be solved by application<br />
of the proposed system. The design of above system can be modified as per site conditions to meet<br />
the requirements. For its low cost, minimal maintenance, effective <strong>and</strong> eco-friendly behaviour, we<br />
conclude that the proposed system proves to be a better alternative.<br />
REFERENCES<br />
Naeim Farzad <strong>and</strong> Kelly James. (1999) Design of Seismic Isolated Structures.<br />
Matsagar Vasant <strong>and</strong> Jangid R.S. (2011) Earthquake Base-Isolated <strong>Building</strong>s.<br />
Komodromos P. (2000) Seismic Isolation for Earthquake Resistant Structures<br />
Chopra Anil K. (2001) Dynamics of Structure<br />
Garevski Mihail <strong>and</strong> Ansal Atilla (2010) Earthquake engineering in Europe<br />
Stratta James L. (2003) Manual of Seismic Design<br />
ACKNOWLEDGEMENTS<br />
We would like to express our gratitude to Prof. (Dr) R. S JANGID (DEPT OF CIVIL ENGG, IIT<br />
Mumbai) who supported our project <strong>and</strong> encouraged us. The project would not have been possible<br />
without his guidance. We also owe the success of this research to Mr. NISSAR KHAN (IIT Mumbai),<br />
Mr. SNEHAL MEVADA (IIT Mumbai). We acknowledge their prestigious <strong>and</strong> valuable contributions, in<br />
making our project successful.