HYDRODESULFURIZATION OF THIOPHENE OVER BIMETALLIC ...
HYDRODESULFURIZATION OF THIOPHENE OVER BIMETALLIC ...
HYDRODESULFURIZATION OF THIOPHENE OVER BIMETALLIC ...

You also want an ePaper? Increase the reach of your titles
YUMPU automatically turns print PDFs into web optimized ePapers that Google loves.
Count/arb, units<br />
500<br />
400<br />
300<br />
200<br />
100<br />
Hamid A. Al-Megren<br />
0<br />
0 10 20 30 40 50 60 70<br />
2 q<br />
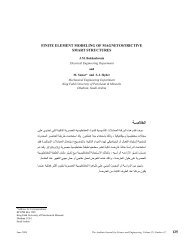
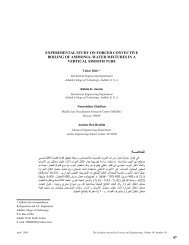
Figure 1. XRD pattern for Ni3Mo7Ox/Al2O3 catalysts prepared by Impregnation, Mechanical and OMXC methods<br />
The Arabian Journal for Science and Engineering, Volume 34, Number 1A January 2009 59<br />
Al<br />
Al<br />
Al<br />
Al<br />
Al<br />
OMXC<br />
Al<br />
The X-ray diffraction patterns for the three samples in oxide phase are shown in Figure 1. Sample MECH shows<br />
an appearance of MoO3 peaks at 2θ values of 14.4, 23.6, and 26.8º. Sample IMPR also shows slight appearance of<br />
MoO3 peak at 2θ values of 23.6º, while there is no appearance of these peaks on the sample prepared by OMXC<br />
method. These appearances of the MoO3 peaks suggest that both methods, mechanical and impregnation, lead to<br />
lower dispersion of the active component compared to OMXC method, which enables a high dispersion of<br />
Ni3Mo7Ox.<br />
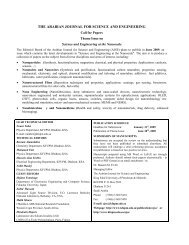
Raman spectroscopy is a powerful tool to study the structure of catalytically active phases on a support. Typical<br />
support such as alumina shows weak Raman scatters, with consequence that adsorbed species can be measured at<br />
frequencies as low as 50 cm –1 [10]. Figures 2, 4, and 8 show the Raman spectra of the oxides and sulfided phase for<br />
the catalysts in the 200–2000 cm –1 range. The spectra of Ni3Mo7Ox/Al2O3 catalysts do not exhibit the features of<br />
Ni3Mo7Sx/Al2O3 catalysts. The Raman spectra of NiMoOx/Al2O3 bimetallic supported oxide samples prepared using<br />
the three methods are shown in Figure 2. It shows that the main phase on the surface of samples IMPR and MECH<br />
is MoO3. The Raman band on these samples at 995 cm –1 corresponds to the stretching mode of Mo=O, and the band<br />
at 830 cm –1 corresponds to the anti-symmetric stretching mode of Mo–O–Mo, and the band at 295 cm –1 corresponds<br />
to the bending mode of Mo=O in the polycrystalline MoO3. The strong band at 965 cm –1 on sample MECH is due to<br />
the A1 mode of Mo=O in the MoO4 tetrahedral units. The broad band for samples IMPR and OMXC at 955 cm –1 ,<br />
which can be unfolded into two peaks at 955 and 965 cm –1 , highlights the band characteristic of NiMoO4. The<br />
Raman results suggest that the main oxide present clearly on the surface of sample MECH and IMPR is MoO3. Our<br />
findings agree with those reported by Sergio et al. [46, 47]. In addition, the shoulder of 950 cm –1 and the weak<br />
Raman bands at about 825 cm –1 are associated with the Mo–O–Mo for the polymolybdate species [48–51]. On the<br />
other hand, the weak intensity band at 950 cm –1 is characteristic of Ni–Mo oxide.<br />
Ramman Pand Intincety<br />
4500<br />
4000<br />
3500<br />
3000<br />
2500<br />
2000<br />
1500<br />
1000<br />
500<br />
MECH<br />
OMXC<br />
I MPR<br />
Al<br />
MECH<br />
I MPR<br />
0<br />
0 500 1000 1500 2000<br />
Ramman Shift, cm -1<br />
Figure 2. Laser Raman spectra for Ni 3Mo 7O x/Al 2O 3 catalysts prepared by Impregnation, Mechanical and OMXC methods