Annual Report 2009 - Interroll
Annual Report 2009 - Interroll
Annual Report 2009 - Interroll

Create successful ePaper yourself
Turn your PDF publications into a flip-book with our unique Google optimized e-Paper software.
W W W.I NTE RROLL.C O M<br />
INTERROLL<br />
CORPORATE<br />
ART<br />
�<br />
annual report<br />
<strong>2009</strong><br />
<strong>Interroll</strong> profile<br />
<strong>Interroll</strong> is one of the world’s leading specialists within the<br />
field of materials handling, logistics and automation. headquartered<br />
in sant’antonino, switzerland, the company<br />
employs some 1200 people at 28 enterprises around the globe.<br />
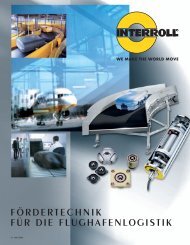
Typical <strong>Interroll</strong> solutions<br />
At the airport you place your hand luggage onto the conveyor belt of the X-ray machine (left): integrated drum<br />
motors and idlers made by <strong>Interroll</strong> drive the belt and direct your baggage to its destination. – Before soft<br />
drinks, packaged foodstuffs and non-food goods can find their way to the supermarket shelves they have to<br />
be organised and dispatched by central and regional distribution centres equipped with dynamic pallet flow<br />
modules designed by <strong>Interroll</strong> (centre). And then there’s your letter, processed by an <strong>Interroll</strong> Crossbelt Sorter<br />
at the mail sorting centre (right) and forwarded to finally arrive at the right letterbox.<br />
These and many other intelligent products made by <strong>Interroll</strong> perform a multitude of tasks around the globe;<br />
wherever goods need to be conveyed, stored and distributed; in every sector imaginable and along the entire<br />
value chain. <strong>Interroll</strong> solutions have proved particularly popular in the food and beverage industry, in the field<br />
of airport logistics (baggage conveying and security technology), in the courier, express delivery and postal<br />
sector, in the area of logistical services, as well as in the industrial and healthcare sectors. But no matter where<br />
<strong>Interroll</strong> products are deployed, customers can always rest assured that they will receive a premium quality<br />
solution tailored to their individual requirements.<br />
<strong>Interroll</strong> customers<br />
<strong>Interroll</strong>’s range of state-of-the-art conveyor components, such as drum motors, is targeted principally at regional<br />
system engineering companies and original equipment manufacturers. Conveyor modules (e.g. for dynamic<br />
storage solutions) and subsystems (e.g. crossbelt sorters) are supplied mainly to global system integrators,<br />
multinational companies and end-users. <strong>Interroll</strong> serves more than 23 000 customers across all continents.<br />
Financial year <strong>2009</strong><br />
For an overview of the financial year <strong>2009</strong> please look at the inside of this front cover. The detailed financial<br />
report starts on page 45.<br />
www.interroll.com • www.interroll.com/ir (Investor Relations)
Key FIgures oF The InTerroLL grouP<br />
in thousands CHF <strong>2009</strong> 2008 2007 2006 2005<br />
Net sales with third parties: Components 157 917 223 702 235 244 196 465 143 999<br />
Net sales with third parties: Subsystems 76 070 134 218 135 611 115 557 101 467<br />
Total net sales 233 987 357 920 370 855 312 022 245 466<br />
EBITDA 18 828 58 213 67 544 44 458 33 234<br />
in % of net sales 8.0 % 16.3 % 18.2 % 14.2 % 13.5 %<br />
EBITA 7 972 48 029 56 586 36 341 26 205<br />
in % of net sales 3.4 % 13.4 % 15.3 % 11.6 % 10.7 %<br />
EBIT 3 102 43 371 45 154 30 581 23 373<br />
in % of net sales 1.3 % 12.1 % 12.2 % 9.8 % 9.5 %<br />
Result 5 716 33 833 31 912 20 221 16 925<br />
in % of net sales 2.4 % 9.5 % 8.6 % 6.5 % 6.9 %<br />
Operating cash flow 20 388 41 878 68 522 39 795 30 360<br />
in % of net sales 8.7 % 11.7 % 18.5 % 12.8 % 12.4 %<br />
Free cash flow – 6 011 18 601 42 726 – 10 376 23 802<br />
in % of net sales – 2.6 % 5.2 % 11.5 % – 3.3 % 9.7 %<br />
Total assets 215 693 236 763 255 124 224 464 160 321<br />
Equity 133 024 130 731 124 901 114 583 99 022<br />
in % of assets (equity ratio) 61.7 % 55.2 % 49.0 % 51.0 % 61.8 %<br />
Return on equity 4.3 % 26.5 % 26.7 % 18.9 % 18.8 %<br />
Earnings per average share outstanding (CHF 1) 7.41 44.38 40.88 25.31 20.89<br />
Cash flow per average share outstanding (CHF 1) 26.43 54.93 87.77 49.80 37.48<br />
Equity per share outstanding (CHF 1) 172.36 170.01 163.89 143.82 121.38<br />
Goodwill in % of equity 8.3 % 7.9 % 9.2 % 12.3 % 5.6 %<br />
Net financial assets (debts) – 4 175 4 369 – 6 140 – 19 862 8 821<br />
Gearing (net debts/equity) 0.03 – 0.05 0.17 –<br />
Indebtedness factor (net debts/cash flow) 0.20 – 0.09 0.50 –<br />
RONA (Return on net assets) 1.6 % 22.3 % 22.6 % 18.4 % 17.6 %<br />
Average number of employees 1 206 1 315 1 275 1 166 977<br />
Net sales per employee 194.1 272.3 291.0 267.7 251.2<br />
Added value/total personnel expenses 1.66 2.21 2.14 1.96 2.07<br />
InFormaTIon For InvesTors<br />
The shares of <strong>Interroll</strong> Holding AG have been listed at the Swiss Exchange SIX since June 5 th , 1997 (Investdata: INRN; Reuters;<br />
INRN.S; Security number: 637,289).<br />
364.0 %<br />
264.5 %<br />
165.0 %<br />
65.5 %<br />
– 34.0 %<br />
© Swissquote<br />
2005<br />
2006 2007 2008 <strong>2009</strong><br />
<strong>2009</strong> 2008 2007 2006 2005<br />
Number of registered shares 854 000 854 000 854 000 854 000 854 000<br />
par value as per year end 15.00 20.00 30.50 37.50 43.50<br />
Number of average outstanding shares 771 475 762 323 780 715 799 084 810 100<br />
Number of outstanding shares per (31.12.) 771 775 768 958 762 112 796 692 815 804<br />
Market price: highest CHF 320 581 632 434 300<br />
Market price: lowest CHF 173 215 420 300 148<br />
Market price: per year end CHF 307 256 581 434 296<br />
Market capitalization per 31.12. Mio. CHF 236.55 196.85 442.79 345.76 241.48<br />
Reduction of par value* CHF 5.00 5.00 10.50 7.00 6.00<br />
Result per share CHF 7.41 44.00 44.17 25.38 20.75<br />
P/E Ratio Ratio 41.38 5.82 13.15 17.10 14.27<br />
significant shareholders (participation in %)<br />
D. Specht and family % 12.72 12.72 12.46 12.46 13.68<br />
B. Ghisalberti/E. Moreschi and family % 13.18 13.17 13.13 13.13 11.21<br />
N. Axmann and family % 4.57 4.32 5.03 5.17 9.69<br />
Sarasin Investmentfonds AG % 9.69 9.42 8.79 8.28 –<br />
Vontobel Fonds Service AG % – 3.51 4.26 3.69 –<br />
Chase Nominees Ltd. % 1.18 3.51 2.28 – –<br />
Corisol Holding AG % 4.05 – – – –<br />
Public (incl. own shares) % 54.61 53.35 54.05 57.27 65.42<br />
Total – 100.00 100.00 100.00 100.00 100.00<br />
* The reduction of par value in the year under review is proposed by the board of directors for the annual general assembly of 7 th May 2010.<br />
<strong>Interroll</strong> share Price January 1, 2005 to December 31, <strong>2009</strong> (black curve: sPI/sXge)<br />
700<br />
550<br />
400<br />
250<br />
100
Contents<br />
Contents<br />
The Highlights <strong>2009</strong> 3<br />
<strong>Report</strong> by the Board of Directors and Group Management 5<br />
Review of the financial year 9<br />
<strong>Interroll</strong> group 9<br />
Performance by segment 13<br />
staff 18<br />
Brand strategy 19<br />
Strategy and aims of the <strong>Interroll</strong> group 20<br />
Corporate governance 22<br />
<strong>Interroll</strong> solutions at a glance 36<br />
Meet <strong>Interroll</strong> solutions all over the world 38<br />
Barenschee uses <strong>Interroll</strong> conveyor technology for printing plates 38<br />
Finnish Post sorts mail with <strong>Interroll</strong> Crossbelt sorters 40<br />
Food discounter relies on dynamic storage technology from <strong>Interroll</strong> 42<br />
Financial report 45<br />
Consolidated financial statements of the <strong>Interroll</strong> group 48<br />
Financial statements of <strong>Interroll</strong> Holding Ltd., Sant’Antonino 99<br />
1
World first for conveyor belts<br />
<strong>Interroll</strong>’s new Synchronous Drum Motors are the most powerful<br />
and energy-efficient drum motor drives for belt conveyors ever developed.<br />
Typical application areas include conveyor systems<br />
for airports (e.g. check-in desks) and the food processing,<br />
packing and automobile industries (see picture above)<br />
as well as other industrial usages.<br />
Patent pending.
Highlights <strong>2009</strong><br />
HIgHlIgHts <strong>2009</strong><br />
January<br />
At an international industry press conference, <strong>Interroll</strong> unveils a new testing centre for dynamic storage solutions<br />
in France and the new eurospin distribution centre in Italy.<br />
February<br />
<strong>Interroll</strong> improves its market position in Asia by expanding sites in India, China and thailand.<br />
March<br />
Record profit: <strong>Interroll</strong> presents highly satisfactory results for financial year 2008, with a profit of CHF 33.8 million<br />
– the highest in the company’s history.<br />
April<br />
In south Africa, <strong>Interroll</strong> secures a major order linked to a distribution centre for a leading south African fashion<br />
company.<br />
May<br />
<strong>Interroll</strong>’s brand strategy is implemented at group level around the world as the branding workshops enter<br />
phase two.<br />
June<br />
In the area of order-picking flow racks, <strong>Interroll</strong> Canada commissions a new production line for Carton Flow<br />
wheel tracks to reinforce its expansion efforts in north America.<br />
July<br />
<strong>Interroll</strong> receives its first order for Crossbelt sorters from a world-leading parcel delivery company in the UsA.<br />
August<br />
Despite the global economic downturn, a financially sound <strong>Interroll</strong> breaks even in the first half of <strong>2009</strong>.<br />
September<br />
<strong>Interroll</strong> marks its 50th anniversary by unveiling materials handling innovations to 400 experts attending the<br />
<strong>Interroll</strong> Worldwide symposium in the swiss town of locarno.<br />
October<br />
<strong>Interroll</strong>’s longest Crossbelt sorter so far (with double decks, each measuring 523 metres) goes into operation<br />
at Finnish postal company Itella.<br />
November<br />
At the sPs/IPC/DRIVes trade fair in the german city of nuremberg, <strong>Interroll</strong> introduces the most powerful<br />
drum motor generation yet by launching its world-first synchronous Drum Motor (see left).<br />
December<br />
Ceo Paul Zumbühl issues a message to all employees of the <strong>Interroll</strong> group around the world, thanking them<br />
for their outstanding commitment through an extremely challenging year.<br />
3
New Belt Curve for flight baggage and other unit loads<br />
easy to install in baggage sorting systems and other material flow systems:<br />
with its space-saving dimensions the new Belt Curve from <strong>Interroll</strong> promises<br />
low noise emissions and speedy belt changes (maximum of ten minutes).<br />
Patent pending.
Kurt Rudolf<br />
Chairman of the Board of Directors<br />
Paul Zumbühl<br />
Chief executive officer<br />
RePoRt By tHe BoARD oF DIReCtoRs<br />
AnD gRoUP MAnAgeMent<br />
<strong>Report</strong> by the Board of Directors<br />
and Group Management<br />
Dear shareholders and Business Associates,<br />
During financial year <strong>2009</strong>, even a global player like the <strong>Interroll</strong> group felt the impact of the world-wide reces-<br />
sion and plummeting levels of demand across various target markets. As orders declined at a surprisingly<br />
rapid rate, numerous material flow projects had to be postponed or abandoned altogether. In many cases, the<br />
necessary loan financing failed to materialise on the part of our customers, particularly with regard to largescale<br />
projects.<br />
net sales declined by 34.6 % in terms of group currency, falling from CHF 357.9 million in the highly success-<br />
ful 2008 financial year to CHF 234.0 million in <strong>2009</strong>; in local currency, net sales contracted by 31.4 % in<br />
year-on-year comparison. sales contained foreign currency losses of 3.2 %, with a further 5 % fall linked to the<br />
collapse in the price of commodities such as steel and plastics. In spite of the extremely tough market environment,<br />
our gross margin (sales revenue less cost of materials, expressed as a percentage of sales) virtually<br />
matched the level of the previous year (57.8 % compared to 58.8 % in 2008).<br />
During the final quarter of 2008, with an economic downturn looming, <strong>Interroll</strong> began adjusting its operating<br />
costs in preparation for recession. this represented the continuation of what had already been a stringent cost<br />
management policy. In combination with our clear market positioning and strategy of recent years, this<br />
approach has enabled <strong>Interroll</strong> to establish an extremely sound financial foundation. on that basis, <strong>Interroll</strong> was<br />
able to maintain liquidity and pursue key strategic objectives in the period under review, despite the recession.<br />
goals included the expansion of a global network, research and development with a view to launching innovative<br />
new products and the introduction of a new eRP system across the group. Having made this investment,<br />
<strong>Interroll</strong> will be in a position to increase its margins, market share and profitability faster than would otherwise<br />
be possible when the economic upturn arrives.<br />
The global network grows<br />
During the reporting year, <strong>Interroll</strong> simultaneously fortified its network at three sites in Asia and south America.<br />
In China, meanwhile, <strong>Interroll</strong> transferred production of Belt Curves and Conveyor Modules to a new building<br />
within the same industrial estate. In Bangalore in southern India, <strong>Interroll</strong> opened a manufacturing site to supply<br />
the Indian market with drive/conveying solutions for material flow systems; promising projects were initiated<br />
within its first year of operation. In Brazil, good progress was made in the food processing area through a<br />
subsidiary established in the previous year.<br />
In brief<br />
Despite the tough market environment in <strong>2009</strong>, <strong>Interroll</strong> maintained its<br />
sound financial foundation and continues to implement strategic projects<br />
as planned.<br />
5
6<br />
RePoRt By tHe BoARD oF DIReCtoRs<br />
AnD gRoUP MAnAgeMent<br />
During the reporting year, the company strengthened its market position in the UsA as a supplier of dynamic<br />
storage solutions by acquiring a plant in Atlanta, georgia. By boosting its manufacturing capacity and expanding<br />
its range of services, <strong>Interroll</strong> can attend to the needs of new and established clients, including logistical<br />
service providers and distribution centres in north and Central America. the new production site in Atlanta<br />
complements the company’s facility for dynamic storage modules in toronto, which has been operating since<br />
2002.<br />
New products mark 50 th anniversary<br />
In spite of the strong economic headwind, <strong>Interroll</strong> remains a financially viable organisation. In the year under<br />
review the company invested substantially in the future, inviting its clients to a global <strong>Interroll</strong> symposium in<br />
september <strong>2009</strong>. the aim of the event was to reinforce the basis of trust underpinning the relationship between<br />
<strong>Interroll</strong> and its customers whilst conveying a long-term vision of security that looks beyond the present<br />
economic insecurities. <strong>Interroll</strong> also used the trade symposium in the swiss town of locarno (which marked<br />
the company’s 50 th anniversary and was attended by 400 customers and partners from every continent) to<br />
unveil major new products in all business divisions along with ground-breaking concepts for the material flow<br />
industry. the event was a resounding success.<br />
<strong>Interroll</strong> was founded by Dieter specht and Hans vom stein in 1959. Fifty years on, the pioneering company<br />
has evolved from a garage operation in Wermelskirchen (near the german city of Cologne) into a globally<br />
structured, exchange-listed corporate group comprising 28 firms and some 1,200 staff members. <strong>Interroll</strong> has<br />
the highest international profile of any supplier of key products for materials handling, logistics and automation<br />
(see page 16, ff).<br />
Innovations presented at the symposium included the synchronous Drum Motor, billed as a world first. the<br />
most powerful and energy-efficient drum motors ever produced lend themselves cost-effectively to a wide<br />
range of applications. We also showcased other new products guaranteeing enhanced customer value and<br />
quick returns on investment.<br />
<strong>Interroll</strong> underlined its commitment to the future by continuing to offer advanced workshops on the <strong>Interroll</strong><br />
brand for all staff in the reporting year. the aim of the branding workshops is to entrench brand values across<br />
the global group structure. <strong>Interroll</strong> has defined increasing brand appeal as a key strategic priority in terms of<br />
improving the company’s position exponentially over the long term. the aim is to establish <strong>Interroll</strong> around the<br />
world as the preferred brand for key products in material flow systems – products that consistently offer superior<br />
customer value.<br />
The business units<br />
In financial year <strong>2009</strong>, <strong>Interroll</strong> Drives & Rollers reported rapid progress on renovation and expansion work on<br />
the Centre of excellence for Roller Conveyors and RollerDrives at the company’s original site in Wermelskirchen<br />
(germany). the centre will be more productive when the modification work is complete, with production<br />
methods enhanced in line with the kaizen strategy of continual improvement. opening is scheduled for the<br />
coming year.
RePoRt By tHe BoARD oF DIReCtoRs<br />
AnD gRoUP MAnAgeMent<br />
During the year under review, <strong>Interroll</strong> officially inaugurated its significantly expanded new testing centre on the<br />
site of its Centre of excellence for Dynamic storage solutions in the French town of la Roche sur yon. At the<br />
trade press conference, the company also presented new solutions for Pallet Flow storage and Carton Flow<br />
storage.<br />
In october <strong>2009</strong>, <strong>Interroll</strong> Automation began the reconstruction of its Centre of excellence for Conveyor<br />
Modules and subsystems in sinsheim, near Heidelberg (germany). As in Wermelskirchen and la Roche sur<br />
yon, the main aim of the project is to bring about major productivity gains across the manufacturing chain.<br />
Various operating units which have been accommodated in four separate buildings thus far will be brought<br />
under one roof at the new site. the opening is scheduled for 2010.<br />
Par value reimbursement<br />
In view of the financial stability of the company and encouraging prospects for the future, the Board of Directors<br />
will propose a par value reduction from CHF 15.00 to CHF 10.00 per <strong>Interroll</strong> registered share to the <strong>Annual</strong><br />
general Meeting to be held on 7th May 2010. the reduction, offered in place of a dividend, will match the previous<br />
year’s amount of CHF 5.00 per registered share and will be tax-exempt for shareholders in most cases.<br />
Thanks to our employees around the world<br />
We would like to take this opportunity to extend our sincere thanks for the tireless support of our staff at all<br />
levels and in all divisions around the world. In an extremely tough economic environment, their sheer dedica tion<br />
has been the driving factor behind our success. last year, alongside their usual duties, our employees were<br />
tasked with implementing major additional projects on schedule, including the introduction of sAP and the<br />
expansion and renovation of plant facilities. their invaluable contributions are enabling the <strong>Interroll</strong> group to<br />
maintain a far-sighted approach and thereby realise its strategic and branding policies.<br />
7
8<br />
RePoRt By tHe BoARD oF DIReCtoRs<br />
AnD gRoUP MAnAgeMent<br />
Outlook<br />
<strong>Interroll</strong> expects the economic climate to remain highly challenging throughout the current financial year, with<br />
a slight upturn possibly asserting itself in the second half of 2010 at the earliest. However, thanks to the company’s<br />
stable financial foundation, we are confident that we will be able to remain on course as we pursue and<br />
conclude strategic projects linked to innovation, reinforcing the global network and implementing the new eRP<br />
system. In this way, <strong>Interroll</strong> will adhere to its long-term growth strategy, putting in place the preconditions that<br />
will enable the company quickly to gain full advantage of fresh opportunities that arise as the economic situation<br />
returns to normal and ultimately increasing its lead over the competition. <strong>Interroll</strong> will also sustain the<br />
discipline of recent years as regards costs and seek out new possibilities for raising productivity in all fields<br />
of activity.<br />
Kurt Rudolf Paul Zumbühl<br />
Chairman of Board of Directors Chief executive officer
Review of the Financial Year<br />
ReVIeW oF tHe FInAnCIAl yeAR<br />
Sales<br />
In <strong>2009</strong>, the global recession had a major impact on the <strong>Interroll</strong> group. As demand declined and projects were<br />
postponed or cancelled altogether, consolidated sales fell to CHF 234.0 million, a drop of 34.6 % on the previous,<br />
highly successful year; in local currency, revenue declined by 31.4 %. In terms of reporting currency, the<br />
consolidated group turnover contained foreign currency losses of 3.2 %, with a further 5 % fall linked to the<br />
collapse in the price of raw materials such as steel and plastics. However, despite the extremely tough market<br />
environment and rising pressure on prices, the gross margin (sales revenue less cost of materials, expressed<br />
as a percentage of sales) virtually matched the level of the previous year (57.8 % compared to 58.8 % in 2008).<br />
on the procurement side, <strong>Interroll</strong> succeeded in renegotiating conditions with its most important regular suppliers<br />
with a view to alleviating the cost situation.<br />
We captured market share and new clients in most markets. In the UsA, for example, margins developed very<br />
positively, with business in check-out counter motors reported to be highly satisfactory. Additional trade was<br />
generated with a number of existing clients thanks to new products – a fact that demonstrates growing trust<br />
in <strong>Interroll</strong>’s ability to deliver a range of product solutions. A world leading parcel delivery company in the UsA<br />
specified <strong>Interroll</strong> products for its projects and placed a first order for crossbelt sorters and conveyor modules.<br />
EBITDA and EBIT<br />
<strong>Interroll</strong>’s flexible and streamlined cost structure, together with constant monitoring of costs, enabled the<br />
company to stabilise its eBItDA margin at 8.0 % in the year under review, despite the sharp fall in sales. earnings<br />
before interest, taxes, depreciation and amortisation (eBItDA) stood at CHF 18.8 million, compared to<br />
CHF 58.2 million in the very satisfactory previous year. earnings before interest and taxes (eBIt) amounted to<br />
CHF 3.1 million (1.3 %), compared to CHF 43.4 million (12.1 %) in the previous year.<br />
Net profit and cash flow<br />
At the end of <strong>2009</strong>, net profit stood at CHF 5.7 million, compared to CHF 33.8 million for 2008; operating cash<br />
flow was CHF 20.4 million (CHF 41.9 million in 2008).<br />
In brief<br />
During reporting year <strong>2009</strong>, <strong>Interroll</strong> responded to the recessionary climate by<br />
maintaining a streamlined cost structure and pursuing the implementation<br />
of strategic projects according to schedule. the company has a sound financial<br />
foundation, a strategy of long-term growth and innovative potential that is<br />
utilised on a global scale.<br />
9
10<br />
ReVIeW oF tHe FInAnCIAl yeAR<br />
Net sales <strong>Interroll</strong> Group in CHF millions<br />
0 100 200 300 400<br />
2006 312.0<br />
2007 370.9<br />
2008 357.9<br />
<strong>2009</strong> 234.0<br />
EBITDA in CHF millions<br />
0 20 40 60 80<br />
2006 44.4<br />
2007 67.5<br />
2008 58.2<br />
<strong>2009</strong> 18.8<br />
EBITDA in % of net sales<br />
0 5 10 15 20<br />
2006 14.2<br />
2007 18.2<br />
2008 16.3<br />
<strong>2009</strong> 8.0<br />
EBIT in CHF millions<br />
0 12 24 36 48<br />
2006 30.6<br />
2007 45.2<br />
2008 43.4<br />
<strong>2009</strong> 3.1<br />
EBIT in % of net sales<br />
0 5 10 15 20<br />
2006 9.8<br />
2007 12.2<br />
2008 12.1<br />
<strong>2009</strong> 1.3
Result in CHF millions<br />
Ordinary capital expenditure in CHF millions<br />
ReVIeW oF tHe FInAnCIAl yeAR<br />
0 10 20 30 40<br />
2006 20.2<br />
2007 31.9<br />
2008 33.8<br />
<strong>2009</strong> 5.7<br />
Operating cash flow in CHF millions<br />
0 20 40 60 80<br />
2006 39.8<br />
2007 68.5<br />
2008 41.9<br />
<strong>2009</strong> 20.4<br />
Return on equity in %<br />
0 10 20 30 40<br />
2006 18.9<br />
2007 26.7<br />
2008 26.5<br />
<strong>2009</strong> 4.3<br />
0 10 20 30 40<br />
2006 10.7<br />
2007 24.0<br />
2008 22.4<br />
<strong>2009</strong> 22.9<br />
Indebtedness factor (net debts/operating cash flow)<br />
– 1 0 1 2 3<br />
2006 0.50<br />
2007 0.09<br />
2008 –<br />
<strong>2009</strong> 0.20<br />
11
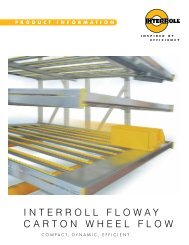
“Please send us …”<br />
<strong>Interroll</strong>’s new Carton Flow wheel tracks help ensure we all receive our<br />
goods by mail order on time and in mint condition. With high stability,<br />
optimised flow performance and the capacity for installation in a very wide<br />
range of shelving systems, <strong>Interroll</strong> Carton Flow makes mail-order<br />
picking operations (see picture above) even more productive,<br />
improving picking performance by up to 65 %.<br />
Patent pending.
ReVIeW oF tHe FInAnCIAl yeAR<br />
Financial position and capital expenditure<br />
<strong>Interroll</strong> has a sound financial foundation. At the end of the reporting year, the balance sheet total stood at CHF<br />
215.7 million, compared to CHF 236.8 million in 2008. shareholders’ equity was CHF 133.0 million at the end<br />
of <strong>2009</strong> (against CHF 130.7 million at the end of 2008). In yearly comparison, the equity ratio rose from 55.2 %<br />
to 61.7 %. Investment for the future amounted to CHF 22.9 million in the year under review (CHF 22.4 million<br />
in 2008).<br />
Most investment was channelled into the scheduled realisation of strategic projects and areas such as the<br />
geographic expansion of the <strong>Interroll</strong> network, product innovation and introduction of the new eRP system.<br />
In this way, <strong>Interroll</strong> reaffirmed its commitment to a strategy of long-term growth. By the end of <strong>2009</strong>, net debt<br />
stood at CHF 4.2 million.<br />
Business segments: Components and subsystems<br />
the “Components” segment represents the <strong>Interroll</strong> Drives & Rollers business unit; the “subsystems” segment<br />
comprises the <strong>Interroll</strong> Dynamic storage and <strong>Interroll</strong> Automation business units.<br />
The Components segment<br />
In terms of local currency, sales for the Components segment fell by 25.6 % during financial year <strong>2009</strong>. In<br />
group currency, sales amounted to CHF 157.9 million, compared to CHF 223.7 million in 2008. the decline<br />
in sales for the segment – a consequence of the global economic crisis – was shared more or less equally by<br />
established markets in the main. By contrast, sales were up in new markets such as India, Japan and Brazil.<br />
Key figures for the Components segment, in millions CHF <strong>2009</strong> 2008<br />
order intake 158.4 220.3<br />
net sales to third parties 157.9 223.7<br />
CHAnge In % to tHe PReVIoUs yeAR – 29.4 – 4.4<br />
eBItDA 19.6 40.5<br />
CHAnge In % to tHe PReVIoUs yeAR – 51.6 – 15.4<br />
In % oF net sAles 12.3 18.1<br />
eBIt 7.4 28.8<br />
In % oF net sAles 4.6 12.8<br />
Capital expenditure 13.2 16.9<br />
Average number of employees 770.0 814.0<br />
Despite the recessionary climate, the segment achieved satisfactory operating eBItDA of CHF 19.6 million, with<br />
a margin of 12.3 %. overheads were reined back at an early stage within the Components segment, with the<br />
express purpose of relieving pressure on eBItDA. this did not affect investment in strategic projects aimed at<br />
long-term growth, such as the expansion of the Centre of excellence for Conveyor Rollers and RollerDrives at<br />
Wermelskirchen and the development of innovative products. At the end of <strong>2009</strong>, earnings before interest and<br />
taxes (eBIt) stood at CHF 7.4 million (4.6 %), compared to CHF 28.8 million (12.8 %) in the previous year.<br />
13
14<br />
ReVIeW oF tHe FInAnCIAl yeAR<br />
Although sales fell unusually steeply in scandinavia and spain during the first half of <strong>2009</strong>, the figures recovered<br />
as the year progressed. sales in central europe and France held up particularly well despite the crisis. In the<br />
UsA, where <strong>Interroll</strong> is aiming to increase market share and boost its market position, trade in check-out<br />
counter motors continued to develop encouragingly in <strong>2009</strong>. the new “cassette” drive solution, which is easy<br />
to install in check-out counters, was instrumental in raising sales revenue in this area into double-digit figures.<br />
In south America, <strong>Interroll</strong> Brazil made positive inroads in the area of food processing.<br />
sales in China fell by 37 % following the strong performance of the previous year. scores of planned projects<br />
in airports and other areas were suspended in the year under review. the company’s other Asian hubs per-<br />
formed in line with forecasts. In Japan last year, <strong>Interroll</strong> launched a promising pilot project aimed at enhancing<br />
the marketing of Conveyor Rollers and RollerDrives; the Japanese market is one with high potential for roller<br />
conveyor-based materials handling.<br />
In February <strong>2009</strong>, <strong>Interroll</strong>, in collaboration with a licensing partner, opened a manufacturing site in Bangalore<br />
to supply the Indian market with drive/conveying solutions for material flow systems. the new <strong>Interroll</strong> facility<br />
in India’s fifth largest city will focus on producing innovative solutions involving Drum Motors, 24 VDC Roller-<br />
Drives and Conveyor Rollers. Areas of application for these products include conveyor systems for food<br />
processing, airport baggage handling and production logistics.<br />
During the reporting year, <strong>Interroll</strong> Drives & Rollers concentrated heavily on the development of new materials<br />
handling drive concepts. these included the <strong>Interroll</strong> PolyVee drive solution with RollerDrives and Conveyor<br />
Rollers, which were redesigned and enhanced to comply with higher technical requirements. In september<br />
<strong>2009</strong>, the synchronous Drum Motor – a world first – was presented at the global <strong>Interroll</strong> symposium in<br />
locarno, an event organised to mark the company’s 50th anniversary. these highly powerful and cost-effective<br />
drum motors, which lend themselves to a wide range of applications, have the potential to open up market<br />
segments previously accessible only to other drive solutions. the synchronous Drum Motors were also successfully<br />
introduced into the german market after being unveiled at the sPs/IPC/DRIVes trade fair for electric<br />
automation technology in nuremberg in november.<br />
Also in germany, expansion and modification of the Centre of excellence for Conveyor Rollers and RollerDrives<br />
progressed according to schedule during <strong>2009</strong> in Wermelskirchen. this project is aiming to bring about further<br />
large-scale productivity gains; the new facility is set to open in the spring of 2011.<br />
In the year under review, industrial Drum Motors with smaller diameters were relocated from Denmark to the<br />
Centre of excellence for Drum Motors opened in the first half of 2008 in the german town of Baal. Meanwhile,<br />
a rubber lagging centre for Drum Motors was established in Wassenberg. <strong>Interroll</strong> has thereby improved customer<br />
benefit and flexibility significantly whilst reducing delivery times for the food processing industry. <strong>Interroll</strong><br />
Drives & Rollers has also strengthened its engineering & Research Centre for materials handling solutions at<br />
the Wassenberg site.
ReVIeW oF tHe FInAnCIAl yeAR<br />
The Subsystems segment<br />
In <strong>2009</strong>, sales for the largely project-dependent subsystems division fell by 40.3 % in local currency compared<br />
to the prior year. In terms of reporting currency, turnover stood at CHF 76.1 million (against CHF 134.2 million<br />
in 2008). the figures reflect the unexpectedly high number of projects shelved until further notice or abandoned<br />
owing to lack of secured financing. there were no earnings before interest, taxes, depreciation and<br />
amortisation (eBItDA), following on from earnings of CHF 17.7 million in 2008; the loss in terms of eBIt<br />
amounted to CHF 4.3 million; in 2008, a positive eBIt of CHF 14.6 million was achieved. thanks to its stable<br />
financial basis, however, <strong>Interroll</strong> was able to pursue strategic projects in this area (such as investing in product<br />
innovation).<br />
Key figures for the subsystems segment, in millions CHF <strong>2009</strong> 2008<br />
order intake 80.5 127.6<br />
net sales to third parties 76.1 134.2<br />
CHAnge In % to tHe PReVIoUs yeAR – 43.3 – 0.8<br />
eBItDA – 0.8 17.7<br />
CHAnge In % to tHe PReVIoUs yeAR – 104.5 – 10.2<br />
In % oF net sAles – 1.0 12.8<br />
eBIt – 4.3 14.6<br />
In % oF net sAles – 5.5 10.6<br />
Capital expenditure 9.7 5.5<br />
Average number of employees 436.0 501.0<br />
In the dynamic storage area, the economic crisis placed considerable strain on the european region during the<br />
year under review; dynamic storage business came to a complete standstill in eastern europe owing to the<br />
added pressure of a negative currency trend.<br />
In north America, the impact of the downturn was cushioned by means of local Carton Flow production. <strong>Interroll</strong><br />
also equipped its site in Canada with a machine for the production of Carton Flow roller tracks with a view to<br />
improving production capacity and supply readiness for Carton Flow products in north America. through the<br />
acquisition of BMW Metal Fabrication Inc. in Atlanta (georgia) in February <strong>2009</strong>, <strong>Interroll</strong> strategically expanded<br />
its dynamic storage solutions business in the UsA. the new <strong>Interroll</strong> production facility in Atlanta complements<br />
the company’s facility for dynamic storage modules in toronto, which has been operating since 2002.<br />
A lucrative project was secured in Asia, involving Pallet Flow storage technology for a new distribution centre<br />
belonging to a soft drinks producer in thailand. Market share has been gained thanks to an expanded product<br />
range and intensive marketing within the drinks industry.<br />
In January <strong>2009</strong>, <strong>Interroll</strong> Dynamic storage held a trade press conference to unveil patented new solutions<br />
for order-picking flow racks (Carton Flow) offering significantly higher customer benefit; the company also<br />
opened a new testing centre for dynamic storage solutions at its Centre of excellence in the French town of<br />
15
16<br />
ReVIeW oF tHe FInAnCIAl yeAR<br />
la Roche sur yon. <strong>Interroll</strong> Dynamic storage also presented the latest dynamic storage solutions to a trade<br />
audience from around the world at the global <strong>Interroll</strong> symposium held in the swiss town of locarno in sep-<br />
tember <strong>2009</strong>.<br />
the underlying theme of the symposium – demonstrating the specific benefits of <strong>Interroll</strong> solutions – was consistent<br />
with the company’s broader efforts to attract new clients and users.<br />
With a fast return on investment becoming ever more important as competition intensifies, the market share of<br />
dynamic storage systems for fast-selling goods is poised to increase. this is particularly true in a difficult economic<br />
climate.<br />
the aforementioned new Carton Flow solution – based on a completely new type of wheel track – has already<br />
gained a strong foothold in the market. With its promise of energy efficiency and flexible space-saving properties,<br />
<strong>Interroll</strong> has created a market-leading product set to harness huge potential when the economic picture<br />
brightens.<br />
Despite the fact that <strong>Interroll</strong> Automation was forced to postpone or cancel a series of projects in europe and<br />
the UsA in <strong>2009</strong>, this business area performed well given the current economic slump. several lucrative<br />
projects linked to postal services and other fields were secured in China and singapore. In February, <strong>Interroll</strong><br />
transferred the manufacturing of Belt Curves and Conveyor Modules to a new office/production building in the<br />
modern industrial estate of suzhou, west of shanghai. Intensified marketing activities in Asia over the past<br />
two years have enabled <strong>Interroll</strong> Automation to more than double its order receipts in China in year-on-year<br />
comparison.<br />
In addition, <strong>Interroll</strong> attracted a number of promising projects linked to airports, postal services and distribution<br />
centres in the UsA, germany and south Africa. In the UsA, the company secured a large-scale sorter project<br />
for the world’s largest parcel delivery company. Crossbelt sorters were also commissioned for leading postal<br />
organisations in the United Kingdom. In <strong>2009</strong>, a major courier firm initiated the construction of a sorter system<br />
at Cologne Bonn Airport. the Finnish postal service commissioned Crossbelt sorters combined with <strong>Interroll</strong><br />
Conveyor Modules for feeding and exit lines at a number of sites. <strong>Interroll</strong> Automation has thus gained market<br />
Above<br />
the global <strong>Interroll</strong> symposium<br />
in locarno, switzerland, was<br />
attended by 400 experts in september<br />
<strong>2009</strong>.
Left<br />
Customer benefits, innovation,<br />
the latest trends in the material<br />
handling industry …<br />
Middle<br />
… were among the key topics<br />
presented by <strong>Interroll</strong> Ceo Paul<br />
Zumbühl ...<br />
Right<br />
… and exemplified by the newly<br />
designed conveyor rollers<br />
officially launched by Dietmar<br />
Hager and Dr. Ralf garlichs.<br />
ReVIeW oF tHe FInAnCIAl yeAR<br />
share with sorter technology that guarantees users tangible advantages: cost-effective operation from as little<br />
as 2,000 items per hour, maximum availability thanks to best-in-class engineering, a return on investment in<br />
around two years, space-saving design and the reliable handling of a wide variety of goods.<br />
the company’s patented new belt curve was unveiled at the global <strong>Interroll</strong> symposium held in september<br />
<strong>2009</strong> in the swiss town of locarno. Its innovative technology enables belt changes to be completed in just<br />
10 minutes – one third the time needed by similar belt curves. the product met with an encouraging response<br />
as it was progressively introduced to key client firms over the year under review. Alongside distribution centres,<br />
the space-saving belt curve is mainly suitable for applications connected with airport logistics, an area in which<br />
<strong>Interroll</strong> anticipates a good deal of new business in the second six months of this year.<br />
Construction of <strong>Interroll</strong> Automation’s new global Centre of excellence for Conveyor Modules and subsystems<br />
got under way in october <strong>2009</strong>. When complete, the centre, located in a new industrial area of sinsheim in<br />
germany, will amalgamate operations that until now have been accommodated in four separate buildings. the<br />
opening is scheduled for this year.<br />
17
18<br />
Review of the financial yeaR<br />
Staff<br />
Average number of employees by region <strong>2009</strong><br />
0 500 1000 1500<br />
europe 807<br />
USa 239<br />
asia 160<br />
Average number of employees by years<br />
0 500 1000 1500<br />
2006 1165<br />
2007 1275<br />
2008 1315<br />
<strong>2009</strong> 1206<br />
worldwide, the interroll Group employed 1,206 people on average in financial year <strong>2009</strong>, a fall of 8 % on the<br />
figure for 2008.<br />
interroll’s training centre, opened towards the end of 2008 in the German town of Baal, became a firm asset<br />
of the company during the reporting year. in <strong>2009</strong>, some 80 people attended courses on various product<br />
areas – from RollerDrives and Drum Motors to frequency converters – at the “interroll academy”. courses are<br />
offered in progressive stages, from introductory sessions for beginners to advanced programmes for experts.<br />
the sales-focused content will play a part in consolidating the global market position of interroll, which is<br />
already well established. in particular, the centre will aim to ensure the company can address even more<br />
effectively the various needs of customer groups in relation to projects, from planning to after-sales service.
Professionally and effectively<br />
managing the <strong>Interroll</strong> brand<br />
is the main subject of the <strong>Interroll</strong><br />
Brand Workshops: colleagues<br />
from the Asian <strong>Interroll</strong> branches<br />
promoted to “Brand Ambassadors”<br />
after passing the exams.<br />
ReVIeW oF tHe FInAnCIAl yeAR<br />
The <strong>Interroll</strong> brand strategy<br />
In financial year <strong>2009</strong>, <strong>Interroll</strong> continued to offer branding workshops to representatives of all <strong>Interroll</strong> markets<br />
with a view to rolling out brand management and brand policy across the group’s global locations. the implementation<br />
strategy relies on ‘Brand Ambassadors’ (who will convey the brand strategy to various target groups<br />
within the worldwide <strong>Interroll</strong> group) as well as special brand-specific projects.<br />
the <strong>Interroll</strong> brand strategy provides the basis for our day-to-day activities: it is the foundation of our long-term<br />
success as a company. one cornerstone of the strategy is the positioning of <strong>Interroll</strong> as the world’s leading<br />
supplier of key products for material flow solutions. In other words, <strong>Interroll</strong> will be synonymous with “proven”<br />
products and services.<br />
19
20<br />
Strategy and aimS of the<br />
interroll worldwide group<br />
Strategy and aims of the<br />
<strong>Interroll</strong> worldwide group<br />
Aims<br />
interroll aims to achieve sustained, above-average growth in sales and profits over the long term and to establish<br />
itself as the market leader in its specific target markets and product groups. these strategic targets are to<br />
be achieved through unique market positioning, leadership in the field of innovation, our own global sales<br />
network, high productivity and an investment policy that is geared to the long term. it is vital that we are seen<br />
as an attractive partner by our customers across all continents and as a good employer capable of attracting<br />
a highly motivated, performance-oriented workforce.<br />
Strategy<br />
we focus on key products for material handling solutions in market segments such as food processing and<br />
distribution, airports, mail-sorting offices, mail-order companies and logistics centres. our own global sales<br />
network is firmly anchored at local level and maintains close contact with original equipment manufacturers,<br />
system integrators/general contractors and end users in order to analyse the precise needs of all customer<br />
groups. Building on this, interroll develops key products that are based on a worldwide platform and offer<br />
customers solutions to their everyday logistical challenges. one of the key elements of our strategy is to<br />
enhance our existing products and develop next-generation solutions tailored to market requirements and<br />
providing a fast return on investment.<br />
throughout the world, interroll Centres of excellence concentrate on developing new products for existing and<br />
new applications. further responsibilities include highly productive manufacturing of clearly defined product<br />
groups. local production and service centres, managed by the Centres of excellence, have been set up in<br />
every corner of the world so that we can respond quickly to customer needs.<br />
in terms of branding, our aim is for interroll to increasingly profile itself by reference to its expertise as a pro-<br />
vider of innovative, economical solutions for intralogistics.<br />
Success factors<br />
interroll’s success, both in the past and the future, depends on these factors:<br />
• Concentrating our resources on key products with which we aim for worldwide market leadership<br />
• Developing application-oriented product platforms on a modular basis, thus allowing us to achieve substantial<br />
economies of scale<br />
• Maintaining a global sales presence supported by local sales companies allowing us to identify and respond<br />
quickly to customer needs and market trends and exploit market potential throughout the world, supported<br />
by a global production network<br />
• Operating with uniform group-wide manufacturing technology at all our production centres worldwide<br />
In brief<br />
interroll aims at achieving sustained above-average growth in revenue and<br />
profit and seeks to establish itself as the leading provider of key products for<br />
material handling solutions in specific target markets. the company’s prod-<br />
ucts deliver above-average benefit to customers worldwide in the areas of conveyor<br />
technology, logistics and automation.
• Worldwide identical quality standard of products<br />
Strategy and aimS of the<br />
interroll worldwide group<br />
• Focusing on continuous development of new products and their rapid introduction to the market<br />
• Providing professional support, training and development for all our workforce<br />
Growth drivers<br />
our future growth strategy is geared towards meeting clearly identified market trends that offer potentially<br />
attractive sales opportunities. these include:<br />
• Continued growth in passenger numbers in international air travel, requiring expansion in airport handling<br />
capacity (baggage conveying systems) and security technology (in-line screening)<br />
• Strict hygiene regulations in the food processing industry, which are being adopted by an increasing number<br />
of countries and call for premium quality conveyor drives such as interroll drum motors<br />
• increasing liberalisation of postal markets and the regionalisation of courier/express/parcel service operators,<br />
who are investing in distribution and new sites in order to establish a local presence near their customers<br />
• Further decentralisation of distribution centres for a wide range of goods in order to speed up delivery<br />
times<br />
• Increasing product variety and shorter product life cycles demand greater flexibility and customisation in the<br />
order-picking of goods<br />
• Increased productivity levels in the industry and related efficiency gains in warehousing and distribution processes<br />
• Demand for logistics equipment offering economical operation and a short return on investment<br />
Management structure of the <strong>Interroll</strong> Group<br />
led by our strategic holding company based in Sant’antonino/Switzerland, interroll devised a new corporate<br />
strategy introduced eight years ago. this strategy is implemented through three global business units. the<br />
interroll drives & rollers unit concentrates on conveyor components such as rollers and intelligent drives for<br />
belt and roller conveyors. it is dedicated to producing intelligent solutions for conveyor system manufacturers<br />
and oems. the interroll dynamic Storage unit equips distribution centres with innovative dynamic storage<br />
modules for high-throughput goods. its main target markets are industrial designers, rack manufacturers and<br />
system integrators. the interroll automation unit produces conveyor modules and sub-systems especially for<br />
mail-sorting offices, mail-order companies and distribution centres. dynamic Storage and automation are<br />
classed together under “Subsystems”. all our business units market themselves under the interroll name –<br />
which stands for expertise, quality and innovation.<br />
What is it that makes <strong>Interroll</strong> unique?<br />
whether global or local, big or small, all our customers benefit from the combined know-how and applications<br />
experience built up by the global interroll group over a large number of reference projects. our development<br />
and production centres transform this critical knowledge into innovative, market-leading solutions for over<br />
23,000 customers around the world who can be assured at all times of gaining above average benefit from<br />
those solutions.<br />
21
22<br />
Corporate governanCe<br />
organiSation<br />
Corporate governance<br />
1 Organisation<br />
BOArd Of dIreCtOrS<br />
StrAteGIC HOldInG<br />
InterrOll HOldInG ltd. (headquarters: S. antonino, Ch)<br />
Corporate Strategy Corporate it Corporate technology<br />
Corporate finance Corporate Communications<br />
BuSIneSS unItS<br />
ComponentS Segment<br />
interroll drives & rollers<br />
unit handling<br />
headquarters: wermelskirchen, d<br />
SAleS And PrOduCtIOn COMPAnIeS<br />
interroll CZ, s.r.o., Breclav, CZ<br />
interroll fördertechnik gmbh, wermelskirchen, d<br />
interroll nordic aS, hvidovre, dK<br />
interroll españa Sa, Barbera del vallés, e<br />
interroll SaS, Saint pol de léon, f<br />
SuBSyStemS Segment<br />
interroll dynamic Storage<br />
warehousing & distribution<br />
headquarters: la roche sur yon, f<br />
interroll automation<br />
automation & Conveyor lines<br />
headquarters: Sinsheim, d<br />
interroll Japan Co. ltd., tokio, Jp interroll Japan Co. ltd., tokio, Jp interroll Japan Co. ltd., tokio, Jp<br />
interroll Korea Corporation, Seoul, Kr interroll Korea Corporation, Seoul, Kr interroll Korea Corporation, Seoul, Kr<br />
interroll polska sp.z.o.o., warschau, pl<br />
interroll (asia) pte. ltd., Singapur, Sgp interroll (asia) pte. ltd., Singapur, Sgp interroll (asia) pte. ltd., Singapur, Sgp<br />
interroll ltd., Corby, uK<br />
interroll JoKi a/S, hvidovre, dK<br />
interroll fördertechnik gmbh, wermelskirchen, d<br />
interroll trommelmotoren gmbh, Baal, d<br />
interroll australia pty. ltd., melbourne, auS<br />
interroll ag, S. antonino, Ch interroll ag, S. antonino, Ch interroll ag, S. antonino, Ch<br />
transtechnik gmbh, wassenburg, d<br />
interroll Components Canada ltd., Concord, Cnd<br />
interroll SaS, la roche sur yon, f<br />
interroll Canada ltd., newmarket, Cnd interroll Canada ltd., newmarket, Cnd<br />
interroll automation gmbh, Sinsheim, d<br />
interroll (Suzhou) Co. ltd. Suzhou, China interroll (Suzhou) Co. ltd. Suzhou, China interroll (Suzhou) Co. ltd. Suzhou, China<br />
interroll Sa (proprietary) ltd., Johannesburg, Za interroll Sa (proprietary) ltd., Johannesburg, Za interroll Sa (proprietary) ltd., Johannesburg, Za<br />
interroll (thailand) Co. ltd., Samutprakarn, tha interroll asia-pacific Co. ltd., panthong, tha<br />
interroll Corporation, wilmington nC, uSa interroll dynamic Storage inc., hiram ga, uSa interroll automation llC, Jeffersonville, uSa<br />
interroll logistica ltda., S ão paolo, Br interroll logistica ltda., S ão paolo, Br<br />
agents, franchisees agents, franchisees agents, franchisees<br />
Sales companies production companies Sales- and production companies as of 1 st January 2010
2 Group structure and shareholders<br />
Corporate governanCe<br />
group StruCture and ShareholderS<br />
Group structure<br />
the interroll group develops, manufactures and markets components and subsystems for the areas of material<br />
flow and conveyor technology. these activities are performed worldwide. three globally operating business<br />
units are responsible for managing the activities of the group: interroll drives & rollers within the Components<br />
segment, interroll dynamic Storage and interroll automation within the Subsystems segment. Companies<br />
within the interroll group: cf. financial statements of interroll group, 7.4 Scope of consolidation.<br />
the registered shares of interroll holding ltd., headquartered in Sant’ antonino (Switzerland) have been traded<br />
within the main segment of the SiX Swiss exchange since June 5, 1997 (valor 637 289, investdata inrn,<br />
reuters inrnS). market capitalisation, share prices, etc.: information for investors (inside cover).<br />
the governing bodies of interroll holding ltd. are the general meeting of Shareholders (paramount governing<br />
body), the Board of directors and the auditor.<br />
Significant shareholders<br />
details regarding significant share holders: cf. financial statements of interroll holding ltd., 3.7 Shareholder<br />
equity.<br />
Cross-shareholdings<br />
there are no cross-shareholdings.<br />
23
24<br />
Corporate governanCe<br />
Capital StruCture<br />
3 Capital structure<br />
Capital<br />
the share capital of interroll holding ltd. amounts to Chf 12.8 million and is made up of 854 000 fully paid<br />
registered shares with a par value of Chf 15.00 each. Cf. financial statements of interroll group, 5.9 information<br />
on shareholders’ equity.<br />
Authorised and conditional capital<br />
there is no authorised or conditional capital.<br />
Changes in capital<br />
Consolidated Statement of Changes in equity. Cf. financial statements of interroll group, 1.4 Consolidated<br />
statement of changes in equity.<br />
Shares and participation certificates<br />
the share capital of interroll holding ltd. comprises 854 000 fully paid registered shares which are entitled to<br />
dividend payments and are furnished with voting rights. the par value per share is Chf 15.00. voting right:<br />
one vote per share. no participation certificates were issued by the Company.<br />
Profit sharing certificates<br />
no profit sharing certificates were issued by the Company.<br />
limitations on transferability and nominee registrations<br />
Cf. Chapter 7, Shareholders’ participation rights.<br />
Convertible bonds and warrants/options<br />
in 2006 the Board of directors approved a management share option plan. Cf. financial statements of interroll<br />
group, 6.1 personnel expenses.
From left to right<br />
ingo Specht, urs tanner,<br />
Kurt rudolf, philippe dubois,<br />
paolo Bottini, marco ghisalberti<br />
4 Board of directors<br />
Members of the Board of directors<br />
Kurt rudolf b Swiss<br />
born 1942<br />
urs tanner Swiss<br />
born 1951<br />
Paolo Bottini a Swiss<br />
born 1965<br />
Philippe dubois a Swiss<br />
born 1950<br />
Horst Wildemann b german<br />
born 1942<br />
Marco Ghisalberti italian<br />
born 1961<br />
Ingo Specht german<br />
born 1964<br />
a member of the audit Committee<br />
b member of the Compensation Committee<br />
Chairman<br />
initial appointment<br />
term of office until<br />
deputy Chairman<br />
initial appointment<br />
term of office until<br />
member<br />
initial appointment<br />
term of office until<br />
member<br />
initial appointment<br />
term of office until<br />
member<br />
initial appointment<br />
term of office until<br />
member<br />
initial appointment<br />
term of office until<br />
member<br />
initial appointment<br />
term of office until<br />
2006<br />
2001<br />
2010<br />
2008<br />
2011<br />
2003<br />
2012<br />
2003<br />
2012<br />
1999<br />
2011<br />
1997<br />
2012<br />
2006<br />
2012<br />
Corporate governanCe<br />
Board of direCtorS<br />
25
26<br />
Corporate governanCe<br />
Board of direCtorS<br />
Professional background, other activities and vested interests of the Board of directors<br />
Kurt rudolf: dipl.-ing. eth; formerly: managing director of lgZ landis & gyr Zug ag; Ceo portescap group,<br />
la Chaux-de-fonds. Currently: member of the Board of directors at Belimed ag and the medela group,<br />
Switzerland (uSa Chairman of the Board).<br />
urs tanner: executive mBa university of St. gallen, Switzerland; amp, harvard, uSa. professional back-<br />
ground: various management positions at Styner + Bienz ag (adval tech), niederwangen, Switzerland<br />
(1967 – 1983); md of mikron’s tool and plastics division, Biel, Switzerland (1983 – 1994); Ceo of the medela<br />
group, Baar, Switzerland (1995 – 2007). Currently: member of the Board of directors of medela group, Zug,<br />
and of plaston ag, widnau, Switzerland.<br />
Paolo Bottini: lic. iur., lawyer and tax specialist (eidg. dipl.); 1996 – 2000 associate and since 2001 partner<br />
and director of law firm Bär & Karrer lugano, based in Zürich and lugano, Switzerland; guest lecturer for law<br />
and tax issues at Centro di Studi Bancari, vezia, Switzerland.<br />
Philippe dubois: lic. iur. and lic. oec.; self-employed management and financial consultant. formerly: senior<br />
positions at Jp morgan (1974 – 1982), uBS warburg (1982 – 1999) and Bank Julius Bär (1999 – 2001); at uBS<br />
warburg, responsible for ipo of numerous Swiss companies, incl. interroll holding ag.<br />
Horst Wildemann: dipl.-ing. mechanical engineering and dipl.-Kfm. Business administration at the universi-<br />
ties of aachen and Cologne, germany; university lecturer dr. dr. h. c. mult., professorship in Business admin-<br />
istration – Corporate management, logistics and production at technische universität münchen. Currently:<br />
member of the Supervisory Board of Zeppelin gmbh, friedrichshafen, hamberger industriewerke gmbh,<br />
rosenheim, and Siepmann werke gmbh, warstein; Chairman of the Supervisory Board of egon grosshaus<br />
gmbh, lennestadt and Chairman of the management Board of tCw gmbh, munich, germany.<br />
Marco Ghisalberti: laurea, economia e Commercio, istituto universitario di Bergamo, italy, and mBa, Boston<br />
university, Boston, ma/uSa. formerly: regional Sales manager rulli rulmeca S.p.a., italy (1995 – 1999); senior<br />
management positions at precismeca Sa (france) and precismeca montan gmbh (germany) within the rul-<br />
meca group (2000 – 2003). Since 2003: managing director of rulli rulmeca S.p.a., member of the Board of<br />
directors of rulli rulmeca S.p.a. and rulmeca S.p.a. Since 2006: Chairman of rulmeca Service S.r.l.<br />
Ingo Specht: professional qualifications as industrial Business manager, Cologne Chamber of Commerce and<br />
industry, germany. formerly: deputy managing director of interroll ag, Switzerland (1986 – 1993); Self-<br />
employed entrepreneur, luxis, Switzerland (1993 – 1997); vice president Corporate development, interroll<br />
(Schweiz) ag, Switzerland (1998 – 2002); head of Corporate it, interroll management ag, Switzerland<br />
(2003 – 2007); ma naging director of interroll ag, Switzerland, since 1997; shareholder within the founding family.
Corporate governanCe<br />
Board of direCtorS<br />
elections and terms of office<br />
the Board of directors is composed of at least six members. the shareholders dieter Specht and Bruna ghisalberti<br />
or their direct first-generation descendants are entitled to nominate two representatives (or one representative<br />
per family) for the Board of directors, insofar as they hold at least 10 % of the share capital. the<br />
members of the Board of directors are elected individually by the general meeting of Shareholders for a threeyear<br />
term of office. reelection is permitted. the Chairman is elected by the Board of directors (art. 19 & 20 of<br />
the articles of association).<br />
Internal organisational structure<br />
the Board of directors is responsible for strategic issues and performs high-ranking duties as regards the<br />
management, supervision and control of the executive members of the interroll group.<br />
the Board of directors comprises the Chairman, the deputy Chairman and the remaining members.<br />
the Board of directors is assisted by two permanent committees within the areas of auditing (audit Committee)<br />
and remuneration policy (Compensation Committee).<br />
the audit Committee receives the audit reports prepared by the external auditors and group auditors, subse-<br />
quently reporting on them to the Board of directors. in particular, it satisfies itself that the group companies<br />
are also audited on a regular basis. at least once a year, the audit Committee also commissions a report on<br />
audits undertaken and planned as well as on any proposals to improve the auditing function. the audit Com-<br />
mittee submits its proposals to the Board of directors for decision.<br />
the Compensation Committee sets the salary and bonus of the Ceo and the members of group management,<br />
as well as the compensation of the Board of directors. at the beginning of the year, it defines the targets to be<br />
attained for bonus payments to become applicable. in addition, the Compensation Committee is responsible<br />
for establishing the terms of the share ownership programme.<br />
Both committees meet as necessary, and committee meetings can be convened by any member. the mem-<br />
bers of the committees are indicated in the table “members of the Board of directors”.<br />
the Board of directors is deemed quorate if an absolute majority of its members is present in person. resolu-<br />
tions are adopted on the basis of an absolute majority of votes present. in the event of an equal division of<br />
votes, the Chairman casts the deciding vote. all resolutions are recorded in the minutes. the Board of directors<br />
meets as often as business requires, but at least four times per annum.<br />
the meetings are convened by the Chairman of the Board of directors. each member of the Board of directors<br />
may demand that a meeting be convened, specifying the item on the agenda to be discussed. in the <strong>2009</strong><br />
financial year, the Board of directors met on six occasions, the audit Committee twice and the Compensation<br />
Committee once for regular scheduled meetings. the managing directors of the respective business units<br />
and Corporate functions are invited to attend meetings when necessary.<br />
27
28<br />
Corporate governanCe<br />
Board of direCtorS<br />
definition of areas of responsibility<br />
areas of responsibility and control are specified within a set of organisational regulations.<br />
the Board of directors has exercised its statutory authority to delegate management to third parties who need<br />
not be share holders (group management), reserving those duties which may not be delegated or with-<br />
drawn.<br />
in the provisions of the organisational regulations, the Board of directors has delegated the management of<br />
ongoing business to a Chief executive officer (Ceo). the Ceo is responsible for the overall management of<br />
the interroll group and for all matters not falling under the purview of another governing body, as specified by<br />
law, the articles of association or the organisational regulations. in particular, the Ceo is responsible for the<br />
operational management of the Company as a whole.<br />
group management consists of the Ceo and the managing directors of the Business units and of the Corpo-<br />
rate functions, who report directly to him at the Company’s headquarters.<br />
Information and control instruments<br />
at each meeting, the Ceo informs the Board of directors of the course of business, the principal events<br />
within the group and the discharge of duties delegated to the group management.<br />
the management information System (miS) of the interroll group consolidates the balance sheet, income<br />
statement and cash flow statement, as well as financial data pertaining to the subsidiary companies, on a<br />
monthly basis and compares the current figures with those of the previous year and the forecast. on the basis<br />
of the quarterly financial statements, the forecast is assessed as to whether it is attainable with regard to each<br />
entity and the consolidated group. the financial reports (miS) are discussed with the Ceo at meetings of the<br />
Board of directors.<br />
on behalf of the audit Committee, internal audits are performed annually at selected subsidiary companies.<br />
the focal points of the audit are defined according to the risk profile of the respective entity. the audit Com-<br />
mittee reports are discussed with the management.<br />
extraordinary occurrences and decisions of material importance, as specified in the organisational regulations,<br />
are immediately brought to the attention of all members of the Board of directors in writing.
5 Group Management<br />
Group Management: members, other activities, vested interests<br />
Paul Zumbühl Swiss<br />
born 1957<br />
didier lermite french<br />
born 1959<br />
Heinrich droste german<br />
born 1961<br />
ralf Garlichs german<br />
born 1962<br />
Jürg Häusermann Swiss<br />
born 1961<br />
Kwang-Heng Seng Singaporean<br />
born 1951<br />
lorenz Köhler Swiss<br />
born 1959<br />
Christian Hähni Swiss<br />
born 1958<br />
flavio Zanatta Swiss<br />
born 1971<br />
Paul Zumbühl<br />
Ceo<br />
Corporate governanCe<br />
group management<br />
Ceo<br />
since January 2000<br />
managing director Business unit interroll dynamic<br />
Storage since november 2000<br />
managing director Business unit interroll automation<br />
since January 2003<br />
managing director Business unit<br />
interroll drives & rollers since July 2006<br />
Cfo<br />
since november 2000<br />
head of new markets<br />
since april 1988<br />
head of Corporate Communications<br />
since Juni 2001<br />
head of Corporate it<br />
since Juli 2007<br />
head of Corporate technology<br />
since Juni 2005<br />
dipl.-ing. (university of lucerne) and mBa (Corporate<br />
finance and international management), advanced<br />
executive management program at Kellogg Business<br />
School of northwestern university, uSa, marketing<br />
management diploma (eidg.-dipl.).<br />
formerly: managing director & Coo mikron plastics<br />
technology and member of mikron group management,<br />
Biel, Switzerland (1994 – 1999); managing director<br />
and other management roles within the Sarna<br />
group, Sarnen, Switzerland (1988 – 1994). member<br />
of the Board of directors of Schlatter holding ag,<br />
Schlieren/Zurich, Switzerland, since 29th october<br />
2007, and of looser holding ag, arbon, Switzerland,<br />
since 15th may <strong>2009</strong>.<br />
29
30<br />
Corporate governanCe<br />
group management<br />
didier lermite<br />
managing director, Business unit interroll dynamic Storage<br />
mBa and deSS (diplôme etudes Supérieures Spécialisées) with<br />
marketing and Business management, managing director Business<br />
unit interroll dynamic Storage.<br />
formerly: Sales manager at Sipa roller, france (1985 – 1992) and<br />
export Sales manager responsible for establishing the global sales<br />
network at Sipa roller (1992 – 2000).<br />
Heinrich droste<br />
managing director, Business unit interroll automation<br />
dr.-ing. (university of hannover, mechanical engineering majoring in<br />
materials handling), managing director Business unit interroll auto-<br />
mation.<br />
formerly: head of development at mannesmann dematic, offenbach<br />
(1994 – 1998) and managing director axmann fördertechnik<br />
gmbh, Sinsheim, germany (1998 – 2003).<br />
ralf Garlichs<br />
managing director, Business unit interroll drives & rollers<br />
dr.-ing. (university of hannover, mechanical engineering majoring in<br />
production engineering): managing director Business unit interroll<br />
drives & rollers.<br />
formerly: head of production and logistics at festo tooltechnic,<br />
esslingen, germany (1994 – 1999); managing director of reflex<br />
winkelmann as well as other senior management roles at winkelmann,<br />
ahlen/westphalia, germany (1999 – 2006)<br />
Jürg Häusermann<br />
Cfo<br />
Jürg häusermann: economics and Business administration hwv<br />
(majoring in finance and marketing); responsible for financial man-<br />
agement of the interroll group as Cfo.<br />
formerly: global division Controller Kitchen technology, franke<br />
group, Switzerland (1997– 2000).
Kwang-Heng Seng<br />
head of new markets<br />
Corporate governanCe<br />
group management<br />
Bachelor of Science (production engineering) at aston univer sity in<br />
Birmingham, uK. head of new markets.<br />
formerly: division manager at trading company guthrie (Singapore)<br />
pte. ltd.; regional manager at Cuno pacific, subsidiary of the amf<br />
group specialising in water filtration systems. Since 1988, managing<br />
director of interroll (asia) pte. ltd. in Singapore.<br />
lorenz Köhler<br />
head of Corporate Communications<br />
media Studies (university of Bern), head of public relations and<br />
Communication.<br />
formerly: Copywriter and advertising assistant at full-service advertising<br />
agency (1990– 1994); pr and advertising Coordinator europe/<br />
middle & far east for Jet aviation, a worldwide service company for<br />
business aviation (1994 – 2000).<br />
Christian Hähni<br />
head of Corporate it<br />
there are no management contracts with third parties.<br />
Bachelor of engineering in mechanical engineering; executive<br />
mBa in Business engineering at university of St. gallen (hSg) and<br />
Santa Clara university California; head of corporate information<br />
technology.<br />
formerly: management Consultant at Kpmg and Sap (1995 – 2003),<br />
Cio at wmh walter meier holding ag (2003 – 2007).<br />
flavio Zanatta<br />
head of Corporate technology<br />
dipl. masch.-ing. (university of applied Sciences) and post-graduate<br />
diploma in management, university of applied Sciences lucerne,<br />
Switzerland. head of Corporate technology.<br />
formerly: project manager at translift ag (formerly Swisslog) and at<br />
general dynamics ag (1997– 2005), engineer for research & development<br />
at helbling technik ag, Switzerland (1994 – 1997).<br />
31
32<br />
Corporate governanCe<br />
CompenSation, Shareholding and loanS<br />
6 Compensation, shareholding and loans<br />
Content and method of determining the compensation and share-ownership programmes<br />
the Board of directors determines on a yearly basis the level of fixed compensation payable to its members<br />
according to their degree of activity and responsibility. additional compensation may be granted for extraordinary<br />
efforts above and beyond normal Board activities. the salary and bonus of the group management are<br />
determined by the Compensation Committee. the senior management and management of the interroll group<br />
receive performance-based compensation. the variable component ranging from zero to fifty per cent of total<br />
compensation is based on attainment of individual annual performance targets determined in advance as well<br />
as on the level of budget fulfilment.<br />
in accordance with share option guidelines, senior management, management and other staff within the interroll<br />
group received in 2006 options options as determined by the Compensation Committee.<br />
for the terms of the option plan, cf. financial statements of interroll group, 6.1 personnel expenses. no terms<br />
were changed in the year under revision.<br />
Compensation according to or 633 bis , cf. financial statements of interroll holding ltd., 4.3 Compensation of<br />
and shares held by the Board of directors.
7 Shareholders’ participation rights<br />
Corporate governanCe<br />
ShareholderS’ partiCipation rightS<br />
representation and restriction of voting rights<br />
rights governing shareholder participation are in accordance with the requirements specified within the Swiss<br />
Code of obligations. each share issued has one vote. a shareholder’s voting rights are restricted to a maximum<br />
of 5 % of the total number of votes. individual nominees, however, are entitled to exercise more than 5 %<br />
of the total votes if they disclose the identity of the beneficiaries they represent and if the respective beneficiaries<br />
as a whole do not exercise more than 5 % of the voting rights. this restriction of voting rights does not<br />
apply to the founding family, insofar as the individual families hold at least 10 % of the share capital. registered<br />
shares of nominees that exceed 2 % of the shares outstanding are only listed in the register as shares fur<br />
nished with voting rights if the nominee has provided written consent to the possible disclosure of names,<br />
addresses and shareholdings of those persons for whom the said nominee holds 0.5 % or more of the shares<br />
outstanding. there is a statutory group clause.<br />
Statutory quorum<br />
Subject to contrary statutory or legal provisions, the general meeting of Shareholders is deemed to be quorate<br />
irrespective of the number of shareholders present and the shares represented by proxy.<br />
Convocation of General Meeting of Shareholders<br />
the invitation to the general meeting of Shareholders is issued at least twenty days prior to the meeting and<br />
is legally effective upon inclusion in the Company’s chosen vehicle of communication (“Schweizerisches handelsamtsblatt”).<br />
in addition, the Board of directors sends a written invitation to those registered shareholders<br />
listed in the Share register.<br />
Agenda<br />
the invitation to the general meeting of Shareholders shall include all items on the agenda as well as all motions<br />
put forward by the Board of directors and, if applicable, by the shareholders who have called for a general<br />
meeting or the inclusion of an item on the agenda. no resolutions shall be passed on motions relating to items<br />
which have not been announced in the requisite manner, with the exception of those motions relating to the<br />
convocation of an extra ordinary meeting of Shareholders or the execution of a special audit.<br />
Inscriptions into the share register<br />
no entries are made in the Share register ten days prior to a general meeting of Shareholders up to the day<br />
subsequent to the general meeting of Shareholders.<br />
33
34<br />
Corporate governanCe<br />
ChangeS of Control and defenCe meaSureS/auditorS<br />
8 Changes of control and defence measures<br />
duty to make an offer<br />
the threshold as regards the obligation to put forward a full offer pursuant to art. 32 Behg is 33 1 /3 % of the<br />
voting rights.<br />
Clauses on changes of control<br />
no severance compensations have been defined for members of the Board of directors or employees of<br />
interroll.<br />
9 Auditors<br />
duration of the mandate and term of office of the lead auditor<br />
Since the ipo of interroll in 1997, the consolidated financial statements of the interroll group and the individual<br />
financial statements of interroll holding ltd. have been audited by Kpmg ag. a new lead auditor took respon-<br />
sibility for the group audit in 2008.<br />
Auditing fees<br />
the auditing fees paid within the group to Kpmg auditing units amounted to Chf 0.58 million in <strong>2009</strong> (2008:<br />
Chf 0.67 million).<br />
Additional fees<br />
in <strong>2009</strong>, Kpmg branch offices received a total of Chf 0.45 million (2008: Chf 0.33 million) for tax and m&a<br />
consulting.<br />
Supervisory and control instruments pertaining to the audit<br />
the audit Committee is responsible for evaluating the external audit. the external auditors prepare an audit<br />
report to be submitted to the Board of directors. at least one consultation is two consultations are held each<br />
year between the external auditors and the audit Committee. material findings for each entity (management<br />
letters) as well as the consolidated accounts covered by the audit report are discussed in detail. the auditors<br />
also explain their services rendered (audit, review) for each entity, along with recent changes in iaS/ifrS and<br />
their impact on the total comprehensive income of the interroll group.
10 Information policy<br />
Corporate governanCe<br />
information poliCy<br />
interroll is committed to providing swift, transparent and simultaneous informa tion for all stakeholders. the<br />
consolidated financial statements are prepared in conformity with iaS/ifrS.<br />
interroll holding ltd. publishes comprehensive financial results twice a year: for the first half and for the financial<br />
year as a whole. in addition to the financial results, shareholders and financial markets are regularly kept in-<br />
formed of significant changes and developments.<br />
interroll holding ltd. publishes facts relevant to its share price in conformity with disclosure requirements<br />
(ad hoc disclosure, art. 72 of the listing rules) of the SiX Swiss exchange.<br />
in addition to electronic methods of communication, annual reports are forwarded to all shareholders and<br />
other interested parties as a printed copy.<br />
for further details, please visit www.interroll.com/ir (investor relations).<br />
interroll holding ltd.<br />
via gorelle 3<br />
Ch – 6592 Sant’antonino, Switzerland<br />
tel. +41 91 850 25 25<br />
fax +41 91 850 25 05<br />
investor.relations@interroll.com<br />
35
36<br />
interroll SolutionS at a glanCe<br />
the Heart of Conveyor technology<br />
and logistics<br />
Consistent design from the initial concept through system integration to<br />
efficient operation: as the “heart of conveyor technology and logistics”,<br />
interroll’s best in class solutions ensure high-performance unit load handling<br />
at every stage of material processing – power, precision, perfection.<br />
1 energy and space-saving: fifo pallet<br />
storage with full-width rollers<br />
2 Space-optimising lifo pallet flow storage<br />
modules with lifo speed controllers …<br />
3 … or with Cart pushback<br />
4 efficient order picking with ergonomic Carton<br />
flow (floway wheel tracks)<br />
5 Quick conversion: order picking from convertible<br />
flex flow racks<br />
6 Space-saving drive solutions for belt conveyors:<br />
drum motors with idler pulleys, brackets<br />
and optional accessories (eg. controls)<br />
7 intelligent drive solutions for zero-pressure<br />
accumulation conveyors: 24 vdC rollerdrives<br />
with integrated control electronics, Conveyor<br />
rollers and polyvee or o-ring transmissions<br />
8 long life-cycle solutions for non-driven conveyors:<br />
Conveyor rollers, omni-directional wheels<br />
and ball transfer units<br />
9 unbreakable “weightlifter”: pallet conveyor<br />
modules with palletdrive<br />
10 highly economical, starting at throughputs of<br />
2000 units/hour: Crossbelt Sorter with connecting<br />
conveyor modules<br />
11 Space-saving solution for direction changes:<br />
Belt Curves and Spiral Curves<br />
12 Smartest solution for height differentials:<br />
Belt Conveyor modules<br />
13 energy-saving and intelligent: intelliveyor for<br />
zero-pressure accumulation<br />
1<br />
2<br />
11<br />
12<br />
7<br />
5<br />
6
3<br />
8<br />
13<br />
9<br />
4<br />
10<br />
13
meet interroll SolutionS all over the world<br />
Barenschee uses <strong>Interroll</strong> conveyor technology<br />
for printing plates<br />
the pre-press machines of Barenschee in lüneburg, germany, process and convey printing plates<br />
from the preliminary stage to the printing press. the extremely time-critical process – of printing<br />
daily newspapers, for instance – requires the highest possible reliability and careful handling of<br />
integrated roller conveyors. Barenschee opted for the compact, energy-saving interroll rollerdrives<br />
for the purpose of powering its roller conveyors. the rollerdrives, with integrated dC<br />
motors and electronic controls, drive the interroll 1700 series rollers via polyvee belts. the compactness<br />
of this drive solution guarantees Barenschee quick and easy installation of the rollers<br />
into the processing systems. it enables Barenschee to offer customers cost-effective pre-press<br />
printing systems that can be rapidly delivered and quickly installed on site, even when space is at<br />
a premium. the simple roller attachment mechanism guarantees easy access during routine maintenance<br />
work and minimises downtime. the service life of interroll rollerdrives is generally 20,000<br />
hours or almost seven years of continuous eight-hour operation per day. the energy-saving<br />
conveyors make a significant contribution to reducing the total cost of ownership and make the<br />
plants a worthwhile investment in the time-critical printing process.<br />
project partners: Barenschee (manufacturer of pre-press systems), interroll (drive solution for roller<br />
con veyors)<br />
39
40<br />
meet interroll SolutionS all over the world<br />
finnish Post sorts mail with <strong>Interroll</strong> Crossbelt Sorters<br />
the finnish post itella distribution centre in helsinki was fully commissioned in october <strong>2009</strong>. in just one<br />
hour, two stacked interroll Crossbelt Sorters now distribute up to 20,000 parcels, oversize letters and<br />
postal packs weighing up to 15 kg. with a length of 523 metres, these are the longest interroll Crossbelt<br />
Sorters ever installed. Sixteen in-feed lines with interroll Belt Conveyors and merge modules inject the<br />
postal goods into the sorter before they are diverted out at a total of 540 discharge points. units weighing<br />
up to 15 kg slide via chutes into trolleys; goods up to 35 kg and 1 m long are discharged via spiral<br />
chutes and manually loaded into special itella trolleys.<br />
these precisely pre-assembled sorter modules from interroll can be rapidly integrated on site within<br />
overall systems. “economical to operate from 2000 items per hour, rapid return on investment of 2 – 3<br />
years, high reliability, compact and energy-saving concept, minimal maintenance due to mechanically<br />
robust construction, very simple operation and workplace-friendly quiet running – all these benefits make<br />
the overall investment a very attractive one for users,” says hans Kratz, global product manager interroll<br />
Crossbelt Sorters.<br />
project partners: finnish post (user), Siemens (system integrator), interroll (Crossbelt Sorters, in-feed<br />
and out-feed Conveyor technology)
meet interroll SolutionS all over the world<br />
food discounter relies on<br />
dynamic storage technology from <strong>Interroll</strong><br />
italian discounter euroSpin currently supplies its 700 branches in north-east italy, South tyrol and<br />
Slovenia from its new distribution centre in San martino Buon albergo near verona. every day, up<br />
to 300 hgvs arrive at the modern warehouse hub, which packs up between 600 and 900 pallets<br />
per eight-hour shift. an interroll dynamic pallet storage system forms the heart of the whole system,<br />
guaranteeing that the logistics chain, from incoming goods to route planning, runs like clockwork.<br />
it can store up to 4920 euro pallets or 9840 düsseldorf half pallets on a compact, space-saving<br />
basis in an area covering just 2800 square metres. it also saves energy using 120 gravity lanes<br />
with 4 levels, operating on a first-in, first-out basis. a completely automated stacker crane stores<br />
the pallets in the 51-metre lanes, which are inclined at 4 % (up to 41 euro pallets or 82 half pallets<br />
per lane). each lane can support a full capacity of up to 41 tons. Side guide rollers ensure that the<br />
pallets travel centrally from the input to the output point. Speed controllers and safety separators<br />
in the centre of the lane and on the output side guarantee safe pallet handling at all times.<br />
project partners: euroSpin (user), Jungheinrich (general contractor), interroll/rulli rulmeca (dynamic<br />
storage technology).<br />
43
Financial <strong>Report</strong><br />
of <strong>Interroll</strong> Group<br />
To the shareholders’ meeting of INTERROLL HOLDING LTD.<br />
Business year <strong>2009</strong><br />
March 3, 2010<br />
CONTENT<br />
Financial RepoRt<br />
Financial statements of <strong>Interroll</strong> Group 47<br />
Notes to the financial statement of <strong>Interroll</strong> Group 52<br />
Financial report of INTERROLL HOLDING LTD. 99<br />
45
Financial report<br />
Financial RepoRt<br />
1 Consolidated financial statements of <strong>Interroll</strong> Group 48<br />
1.1 consolidated statement of financial position 48<br />
1.2 consolidated statement of comprehensive income 49<br />
1.3 consolidated statement of cash flows 50<br />
1.4 consolidated statement of changes in equity 51<br />
2 General information to the financial statements 52<br />
2.1 convention of preparation 52<br />
2.2 critical accounting estimates and judgments 56<br />
2.3 principles of consolidation 56<br />
2.4 principles of valuation 59<br />
2.5 Financial risk management 64<br />
3 Changes to the scope of consolidation 66<br />
4 Segment information 68<br />
5 Notes to the consolidated statement of financial position 71<br />
5.1 Movements of property, plant and equipment 71<br />
5.2 Movements of goodwill and intangible assets 72<br />
5.3 assets pledged or assigned 73<br />
5.4 inventory 74<br />
5.5 trade and other accounts receivable 74<br />
5.6 cash and cash equivalents 76<br />
5.7 Financial instruments and currency risks 76<br />
5.8 equity mangagement 79<br />
5.9 information on shareholder’s equity 79<br />
5.10 earnings per share 80<br />
5.11 Financial liabilities 81<br />
5.12 leasing liabilities 83<br />
5.13 provisions 84<br />
5.14 pension obligations and pension costs 85<br />
5.15 trade and other accounts payable 87<br />
6 Notes to the consolidated statement of comprehensive income 88<br />
6.1 personnel expenses 88<br />
6.2 Research and developement 89<br />
6.3 other operating expenses 89<br />
6.4 other operating income 89<br />
6.5 Financing result 90<br />
6.6 income tax expense 90<br />
7 Other disclosures 93<br />
7.1 contingent liabilities 93<br />
7.2 Related party transactions 93<br />
7.3 Subsequent events 94<br />
7.4 Scope of consolidation 94<br />
8 <strong>Report</strong> of the Group auditor 96<br />
47
48<br />
Financial RepoRt<br />
Financial StateMentS<br />
1 CONSOLIDATED FINANCIAL STATEMENTS OF INTERROLL GROUP<br />
1.1 Consolidated statement of financial position<br />
in thousands cHF<br />
see<br />
notes* 31.12.<strong>2009</strong> in % 31.12.2008 in %<br />
aSSetS<br />
property, plant and equipment 5.1 85 579 79 863<br />
Goodwill and other intangible assets 5.2 39 525 36 127<br />
Financial assets 923 757<br />
Deferred tax assets 6.6 202 355<br />
Total non-current assets 126 229 58.5 117 102 49.5<br />
assets held for sale 5.1 1 300 1 198<br />
inventories 5.4 39 252 41 759<br />
current tax assets 1 711 506<br />
trade and other accounts receivable 5.5 38 814 54 566<br />
cash and cash equivalents 5.6 8 387 21 632<br />
Total current assets 89 464 41.5 119 661 50.5<br />
Total assets 215 693 100.0 236 763 100.0<br />
eQUitY anD liaBilitieS<br />
Share capital 12 810 17 080<br />
Group reserves 140 636 135 519<br />
translation reserve – 20 422 – 21 868<br />
Total equity 5.9 133 024 61.7 130 731 55.2<br />
Financial liabilities 5.11 1 444 8 481<br />
Deferred tax liabilities 6.6 10 476 18 134<br />
provisions 5.13 6 303 7 671<br />
Total non-current liabilities 18 223 8.4 34 286 14.5<br />
Financial liabilities 5.11 11 118 8 782<br />
current tax liabilities 6 359 16 308<br />
trade and other accounts payable 5.15 46 969 46 656<br />
Total current liabilities 64 446 29.9 71 746 30.3<br />
Total liabilities 82 669 38.3 106 032 44.8<br />
Total liability and shareholder’s equity 215 693 100.0 236 763 100.0<br />
* See notes to the consolidated financial statements.
1.2 Consolidated statement of comprehensive income<br />
in thousands cHF<br />
Financial RepoRt<br />
Financial StateMentS<br />
see<br />
notes* <strong>2009</strong> in % 2008 in %<br />
Net Sales 233 987 100.0 357 920 100.0<br />
Material expenses – 98 749 – 42.2 – 147 381 – 41.2<br />
personnel expenses 6.1 & 5.14 – 81 522 – 34.8 – 95 241 – 26.6<br />
increase/(Decrease) in work in progress,<br />
finished products and own goods capitalized 4 621 2.0 – 9 033 – 2.5<br />
other operating expenses 6.3 – 48 129 – 20.6 – 61 538 – 17.2<br />
other operating income<br />
Operating result before depreciation<br />
6.4 8 620 3.7 13 486 3.8<br />
and amortisation (EBITDA) 18 828 8.0 58 213 16.3<br />
Depreciation 5.1 – 10 856 – 4.6 – 10 040 – 2.8<br />
impairment on property, plant and equipment 5.1 – – – 143 – 0.0<br />
Operating result before amortisation (EBITA) 7 972 3.4 48 030 13.4<br />
amortisation 5.2 – 4 870 – 2.1 – 4 659 – 1.3<br />
Operating result (EBIT) 3 102 1.3 43 371 12.1<br />
Financing expenses – 3 152 – 1.3 – 2 745 – 0.8<br />
Financing income 1 743 0.7 5 422 1.5<br />
Financing result, net 6.5 – 1 409 – 0.6 2 677 0.7<br />
Result before income taxes 1 693 0.7 46 048 12.9<br />
income tax expense 6.6 4 023 1.7 – 12 215 – 3.4<br />
Result 5.10 5 716 2.4 33 833 9.5<br />
currency translation differences 787 0.3 – 19 137 – 5.3<br />
Realised currency translation differences 659 0.3 – 2 691 – 0.8<br />
changes in the fair value of cash flow hedges, net<br />
net change in fair value of cash flow hedges transferred to<br />
116 0.0 1 980 0.6<br />
result – 344 – 0.1 – 2 420 – 0.7<br />
Other comprehensive income, net of taxes 1 218 0.5 – 22 268 – 6.2<br />
Total comprehensive income for the period 6 934 3.0 11 565 3.2<br />
Earnings per share<br />
Basic earnings (result) per average share oustanding (cHF 1) 5.10 7.41 44.38<br />
Diluted earnings (result) per averge share outstanding (cHF 1) 5.10 7.41 43.60<br />
* See notes to the consolidated financial statements.<br />
49
50<br />
Financial RepoRt<br />
Financial StateMentS<br />
1.3 Consolidated statement of cash flows<br />
in thousands cHF see notes* <strong>2009</strong> 2008<br />
Result 5 716 33 833<br />
Depreciation, amortisation and impairment 5.1 & 5.2 15 726 14 842<br />
loss/(gain) on disposal of tangible and intangible assets 6.3 398 48<br />
Financial result, net 6.5 1 409 – 2 677<br />
income taxes 6.6 – 4 023 12 215<br />
changes in inventories 3 451 5 487<br />
changes in trade and other receivables 16 862 1 034<br />
Realised cash flow hedges – 228 – 440<br />
changes in trade and other payables – 3 609 – 11 804<br />
changes in provisions, net 5.13 – 1 481 – 1 042<br />
income taxes paid – 13 195 – 8 961<br />
personnel expenses on share based payments 6.1 596 715<br />
other non-cash (income)/expenses – 1 234 – 1 373<br />
Cash flow from operating activites 20 388 41 877<br />
acquisition of property, plant and equipment 5.1 – 16 492 – 19 951<br />
acquisition of intangible assets 5.2 – 6 367 – 2 433<br />
acquisition of financial assets – 172 – 135<br />
proceeds from disposal of property, plant and equipment 964 273<br />
Settlement of loans receivable 3 243<br />
acquisition of subsidiaries, net of cash acquired 3 – 4 646 – 2 140<br />
interests received 311 866<br />
Cash flow from investing activities – 26 399 – 23 277<br />
Free cash flow – 6 011 18 600<br />
Reduction of par value – 3 859 – 8 018<br />
acquired own shares – – 4 245<br />
Sale of own shares – 5 813<br />
proceeds from financial liabilities 4 463 1 833<br />
Repayment of financial liabilities – 7 693 – 7 370<br />
interests paid – 775 – 967<br />
Cash flow from financing activities – 7 864 – 12 954<br />
translation adjustment on cash and cash equivalents 630 – 2 406<br />
Change in cash and cash equivalent – 13 245 3 240<br />
cash and cash equivalent at January 1 21 632 18 392<br />
Cash and cash equivalent at December 31 5.6 8 387 21 632<br />
* See notes to the consolidated financial statements.
1.4 Consolidated statement of changes in equity<br />
in thousands cHF see notes*<br />
SHaRe<br />
capital<br />
ReSeRve<br />
SHaRe FoR own<br />
pReMiUM SHaReS<br />
tRanSlation<br />
ReSeRve<br />
HeDGinG<br />
ReSeRve<br />
Financial RepoRt<br />
Financial StateMentS<br />
RetaineD<br />
eaRninGS TOTAL EqUITy<br />
Balance at January 1, 2008 26 047 26 616 – 39 772 – 40 668 111 382 124 901<br />
Result 33 833 33 833<br />
translation adjustments – 19 137 – 19 137<br />
Realised translation differences 6.5 – 2 691 – 2 691<br />
effective portion of changes in the<br />
fair value of cash flow hedges<br />
net change in fair value of cash<br />
1 980 1 980<br />
flow hedges transferred to result<br />
Total other comprehensive<br />
– 2 420 – 2 420<br />
income, net of taxes – – – – 21 828 – 440 – – 22 268<br />
Total comprehensive income – – – – 21 828 – 440 33 833 11 565<br />
Reduction in par value – 8 967 949 – 8 018<br />
Share based payment transaction 6.1 & 6.6 – 91 806 715<br />
acquired own shares – 4 245 – 4 245<br />
Sale of own shares – 1 797 7 610 5 813<br />
transfers 5 120 – 5 120 –<br />
Balance at December 31, 2008 17 080 29 848 – 34 652 – 21 868 228 140 095 130 731<br />
Result 5 716 5 716<br />
translation adjustments 787 787<br />
Realized translation differences<br />
effective portion of changes in the<br />
6.5 659 659<br />
fair value of cash flow hedges<br />
net change in fair value of cash<br />
116 116<br />
flow hedges transferred to result<br />
Total other comprehensive<br />
– 344 – 344<br />
income, net of taxes – – – 1 446 – 228 – 1 218<br />
Total comprehensive income – – – 1 446 – 228 5 716 6 934<br />
Reduction in par value – 4 270 411 – 3 859<br />
Share based payment transaction<br />
withholding tax on share<br />
6.1 & 6.6 – 420 1 016 596<br />
buybacks<br />
payment of acquistion costs<br />
5.9 – 1 640 – 1 640<br />
with own shares 3 – 233 495 262<br />
transfers 590 344 – 934 –<br />
Balance at December 31, <strong>2009</strong> 12 810 28 145 – 32 386 – 20 422 – 144 877 133 024<br />
* See notes to the consolidated financial statements.<br />
51
52<br />
Financial RepoRt<br />
noteS to tHe Financial StateMentS<br />
2 GENERAL INFORMATION TO THE FINANCIAL STATEMENTS<br />
2.1 Convention of preparation<br />
General<br />
the <strong>2009</strong> consolidated financial statements of interroll Group are based on the annual financial statements of<br />
inteRRoll HolDinG ltD., Sant’antonino and its subsidiaries as of December 31, <strong>2009</strong>, drawn up according<br />
to uniform Group accounting principles. the consolidated financial statements present a true and fair view<br />
of the consolidated financial position, results of operations and cash flows in accordance with the international<br />
Financial <strong>Report</strong>ing Standards (iFRS) and comply with Swiss law.<br />
the consolidated financial statements are based on historical cost except for marketable securities, investments<br />
not involving significant influence and derivative financial instruments, which are stated at fair value.<br />
the preparation of financial statements in conformity with iFRS requires management to make judgments,<br />
estimates and assumptions that affect the application of policies and reported amounts of assets and liabilities,<br />
income and expenses. these judgments, estimates and assumptions are based on historical experience and<br />
other factors that are believed to be reasonable under the circumstances. actual results may differ from these<br />
estimates.<br />
the estimates and underlying assumptions are reviewed on an ongoing basis. Revisions to accounting estimates<br />
are recognized in the period in which the estimate is revised if the revision affects only that period or in<br />
the period of the revision and future periods if the revision affects both current and future periods.<br />
Judgments made by management in the application of iFRS that have a significant effect on the consolidated<br />
financial statements and estimates with a significant risk of material adjustment in the next years are disclosed<br />
under “2.2 – critical accounting estimates and judgments”.
Financial RepoRt<br />
noteS to tHe Financial StateMentS<br />
Revised IAS/IFRS Standards and Interpretations<br />
the following iaS/iFRS standards and interpretations have been revised by the international accounting Standards<br />
Boards (iaSB). those standards/interpretations were adopted in the year <strong>2009</strong> for the first time. the<br />
impact of the revisions onto the consolidated financial statements of the Group is described thereafter:<br />
IAS/IFRS standards iMpact on tHe GRoUp pUBlication<br />
to Be aDopteD in<br />
Financial YeaR<br />
IFRS 2 * April <strong>2009</strong> <strong>2009</strong><br />
iFRS 2 defines the valuation of issuing shares or share based instruments as a consideration for goods or<br />
services. the change clarifies the expressions “vesting conditions” and “cancellations”. thus, vesting conditions<br />
relate to service and performance conditions only. cancellations, regardless of their nature, need to be<br />
accounted for as accelerated vesting conditions.<br />
IFRS 7 ** March <strong>2009</strong> <strong>2009</strong><br />
the scope of iFRS 7 is to inform the reader of the annual report about the importance of financial instruments<br />
for the economic condition of the company. the changed standard leads to additional disclosures about the<br />
fair value measurements and liquidity risk.<br />
IFRS 8 ** November 2006 <strong>2009</strong><br />
iFRS 8 relates to segment reporting and replaces iaS 14. it requires an entity to apply the “Management approach”<br />
operational segments are business units for which separate data is available and which independently<br />
realise revenue and whose results are regularly supervised from a chief operating decision maker (coDM).<br />
Revenue and results are the basis for further business decisions.<br />
IAS 1 ** September 2007 <strong>2009</strong><br />
iaS 1 sets the basis for the presentation of a financial statement. with the amendment of iaS 1, besides the<br />
result from the income statement, a comprehensive income including changes in revaluation reserve, translation<br />
differences and changes in cash flow hedges must be disclosed. the amended standard also leads to<br />
different specifications of some parts of the financial report.<br />
IAS 23 * March 2007 <strong>2009</strong><br />
the objective of iaS 23 is to define the accounting treatment for borrowing costs. Borrowing costs that are<br />
directly attributable to the acquisition or construction of a specific asset must be capitalised as part of this<br />
specific asset.<br />
IAS 27/IFRS 1 * May 2008 <strong>2009</strong><br />
the change in iaS 27/iFRS 1 defines the valuation of acquisition costs when adopting iaS/iFRS for the first<br />
time. Dividends must be disclosed separatly in the statement of the investor. when a new parent company is<br />
formed in a reorganisation, the new parent company must measure the cost of its acquisition in the previous<br />
parent company at the carrying amount of its share in the equity of the previous parent company at the date<br />
of the reorganisation.<br />
IAS 39/IAS 32/IAS 1//IFRIC 9 * Feb. 08/March <strong>2009</strong> <strong>2009</strong><br />
iaS 39 and its companion iaS 32 define how the impact of financial instruments on the equity and results must<br />
be presented. the amendments determine the judgment and the recognition of reclassifications of derivative<br />
instruments.<br />
Improvements project IASB * May 2008 <strong>2009</strong><br />
the iaSB has carried out various amendments to standards under its annual improvement project. those<br />
amendments mainly concern the wording of the standards and improve the consistency among the standards.<br />
53
54<br />
Financial RepoRt<br />
noteS to tHe Financial StateMentS<br />
Interpretions to IFRS iMpact on tHe GRoUp pUBlication<br />
to Be aDopteD in<br />
Financial YeaR<br />
IFRIC 13 * June <strong>2009</strong> <strong>2009</strong><br />
iFRic 13 provides accounting guidelines for customer loyalty programmes.<br />
IFRIC 15 * July 2008 <strong>2009</strong><br />
iFRic 15 standardises accounting practice across jurisdictions for the recognition of revenue resulting from<br />
sales of property before construction is completed.<br />
IFRIC 16 * July 2008 <strong>2009</strong><br />
iFRic 16 describes the hedging of a net investment in a foreign operation.<br />
IFRIC 18 * January <strong>2009</strong> <strong>2009</strong><br />
this interpretation clarifies the capitalisation of agreements in which an entity receives an asset from a customer<br />
which the entity must then use either to connect the customer to a network or to provide the customer<br />
with ongoing access to goods or services (e.g. electricity, water).<br />
* the amendment had no major impact on the Group’s financial statements resp. was not relevant for the Group.<br />
** the amendment mainly lead to additional disclosures in or changed presentation of the consolidated financial statement.<br />
Future new or revised IAS/IFRS Standards and Interpretations<br />
the following new or revised standards and interpretations have been issued, but will only become effective at<br />
a later stage and are therefore not applicable to the present annual report. their effect on the Group’s future<br />
consolidated financial statements has not yet been analyzed systematically. the expected impact, as outlined<br />
below, represents merely a first assessment performed by Group Management.<br />
IAS/IFRS standards iMpact on tHe GRoUp pUBlication<br />
aDoption planneD in<br />
Financial YeaR<br />
IFRS 1 * July/Nov. <strong>2009</strong> 2010/2011<br />
the standard iFRS 1 sets rules for the first time adoption of iFRS. the amendments mainly contain additional<br />
exceptions.<br />
IFRS 2 * June <strong>2009</strong> 2010<br />
the adjustment of iFRS 2 clarifies how a specific subsidiary of a group needs to account for share based<br />
payments in its own financial statement. an entity that receives goods or services based on share based benefit<br />
agreements shall capitalise such benefits independently from the fact which subsidiary in the group<br />
settles the liability and whether the liability is paid in cash or shares.<br />
IFRS 3/IAS 27/IAS 28/IAS 38 * January 2008 2010<br />
iFRS 3 defines business combinations. the change in this standard is analogously taken into the standards<br />
iaS 27, 28 and 38. iFRS 3 gives the choice to the acquirer to measure minority interests at fair value of the<br />
acquisition date or at the non-controlling interests’ proportionate share of the net identifiable assets of the<br />
business acquired. it also defines how a successive business acquisition is accounted for. Furthermore, acquisition<br />
related costs are expensed and not capitalised anymore as part of goodwill. this standard was early<br />
adopted by the Group.<br />
IFRS 9 *** November <strong>2009</strong> 2013<br />
iFRS 9 – financial instruments is going to replace iaS 39 in mid term. the new standard will classify all financial<br />
assets into two categories, “at carrying value” respectively “at fair value”.
IAS/IFRS standards iMpact on tHe GRoUp pUBlication<br />
* no or no significant impacts are expected on the consolidated financial statements.<br />
** Mainly additional disclosures are expected in the consolidated financial statements.<br />
*** the impacts on the consolidated financial statements can not yet be determined with sufficient reliability.<br />
Financial RepoRt<br />
noteS to tHe Financial StateMentS<br />
aDoption planneD in<br />
Financial YeaR<br />
IAS 24 * November <strong>2009</strong> 2011<br />
iaS 24 defines the disclosure duties for related party transactions. according to the amended standard, infor-<br />
mation that is important to the reader must still be disclosed. Data, that can only be raised at high costs or<br />
represent low value for the reader can be excluded.<br />
IAS 32 *** October <strong>2009</strong> 2010<br />
iaS 32 defines how the impact of financial instruments on the equity and results of an entity must be presented.<br />
the amendment relates to the classification of options in case they differ from the functional currency of the<br />
entity.<br />
Improvements project IASB * April <strong>2009</strong> 2010<br />
the iaSB has carried out various amendments to standards under its annual improvement project. those<br />
amendments mainly concern the wording of the standards and improve consistency among the standards.<br />
Interpretions to IFRS iMpact on tHe GRoUp pUBlication<br />
aDoption planneD in<br />
Financial YeaR<br />
IFRIC 14 * November <strong>2009</strong> 2011<br />
iFRic 14 provides general guidelines to the determination of the maximum excess amount of a defined benefit<br />
asset in a pension fund. it also explaines how legal or contractual minimum financing regulations can impact<br />
assets or liabilities of a plan.<br />
IFRIC 17 * November 2008 2010<br />
iFRic 17 defines the valuation and presentation of non-cash asset transfers to owners.<br />
IFRIC 19 * November <strong>2009</strong> 2011<br />
iFRic 19 relates to the settlement of financial instruments with equity instruments.<br />
55
56<br />
Financial RepoRt<br />
noteS to tHe Financial StateMentS<br />
2.2 Critical accounting estimates and judgments<br />
the Group makes estimates and assumptions concerning the future. the resulting accounting estimates can,<br />
by definition, deviate from the actual outcome. the estimates and assumptions that have a significant risk of<br />
causing a material adjustment to the carrying amount of assets and liabilities within the next financial years are<br />
discussed below.<br />
a) income taxes<br />
the Holding company and its subsidiaries are subject to income taxes. Significant judgment is required in<br />
determining the required worldwide provision for current and deferred income taxes and the realization of<br />
tax losses carried forward. there are many transactions and calculations made for which the final tax determination<br />
is uncertain in the year under review. where final tax assessments or tax audits of such matters<br />
are different from the amounts that were initially recorded, such differences may materially impact assets,<br />
liabilities, income tax and deferred tax provisions in the period in which such determination is made. the<br />
relevant figures are outlined in note 6.6.<br />
b) Recoverable amount of goodwill, patents and licenses<br />
the assessment of the recoverable amount of goodwill and other intangible assets is, by definition, subject<br />
to uncertainties regarding expected future cash flows. it requires making assumptions and calculating parameters,<br />
whose adequacy will only turn out in the future. we refer to comments made under note 5.2 that<br />
also include the relevant carrying amounts.<br />
c) personnel related provisions<br />
the assessment of provisions and pension liabilities is, by definition, subject to uncertainties regarding future<br />
cash flows. it requires making assumptions and determining parameters, whose adequacy will only become<br />
clear in the future. we refer to comments made under notes 5.13 and 5.14, which also include the relevant<br />
carrying amounts.<br />
2.3 Principles of consolidation<br />
General<br />
the consolidated financial statements of inteRRoll HolDinG ltD. include the parent company’s financial<br />
statements and the financial statements of all directly or indirectly held Swiss and foreign subsidiaries where<br />
the parent company holds more than 50 % of the voting rights or effectively exercises control through other<br />
means.<br />
the full consolidation method is applied, whereby the assets, liabilities, income and expenses are fully incorporated.<br />
the proportion of the net assets and net income attributable to minority shareholders is presented<br />
separately as minority interest in the consolidated statement of financial position and the consolidated statement<br />
of comprehensive income.<br />
accounts payable to, accounts receivable from, income and expenses between the companies included in the<br />
scope of consolidation are eliminated. intercompany profits included at year end in inventories of goods produced<br />
within the Group are also eliminated. transactions between subsidiaries are generally conducted at<br />
arm’s length.<br />
Subsidiaries acquired during the year are included in the consolidated financial statements from the date on<br />
which control is obtained, while subsidiaries sold are excluded from the consolidated financial statements from<br />
the date on which control is given up. acquisitions are accounted for by application of the purchase Method<br />
of accounting. the cost of a business combination includes the purchase price and any costs directly attribut-
Financial RepoRt<br />
noteS to tHe Financial StateMentS<br />
able to the business combination. the acquired net assets, including identifiable intangible assets and contin-<br />
gent liabilities, are recognised at fair value at the time of first-time consolidation. any goodwill is classified under<br />
intangible assets and is subject to a yearly impairment test.<br />
investments in associates are investments where the parent company is either, directly or indirectly, entitled to<br />
20 % to 50 % of the voting rights or has considerable influence through other means. investments in associates<br />
are accounted for by applying the equity Method. Under this method, the investment is initially recorded at the<br />
purchase price and subsequently increased or decreased by the share of the associate’s profits or losses incurred<br />
after the acquisition, adjusted for any impairment losses. the Group’s share of results of associates is<br />
recognised in the statement of comprehensive income under share of profit and loss of associates. Goodwill<br />
included in the purchase price, representing any excess of consideration over the Group’s share in net assets<br />
of the associate, is recognised as part of the investment’s carrying amount. Dividends received during the year<br />
reduce the carrying amount of such investments.<br />
investments of less than 20 % and certain insignificant subsidiaries are not consolidated but stated at their<br />
estimated fair value. Such investments are presented in the consolidated statement of financial position under<br />
financial assets. any fair value adjustments are recognised in retained earnings and are recycled in the statement<br />
of comprehensive income only at the date of disposal or when impairment arises.<br />
the accounting policies applied are consistent with those used in the consolidated financial statements for the<br />
year ended December 31, 2008.<br />
Foreign currency translation<br />
the consolidated financial statements are presented in Swiss Francs (cHF). all assets and liabilities of the<br />
consolidated foreign subsidiaries are translated using the exchange rates prevailing at the closing date. income,<br />
expenses and cash flows are translated at the average exchange rates for the year under review. the<br />
foreign currency translation differences resulting from applying different translation rates to the statement of<br />
financial position and the statement of comprehensive income, those resulting from the translation of the subsidiaries’<br />
opening net asset values at year end rates and those arising from long term intercompany loans are<br />
added to or deducted from retained earnings (net investment approach).<br />
transactions in foreign currencies are recorded using exchange rates prevailing at the time of the transaction.<br />
Gains or losses arising on settlement of these transactions are included in the statement of comprehensive<br />
income. Monetary assets and liabilities denominated in foreign currencies are translated using the exchange<br />
rates prevailing at the closing date. any gains or losses resulting from this translation are also included in the<br />
statement of comprehensive income.<br />
the following most important exchange rates were used for the translation of financial statements denominated<br />
in foreign currencies:<br />
aveRaGe RateS YeaR enD RateS<br />
<strong>2009</strong> 2008 31.12.<strong>2009</strong> 31.12.2008<br />
1 caD 0.954 1.012 0.982 0.870<br />
1 eUR 1.509 1.580 1.484 1.484<br />
1 USD 1.084 1.075 1.029 1.063<br />
1 GBp 1.695 1.977 1.664 1.552<br />
1 SGD 0.746 0.762 0.734 0.732<br />
1 cnY 0.159 0.155 0.151 0.156<br />
1 JpY 0.012 0.010 0.011 0.012<br />
1 tHB 0.032 0.032 0.031 0.031<br />
57
58<br />
Financial RepoRt<br />
noteS to tHe Financial StateMentS<br />
Current/Non-current distinction<br />
current assets are assets expected to be realised or consumed in the normal course of the Group’s operating<br />
cycle or assets held for trading purposes. all other assets are classified as non-current assets.<br />
current liabilities are liabilities expected to be settled by use of cash generated in the normal course of the<br />
Group’s operating cycle or liabilities due within one year from the reporting date. these also include short term<br />
borrowings made as part of credit limits granted for an indefinite period, but subject to a termination period of<br />
less than one year from reporting date. all other liabilities are classified as non-current liabilities.<br />
Derivative financial instruments (derivatives)<br />
Derivatives are stated at fair value. the method of recognizing gains or losses depends on the type of the<br />
underlying transaction. the Group designates certain transactions with derivatives as either (i) hedges of the<br />
fair value of recognised assets or liabilities or a firm commitment at market value (fair value hedges); or (ii)<br />
hedges of probable future financial transactions (cash flow hedges). the Group documents at the inception of<br />
the transaction the relationship between hedging instruments and hedged items within the context of its risk<br />
management objective and strategy. the Group also documents its assessment of the effectiveness of the<br />
derivatives at acquisition and during its term that are related to hedging transactions.<br />
the fair value of various derivatives is disclosed in note 5.7. changes in fair value are recognised as follows:<br />
(i) Fair value hedges<br />
changes in the fair value of derivatives designated and qualified as fair value hedges are recorded in the<br />
statement of comprehensive income, together with any changes in the fair value of the hedged assets or<br />
liabilities.<br />
(ii) cash flow hedges<br />
changes in fair value of derivatives designated and qualified as cash flow hedges are recognised in equity.<br />
amounts accumulated in equity are recycled to the statement of comprehensive income in the periods<br />
when the hedged item will affect profit or loss. when a hedging instrument expires or is sold, or when a<br />
hedge no longer meets the criteria for hedge accounting, any cumulative gain or loss existing in equity at<br />
that time remains in equity and is recognised when the initial transaction is ultimately recognized in the<br />
statement of comprehensive income. when a forecast transaction is no longer expected to occur, the<br />
cumulative gain or loss that was reported in equity is immediately transferred to the statement of comprehensive<br />
income.<br />
(iii) certain derivatives do not qualify for hedge accounting. changes in the fair value of such hedging instruments<br />
are recognised immediately in the statement of comprehensive income.<br />
the fair value of derivatives traded in public markets is based on quoted market prices at the balance sheet<br />
date. the quoted market price used for financial assets is the current bid price; the appropriate quoted market<br />
price for financial liabilities is the current ask price. the fair value of derivatives which are not traded publicly (for<br />
example, over-the-counter derivatives) is determined by a valuation provided by the financial institution from<br />
whom the derivative has been acquired.
2.4 Principles of valuation<br />
Financial RepoRt<br />
noteS to tHe Financial StateMentS<br />
Cash and cash equivalents/statement of cash flows<br />
cash and cash equivalents include cash on hand, postal and bank accounts, as well as credit balances payable<br />
on demand and deposits with an original maturity of not more than 90 days. these balances are stated<br />
at nominal value.<br />
the statement of cash flows presents, net of any foreign exchange rate effects, cash flows during the year<br />
classified by operating, investing and financing activities, thereby providing information about the changes of<br />
cash and cash equivalents during the reporting period. cash equivalents are held for the purpose of meeting<br />
the Group’s short term cash commitments rather than for investment or any other purposes.<br />
net cash from operating activities is determined using the indirect method, whereby the net profit for the year<br />
is adjusted for:<br />
• effects of transactions of non-cash nature;<br />
• deferrals or accruals of past or future operating cash receipts or payments; and<br />
• items of income or expense associated with investing or financing cash flows.<br />
the effect of exchange rate changes on cash and cash equivalents in foreign currencies is presented separately.<br />
Trade and other accounts receivable<br />
trade and other accounts receivable are stated at amortised cost, generally equalling nominal value less any<br />
valuation adjustments for bad debts. the valuation adjustments include individual impairment for specifically<br />
identified positions, where indication exists that the outstanding amount might not be fully recovered.<br />
lump sum impairment covers expected losses that cannot be excluded based on historical data and payment<br />
statistics. as soon as sufficient evidence is available that the receivable will definitively not be recovered, the<br />
related amount is directly written off and offset with the specific individual impairment respectively.<br />
Marketable securities<br />
Marketable securities are stated at their fair value as of balance sheet date. Unrealised gains and losses are<br />
included in the financial result.<br />
Inventories<br />
inventories are stated at the lower of cost (purchase price or Group production cost) and net realisable value.<br />
the cost of inventories is calculated using the weighted average method. production overheads are allocated<br />
to inventories on a proportional basis. Slow moving goods and obsolete stocks are written down. intercompany<br />
profits included in inventories are eliminated from net income.<br />
59
60<br />
Financial RepoRt<br />
noteS to tHe Financial StateMentS<br />
Property, plant and equipment<br />
property, plant and equipment are stated at cost less accumulated depreciation and any impairment losses.<br />
assets acquired by way of finance leases are recognised at the lower of the present value of future minimum<br />
lease payments and fair value, and depreciated accordingly. the related leasing liabilities are presented at their<br />
present value.<br />
assets under construction are capitalised based on incurred costs. Depreciation is recognised when the construction<br />
can be used. interests directly related to the acquisition or construction of property, plant and equipment,<br />
is capitalised and allocated to the related asset.<br />
Depreciation is recognised on a straight-line basis over the estimated useful life and considering a potential<br />
residual value. the following useful economic life terms apply to the main asset categories:<br />
Buildings 25 years<br />
Machinery 10 years<br />
vehicles 5 years<br />
office machines and furniture 5 years<br />
tools and moulds 5 years<br />
it 3 years<br />
components of major investments in fixed assets with different estimated useful lives are recognised separately<br />
and depreciated accordingly. estimated useful lives and estimated residual values are revised on a<br />
yearly basis as per reporting date and resulting adjustments are recorded in the statement of comprehensive<br />
income.<br />
Intangible assets<br />
intangible assets include goodwill, intangible assets purchased in the course of business combinations (patented<br />
and unpatented technology, customer relationships), licences and patents and similar rights acquired<br />
from third parties as well as software acquired from third parties. these assets are stated at cost and, if their<br />
useful life can be reliably estimated, amortised on a straight-line basis over their useful life which ranges from<br />
3 to 10 years. Goodwill and intangible assets with an indefinite useful life are allocated to specific cash generating<br />
units in order to allow the identification of possible impairment. Such impairment tests are carried out on<br />
a yearly basis and any impairment is recognised in the statement of comprehensive income. Goodwill arising<br />
from the acquisition of a foreign entity is attributed to that entity’s net assets and reported in the reporting currency<br />
of that entity being translated to the Group’s reporting currency at the year end rate.<br />
Financial assets<br />
Financial assets mainly comprise loans receivable that are stated at amortised cost less any valuation allowance.<br />
the recognition of interest income is based on the effective interest rate method. Moreover this item<br />
includes investments of less than 20 percent. they are not consolidated but stated at their estimated fair value.<br />
any fair value adjustments are recognised in retained earnings and are recycled in the statement of comprehensive<br />
income only at the date of disposal or when impairment arises.<br />
Impairment<br />
the recoverability of non-current assets is reviewed at least on an annual basis. if there is any indication of an<br />
impairment, the recoverable amount is determined based on an impairment test. an impairment loss is recognised<br />
in the statement of comprehensive income if an asset’s carrying amount exceeds its recoverable amount.<br />
Goodwill and intangible assets with an indefinite useful life, and therefore not subject to amortisation, are<br />
tested on impairment on a yearly basis.
Financial RepoRt<br />
noteS to tHe Financial StateMentS<br />
Fixed assets held for sale<br />
tangible assets or a group of assets are classified as “assets held for sale” if their carrying value will most<br />
probably be realised in a divestment transaction rather than by being used in the normal course of business.<br />
Such assets are brought actively onto market and should be sold within one year. Fixed assets held for sale<br />
are presented at the recoverable amount, which is the lower of book value or fair value less costs to sell.<br />
Trade accounts payable and other current liabilities<br />
trade accounts payable and other current liabilities are stated at amortised cost, generally equalling nominal<br />
value. other current liabilities include mainly advances received from customers and vat payable.<br />
Financial liabilities<br />
Financial liabilities consist of loans payable and overdrafts and are stated at amortised cost. the recognition of<br />
interest expenses is based on the effective interest rate method.<br />
Provisions<br />
provisions relate to work and services yet to be performed, warranties, social security costs, impending losses<br />
and other present obligations whose amount and timing is uncertain. they are recognised upon a probable<br />
obligation due to past events which will result in a future economic charge. the amounts recognised represent<br />
management’s best estimate of the expenditure that will be required to settle the obligation. providing the effect<br />
is material, long term provisions are discounted.<br />
Shareholders’ equity<br />
Shareholders’ equity is categorised as following:<br />
a) Share capital<br />
the share capital contains the fully paid in registered shares.<br />
b) Share premium<br />
Share premium comprises payments from shareholders that exceed the par value as well as realised gains/<br />
losses including tax on transactions with own shares.<br />
c) Reserve for own shares<br />
the acquisition price of own shares is disclosed as a reduction of shareholders` equity. Realised gains and<br />
losses on own shares are recognised in share premium. compensation and cash inflows resulting from the<br />
issue and subsequent possible exercise of share options are credited to share premium.<br />
d) translation reserve<br />
at the closing date, foreign currency items are translated at a consistant Group wide rate. currency translation<br />
differences on group internal investments as well as Group internal loans characterised as equity are<br />
reported separately in the “translation reserves”. the change of the translation reserve is disclosed in other<br />
comprehensive income.<br />
e) Hedge Reserve<br />
change of cash flow hedges is disclosed separately as realised or non realised gains/losses in the hedge<br />
reserve.<br />
f) Dividends/reduction of par value<br />
Dividends or reduction of par value are charged to equity in the period in which the approval by the shareholders`<br />
general assembly has taken place.<br />
61
62<br />
Financial RepoRt<br />
noteS to tHe Financial StateMentS<br />
Revenue recognition<br />
Revenue is generally recognised upon delivery or, depending on the size and the complexity of the order, when<br />
technically approved by the customer. For production orders in the sense of iaS 11, the poc (percentage of<br />
completion) method is applied, if revenue, total costs of the project and percent of completion can be reliably<br />
measured and the contractual benefit is likely to be realised. the Group establishes appropriate warranty<br />
provisions relating to provisioned services in order to cover expected claims.<br />
Revenue from services<br />
interroll performs services to third parties in connection with administrative tasks and it support. the revenue<br />
resulting from these services is recognised in the statement of comprehensive income as other operating income.<br />
Material expenses<br />
Material expenses include all costs of raw materials and consumables used, goods purchased and third-party<br />
manufacturing, processing or conversion of the Group’s products (services purchased).<br />
Research and development<br />
expenditure on research and development is only capitalised when the recognition criteria of iaS 38 are met.<br />
expenses for research and development include wages and salaries, material costs, depreciation of technical<br />
equipment and machinery dedicated to research and development, as well as proportional overhead costs.<br />
Such expenses are included in the respective line item of the statement of comprehensive income.<br />
Intercompany transactions<br />
Group internal transactions across segments as well as across legal units are performed at arm’s length.<br />
Retirement benefits<br />
the Group sponsors pension plans according to the national regulations of the countries in which it operates.<br />
all significant pension plans are operated through pension funds that are legally independent from the Group.<br />
Generally, they are funded by employees’ and employers’ contributions. the foreign pension schemes are<br />
normally defined contribution plans whereby the pension expense for a period equals the companies’ contributions<br />
during that period. the Swiss and French pension schemes have certain characteristics of a defined<br />
benefit plan; the financial impact of this plan on the consolidated financial statements is determined based on<br />
the projected Unit credit Method.<br />
actuarial gains and losses arising from the periodical reassessments of defined benefit plans are recognised<br />
to the extent that they exceed 10 % of the higher of the present value of the defined benefit obligation and the<br />
fair value of plan assets. the amount exceeding this “corridor” is amortised over the expected average remaining<br />
duration of employment of the employees participating in the plan.<br />
Employee participation plans<br />
certain employees participate in equity based compensation plans of inteRRoll HolDinG ltD. all equity<br />
based compensation granted to these employees is valued at fair value at grant date and recognised as personnel<br />
expense over the period until vesting date. the fair value is calculated on the basis of the Binomial<br />
method. Discounts granted to beneficiaries on the unconditional purchase of interroll shares are recognised in<br />
the statement of comprehensive income at grant date. cash inflows resulting from equity based participation<br />
plans are recognised as an increase of equity. cash compensated participation plans are recognised as other<br />
liabilities and are valued at fair value at balance sheet date.
Financial RepoRt<br />
noteS to tHe Financial StateMentS<br />
Operating lease expenses<br />
property, plant and equipment that are held under operating leases are not recognised on the statement of<br />
financial position. the operating lease expense is recognised in the statement of comprehensive income on a<br />
straight-line basis over the lease contract period. operating lease obligations depending on revenues are estimated<br />
and accrued as they become due.<br />
Financial result<br />
interest expenses on loans and finance lease liabilities are recognised as financial expenses, whereas interest<br />
income on financial assets is recognised in financial income, both on an accrual basis. Moreover the financial<br />
result includes foreign exchange gains and losses arising from the translation of items of the statement of financial<br />
position and transactions in foreign currencies as well as changes in fair value of financial instruments.<br />
Income taxes<br />
current income taxes are calculated on the statutory results of the Group companies at the enacted or substantively<br />
enacted tax rate. they also include adjustment charges and credit notes issued on previous years’<br />
results.<br />
Deferred taxes are generally recognised on any temporary difference between the carrying amount of an asset<br />
or a liability and its tax base (Balance Sheet liability Method). changes in deferred taxes are generally presented<br />
as income tax expense, unless they relate to temporary differences that arose through direct recognition<br />
in equity or through business combinations.<br />
Deferred taxes are calculated using local enacted or substantively enacted tax rates. the future benefits of tax<br />
loss carry-forwards are recognised as an asset if it is probable that future taxable profits will be available to<br />
realise such benefits.<br />
Segment information<br />
the management structure of the interroll Group is governed by organizational regulations. all strategic and<br />
major operational decisions lie within the competence of the Board of Directors who also decides on the allocation<br />
of financial resources. the interroll Group is managed through two organisational segments which<br />
primarily are defined through their products and their sales and distribution channels.<br />
a) components<br />
the segment “components” develops, produces and sells rollers, roller drives and drum motors combining<br />
these components to become a solution for its customers and uniquely sells to oeMs. the production process<br />
is optimized for a large number of orders and follows the principle of mass production.<br />
b) Subsystems<br />
the segment “Subsystems” develops, produces and sells flow storage modules for heavy and light duty<br />
applications as well as modules for the internal unit load handling logistic such as belt curves, sorters and<br />
roller-/belt conveyors. customers are on one hand oeMs and on the other hand especially system integrators<br />
and end users. the production process consists on one hand of module production and on the other<br />
hand of modules engineered/assembled to subsystems.<br />
the major assessment drivers are the eBitDa/eBit and the yield on the net invested assets (Rona). in view<br />
of the centralized financing by Group treasury no financial expenses are allocated to segments. Further-more<br />
the legal structure clearly deviates from the management structure which is the reason for non-allocation of<br />
income taxes to the segments.<br />
63
64<br />
Financial RepoRt<br />
noteS to tHe Financial StateMentS<br />
2.5 Financial risk management<br />
General<br />
the Group’s activities expose it to a variety of financial risks: market risk (currency risk, interest rate risk and<br />
price risk), credit risk, liquidity risk and cash flow risk. the Group’s risk management program focuses on the<br />
unpredictability of financial markets and seeks to minimize potential adverse effects on Group’s financial performance.<br />
the Board of Directors has the supreme responsibility for risk management. the Board of Directors appoints<br />
thereto the audit committee, who is responsible for the development and the supervision of the risk manage-<br />
ment principles. the audit committee reports regularly to the Board of Directors.<br />
the principles established for risk management are geared to identify and analyze those risks that may impact<br />
the Group, to define adequate limits and to perform controls over the risks and their adherence to. the risk<br />
management principles and the related procedures are regularly verified in order to consider changing market<br />
conditions and operations of the Group. the target is to develop management regulations and management<br />
processes and a disciplined and constructive control environment through existing training and guidelines<br />
ensuring a disciplined and conscious handling of risks.<br />
the audit committee supervises management in the control of compliance with principles and processes.<br />
their adequacy is permanently verified in respect of the risks that the Group is exposed to. the audit commit-<br />
tee is supported in this respect by the internal audit department. Financial risk management is carried out by<br />
the central treasury department. Group treasury identifies, evaluates and hedges financial risks in close cooperation<br />
with the Group’s operating units and reports at regular intervals to the audit committee.<br />
the following sections provide a summary of the scope of individual risks and on the targets, principles and<br />
processes implemented for measuring, monitoring and hedging financial risks. additional information on the<br />
financial risks is included in the other notes to the consolidated financial statements.<br />
Market Risk<br />
Market risks to which the interroll Group is exposed to can be summarised into the following three main risk<br />
categories:<br />
a) Foreign exchange risk<br />
the Group operates internationally and is exposed to foreign exchange risk arising from various currencies.<br />
Foreign exchange risks arise from future commercial transactions and from recognised assets and liabilities.<br />
to manage its foreign exchange risk arising from future commercial transactions and recognised assets and<br />
liabilities, the Group operates an internal monthly “netting” process. net exposure is partially hedged using<br />
forward currency contracts. Such contracts are entered into only with high-credit-quality financial institutions.<br />
b) interest rate risk<br />
the Group has long term loans with fixed interest rates. the related interest risks have no significant impact<br />
on the Group’s income and operating cash flows. Borrowings issued at variable rates expose the Group to<br />
volatility. Borrowings issued at fixed rates expose the Group to changes in their net present value. the<br />
Group manages its interest rate risk by entering into interest rate swaps to partially hedge its exposure<br />
c) price risk<br />
the Group is exposed to price risk. Such risk is generally not hedged.
Financial RepoRt<br />
noteS to tHe Financial StateMentS<br />
Credit Risk<br />
the risk of default is the risk to incur a financial loss when a customer or a counterparty to a financial instrument<br />
does not fulfill its legal obligation. the default risk at interroll exists on trade and other accounts receivable and<br />
on cash and cash equivalents.<br />
customers exceeding eUR 5 000 credit limit are verified for their creditworthiness before the order is executed.<br />
the creditworthiness verification is also based on the credit information database provided by an international<br />
service provider leading in this sector. their software allows determining a credit limit per single customer,<br />
based on specifically determined calculation formulas. the calculation formulas have been defined by the interroll<br />
Group.<br />
accumulation of credit risks in trade and other accounts receivable is limited due to numerous customers and<br />
their worldwide location. the extent of credit risks is mainly determined by the individual characteristics of each<br />
single customer. the risk evaluation includes an assessment of the creditworthiness by considering the customer’s<br />
financial situation, its credit history and other factors. Sales and revenue from services are performed<br />
only with customers whose credit worthiness is proved through the above process. a credit limit is defined for<br />
each customer. these limits are verified at least once a year.<br />
interroll invests its funds in short term deposits at a multitude of banks with whom long standing relationships<br />
exist. Such deposits have a maturity date shorter than twelve months. likewise transactions with derivative<br />
financial instruments are entered into only with major financial institutions. interroll does not hold material open<br />
positions with these institutions.<br />
the maximum credit risk from financial instruments corresponds to the balance sheet amount of each single<br />
financial asset. there are no guarantees or other liabilities that could increase the risk over the corresponding<br />
amount in the statement of financial position.<br />
Liquidity Risk<br />
liquidity risk is the risk that the Group cannot fulfil its financial obligations on time.<br />
prudent liquidity risk management implies maintaining sufficient cash and marketable securities, the availability<br />
of funding through an adequate amount of committed credit facilities and the ability to close market positions<br />
at any time. Due to the dynamic nature of the underlying business, Group treasury aims to ensure funding<br />
by keeping committed credit limits available.<br />
65
66<br />
Financial RepoRt<br />
noteS to tHe Financial StateMentS<br />
3 CHANGES TO THE SCOPE OF CONSOLIDATION<br />
The following changes in the scope of consolidation have taken place during the year under review:<br />
1) interroll Dynamic Storage inc., Hiram/atlanta/USa 100 %<br />
as per 5 February <strong>2009</strong> assets valued at cHF 2.7 millions have been acquired from “BMw Metal Fabrication<br />
inc. and acF partners inc”. assets and personnel have been transferred thereafter to the newly founded<br />
company “interroll Dynamic Storage inc.” located in Hiram close to atlanta/USa. cHF 2.4 millions of the total<br />
acquisition price have been settled shortly after closing by cash. the remaining portion of the acquisition<br />
price of cHF 0.3 million has been settled against transfer of 921 interroll registered shares from the com-<br />
pany’s own shares held. the new company manufactures and sells modules for storage systems and thus<br />
is fully allocated to the segment “subsystems”.<br />
2) assets acquired from Maxwell Manufacturing company inc., St. louis/USa<br />
Furthermore on 22 april <strong>2009</strong> interroll components canada ltd. acquired assets from Maxwell Manufacturing<br />
company located in St. louis/USa valued at cHF 0.8 million. the acquisition results in an increase of<br />
the value-added chain in connection with the manufacturing of checkout motors and is thus fully allocated<br />
to the segment “components”. the acquisition value has been settled shortly after closing by cash.<br />
the goodwill of each acquisition reflects improved competitive advantages and synergy effects.<br />
In the previous year, the following changes in the scope of consolidation took place:<br />
1) interroll australia pty. ltd. Dandenong, South australia 100 %<br />
in the previous year, a share purchase agreement was signed to acquire 49 % of the shares of Sipa Roller<br />
australia pty. ltd. Melbourne/australia. the interroll Group had already held for years 51 % of the shares of<br />
this entity. those shares had no voting- and dividend rights and were classified under financial assets. with<br />
the acquisition of the remaining shares with voting and dividend rights as of January 1st 2008, this company<br />
was added to the scope of consolidation. Sipa Roller australia pty. ltd. exclusively operates in engineering<br />
and distributing dynamic storage systems and thus is fully allocated to the “Subsystems” segment.<br />
the acquisition price amounted to cHF 0.7 million of which cHF 0.6 million have been paid shortly after<br />
closing. the amount has been settled from cash. the remaining amount was paid in early <strong>2009</strong>. the transaction<br />
costs were immaterial.<br />
2) interroll logistica ltda, pindamonhangaba, São paolo, Brazil 100 %<br />
on January 22, 2008, interroll logistica located close to São paolo/Brazil started its activities. the company<br />
is a wholly owned subsidiary of the interroll Group. the company acquired net assets from the previous<br />
franchisee for an amount of cHF 0.5 million. the amount was settled in cash shortly after the acquisition<br />
date.the company specializes in the engineering, manufacturing and sale of products for both segments<br />
and is allocated onto the segments accordingly.
Financial RepoRt<br />
noteS to tHe Financial StateMentS<br />
the following assets and liabilities in the years under review were acquired resp. settled within the frame of acquiring participations:<br />
in thousands cHF<br />
caRRYinG<br />
aMoUnt<br />
BeFoRe aDJ.<br />
FaiR valUe<br />
aDJUStMent<br />
FAIR vALUE<br />
<strong>2009</strong> 2008<br />
caRRYinG<br />
aMoUnt<br />
BeFoRe aDJ.<br />
FaiR valUe<br />
aDJUStMent<br />
FAIR vALUE<br />
property, plant and equipment 1 613 1 613 158 158<br />
intangible assets 1 122 159 1 281 6 386 392<br />
Total non-current assets 2 735 159 2 894 164 386 550<br />
inventory 91 91 726 726<br />
trade and other accounts receivable – – 1 388 1 388<br />
cash and cash equivalents – – 84 84<br />
Total current assets 91 – 91 2 198 – 2 198<br />
Total assets 2 826 159 2 985 2 362 386 2 748<br />
trade and other accounts payable – – 1 308 1 308<br />
current tax liabilities – – 22 22<br />
Deferred tax liabilities – 159 159 – 116 116<br />
Total liabilities – 159 159 1 330 116 1 446<br />
Total net assets acquired 2 826 – 2 826 1 032 270 1 302<br />
Goodwill acquired 615 –<br />
Total acquisitions 3 441 1 302<br />
Settled by cash and cash equivalents – 3 179 – 1 100<br />
Settled by equity instruments – 262 –<br />
Settled in previous periods – – 51<br />
liability for deferred payment – – 151<br />
Total acquisition costs – 3 441 – 1 302<br />
Cash flow from Acquisitions<br />
Settled by cash and cash equivalents – 3 179 – 1 100<br />
acquired cash and cash equivalents<br />
Settlement of outstanding acquisition<br />
– 84<br />
price from previous years – 1 467 – 1 124<br />
Net cash used in acquisitions – 4 646 – 2 140<br />
acquired intangible assets relate to customer value of cHF 0.3 million (2008: cHF 0.4 million), technical know-how of cHF 0.2 million<br />
(2008: 0) and a compensation for a non-competition clause for a selling party of cHF 0.8 million (2008: 0).<br />
the acquired participation and net assets contribute approximately cHF 1.2 million to net sales. their respective profit has no major<br />
impact on the Group’s consolidated result. consolidated net sales and result would not have been materially different if the business<br />
was acquired at January 1 st , <strong>2009</strong>. the acquisitions of the previous year increased net sales by cHF 1.5 million whereas the result<br />
contribution was insignificant.<br />
67
68<br />
Financial RepoRt<br />
noteS to tHe Financial StateMentS<br />
4 SEGMENT INFORMATION<br />
Revenues and tangible assets as per operational segment<br />
coMponentS SUBSYSteMS<br />
in thousands cHF <strong>2009</strong> 2008 <strong>2009</strong> 2008<br />
net sales with third party 157 917 98.8 % 223 702 99.7 % 76 070 97.5 % 134 218 97.2 %<br />
net sales with other segments 1 914 1.2 % 569 0.3 % 1 936 2.5 % 3 828 2.8 %<br />
Net sales segment 159 831 100.0 % 224 271 100.0 % 78 006 100.0 % 138 046 100.0 %<br />
Material expenses – 60 606 – 37.9 % – 90 839 – 40.5 % – 41 993 – 53.8 % – 60 939 – 44.1 %<br />
personnel expenses – 53 009 – 33.2 % – 60 419 – 26.9 % – 28 513 – 36.6 % – 34 822 – 25.2 %<br />
change in wip/FG – 959 – 0.6 % – 1 522 – 0.7 % 5 580 7.2 % – 7 511 – 5.4 %<br />
other operating expenses – 32 360 – 20.2 % – 39 807 – 17.7 % – 16 005 – 20.5 % – 21 731 – 15.7 %<br />
other operating income 6 716 4.2 % 8 823 3.9 % 2 140 2.7 % 4 663 3.4 %<br />
EBITDA 19 613 12.3 % 40 507 18.1 % – 785 – 1.0 % 17 706 12.8 %<br />
Depreciation – 7 725 – 4.8 % – 7 179 – 3.2 % – 3 131 – 4.0 % – 2 861 – 2.1 %<br />
impairment of ppe – – – 143 – 0.1 % – – – –<br />
EBITA 11 888 7.4 % 33 185 14.8 % – 3 916 – 5.0 % 14 845 10.8 %<br />
amortisation – 4 456 – 2.8 % – 4 436 – 2.0 % – 414 – 0.5 % – 223 – 0.2 %<br />
EBIT 7 432 4.6 % 28 749 12.8 % – 4 330 – 5.6 % 14 622 10.6 %<br />
Rona** 5.0 % 18.5 % – 9.8 % 36.9 %<br />
total assets* 145 173 154 295 60 405 59 975<br />
total liabilities* 22 991 29 619 30 464 24 709<br />
investments*** 13 173 16 864 9 686 5 520<br />
average number of employees 770 814 436 501<br />
Research and development 7 277 5 501 1 311 1 432<br />
* the “reconciliation to Group figures” results from the fact that cash and cash equivalents, prepaid and deferred taxes as well as non-current financial assets resp. liabilities<br />
are not allocated to the segments.<br />
** “Rona” is calculated as the percentage of eBit less tax calculated at the expected tax rate, divided by average net assets.<br />
*** investments are related to property, plant and equipment as well as to intangible assets.
TOTAL SEGMENTS<br />
Reconciliation to<br />
GRoUp FiGUReS<br />
Financial RepoRt<br />
noteS to tHe Financial StateMentS<br />
TOTAL GROUP<br />
<strong>2009</strong> 2008 <strong>2009</strong> 2008 <strong>2009</strong> 2008<br />
233 987 357 920 233 987 357 920<br />
3 850 4 397 – 3 850 – 4 397 – –<br />
237 837 362 317 – 3 850 – 4 397 233 987 357 920<br />
– 102 599 – 151 778 3 850 4 397 – 98 749 – 147 381<br />
– 81 522 – 95 241 – 81 522 – 95 241<br />
4 621 – 9 033 4 621 – 9 033<br />
– 48 365 – 61 538 236 – 48 129 – 61 538<br />
8 856 13 486 – 236 8 620 13 486<br />
18 828 58 213 – – 18 828 58 213<br />
– 10 856 – 10 040 – 10 856 – 10 040<br />
– – 143 – – 143<br />
7 972 48 030 – – 7 972 48 030<br />
– 4 870 – 4 659 – 4 870 – 4 659<br />
3 102 43 371 – – 3 102 43 371<br />
1.6 % 22.3 %<br />
205 578 214 270 10 115 22 493 215 693 236 763<br />
53 455 54 328 29 214 51 704 82 669 106 032<br />
22 859 22 384 22 859 22 384<br />
1 206 1 315 1 206 1 315<br />
8 588 6 933 8 588 6 933<br />
69
70<br />
Financial RepoRt<br />
noteS to tHe Financial StateMentS<br />
Net sales with third parties and fixed assets as per geographical location<br />
net SaleS witH tHiRD paRtieS aSSetS*<br />
in thousands cHF <strong>2009</strong> in % 2008 in % <strong>2009</strong> in % 2008 in %<br />
central europe 30 247 12.9 47 294 13.2 – – – –<br />
western europe 24 198 10.3 33 912 9.5 2 368 1.9 2 786 2.4<br />
north europe 21 437 9.2 35 644 10.0 8 647 6.9 11 021 9.5<br />
east europe and Middle east 14 257 6.1 31 317 8.7 149 0.1 195 0.2<br />
africa 3 759 1.6 7 722 2.2 198 0.2 198 0.2<br />
Germany 47 613 20.3 78 993 22.1 59 488 47.6 56 126 48.4<br />
France 19 468 8.3 24 568 6.9 11 799 9.4 12 547 10.8<br />
Switzerland 3 856 1.6 5 473 1.5 26 670 21.3 19 911 17.2<br />
Total Europe 164 835 70.4 264 923 74.0 109 319 87.4 102 784 88.6<br />
USa 38 793 16.6 47 227 13.2 9 432 7.5 8 975 7.7<br />
other america 7 867 3.4 14 928 4.2 3 058 2.4 2 007 1.7<br />
South america 1 959 0.8 2 552 0.7 342 0.3 257 0.2<br />
Total America 48 619 20.8 64 707 18.1 12 832 10.3 11 239 9.7<br />
east asia 8 876 3.8 12 291 3.4 1 272 1.0 1 184 1.0<br />
South east asia 8 502 3.6 10 747 3.0 1 407 1.1 535 0.5<br />
South asia incl. australia 3 155 1.3 5 252 1.5 274 0.2 248 0.2<br />
Total Asia 20 533 8.8 28 290 7.9 2 953 2.4 1 967 1.7<br />
Total Group 233 987 100.0 357 920 100.0 125 104 100.0 115 990 100.0<br />
* assets are disclosed excluding financial assets and deferred tax assets.<br />
the grouping of the geographical split into regions/group of countries was performed as following:<br />
central europe austria, Benelux-countries, italy<br />
western europe Great Britain, Spain, portugal<br />
north europe Denmark, Finland, Sweden, norway, iceland<br />
eastern europe and Middle east poland, czech Republic, Baltic countries, ex-Yugoslavian countries, Greece<br />
africa particularly South africa<br />
Germany<br />
France<br />
Switzerland<br />
USa<br />
other america canada, Mexico, central america<br />
South america Brazil, argentina, chile<br />
east asia china, Japan, Korea<br />
South east asia Singapore, thailand<br />
South asia incl. australia australia, india<br />
the key definition of turnover has been defined according to the invoice address. Switzerland is the country of domicile of inteRRoll<br />
HolDinG ltD.<br />
Material turnover with specific customers<br />
turnover is realized with approx. 23 000 customers. no customer achieves a turnover of more than 5 % of group sales.
5 Notes to the coNsolidated statemeNt of fiNaNcial positioN<br />
5.1 movements of property, plant and equipment<br />
land and Building<br />
pRoduction<br />
equipment and<br />
machineRy<br />
oFFice equipment<br />
and motoR<br />
vehicles<br />
Financial RepoRt<br />
notes to the Financial statements<br />
assets undeR<br />
constRuction<br />
total<br />
property, plaNt<br />
aNd equipmeNt<br />
in thousands chF <strong>2009</strong> 2008 <strong>2009</strong> 2008 <strong>2009</strong> 2008 <strong>2009</strong> 2008 <strong>2009</strong> 2008<br />
cost<br />
at 1.1. 62 539 67 215 85 047 82 575 10 223 10 450 5 024 4 248 162 833 164 488<br />
currency translation adj. – 461 – 6 099 – 56 – 7 012 59 – 1 015 32 – 554 – 426 – 14 680<br />
additions 1 767 5 157 11 220 11 403 721 2 061 2 784 1 330 16 492 19 951<br />
disposals – 433 – 340 – 5 380 – 2 070 – 798 – 1 280 – – – 6 611 – 3 690<br />
Reclassifications<br />
changes in scope of<br />
5 617 – 3 394 44 – – 44 – – 4 461 – 1 156 – 3 394<br />
consolidation** 929 – 661 151 23 7 – – 1 613 158<br />
at 31.12. 69 958 62 539 91 536 85 047 10 184 10 223 3 379 5 024 175 057 162 833<br />
depreciation &<br />
impairments, cumulated<br />
at 1.1. – 20 240 – 22 167 – 55 969 – 55 990 – 6 761 – 7 050 – 82 970 – 85 207<br />
currency translation adj. 178 2 037 156 4 438 – 15 633 319 7 108<br />
depreciation – 2 521 – 2 375 – 7 010 – 6 270 – 1 325 – 1 395 – 10 856 – 10 040<br />
impairment losses – – – – 143 – – – – 143<br />
disposals 335 323 4 414 1 996 541 1 051 5 290 3 370<br />
Reclassifications – 1 261 1 942 – 22 – 22 – – 1 261 1 942<br />
at 31.12. – 23 509 – 20 240 – 58 431 – 55 969 – 7 538 – 6 761 – 89 478 – 82 970<br />
property, plant and<br />
equipment at 31.12. 46 449 42 299 33 105 29 078 2 646 3 462 3 379 5 024 85 579 79 863<br />
thereof finance leases* 1 318 1 395 497 2 285 11 27 1 826 3 707<br />
capital commitments 13 714 8 964 168 1 718 16 96 13 898 10 778<br />
insurance value*** 94 526 83 373 123 246 118 557 – – 217 772 201 930<br />
* in the year under review as well as in the previous year there were no additions not involving the movement of cash & cash equivalents.<br />
** detailed information on the changes in scope of consolidation is disclosed in note 3.<br />
*** the insurance value of production equipment and machinery also covers other tangible assets.<br />
in the previous year, the spanish subsidiary granted an option to a third party to buy its premises that were formerly used for production<br />
and which are not used anymore. the price for the option of chF 0.2 million will be taken into account upon exercise of the option.<br />
in the previous year, a building at the location in Wassenberg (germany) was put to sales and reclassified from fixed assets to<br />
assets held for sale. in the meantime, the building is used again for operational purposes by the local entity. the book value of chF<br />
0.4 million has therefore been reclassified back to fixed assets. in the current year, as a result of local restructuring in denmark, a<br />
building has been put to sale. the property with a book value of chF 0.5 million has been reclassified from fixed assets to assets held<br />
for sale.<br />
in the previous year, tools & equipment were impaired by chF 0.2 million. capital commitments in the year under review are related<br />
to the construction of the new centre of excellence for belt conveyors and curves, the finalization of the extension of the centre of<br />
excellence for Rollers and production equipment.<br />
71
72<br />
Financial RepoRt<br />
notes to the Financial statements<br />
5.2 movements of goodwill and intangible assets<br />
goodWill soFtWaRe<br />
patents,<br />
technology and<br />
licences<br />
customeR<br />
Relationship<br />
total<br />
iNtaNgible<br />
assets<br />
in thousands chF <strong>2009</strong> 2008 <strong>2009</strong> 2008 <strong>2009</strong> 2008 <strong>2009</strong> 2008 <strong>2009</strong> 2008<br />
cost<br />
at 1.1. 13 501 14 639 7 791 5 623 18 320 20 385 24 263 26 726 63 875 67 373<br />
currency translation adj. – 4 – 1 138 8 – 200 – 75 – 2 065 66 – 2 855 – 5 – 6 258<br />
additions – – 6 367 2 433 – – – – 6 367 2 433<br />
disposals<br />
changes in scope of<br />
– – – 2 027 – 65 – – – – – 2 027 – 65<br />
consolidation* 615 – 22 – 938 – 321 392 1 896 392<br />
at 31.12. 14 112 13 501 12 161 7 791 19 183 18 320 24 650 24 263 70 106 63 875<br />
amortisation &<br />
impairments, cumulated<br />
at 1.1. – 3 126 – 3 126 – 4 933 – 4 926 – 12 977 – 12 552 – 6 712 – 4 754 – 27 748 – 25 358<br />
currency translation adj. – – – 12 181 38 1 368 25 657 51 2 206<br />
amortisation – – – 403 – 251 – 1 921 – 1 793 – 2 546 – 2 615 – 4 870 – 4 659<br />
disposals – – 1 986 63 – – – – 1 986 63<br />
at 31.12. – 3 126 – 3 126 – 3 362 – 4 933 – 14 860 – 12 977 – 9 233 – 6 712 – 30 581 – 27 748<br />
total intangible assets<br />
net at 31.12. 10 986 10 375 8 799 2 858 4 323 5 343 15 417 17 551 39 525 36 127<br />
capital commitments – – 7 942 5 567 – – – – 7 942 5 567<br />
*detailed information on the changes in scope of consolidastion is disclosed in note 3.<br />
capital commitments in the year under review and those for the previous year are related to the investment of a new eRp system.
impairment test goodwill<br />
Financial RepoRt<br />
notes to the Financial statements<br />
goodwill is allocated to the following cash generating units that are equal to the operating segments:<br />
in thousands chF 31.12.<strong>2009</strong> 31.12.2008<br />
components 8 959 8 546<br />
subsystems 2 027 1 829<br />
total goodwill 10 986 10 375<br />
the impairment tests are generally based on a three year plan and on the present value of future (pre-tax) cash<br />
flows (value in use)determined using a discount rate of 9.7 % (previous year: 7.2 %). the growth rate and the<br />
discount rate were defined as key assumptions. no further growth rate was assumed for the extrapolation of<br />
free cash flows. the sensitivity analysis performed for both cash generating units resulted in the conclusion that<br />
the discounted value of future free cash flows exceeds their current goodwill position.<br />
goodwill increased following the acquisition of the assets of “BmW metal Fabrication inc. and acF partners<br />
inc.” as well as of the assets of “maxwell manufacturing company” and results from the difference between<br />
the assets valued at fair value and the purchase price. the change of the goodwill position in the previous<br />
year is only related to effects from currency translation adjustments.<br />
other intangible assets<br />
customer relationship is normally amortised on a straght line basis over 10 years. at 31.12.<strong>2009</strong>, an amortisation<br />
term of additional 6 years remains on the major portion of customer relationship. a review of the book<br />
values is performed annually whereas the actual reduction of the number of customers is measured against its<br />
expected useful lifetime.<br />
5.3 assets pledged or assigned<br />
in thousands chF 31.12.<strong>2009</strong> 31.12.2008<br />
land and buildings 2 911 2 988<br />
production equipment and machinery 497 2 285<br />
office equipment 11 22<br />
inventory 982 870<br />
trade receivables 337 781<br />
total assets pledged or assigned 4 738 6 946<br />
these assets are pledged respectively assigned to local credit lines granted (see note 5.11).<br />
73
74<br />
Financial RepoRt<br />
notes to the Financial statements<br />
5.4 inventory<br />
a detailed overview on the positions belonging to the inventory is as follows:<br />
in thousands chF 31.12.<strong>2009</strong> 31.12.2008<br />
Raw materials 24 837 32 225<br />
Work in progress 13 770 9 659<br />
Finished products 1 871 2 279<br />
advance payments 1 160 887<br />
valuation allowance – 2 386 – 3 291<br />
total inventory, net 39 252 41 759<br />
valuation allowance on inventory developed as follows:<br />
in thousands chF <strong>2009</strong> 2008<br />
balance as per 1.1. – 3 291 – 3 203<br />
currency translation adjustment – 20 312<br />
additions – 608 – 634<br />
Reductions 1 533 234<br />
total valuation allowance on inventory as per 31.12. – 2 386 – 3 291<br />
information on the carrying amount of pledged inventory is disclosed in note 5.3.<br />
the reduction of valuation allowance on inventory is related to sale or scrap of items, as well as to a reassessment<br />
of the valuation allowance affecting the statement of comprehensive income of the group.<br />
5.5 trade and other accounts receivable<br />
trade accounts receivable arise from deliveries and services relating to the group’s operating activities.<br />
in thousands chF 31.12.<strong>2009</strong> 31.12.2008<br />
trade accounts receivable from third parties 35 238 48 723<br />
valuation allowance – 2 578 – 2 591<br />
total trade accounts receivable, net 32 660 46 132<br />
derivative financial instruments* – 1 424<br />
prepaid expenses and accrued income 1 089 1 208<br />
other accounts receivable from third parties 5 065 5 802<br />
total other accounts receivable, net 6 154 8 434<br />
total trade and other accounts receivable, net<br />
* see note 5.7.<br />
38 814 54 566
trade accounts receivables are due and specific/general valuation allowance have been evaluated as follows:<br />
Financial RepoRt<br />
notes to the Financial statements<br />
in thousands chF 31.12.<strong>2009</strong> 31.12.2008<br />
gRoss valuation alloWance Net gRoss valuation alloWance Net<br />
individually collectively individually collectively<br />
not past due 23 773 23 773 30 150 30 150<br />
past due 1– 30 days 6 590 6 590 12 174 12 174<br />
past due 31– 60 days 1 961 1 961 3 097 3 097<br />
past due 61– 90 days 751 – 415 336 790 – 79 711<br />
past due over 90 days 2 163 – 976 – 1 187 – 2 512 – 1 325 – 1 187 –<br />
total trade accounts<br />
receivable 35 238 – 1 391 – 1 187 32 660 48 723 – 1 404 – 1 187 46 132<br />
the valuation allowance on trade accounts receivable from third parties developed as follows:<br />
in thousands chF <strong>2009</strong> 2008<br />
total<br />
revalued<br />
individually<br />
Revalued<br />
collectively<br />
Revalued<br />
total<br />
revalued<br />
individually<br />
Revalued<br />
collectively<br />
Revalued<br />
at 1.1. – 2 591 – 1 404 – 1 187 – 2 233 – 1 240 – 993<br />
currency translation<br />
adjustment 48 48 347 225 122<br />
additions – 377 – 377 – 1 232 – 916 – 316<br />
alllowance used 101 101 388 388<br />
allowance reversed 241 241 139 139<br />
at 31.12. – 2 578 – 1 391 – 1 187 – 2 591 – 1 404 – 1 187<br />
during the year under review, total chF 0.1 million (previous year: chF 0.4 million) irrecoverable trade receivable was written off.<br />
currently, no other risks are identifiable in the net trade accounts receivables. sales are broadly diversified across geographical and<br />
industrial markets. thus, the risk of unexpected losses from trade receivables is assessed to be low.<br />
75
76<br />
Financial RepoRt<br />
notes to the Financial statements<br />
5.6 cash and cash equivalents<br />
cash and cash equivalents include the following:<br />
in thousands chF 31.12.<strong>2009</strong> 31.12.2008<br />
cash on hand, bank and postal accounts 8 163 11 685<br />
short term deposits 224 9 947<br />
total cash and cash equivalents 8 387 21 632<br />
the interest rates vary between 0 % (for chF) and 5 % (for ZaR). the respective rates of the previous year were 0.1 % (chF) and 9 %<br />
(ZaR) respectively .<br />
cash positions are held to 38 % in euR (previous year: 29 %), 2 % in chF (previous year: 44 %), 16 % in usd (previous year: 10 %),<br />
and the remaining 44 % (previous year: 17 %) in other currencies.<br />
cash and cash equivalents at interroll south africa as well as at interroll Brasil are subject to transfer limitations of chF 2.1 millions<br />
(2008: chF 1.3 million). these transfer limitations do not have any impact on their operating activities.<br />
5.7 financial instruments and currency risks<br />
the table below shows an overview of financial instruments held by valuation category according to ias 39:<br />
in thousands chF 31.12.<strong>2009</strong> 31.12.2008<br />
cash and cash equivalents 8 387 21 632<br />
trade and other accounts receivable 38 814 53 142<br />
Financial assets 923 757<br />
total financial assets 48 124 75 531<br />
derivatives for hedge accounting* – 453 1 424<br />
total financial instruments at fair value – 453 1 424<br />
trade and other accounts payable 46 516 46 656<br />
Financial liabilities 12 562 17 263<br />
total financial liabilities at carrying value<br />
* see notes 5.5 resp. 5.15.<br />
59 078 63 919<br />
Book values of cash and cash equivalents, trade and other accounts receivable and payable as well as financial assets amount closely<br />
to fair value due to their short term maturity.<br />
most financial liabilities are also due in 2010. therefore, fair values are also very close to book value.
analysis of currency risk exposure<br />
Financial RepoRt<br />
notes to the Financial statements<br />
due to its international focus, the interroll group is exposed to foreign currency risks. Risk exposures result from transactions in<br />
currencies deviating from the entities’ functional currency.<br />
the following table shows the major currency risks at the respective balance sheet date:<br />
in thousands chF 31.12.<strong>2009</strong> 31.12.2008<br />
euR usd cad gBp others euR usd cad gBp others<br />
Financial assets 64 2 367 587 61 547<br />
trade and other accounts<br />
receivable 864 4 348 1 116 3 476 3 705 631 11 228 5 999 863 3 511<br />
cash and cash equivalents<br />
Financial liabilities<br />
trade and other accounts<br />
19 461 3 611 12 009 1 778 169 41 589 3 451 2 244 8 256<br />
payable 2 496 4 715 3 364 1 803 1 246 3 073 5 649 1 676 75 1 210<br />
short term liabilities<br />
currency risks on the<br />
1 052 3 976 11 148 241 97 1 187 352 8 922<br />
balance sheet (gross)<br />
Risk elimination due to<br />
23 937 16 650 27 637 9 665 5 804 45 354 21 515 10 271 938 22 446<br />
equal currency<br />
currency risks on the<br />
– 5 384 – 6 012 – 23 489 – 2 477 – 2 678 – 4 543 – 3 896 – 3 102 – 20 264<br />
balance sheet (net) 18 553 10 638 4 148 7 188 3 126 40 811 17 619 7 169 938 2 182<br />
natural hedges – 5 017 – 4 945 – 487 – 12 560 – 12 121 – 133 – 42<br />
Fair value hedges* – 8 643 – 2 845 – 1 360 – 4 495 – 1 314 – 20 989 – 2 092 – 2 946 – 1 618 – 3 223<br />
Net currency risk exposure 4 893 2 848 2 301 2 693 1 812 7 262 3 406 4 090 – 722 – 1 041<br />
* Forward contracts.<br />
the curency risk on the balance sheet (gross) is equal to the sum of the value of all positions in the balance sheet that are held in a<br />
different currency than the functional currency of a company. such positions contain both, group internal as well as external amounts.<br />
in a first step, all of those risks are added up because a currency risk can arise on the debit as well as on the credit side of the balance<br />
sheet. the total is then disclosed as currency risk on the balance sheet (gross). the risk of each currency group is translated into<br />
chF at the closing rate and added up to total group values. “Risk elimination due to equal currency” results from netting out currrency<br />
risks which exists in the same foreign currency deviating from the functional currency and which are presented in the same group<br />
entity. natural hedges result from netting out currency risks among all group entities. the amount disclosed in line “fair value hedges”<br />
corresponds to the amount actually hedged and translated into chF. changes in the valuation of fair value hedges are recognized in<br />
the financing result (see note 6.5).<br />
all other net currency risks are immaterial in both years under review.<br />
77
78<br />
Financial RepoRt<br />
notes to the Financial statements<br />
sensitivity analysis<br />
as per year end, a sensitivity analysis was carried in respect to financial instruments. a currency fluctuation of 10 % would have the<br />
following effects on result and equity of the group:<br />
in thousands chF 31.12.<strong>2009</strong> 31.12.2008<br />
currency couple euR/chF usd/chF cad/usd euR/chF usd/chF cad/usd<br />
Foreign exchange change 10 % 10 % 10 % 10 % 10 % 10 %<br />
effect on result (positive) 86 24 21 113 25 1<br />
effect on result (negative) – 86 – 24 – 21 – 113 – 25 – 1<br />
the sensitivity analysis for the effects on the equity leads to immaterial effects of cumulated less than chF 0.1 million. as per end of<br />
<strong>2009</strong>, there are no cash flow hedges which spares a sensitivity analysis on equity.<br />
foreign currency forward contracts<br />
the following table shows the contractual and fair values of the hedges held by the group:<br />
in thousands chF 31.12.<strong>2009</strong> 31.12.2008<br />
notional amount FaiR value notional amount FaiR value<br />
Fair value hedges (forward contracts) original currency chf original currency chf<br />
usd 4 340 – 177 6 561 586<br />
gBp 791 – 43 1 697 523<br />
thB 36 200 – 55 48 000 126<br />
euR 4 108 – 138<br />
others – 40 – 66<br />
fair value hedges – 453 1 169<br />
cash flow hedges (forward contracts)<br />
usd 2 736 255<br />
cash flow hedges – 255<br />
total foreign currency forward<br />
contracts* – 453 1 424<br />
* see notes 5.5 resp. 5.15.<br />
the fair values of the derivative financial instruments are classified as hierarchy 2 in the sense of iFRs 7. the valuation in hierarchy 2<br />
is based on factors which cannot be tracked to actively listed prices on public markets. instead, they can be monitored directly (as a<br />
price) or indirectly (as a derivative of the price). the cash flow deriving from the derivative instruments as well as the reclassification of<br />
unrealised profits and losses recognised in the equity to the statement of comprehensive income is expected to be realised within one<br />
year. Realised gains and losses on cash flow hedges are reported in in the positions “other operating income” and “other operating<br />
expenses” respectively.<br />
the group prepares regularly a rolling forecast of foreign currency cash flows. 0– 50 % of such budgeted, future foreign currency flows<br />
are hedged through forward contracts.<br />
With fair value hedges, the group hedges 50– 100 % of its net currency risks on the balance sheet.
5.8 equity management<br />
the objectives, principles and processes applied in capital management are:<br />
• safe-guarding of the going concern,<br />
• definition of a range of equity margins that reflects the operational and balance sheet risks,<br />
• a financial liability structure adapted to the asset structure,<br />
• adequate relation between equity and liabilities,<br />
• realisation of an appropriate return on equity,<br />
• distribution of a stable portion of the profit.<br />
Financial RepoRt<br />
notes to the Financial statements<br />
Based on above targets, group management aims at a long term equity ratio of approx. 50 %. the ordinary pay-out ratio corresponds<br />
to approx 30 % of the result. this ratio may deviate based on the general economic outlook and the planned future investment activi-<br />
ties.<br />
5.9 information on shareholder’s equity<br />
reconciliation from total issued shares to the outstanding shares<br />
<strong>2009</strong> 2008<br />
issued shares par value chf 15.00 each (previous year: chf 20.00) 854 000 854 000<br />
own shares held by the group as per 1.1. 85 042 91 888<br />
purchase of own shares – 8 598<br />
sale of own shares – – 13 434<br />
attribution of shares relating to bonus plan – 1 896 – 1 410<br />
attribution of shares related to options exercised – – 600<br />
attribution of shares related to settlement of acquisitions – 921 –<br />
own shares held by the group as per 31.12. 82 225 85 042<br />
thereof reserved for issuance under option program 52 965 52 965<br />
thereof unreserved 29 260 32 077<br />
shares outstanding at 31.12. 771 775 768 958<br />
Note to the movements in the shareholder’s equity<br />
potential claims of chF 1.6 million for withholding tax were recognised as accrued expenses against share premium. those accrued<br />
expenses are an effect of acquisitions of own shares.<br />
79
80<br />
Financial RepoRt<br />
notes to the Financial statements<br />
5.10 earnings per share<br />
basic earnings per average share outstanding<br />
the basic earnings per average share outstanding in <strong>2009</strong> amount to chF 7.41 (2008: chF 44.38). the calcu-<br />
lation is based on the profit attributable to the equity holders of the parent company, divided by the weighted<br />
average of shares outstanding.<br />
<strong>2009</strong> 2008<br />
result attributable to the equity holders 5 716 33 833<br />
shares outstanding as of 1.1. 768 958 762 112<br />
effect of the purchase of own shares – – 8 287<br />
effect of the sale/attribution of own shares 2 517 8 160<br />
effect of the issue of shares under option plans – 338<br />
Weighted average of shares outstanding 771 475 762 323<br />
basic earnings (result) per average share oustanding (chf 1) 7.41 44.38<br />
diluted earnings per average share outstanding<br />
the diluted earnings per average share outstanding in <strong>2009</strong> amount to chF 7.41 (2008: chF 43.60). they are<br />
calculated by adjusting the weighted average number of ordinary shares outstanding to include all dilutive<br />
potential ordinary shares.<br />
the potential ordinary shares resulting from the issue of options under the employee stock option plan (see<br />
note 6.1) had no dilutive effect due to the fact that the strike price (chF 323) was above the average share<br />
price (chF 271) during the year under review (previous year: dilutive effect because the average share price of<br />
chF 435 was above the strike price).<br />
<strong>2009</strong> 2008<br />
result attributable to the equity holders 5 716 33 833<br />
Weighted average of shares outstanding 771 475 762 323<br />
dilutive effect of share options – 13 743<br />
Weighted average of shares outstanding (diluted) 771 475 776 066<br />
diluted earnings (result) per average share outstanding (chf 1) 7.41 43.60
5.11 financial liabilities<br />
detailed disclosure of current and non-current financial liabilities<br />
Financial RepoRt<br />
notes to the Financial statements<br />
in thousands chF 31.12.<strong>2009</strong> 31.12.2008<br />
Bank overdrafts 394 665<br />
Bank loans 10 511 6 199<br />
Finance leases 213 729<br />
other loans – 1 189<br />
total current financial liabilities 11 118 8 782<br />
Bank loans 107 6 158<br />
Finance leases – 214<br />
other loans 1 337 2 109<br />
total non-current financial liabilities 1 444 8 481<br />
total financial liabilities 12 562 17 263<br />
Net financial liabilities to adjusted equity ratio<br />
in thousands chF 31.12.<strong>2009</strong> 31.12.2008<br />
total financial liabilities 12 562 17 263<br />
./. cash and cash equivalents – 8 387 – 21 632<br />
Net financial liabilities (-net cash) 4 175 – 4 369<br />
total shareholders’ equity 133 024 130 731<br />
./. cash flow hedge recognised in equity – – 228<br />
adjusted capital 133 024 130 503<br />
Net debt in % to adjusted equity 3.14 n/a<br />
81
82<br />
Financial RepoRt<br />
notes to the Financial statements<br />
loan structure<br />
in thousands chF <strong>2009</strong> 2008<br />
cuRRency<br />
Weighted<br />
aveRage<br />
inteRest Rate<br />
Fix/ yeaR oF<br />
vaRiaBle matuRity<br />
Face<br />
value<br />
caRRying<br />
amount<br />
Face<br />
value<br />
caRRying<br />
amount<br />
Bank loans chF 2.70 % F 2010 7 037 6 900 12 486 12 000<br />
euR 1.15 % F/v 2012 3 725 3 718 378 356<br />
total bank loans 10 762 10 618 12 864 12 356<br />
Finance leases euR 6.12 % F/v 2010 221 213 1 001 942<br />
thB 0.00 % F <strong>2009</strong> – – 1 1<br />
total finance leases 221 213 1 002 943<br />
other loans euR 0.00 % F 2012 1 337 1 337 3 147 3 147<br />
aud 0.00 % F <strong>2009</strong> – – 151 151<br />
total other loans 1 337 1 337 3 298 3 298<br />
total loans 12 320 12 168 17 164 16 597<br />
as of december 31, <strong>2009</strong> no loans (previous year: chF 0.1 million) were secured by mortgage deeds. the difference from total loans<br />
to total financial liabilities consists of the bank overdrafts that are reported as current financial liabilities in line with ias 39.<br />
liquidity risks<br />
the financial liabilities as per december 31, <strong>2009</strong> are due as follows:<br />
in thousands chF Book value<br />
coNtractual<br />
amouNt<br />
Within<br />
6 months<br />
Within<br />
6 – 12 months<br />
Within<br />
1 – 2 yeaRs<br />
Within<br />
2 – 5 yeaRs<br />
Bank loans 10 618 10 762 10 629 22 88 23<br />
Finance leases 213 221 213 8<br />
other loans 1 337 1 337 851 486<br />
Bank overdrafts 394 394 394<br />
trade and other accounts<br />
payable* 46 969 46 969 46 969<br />
total financial liabilities 59 531 59 683 58 205 30 939 509<br />
* an ageing analysis is not readily available. Based on past experience, it can be reliably assumed that the full amount is due within less than 6 months.<br />
the financial liabilities as per december 31, 2008 were due as follows:<br />
in thousands chF Book value<br />
coNtractual<br />
amouNt<br />
Within<br />
6 months<br />
Within<br />
6 – 12 months<br />
Within<br />
1 – 2 yeaRs<br />
Within<br />
2 – 5 yeaRs<br />
Bank loans 12 357 12 864 6 415 117 6 262 70<br />
Finance leases 943 1 002 593 189 221<br />
other loans 3 298 3 298 2 556 742<br />
Bank overdrafts 665 665 666<br />
trade and other accounts<br />
payable* 46 656 46 656 46 656<br />
total financial liabilities 63 919 64 485 56 886 306 7 225 70<br />
* an ageing analysis is not readily available. Based on past experience, it can be reliably assumed that the full amount is due within less than 6 months.
Financial RepoRt<br />
notes to the Financial statements<br />
interest sensitivity<br />
considering the limited amount of net cash resp. net debt, a change of 100 basis points in the interest rates would not have a significant<br />
effect (<strong>2009</strong>: +/– 40, 2008: +/– 80) on the shareholders’ equity, result and cash flows of the group.<br />
credit facilities<br />
the amount of unused credit facilities as per end of the reporting year amounted to chF 71.9 millions (previous year: chF 47.2 millions).<br />
new and committed credit lines for an amount of chF 40 millions with a duration of 3 years were agreed upon. these credit lines are<br />
included in the amount of chF 71.9 millions. they ensure the funding of the future investment program and serve generally for the<br />
business financing. the debt covenants to be complied with are the following:<br />
eBitda : net interest costs = min. 3.0<br />
net debt : eBitda = max. 3.0<br />
equity : total assets = min. 35 %<br />
For all credit lines, debt covenants have always been complied with.<br />
loans<br />
in the course of the acquisition of the Bdl group in 2006, two unsecured loans of totally chF 24 millions were taken up at an interest<br />
rate of 2.7 % with four years repayment term. the loans were to be settled through annually equal instalments. the last instalment was<br />
settled as per end of February 2010.<br />
5.12 leasing liabilities<br />
finance leases<br />
the financial lease liabilities are due as follows:<br />
pResent value inteRest<br />
miNimum lease<br />
paymeNts<br />
as per year end, in thousands chF <strong>2009</strong> 2008 <strong>2009</strong> 2008 <strong>2009</strong> 2008<br />
within 1 year 213 729 8 51 221 780<br />
between 1 and 5 years – 214 – 8 – 222<br />
over 5 years – – – – – –<br />
total finance leases 213 943 8 59 221 1 002<br />
operating leases<br />
liabilities from operating leases mainly relate to building rentals and will become due as follows:<br />
in thousands chF 31.12.<strong>2009</strong> 31.12.2008<br />
within 1 year 2 779 2 961<br />
between 1 and 5 years 4 395 4 456<br />
over 5 years 1 069 1 190<br />
total operating leases 8 243 8 607<br />
in the year under review, operating lease expense include contingent rent in the amount of chF 0.2 million (2008: chF 0.1 million).<br />
83
84<br />
Financial RepoRt<br />
notes to the Financial statements<br />
5.13 provisions<br />
WaRRanties otheR pRovisions total provisioNs<br />
in thousands chF <strong>2009</strong> 2008 <strong>2009</strong> 2008 <strong>2009</strong> 2008<br />
at 1.1. 6 102 7 942 1 569 1 772 7 671 9 714<br />
currency translation adj. 113 – 841 – – 161 113 – 1 002<br />
provisions made 2 581 3 489 412 418 2 993 3 907<br />
provisions used – 2 350 – 3 065 – 209 – – 2 559 – 3 065<br />
provisions reversed – 1 796 – 1 423 – 119 – 460 – 1 915 – 1 883<br />
at 31.12. 4 650 6 102 1 653 1 569 6 303 7 671<br />
the group companies normally grant a 24-month warranty. the warranty provision is recognised based on<br />
past experience as well as on specific projects. the warranty provision corresponds to roughly 2 % (previous<br />
year: 1.7 %) of net sales. the reduction follows an analysis of previous years’ actual warranty expenses which<br />
resulted in a reduction of warranty provision required. data from the past indicates that between 30 % and<br />
50 % of the warranty provision will be used in the subsequent year.<br />
in 2007, an onerous contract provision in the amount of chF 1.2 million was recognised in “other provisions”<br />
that relates to a long term building rental contract that will be terminated before its final term and that will not<br />
be used anymore as from late 2010. the impending loss corresponds to the rental amount for the period during<br />
which the building will no longer be used. the other provisions include pension liabilities according to ias 19.
5.14 pension obligations and pension costs<br />
Financial RepoRt<br />
notes to the Financial statements<br />
the pension costs for <strong>2009</strong> amounted to chF 1.7 million (2008: chF 1.9 million). such costs consist of em-<br />
ployer contributions relating to the defined contribution plans and pension costs relating to the defined benefit<br />
plans.<br />
the pension plans in switzerland and France are regarded as defined benefits plans in line with ias 19. in both<br />
years under review, approximately 190 employees participated in the defined benefit plans. the swiss plan is<br />
outsourced to a collective foundation whereas the plan of France is outsourced to an insurance company. it<br />
can be assumed that the assets of both plans do not include interroll shares.<br />
components of pension costs<br />
in thousands chF <strong>2009</strong> 2008<br />
costs of the defined contribution plans – 913 – 1 282<br />
current service costs, gross – 950 – 880<br />
employee contributions 336 316<br />
interest costs – 357 – 235<br />
amortisation of actuarial losses – 40 – 61<br />
expected return on plan assets 237 219<br />
costs of the defined benefit plans – 774 – 641<br />
total pension costs – 1 687 – 1 923<br />
the actual return on plan assets is in line with the return that can generally be expected based on the agreement<br />
with the collective foundation. the expected future contributions will not change materially in future years<br />
provided the number of insured employees remains stable.<br />
funded status for the defined benefit plans<br />
in thousands chF, as per year end <strong>2009</strong> 2008 2007 2006 2005<br />
present value of defined benefit obligation – 10 770 – 9 478 – 7 606 – 6 943 – 5 486<br />
Fair value of plan assets 9 357 8 402 6 381 5 760 4 536<br />
pension liability – 1 413 – 1 076 – 1 225 – 1 183 – 950<br />
unfunded fair value of benefit obligations – 243 – 205 – – –<br />
unrecognised actuarial (losses)/gains 1 174 923 1 038 1 183 950<br />
defined benefit obligation, net – 482 – 358 – 187 – –<br />
85
86<br />
Financial RepoRt<br />
notes to the Financial statements<br />
roll forward of the defined benefit obligation<br />
in thousands chF <strong>2009</strong> 2008<br />
benefit obligation as per 1.1. – 9 683 – 7 606<br />
current service costs, net – 614 – 564<br />
interest costs – 357 – 235<br />
contributions from plan participants – 336 – 316<br />
actuarial gain/(loss) on obligation – 228 98<br />
insurance premiums 267 330<br />
Benefits funded/(paid), net – 62 – 1 390<br />
benefit obligation as per 31.12. – 11 013 – 9 683<br />
roll forward of the present value of plan assets<br />
in thousands chF <strong>2009</strong> 2008<br />
fair value of plan assets as per 1.1. 8 402 6 381<br />
expected return on plan assets 237 220<br />
actuarial gain/(loss) on plan assets – 66 – 25<br />
insurance premiums – 267 – 330<br />
employer contributions 653 608<br />
employee contributions 336 316<br />
Benefits funded/(paid), net 62 1 232<br />
fair value of plan assets as per 31.12. 9 357 8 402<br />
investments of the pension plan are done in the following categories:<br />
• 2.5 % equity securities (previous year: 3.2 %) • 16.8 % real estate (previous year: 17.9 %)<br />
• 72.8 % debt securities (previous year: 69.9 %) • 7.9 % other investments (previous year: 9.3 %)<br />
roll forward of the unrecognised pension deficit<br />
in thousands chF <strong>2009</strong> 2008<br />
unrecognised pension liabilities as of 1.1. – 358 – 187<br />
pension costs – 774 – 640<br />
contributions 653 608<br />
currency translation/plan expansion – 3 – 139<br />
unrecognised pension liabilities as of 31.12. – 482 – 358<br />
actuarial assumptions<br />
<strong>2009</strong> 2008<br />
discount rate 3.4 % 3.7 %<br />
expected return on plan assets 2.9 % 2.7 %<br />
expected benefit increases 0.5 % 0.5 %<br />
average future salary increases 1.9 % 2.1 %<br />
average fluctuation rate 10.0 % 10.0 %
5.15 trade and other accounts payable<br />
Financial RepoRt<br />
notes to the Financial statements<br />
in thousands chF 31.12.<strong>2009</strong> 31.12.2008<br />
trade accounts payable to third parties 12 312 16 131<br />
advances received from customers 12 266 5 543<br />
other liabilities 6 797 7 828<br />
accrued personnel expenses 6 118 9 278<br />
accrued interest 178 345<br />
other accrued expenses 8 845 7 531<br />
derivative financial instruments* 453 –<br />
total trade and other accounts payable 46 969 46 656<br />
* see note 5.7.<br />
advances received from customers mainly relate to larger projects within the subsystems segment. other<br />
liabilities include vat and social security related liabilities. accrued personnel expenses relate to accrued<br />
vacation and bonuses.<br />
87
88<br />
Financial RepoRt<br />
notes to the Financial statements<br />
6 Notes to the coNsolidated statemeNt of compreheNsive iNcome<br />
6.1 personnel expenses<br />
in thousands chF <strong>2009</strong> 2008<br />
Wages and salaries 66 515 77 956<br />
social security costs 10 384 11 908<br />
pension costs (see note 5.14) 1 687 1 923<br />
other employee benefit costs 2 340 2 739<br />
share based personnel expenses to management personnel 596 715<br />
total personnel expenses 81 522 95 241<br />
thereof production related personnel expenses 39 992 49 842<br />
average number of employees 1 206 1 315<br />
option plan<br />
on march 3, 2006 the Board of directors approved a management share option plan for the next five years. the key data for this plan<br />
is as follows:<br />
option life: april 3, 2006 – september 30, 2011<br />
Blocked period: april 3, 2006 –april 2, 2010<br />
excercise period: april 3, 2010 – september 30, 2011<br />
strike price: chF 323/registered share inRn<br />
Reference price: average inRn price from march 27, 2006 – march 31, 2006 less 4 %<br />
option/share: 1 option entitles to acquire 1 registered share inRn<br />
option price: chF 15 per option<br />
the following movements took place in the years under review:<br />
all outstanding options have been attributed in 2006. the fair value at the grant date was chF 4.7 millions (chF 88.64/option). the<br />
employees contribution amounted to chF 0.8 million (chF 15/option). the valuation of the option was calculated on the basis of the<br />
binomial method and has been carried out by a bank. Besides from above key data on the option plan, the following parameters<br />
were used for the valuation:<br />
• risk free interest rate of 2.82 %<br />
• volatility 25 %<br />
• yearly unchanged profit distribution of CHF 6/INRN<br />
• average share price: CHF 337<br />
31.12.<strong>2009</strong> attributed exercised 31.12.2008 attributed exercised 1.1.2008<br />
options outstanding 52 965 52 965 – 600 53 565<br />
thereof granted 52 965 52 965 – 600 53 565<br />
thereof not vested 52 965 52 965 – 600 53 565<br />
thereof exercisable – – –<br />
thereof in company’s portfolio – – –<br />
the plan option is not subject to any vesting condition after the vesting period has become effective.
6.2 research and development<br />
Financial RepoRt<br />
notes to the Financial statements<br />
the group incurred the following expenses for research and development during the years under review:<br />
in thousands chF <strong>2009</strong> 2008<br />
research and development 8 588 6 933<br />
these expenses are mostly incurred to further develop and complete the product range of the segments. they<br />
are included in personnell- and other operational expenses as well as in depreciation on fixed tangible assets.<br />
no expenses have been capitalized as the preconditions stated in ias 38 are not met cumulatively.<br />
6.3 other operating expenses<br />
in thousands chF <strong>2009</strong> 2008<br />
office and administration 6 074 7 238<br />
provisions and allowances, net 323 1 976<br />
non-income taxes 1 267 2 050<br />
consultancy, auditing 3 423 4 738<br />
marketing 5 930 4 942<br />
Freight 7 937 11 195<br />
commissions, bad debt adjustments 2 390 3 221<br />
Building rent 3 388 3 258<br />
Building maintenance 2 391 3 117<br />
maintenance on machinery, tools and moulds 2 726 3 695<br />
travelling and transportation 4 870 6 809<br />
consumables for production 2 931 3 843<br />
insurances 732 820<br />
other expenses 3 349 4 587<br />
loss on disposal of property, plant and equipment / intangible assets 398 49<br />
total other operating expenses 48 129 61 538<br />
6.4 other operating income<br />
in thousands chF <strong>2009</strong> 2008<br />
income from commissions, licences and freight 7 329 10 413<br />
income from services 864 643<br />
Realised gains on cash flow hedges 344 2 420<br />
government grants received 83 10<br />
total other operating income 8 620 13 486<br />
89
90<br />
Financial RepoRt<br />
notes to the Financial statements<br />
6.5 financing result<br />
in thousands chF <strong>2009</strong> 2008<br />
Foreign exchange loss, net – 213 –<br />
unrealized losses on fair value hedges – 1 742 –<br />
Realized losses on fair value hedges – – 1 948<br />
Realized translation differences, net – 659 –<br />
interest expenses – 538 – 797<br />
financing expenses – 3 152 – 2 745<br />
Foreign exchange gain, net – 862<br />
unrealized gains on fair value hedges – 987<br />
Realized gains on fair value hedges 1 432 –<br />
Realized translation differences, net – 2 691<br />
interest income 311 882<br />
financing income 1 743 5 422<br />
financing result, net – 1 409 2 677<br />
the result from realized cash flow hedges is presented in the other operating income/expenses (see notes 6.3<br />
resp. 6.4). as per year-end <strong>2009</strong> no cash flow hedges existed (see note 5.7). the non-realized effects on cash<br />
flow hedges were presented in equity in the previous year. lines “realized translation differences, net” are related<br />
to repayments of equity or equity like loans of consolidated subsidiaries.<br />
6.6 income tax expense<br />
components of income tax expense<br />
in thousands chF <strong>2009</strong> 2008<br />
income taxes relating to the current period 2 241 9 858<br />
income taxes relating to past periods, net – 306 – 474<br />
current income tax expense 1 935 9 384<br />
due to temporary differences – 5 073 3 802<br />
due to tax rate changes – 104 – 329<br />
due to (recognition)/use of tax loss carry-forwards – 471 – 701<br />
adjustments to deferred tax assets – 314 119<br />
other effects 4 – 60<br />
deferred income tax expense/(income) – 5 958 2 831<br />
total income tax expense – 4 023 12 215<br />
taxes on capital are included in other operating expenses (see ote 6.3).<br />
deferred tax liabilities of chF 0.2 million (previous year: chF 0.1 million) have not been recognised for withhol-<br />
ding and other taxes on the un-remitted earnings.
econciliation of effective tax rate<br />
Financial RepoRt<br />
notes to the Financial statements<br />
in thousands chF <strong>2009</strong> 2008<br />
result before income taxes 1 693 46 048<br />
income tax expenses at the expected tax rate of 20.1 % (2008: 20.7 %) 340 9 546<br />
(non-taxable income)/non-tax deductible expenses, net – 1 494 4 697<br />
(Reversal of)/write offs on deferred tax assets, net – 314 119<br />
tax rate changes, net – 104 – 329<br />
effect from deviation to tax rates in group companies – 1 854 – 3 844<br />
(tax credits)/tax charges on prior years’ results, net<br />
(use of unrecognised tax losses)/effect of unrecognised tax losses on the<br />
– 306 – 474<br />
current year’s result, net – 361 2 590<br />
other effects 70 – 90<br />
effective (total) income tax expense – 4 023 12 215<br />
the income tax expense analysis is based on the expected tax rate for an ordinarily taxed company in switzerland.<br />
unrecognised and recognised tax losses<br />
in thousands chF 31.12.<strong>2009</strong> 31.12.2008<br />
expiry not activated activated not activated activated<br />
<strong>2009</strong> – 269 –<br />
2010 155 – 470 –<br />
2011 925 – 383 1 564<br />
2012 404 – 399 –<br />
2013 826 – – –<br />
2014 and later 21 814 1 239 18 414 1 799<br />
unlimited 3 869 4 228 7 894 985<br />
total 27 993 5 467 27 829 4 348<br />
tax benefit 9 882 1 188 10 276 680<br />
thereof unrecognised – 9 882 – 10 276<br />
netted out within tax units<br />
deferred tax assets<br />
– 997 – 325<br />
capitalized 191 355<br />
a tax effect of chF 2.8 millions resulted from new tax losses carried forward in the amount of chF 10.0 millions.<br />
thereof chF 0.7 million was capitalized (previous year: new tax losses of 12.1 millions with a tax effect of chF<br />
3.5 millions, whereof chF 0.4 million was activated).<br />
deferred tax assets on unused tax losses carried forward and tax-deductible temporary differences are capitalized<br />
in case it is probable that such assets can be set off against future taxable profits. due to the probability<br />
to set off current tax losses carried forward against future profits in various subsidiaries, an amount of<br />
chF 0.2 million has been capitalized in <strong>2009</strong> (2008: chF 0.4 million). interroll considers the future set off probable<br />
based on approved business plans.<br />
91
92<br />
Financial RepoRt<br />
notes to the Financial statements<br />
attribution of defered tax assets/liabilities to items of the statement of financial position<br />
in thousands chF 31.12.<strong>2009</strong> 31.12.2008<br />
deFeRRed tax deFeRRed tax<br />
assets liaBilities assets liaBilities<br />
intangible assets 2 685 4 641 105 6 259<br />
property, plant and equipment 170 3 740 102 4 322<br />
Financial assets – 136 – 180<br />
inventory 142 92 – –<br />
Benefits of loss carry forwards 1 188 355<br />
Receivables 110 429 – –<br />
other assets 1 – 504 616<br />
total assets 4 296 9 038 1 066 11 377<br />
long term debts – 233 – –<br />
provisions 702 6 472 1 106 8 769<br />
short term debts 520 128 – –<br />
other liabilities 79 – 299 104<br />
total liabilities 1 301 6 833 3 537 31 627<br />
set-off – 5 395 – 5 395 – 2 116 – 2 116<br />
total net 202 10 476 355 18 134<br />
deferred tax assets and deferred tax liabilities are netted within and between companies belonging to the same<br />
taxable unit.<br />
the reduction of deferred tax assets and liabilities of net chF 7.5 millions (previous year: increase of chF 1.9<br />
millions) corresponds to net deferred tax income recognised in the statement of comprehensive income of chF<br />
6.0 millions (previous year: deferred tax expense of chF 2.8 millions), the increase due to acquisition through<br />
business combinations of chF 0.2 million (previous year chF 0.1 million) and currency translation adjuste-<br />
ments of chF 0.1 million (previous year: chF – 1.0 million). the remaining portion corresponds to a reclassifi-<br />
cation to accrued expenses.<br />
in both years under review, current income taxes of chF 0.1 million were credited to equity. no taxes were<br />
recognised in the other comprehensive income in both years under review.
7 other disclosures<br />
7.1 contingent liabilities<br />
there are no contingent liabilities in the years under review.<br />
7.2 related party transactions<br />
transactions with related parties<br />
Financial RepoRt<br />
notes to the Financial statements<br />
category volume open payaBles<br />
in thousands chF <strong>2009</strong> 2008 31.12.<strong>2009</strong> 31.12.2008<br />
purchase of materials a 4 402 10 519 624 1 005<br />
it investments/it services a 1 230 1 479 145 97<br />
other costs a+b 817 1 246 2 10<br />
total purchases 6 449 13 243 771 1 112<br />
category volume open ReceivaBles<br />
in thousands chF <strong>2009</strong> 2008 31.12.<strong>2009</strong> 31.12.2008<br />
sale of material a 5 540 10 442 1 019 1 200<br />
other income b 385 405 94 113<br />
total services 5 926 10 847 1 114 1 313<br />
Related parties are defined and categorised as following:<br />
a) shareholders of inteRRoll holding ltd. holding more than 3 % of the shareholder capital<br />
b) members of the Board of directors of inteRRoll holding ltd. and legal entities that are directly controlled by them<br />
c) members of the group management of interroll group and legal entities that are directly controlled by them<br />
d) local managing directors as well as people reporting to them (only for substantial transactions)<br />
compensation to group management<br />
in thousands chF <strong>2009</strong> 2008<br />
salaries incl. bonus 3 540 3 494<br />
post-employment benefits 465 538<br />
other long term benefits 18 16<br />
equity based compensation 450 505<br />
total compensation to group management 4 473 4 553<br />
total compensation in the year <strong>2009</strong> to the Board of directors of inteRRoll holding ltd. is chF 0.45 million (2008: 0.43 million).<br />
the detailed disclosure on the compensation to and shares owned by the Board of directors and the group management required<br />
by swiss law are included in the notes to the financial statements of inteRRoll holding ltd.<br />
93
94<br />
Financial RepoRt<br />
notes to the Financial statements<br />
7.3 subsequent events<br />
the consolidated financial statements were approved by the Board of directors on march 3, 2010 and are subject to further approval<br />
by the general meeting of the shareholders on may 7, 2010.<br />
no event has occurred between december 31, <strong>2009</strong> and march 3, 2010 which would require adjustment to the carrying amount of<br />
the group’s assets and liabilities as of december 31, <strong>2009</strong>, or would require disclosure in accordance with ias 10.<br />
7.4 scope of consolidation<br />
country Name & domicile function owner share capital in 1 000<br />
ch interroll holding ag, s. antonino F chF 12 810.0<br />
ownership<br />
in %<br />
ch interroll sa, s. antonino p hd chF 100.0 100 %<br />
interroll (schweiz) ag, s. antonino s hd chF 5 000.0 100 %<br />
interroll management ag, s. antonino F hd chF 100.0 100 %<br />
au interroll australia pty. ltd., victoria s hd/F aud 51.2 100 %<br />
BR interroll logistica ltda, sao paolo p/s hd BRl 1 000.0 100 %<br />
ca interroll canada ltd., aurora p/s hd cad 1 720.0 100 %<br />
interroll Financial canada ltd., aurora F hd cad 0.1 100 %<br />
interroll components canada ltd., concord p/s hd cad 0.1 100 %<br />
cn interroll suzhou co. ltd., suzhou p/s sgp cny 16 959.9 100 %<br />
cZ interroll cZ sro., Breclav s hde cZk 1 000.0 100 %<br />
de interroll Fördertechnik gmbh , Wermelskirchen s dho euR 25.6 100 %<br />
interroll engineering gmbh, Wermelskirchen p dho euR 1 662.2 100 %<br />
interroll automation gmbh, sinsheim p/s dho euR 2 000.0 100 %<br />
interroll holding gmbh, Wermelskirchen F hd euR 500.0 100 %<br />
interroll gmbh, Wermelskirchen d hd euR 25.0 100 %<br />
interroll trommelmotoren gmbh, Wassenberg p/s dho euR 77.0 100 %<br />
transtechnik gmbh, Wassenberg p/s dho euR 25.6 100 %<br />
dk interroll nordic as, hvidovre s dkh euR 67.1 100 %<br />
interroll Joki as, hvidovre p dkh euR 2 013.8 100 %<br />
interroll holding as, hvidovre F hd euR 2 126.1 100 %<br />
es interroll españa sa, Barbera del valles s hde/hd euR 600.0 100 %<br />
FR interroll sas, saint-pol-de-léon (ex dijon) F hde euR 2 808.0 100 %<br />
interroll sas, la Roche sur yon p/s F euR 2 660.0 100 %<br />
interroll sas, saint-pol de leon s F euR 61.0 100 %<br />
gB interroll ltd., corby s hde euR 0.0 100 %<br />
interroll engineering ltd., corby d hde euR 0.1 100 %<br />
Jp interroll Japan co. ltd., tokio s sgp Jpy 10 000.0 100 %<br />
kR interroll (korea) corporation, seoul p/s sgp kRW 100 000.0 100 %<br />
my interroll (malaysia) sdn. Bhd., petaling Jaya selangor d sgp myR 50.0 100 %<br />
nl interroll europe Bv, emmeloord F hd euR 90.8 100 %<br />
pl interroll polska sp.z.o.o., Warszaw s hd plZ 100.0 100 %<br />
sg interroll (asia) pte. ltd., singapur p/s hde sgd 3 000.0 100 %<br />
th interroll (thailand) co. ltd., Bangkok p/s sgp thB 47 000.0 100 %<br />
interroll ds asia pacific co. ltd, Bangkok p/s hd thB 100 000.0 100 %
Financial RepoRt<br />
notes to the Financial statements<br />
country Name & domicile function owner share capital in 1 000<br />
ownership<br />
in %<br />
us interroll corporation, Wilmington/n.c. s hd usd 65.0 100 %<br />
interroll automation llc, Jeffersonville p/s hde usd 0.1 100 %<br />
interroll dynamic storage inc., hiram/atlanta p/s hd usd 0.0 100 %<br />
vg inroll ltd., tortola F hd chF 100 000.0 100 %<br />
Za interroll sa (proprietary) ltd., Johannesburg p/s hd ZaR 1 500.0 100 %<br />
Function: p = production, s = sales, F = Finance, d = inaktiv<br />
owner: hd = inteRRoll holding ag, hde = interroll europe Bv, dho = interroll holding gmbh, dkh = interroll holding as,<br />
F = interroll sas, saint-pol-de-léon, sgp = interroll (asia) pte. ltd., singapur<br />
interroll dynamic storage inc., hiram (usa) as well as interroll ds asia pacific co., thailand, were consolidated for the first time in<br />
<strong>2009</strong>. interroll manufacturing llc, Wilmington/n.c. was merged into interroll corporation, Wilmington in <strong>2009</strong>. Bdl drum motors sa<br />
(pty), ltd., Johannesburg (south africa) and interroll trommelmotoren Bv in herkenbosch were liquidated in <strong>2009</strong>. Further notes to<br />
changes in the consolidation range are disclosed in note 3.<br />
95
96<br />
Financial RepoRt<br />
RepoRt oF the gRoup auditoR<br />
8 report of the group auditor<br />
report of the statutory auditor on the consolidated financial<br />
statements to the general meeting of shareholders of iNterroll<br />
holdiNg ltd., sant’antonino<br />
as statutory auditor, we have audited the accompanying consolidated financial statements of inteRRoll<br />
holding ltd, presented on pages 48 to 95, which comprise the consolidated statement of financial position,<br />
consolidated statement of comprehensive income, consolidated statement of cash flows, consolidated statement<br />
of changes in equity and notes to the consolidated financial statements for the year ended december<br />
31, <strong>2009</strong>.<br />
board of directors’ responsibility<br />
the board of directors is responsible for the preparation and fair presentation of the consolidated financial<br />
statements in accordance with international Financial <strong>Report</strong>ing standards (iFRs) and the requirements of<br />
swiss law. this responsibility includes designing, implementing and maintaining an internal control system<br />
relevant to the preparation and fair presentation of consolidated financial statements that are free from material<br />
misstatement, whether due to fraud or error. the board of directors is further responsible for selecting and<br />
applying appropriate accounting policies and making accounting estimates that are reasonable in the circumstances.<br />
auditor’s responsibility<br />
our responsibility is to express an opinion on these consolidated financial statements based on our audit. We<br />
conducted our audit in accordance with swiss law and swiss auditing standards as well as international<br />
standards on auditing. those standards require that we plan and perform the audit to obtain reasonable assurance<br />
whether the consolidated financial statements are free from material misstatement.<br />
an audit involves performing procedures to obtain audit evidence about the amounts and disclosures in the<br />
consolidated financial statements. the procedures selected depend on the auditor’s judgment, including the<br />
assessment of the risks of material misstatement of the consolidated financial statements, whether due to<br />
fraud or error. in making those risk assessments, the auditor considers the internal control system relevant to<br />
the entity’s preparation and fair presentation of the consolidated financial statements in order to design audit<br />
procedures that are appropriate in the circumstances, but not for the purpose of expressing an opinion on the<br />
effectiveness of the entity’s internal control system. an audit also includes evaluating the appropriateness of<br />
the accounting policies used and the reasonableness of accounting estimates made, as well as evaluating the<br />
overall presentation of the consolidated financial statements. We believe that the audit evidence we have obtained<br />
is sufficient and appropriate to provide a basis for our audit opinion.<br />
opinion<br />
in our opinion, the consolidated financial statements for the year ended december 31, <strong>2009</strong> give a true and<br />
fair view of the financial position, the results of operations and the cash flows in accordance with international<br />
Financial <strong>Report</strong>ing standards (iFRs) and comply with swiss law.
Financial RepoRt<br />
RepoRt oF the gRoup auditoR<br />
report on other legal requirements<br />
We confirm that we meet the legal requirements on licensing according to the auditor oversight act (aoa) and<br />
independence (article 728 co and article 11 aoa) and that there are no circumstances incompatible with our<br />
independence.<br />
in accordance with article 728a paragraph 1 item 3 co and swiss auditing standard 890, we confirm that an<br />
internal control system exists, which has been designed for the preparation of consolidated financial statements<br />
according to the instructions of the board of directors.<br />
We recommend that the consolidated financial statements submitted to you be approved.<br />
kpmg ag<br />
christoph schwarz samuel samuel dini<br />
licensed audit expert<br />
auditor in charge<br />
licensed audit expert<br />
lugano, march 3, 2010<br />
97
Financial statements<br />
of INTERROLL HOLDING LTD.<br />
Financial REpoRt<br />
intERRoll Holding ltd.<br />
1 Financial statements of INTERROLL HOLDING LTD. 100<br />
1.1 Balance sheet 100<br />
1.2 income statement 101<br />
1.3 Statement of changes in equity 101<br />
2 General information to the financial statements 102<br />
2.1 accounting policies and principle of valuation 102<br />
3 Notes to the financial statements 103<br />
3.1 accounts receivable 103<br />
3.2 own shares and options 103<br />
3.3 loans due from group companies 103<br />
3.4 trade and other accounts payable 103<br />
3.5 Financial liabilities 104<br />
3.6 provision for investment risks 104<br />
3.7 Shareholder equity 104<br />
3.8 contingent liabilities 105<br />
4 Other disclosures according to Swiss law 106<br />
4.1 Risk assessment 106<br />
4.2 internal control system 106<br />
4.3 compensation of and shares held by the Board of directors 107<br />
4.4 compensation of and shares held by the group Management 108<br />
5 Proposed appropriation of available earnings 109<br />
6 <strong>Report</strong> of the statutory auditor 110<br />
99
100<br />
Financial REpoRt<br />
Financial StatEMEntS oF intERRoll Holding ltd.<br />
1 FINaNcIaL STaTEmENTS OF INTERROLL HOLDING LTD.<br />
1.1 Balance sheet<br />
in thousands cHF see notes* 31.12.<strong>2009</strong> 31.12.2008<br />
aSSEtS<br />
cash and cash equivalents 112 1 738<br />
accounts receivable 3.1 2 889 9 724<br />
own shares 3.7 25 016 21 772<br />
Total current assets 28 017 33 234<br />
investments 188 074 153 605<br />
loans due from group companies 3.3 48 105 73 937<br />
Total non-current assets 236 179 227 542<br />
Total assets 264 196 260 776<br />
EQUitY and liaBilitiES<br />
trade and other accounts payable 3.4 7 348 1 413<br />
tax provision 71 1 513<br />
Financial liabilities 3.5 6 000 6 000<br />
Total current liabilities 13 419 8 926<br />
Financial liabilities 3.5 14 893 38 566<br />
provision for investment risks 3.6 100 771 93 871<br />
other provisions 804 804<br />
Total non-current liabilities 116 468 133 241<br />
Share capital 3.7 12 810 17 080<br />
Share premium 3.7 19 078 18 144<br />
general legal reserve 5 209 5 209<br />
Reserve for own shares 3.7 32 386 34 308<br />
available earnings 64 826 43 868<br />
Total shareholder’s equity 134 309 118 609<br />
Total liabilities and equity 264 196 260 776<br />
* See notes to the financial statements.
1.2 Income statement<br />
Financial REpoRt<br />
Financial StatEMEntS oF intERRoll Holding ltd.<br />
in thousands cHF <strong>2009</strong> 2008<br />
investment income 22 262 45 405<br />
Royalty income 2 274 3 426<br />
interest income 3 463 3 870<br />
other operating income 6 895 4 197<br />
Foreign currency exchange gains 549 –<br />
Total income 35 443 56 898<br />
administrative expenses – 692 – 466<br />
Financial expenses – 1 113 – 1 679<br />
Foreign currency exchange losses – – 4 673<br />
personnel expenses – 1 430 – 1 662<br />
other operating expenses – 5 311 – 16 381<br />
investment expenses – 6 900 – 20 000<br />
Total Expenses – 15 446 – 44 861<br />
Profit before income taxes 19 997 12 037<br />
income tax expenses – 27 – 60<br />
Result 19 970 11 977<br />
1.3 Statement of changes in equity<br />
in thousands cHF<br />
SHaRE<br />
capital<br />
SHaRE<br />
pREMiUM<br />
lEgal<br />
RESERvE<br />
RESERvE FoR<br />
own SHaRES<br />
availaBlE<br />
EaRningS<br />
as of 1.1.2008 26 047 13 024 3 788 39 428 33 312 115 599<br />
Result 2008 11 977 11 977<br />
Reduction in par value – 8 967 – 8 967<br />
transfer to legal reserve 1 421 – 1 421 –<br />
change of reserve for own shares 5 120 – 5 120 –<br />
at 31.12.2008 17 080 18 144 5 209 34 308 43 868 118 609<br />
Result <strong>2009</strong> 19 970 19 970<br />
Reduction in par value – 4 270 – 4 270<br />
change of reserve for<br />
own shares 934 – 1 922 988 –<br />
at 31.12.<strong>2009</strong> 12 810 19 078 5 209 32 386 64 826 134 309<br />
TOTaL<br />
101
102<br />
Financial REpoRt<br />
notES to tHE Financial StatEMEntS<br />
2 GENERaL INFORmaTION TO THE FINaNcIaL STaTEmENTS<br />
2.1 accounting Policies and Principles of Valuation<br />
SigniFicant accoUnting policiES<br />
current/Non-current distinction<br />
current assets are assets expected to be realised or consumed in the normal course of the company’s operating<br />
cycle or assets held for trading purposes. all other assets are classified as non-current assets.<br />
current liabilities are liabilities expected to be settled by use of cash generated in the normal course of the<br />
company’s operating cycle or liabilities due within one year from the reporting date. all other liabilities are<br />
classified as non-current liabilities.<br />
Foreign currency translation<br />
transactions in foreign currencies are recorded using exchange rates prevailing at the time of the transaction.<br />
gains or losses arising on settlement of these transactions are included in the current year’s income under the<br />
line item foreign currency exchange losses/gains, net. Monetary assets and liabilities denominated in foreign<br />
currencies are translated using the exchange rates prevailing at the balance sheet date. any gains or losses<br />
resulting from this translation are also included in the current year’s income, except for unrealised gains which<br />
are deferred.<br />
pRinciplES oF valUation<br />
cash and cash equivalents<br />
cash and cash equivalents are stated at nominal value.<br />
accounts receivable and payable<br />
accounts receivable are stated at nominal value less any valuation adjustment for credit risks. accounts payable<br />
are stated at nominal value.<br />
accounts receivable from group companies arise from services provided by intERRoll Holding ltd. and<br />
related interest and royalties billed. these services are recognised on an accrual basis.<br />
Own shares and options<br />
own shares and options to buy own shares are stated at the lower of cost and fair value.<br />
Loans<br />
non-current loans receivable are stated at nominal value less any valuation adjustments deemed necessary to<br />
reflect the credit risk. non-current loans payable are stated at nominal value.<br />
Investments<br />
investments are stated at cost less any valuation adjustments deemed necessary to recognise a decline other<br />
than temporary in value (impairment). additional provisions are recognised for general investment risks.<br />
accrued expenses<br />
accrued expenses primarily relate to interest due on loans payable. they are stated at nominal value.
3 NOTES TO THE FINaNcIaL STaTEmENTS<br />
3.1 accounts receivable<br />
3.2 Own shares and options<br />
Financial REpoRt<br />
notES to tHE Financial StatEMEntS<br />
in thousands cHF 31.12.<strong>2009</strong> 31.12.2008<br />
accounts receivable from third parties 1 817 1 857<br />
accounts receivable from group companies 879 7 867<br />
advance payments 193 –<br />
Total accounts receivable 2 889 9 724<br />
in the year under review the company neither acquired nor sold any own shares. in the previous year 8 598<br />
own shares were acquired for an average consideration of cHF 494 per share and 13 434 own shares were<br />
sold for an average consideration of cHF 403 per share.<br />
1 896 shares (previous year: 1 410) with a fair value of cHF 0.5 million (previous year: cHF 0.7 million) were<br />
granted to employees. no shares were attributed from the share option plan. in the previous year 600 shares<br />
were attributed to a member of the share option plan through exercise of option. Moreover 921 own shares<br />
were allocated to the seller of an entity acquired during the period under review as part of the acquisition price.<br />
as of december 31, <strong>2009</strong> the company held 82 225 own shares with a carrying amount of cHF 25.0 millions<br />
(previous year: 85 042 own shares with a carrying amount of cHF 21.8 millions). a reserve for own shares equal<br />
to the original cost of cHF 32.4 millions has been established out of available earnings. 52 965 own shares are<br />
reserved to cover the management share option plan (see note 6.1 to the consolidated financial statements).<br />
3.3 Loans due from Group companies<br />
the interest rates used were the following: lowest highest<br />
in the year 2008 3.25 % 7.50 %<br />
in the year <strong>2009</strong> 1.00 % 6.00 %<br />
the loans due from group companies are normally redeemable with a notification period of three months. as<br />
of year end, the total outstanding group loans amounted to cHF 48.1 millions (2008: cHF 73.9 millions.).<br />
3.4 Trade and other accounts payable<br />
in thousands cHF 31.12.<strong>2009</strong> 31.12.2008<br />
accounts payable to third parties 59 2<br />
accounts payable to group companies 2 330 216<br />
other accounts payable 37 185<br />
accrued expenses 4 922 1 010<br />
Total trade and other accounts payable 7 348 1 413<br />
103
104<br />
Financial REpoRt<br />
notES to tHE Financial StatEMEntS<br />
3.5 Financial liabilities<br />
in thousands cHF 31.12.<strong>2009</strong> 31.12.2008<br />
Bank loans 6 000 6 000<br />
Total current financial liabilities 6 000 6 000<br />
Bank loans – 6 000<br />
loans due from group companies 14 893 32 566<br />
Total non current financial liabilities 14 893 38 566<br />
Total financial liabilities 20 893 44 566<br />
the following interest rates were used: lowest highest<br />
in the year 2008 3.25 % 5.50 %<br />
in the year <strong>2009</strong> 2.50 % 5.00 %<br />
3.6 Provision for investment risks<br />
during the year 2003 as well as in 2008, the group implemented internal changes in the financing structure<br />
that generated an unrealised capital gain. therefore the company created a provision for investment risks that<br />
relates to investments in and loans due from group companies. thereby, it is ensured that the amount of<br />
shareholders’ equity presented of the parent company appears reasonable compared to the consolidated<br />
shareholders’ equity.<br />
3.7 Shareholder equity<br />
composition of the share capital<br />
the share capital consists of 854 000 fully paid-in registered shares with a par value of cHF 15 each (previous<br />
year: cHF 20). Each share entitles to equal dividend and voting rights.<br />
Significant Shareholders (at least 3 % of the share capital)<br />
the following table shows the number of shares held by resp. the participation of the most significant shareholders.<br />
31.12.<strong>2009</strong> 31.12.2008<br />
nUMBER oF paRticipation nUMBER oF paRticipation<br />
Shareholder/Shareholder group<br />
SHaRES<br />
in %<br />
SHaRES<br />
in %<br />
d. Specht and family 108 645 12.72 108 645 12.72<br />
B. ghisalberti/E. Moreschi and family 112 543 13.18 112 443 13.17<br />
n. axmann and family 39 017 4.57 36 917 4.32<br />
Sarasin investmentfonds ag 82 727 9.69 80 475 9.42<br />
vontobel Fonds Service ag – – 29 939 3.51<br />
chase nominees ltd. 10 092 1.18 29 934 3.51<br />
corisol Holding ag 34 587 4.05 – –<br />
public (floating) 466 389 54.61 455 647 53.35<br />
Total 854 000 100.00 854 000 100.00
Financial REpoRt<br />
notES to tHE Financial StatEMEntS<br />
Share premium<br />
in connection with the capital increase due to the initial public offering in 1997, the company received a share<br />
premium of cHF 28.5 millions. the transaction cost of the initial public offering (cHF 9.4 millions) was deducted<br />
from this amount. in the year 2007, cHF 6.1 millions have been transferred from the share premium to<br />
the reserve for own shares. in the year 2008, cHF 5.1 millions was reclassified to share premium due to the<br />
reduction of the reserve for own shares. in the year under review, additional cHF 1.0 million was added back<br />
to share premium with the consequence that the original amount of cHF 6.1 millions was credited back to<br />
share premium.<br />
Reserve for own shares<br />
the reserve for own shares equals the purchase price of own shares held as of balance sheet date (see note<br />
3.2).<br />
3.8 contingent liabilities<br />
intERRoll Holding ltd. has issued a guarantee for an existing shared credit facility in the amount of cHF<br />
42 millions in favour of interroll (Schweiz) ag.<br />
in addition, intERRoll Holding ltd. issued letters of continuing financial support in favour of the following<br />
group companies:<br />
country company<br />
germany interroll automation gmbH, Sinsheim<br />
interroll Holding gmbH, wermelskirchen<br />
France interroll SaS, la Roche sur Yon<br />
Switzerland interroll (Schweiz) ag, Sant’antonino<br />
canada interroll canada ltd., aurora<br />
interroll components canada ltd., concord<br />
intERRoll Holding ltd. carries joint liability in respect of the federal tax authorities for value added tax<br />
debts of all Swiss subsidiaries.<br />
105
106<br />
Financial REpoRt<br />
notES to tHE Financial StatEMEntS<br />
4 DIScLOSuRES accORDING TO SwISS LEGISLaTION<br />
4.1 Risk assessment<br />
the risk management coordinates and aligns the risk management processes and reports to the Board of<br />
directors on a regular basis on risk assessment and risk management. organizational and process measures<br />
designed to identify and mitigate risks at an early stage have been assessed to be satisfactory by the Board of<br />
directors.<br />
4.2 Internal control system<br />
the Board of directors and management of the group are responsible for establishing and maintaining adequate<br />
internal control over financial reporting. intERRoll Holding ltd.’s and the interroll group’s internal<br />
control system was designed to provide reasonable assurance to the interroll group’s management and Board<br />
of directors regarding the reliability of financial reporting and the preparation and fair presentation of its published<br />
consolidated financial statements.<br />
all internal control systems no matter how well designed have inherent limitations. therefore, even those systems<br />
determined to be effective may not prevent or detect misstatements and can provide only reasonable<br />
assurance with respect to financial statement preparation and presentation. also, projections of any evaluation<br />
of effectiveness to future periods are subject to the risk that controls may become inadequate because of<br />
changes in conditions or that the degree of compliance with the policies or procedures may deteriorate.<br />
interroll group management assessed the effectiveness of the group’s internal control over financial reporting<br />
as of december 31, <strong>2009</strong>. Based on its assessment, management has concluded that, as of december 31,<br />
<strong>2009</strong>, the interroll group’s internal control over financial reporting was effective based on those criteria (see<br />
notes to the consolidated financials statements. principles of consolidation.)
Financial REpoRt<br />
notES to tHE Financial StatEMEntS<br />
4.3 compensation of and shares held by the Board of Directors<br />
the compensation of the members of the Board (Bod) and the shares held by them at year end are disclosed in accordance with the<br />
Swiss code of obligations 663 bis and 663c. the total compensation amounted to:<br />
in thousands cHF caSH<br />
SHaRES/<br />
optionS<br />
Social<br />
SEcURitY* otHER BEnEFitS<br />
TOTaL<br />
cOmPENSaTION<br />
SHaRES HEld<br />
aS oF 31.12.<br />
paRticipation<br />
in %<br />
Kurt Rudolf<br />
2008 p, cc 150 17 167 500 0.06<br />
<strong>2009</strong><br />
Paolo Bottini<br />
p, cc 150 17 167 700 0.08<br />
2008 ac 50 7 57 20 0.00<br />
<strong>2009</strong> ac 50 7 57 20 0.00<br />
Philippe Dubois<br />
2008 ac 50 7 57 100 0.01<br />
<strong>2009</strong> ac 50 7 57 100 0.01<br />
Horst wildemann<br />
2008 cc 50 4 54 – 0.00<br />
<strong>2009</strong> cc 50 6 56 – 0.00<br />
marco Ghisalberti<br />
2008 50 7 57 112 443 13.17<br />
<strong>2009</strong><br />
Ingo Specht<br />
50 7 57 112 543 13.18<br />
2008 – – – 108 645 12.72<br />
<strong>2009</strong><br />
urs Tanner<br />
– – – 108 645 12.72<br />
2008 vp 29 4 33 – 0.00<br />
<strong>2009</strong> vp 50 7 57 – 0.00<br />
Total Board of<br />
Directors<br />
2008 379 – 46 – 425 221 708 25.96<br />
<strong>2009</strong> 400 – 51 – 451 222 008 26.00<br />
p: chairman of the Bod ac: audit committee<br />
vp: vice chairman of the Bod cc: compensation committee<br />
* Social Security costs consist of contributions to the state run Swiss social security system.<br />
the Board of directors does not hold any options to buy shares of intERRoll Holding ltd.<br />
107
108<br />
Financial REpoRt<br />
notES to tHE Financial StatEMEntS<br />
4.4 compensation of and shares held by the Group management<br />
the compensation of the members of the group Management and the shares held by them at year end are disclosed in accordance<br />
with the Swiss code of obligations 663bis and 663c. the total compensation amounted to:<br />
REMUnERation (nEt) SHaRE BaSEd paYMEnt<br />
Fix vaRiaBlE* SHaRES optionS<br />
Social<br />
SEcURitY<br />
otHER<br />
BEnEFitS<br />
TOTaL<br />
cOmPENSaTION<br />
cEO (highest)<br />
2008 472 613 264 – 443 41 1 833<br />
<strong>2009</strong><br />
other<br />
595 432 260 – 389 41 1 717<br />
2008 1 581 305 120 – 519 77 2 602<br />
<strong>2009</strong><br />
Total Group<br />
management<br />
1 517 451 82 – 494 75 2 619<br />
2008 2 053 918 384 – 962 118 4 435<br />
<strong>2009</strong> 2 112 883 342 – 883 116 4 336<br />
* the difference between provisions made in the previous year and the actually paid-out bonuses is netted with the variable compensation planned for the year under review.<br />
Shares and options owned by the members of group management and their related parties were the following:<br />
SHaRES aS oF 31.12. optionS aS oF 31.12.<br />
<strong>2009</strong> 2008 <strong>2009</strong> 2008<br />
paul Zumbühl 10 198 8 998 10 000 10 000<br />
Ralf garlichs – – 2 500 2 500<br />
didier lermite – 2 474 2 970 2 970<br />
Heinrich droste 532 532 2 970 2 970<br />
Jürg Häusermann 600 993 3 340 3 340<br />
Kwang-Heng Seng 220 195 1 200 1 200<br />
lorenz Köhler – – – –<br />
Flavio Zanatta – – 1 000 1 000<br />
christian Hähni – – – –<br />
Total 11 550 13 192 23 980 23 980
Financial REpoRt<br />
pRopoSEd appRopRiation oF availaBlE EaRningS<br />
5 PROPOSED aPPROPRIaTION OF aVaILaBLE EaRNINGS<br />
the Board of directors proposes to the general assembly to appropriate the available earnings as per end of<br />
the year under review as follows:<br />
in thousands cHF <strong>2009</strong> 2008<br />
Result 19 970 11 977<br />
available earnings carried over from previous year 43 868 33 312<br />
change of reserve for own shares 988 –<br />
transfer to legal reserve (share of Result) – – 1 421<br />
appropriation of a dividend – –<br />
available earnings 64 826 43 868<br />
the Board of directors proposes to the general assembly a nominal capital repayment of cHF 5 per share<br />
(previous year: cHF 5). if the reduction in par value from cHF 15 to cHF 10 is aproved, the respective settlement<br />
will be processed during the third quarter of 2010.<br />
109
110<br />
Financial REpoRt<br />
REpoRt oF tHE StatUtoRY aUditoR<br />
6 REPORT OF THE STaTuTORy auDITOR<br />
<strong>Report</strong> of the Statutory auditor on the Financial Statements to the<br />
General meeting of Shareholders of INTERROLL HOLDING LTD,<br />
Sant’antonino<br />
as statutory auditor, we have audited the accompanying financial statements of intERRoll Holding ltd,<br />
presented on pages 100 to 109, which comprise the balance sheet, income statement, statement of changes<br />
in equity and notes for the year ended december 31, <strong>2009</strong>.<br />
Board of Directors’ Responsibility<br />
the board of directors is responsible for the preparation of the financial statements in accordance with the<br />
requirements of Swiss law and the company’s articles of incorporation. this responsibility includes designing,<br />
implementing and maintaining an internal control system relevant to the preparation of financial statements that<br />
are free from material misstatement, whether due to fraud or error. the board of directors is further responsible<br />
for selecting and applying appropriate accounting policies and making accounting estimates that are reasonable<br />
in the circumstances.<br />
auditor’s Responsibility<br />
our responsibility is to express an opinion on these financial statements based on our audit. we conducted<br />
our audit in accordance with Swiss law and Swiss auditing Standards. those standards require that we plan<br />
and perform the audit to obtain reasonable assurance whether the financial statements are free from material<br />
misstatement.<br />
an audit involves performing procedures to obtain audit evidence about the amounts and disclosures in the<br />
financial statements. the procedures selected depend on the auditor’s judgment, including the assessment of<br />
the risks of material misstatement of the financial statements, whether due to fraud or error. in making those<br />
risk assessments, the auditor considers the internal control system relevant to the entity’s preparation of the<br />
financial statements in order to design audit procedures that are appropriate in the circumstances, but not for<br />
the purpose of expressing an opinion on the effectiveness of the entity’s internal control system. an audit also<br />
includes evaluating the appropriateness of the accounting policies used and the reasonableness of accounting<br />
estimates made, as well as evaluating the overall presentation of the financial statements. we believe that the<br />
audit evidence we have obtained is sufficient and appropriate to provide a basis for our audit opinion.<br />
Opinion<br />
in our opinion, the financial statements for the year ended december 31, <strong>2009</strong> comply with Swiss law and the<br />
company’s articles of incorporation.
Financial REpoRt<br />
REpoRt oF tHE StatUtoRY aUditoR oF intERRoll Holding ltd.<br />
<strong>Report</strong> on Other Legal Requirements<br />
we confirm that we meet the legal requirements on licensing according to the auditor oversight act (aoa) and<br />
independence (article 728 co and article 11 aoa) and that there are no circumstances incompatible with our<br />
independence.<br />
in accordance with article 728a paragraph 1 item 3 co and Swiss auditing Standard 890, we confirm that an<br />
internal control system exists, which has been designed for the preparation of financial statements according<br />
to the instructions of the board of directors.<br />
we further confirm that the proposed appropriation of available earnings complies with Swiss law and the company’s<br />
articles of incorporation. we recommend that the financial statements submitted to you be approved.<br />
KpMg ag<br />
christoph Schwarz Samuel dini<br />
licensed audit Expert<br />
auditor in charge<br />
licensed audit Expert<br />
lugano, March 3, 2010<br />
111
Imprint<br />
Concept and coordination:<br />
<strong>Interroll</strong> Holding Ltd., Investor Relations<br />
Layout/DTP:<br />
Victor Hotz AG, Corporate Publishing & Print, Steinhausen<br />
The <strong>Annual</strong> <strong>Report</strong> was translated from the German original version.<br />
Dieser Geschäftsbericht liegt auch in der deutschen Originalfassung vor.<br />
<strong>Interroll</strong> Holding Ltd.<br />
Via Gorelle 3<br />
CH 6592 Sant’Antonino, Switzerland<br />
Tel. +41 91 850 25 25<br />
Fax +41 91 850 25 05<br />
www.interroll.com<br />
www.interroll.com/ir (Investor Relations)<br />
Contact<br />
Paul Zumbühl<br />
CEO<br />
Tel. +41 91 850 25 25<br />
investor.relations@interroll.com