Annual report 2006-2007 - Taranaki Regional Council
Annual report 2006-2007 - Taranaki Regional Council Annual report 2006-2007 - Taranaki Regional Council
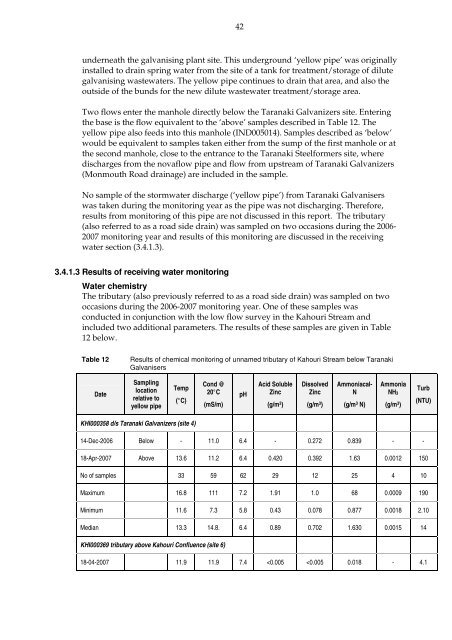
42 underneath the galvanising plant site. This underground ‘yellow pipe’ was originally installed to drain spring water from the site of a tank for treatment/storage of dilute galvanising wastewaters. The yellow pipe continues to drain that area, and also the outside of the bunds for the new dilute wastewater treatment/storage area. Two flows enter the manhole directly below the Taranaki Galvanizers site. Entering the base is the flow equivalent to the ‘above’ samples described in Table 12. The yellow pipe also feeds into this manhole (IND005014). Samples described as ‘below’ would be equivalent to samples taken either from the sump of the first manhole or at the second manhole, close to the entrance to the Taranaki Steelformers site, where discharges from the novaflow pipe and flow from upstream of Taranaki Galvanizers (Monmouth Road drainage) are included in the sample. No sample of the stormwater discharge (‘yellow pipe’) from Taranaki Galvanisers was taken during the monitoring year as the pipe was not discharging. Therefore, results from monitoring of this pipe are not discussed in this report. The tributary (also referred to as a road side drain) was sampled on two occasions during the 2006- 2007 monitoring year and results of this monitoring are discussed in the receiving water section (3.4.1.3). 3.4.1.3 Results of receiving water monitoring Water chemistry The tributary (also previously referred to as a road side drain) was sampled on two occasions during the 2006-2007 monitoring year. One of these samples was conducted in conjunction with the low flow survey in the Kahouri Stream and included two additional parameters. The results of these samples are given in Table 12 below. Table 12 Results of chemical monitoring of unnamed tributary of Kahouri Stream below Taranaki Galvanisers Date Sampling location relative to yellow pipe Temp (°C) KHI000358 d/s Taranaki Galvanizers (site 4) Cond @ 20°C (mS/m) pH Acid Soluble Zinc (g/m 3 ) Dissolved Zinc (g/m 3 ) Ammoniacal- N (g/m 3 N) Ammonia NH3 14-Dec-2006 Below - 11.0 6.4 - 0.272 0.839 - - 18-Apr-2007 Above 13.6 11.2 6.4 0.420 0.392 1.63 0.0012 150 No of samples 33 59 62 29 12 25 4 10 Maximum 16.8 111 7.2 1.91 1.0 68 0.0009 190 Minimum 11.6 7.3 5.8 0.43 0.078 0.877 0.0018 2.10 Median 13.3 14.8. 6.4 0.89 0.702 1.630 0.0015 14 KHI000369 tributary above Kahouri Confluence (site 6) 18-04-2007 11.9 11.9 7.4
Date ANZECC guideline USEPA guideline Sampling location relative to yellow pipe Protection 95% 90% Temp (°C) Cond @ 20°C (mS/m) 43 pH Acid Soluble Zinc (g/m 3 ) - - - - *at hardness of 30 g/m 3 CaCO3; ** at hardness of 25 g/m 3 CaCO3 Dissolved Zinc (g/m 3 ) 0.008* 0.015* Ammoniacal- N (g/m 3 N) Ammonia NH3 (g/m 3 ) Turb (NTU) 2.49 - - - - - 0.033** - - - The dissolved zinc concentration in the tributary below Taranaki Galvanizers was below the median of values recorded at this site to date on both sampling occasions. All samples were taken when the yellow novaflow pipe was not discharging, and therefore indicated background concentrations. Historically, zinc concentrations generally decreased during the 1990’s, but appear to have remained relatively constant since then, varying between the detection limit of 0.005 g/m 3 and 1 g/m 3 (Figure 13). Zinc (g/m 3 ) 2.5 2 1.5 1 0.5 0 Jan-88 Zinc concentrations in tributary d/s of Taranaki Galvanizers KHI000358 Jan-90 Jan-92 Jan-94 Jan-96 Jan-98 Jan-00 Jan-02 Zinc Acid Soluble Zinc Dissolved Jan-04 Jan-06 Figure 13 Zinc concentrations in a tributary of the Kahouri Stream downstream of the Taranaki Galvanizers site (includes both above and below sites) Both ammoniacal nitrogen and conductivity in the tributary have shown a general decreasing trend over time (Figure 14 and Figure 15). The ammoniacal nitrogen concentration in the samples collected during the 2006-2007 monitoring year were equal to or below the median of values from the 25 samples collected previously, continuing the trend of recent years. Conductivity has generally been stable since 1996, with 2006-2007 results remaining below the median of previous samples collected to date (Figure 15 and Table 12). In general, water quality within the mixing zone of the galvanizers discharge appears to be improving.
- Page 7 and 8: ii 2.7 Recommendations 37 3. Tarana
- Page 9 and 10: iv 6.6.4 Recommendations from the 2
- Page 11 and 12: vi List of tables Table 1 Resource
- Page 13: Figure 6 Biological oxygen demand (
- Page 16 and 17: Section 11 presents recommendations
- Page 18 and 19: 1.2.1 Other resource consents A tot
- Page 20 and 21: Figure 1 Biological and chemical mo
- Page 22 and 23: 2. Taranaki Abattoir Co (1992) Limi
- Page 24 and 25: 10 Waste liquor and floor washings
- Page 26 and 27: 2.2.2 Water discharge permit 12 Sec
- Page 28 and 29: 24 March 2005, under Section 87(e)
- Page 30 and 31: 16 plant staff were made aware of t
- Page 32 and 33: 18 inspection, staff also outlined
- Page 34 and 35: Dissolved oxygen (g/m 3 ) 35 30 25
- Page 36 and 37: Dissolved Reactive Phosphorus (g/m3
- Page 38 and 39: 24 In comparing the results (upstre
- Page 40 and 41: 26 Biological survey The Council’
- Page 42 and 43: SQMCIs Value 7 6 5 4 3 2 1 0 A C E
- Page 44 and 45: 2.6 Discussion 2.6.1 Discussion of
- Page 46 and 47: Table 7 Summary of performance for
- Page 48 and 49: 34 Condition requirement Means of m
- Page 50 and 51: 36 1. THAT monitoring of air emissi
- Page 52 and 53: 3. Taranaki Galvanizers 3.1 Process
- Page 54 and 55: Special condition 4 defines the mix
- Page 58 and 59: NH 4 -N (g/m 3 ) 44 Ammoniacal nitr
- Page 60 and 61: 3.4.2 Air 46 Air monitoring in the
- Page 62 and 63: 48 Table 14 Summary of performance
- Page 64 and 65: 4. Egmont Tanneries Limited 4.1 Pro
- Page 66 and 67: permit was issued by the Taranaki R
- Page 68 and 69: 54 An additional inspection was und
- Page 70 and 71: 56 Table 16 Results of summer low-f
- Page 72 and 73: 58 In the 2006-2007 year, there was
- Page 74 and 75: Table 19 Summary of performance for
- Page 76 and 77: 62 In the case of Egmont Tanneries,
- Page 78 and 79: 5.3 Monitoring programme The monito
- Page 80 and 81: 66 Water chemistry The chemical wat
- Page 82 and 83: Table 22 Summary of performance for
- Page 84 and 85: 6. Contact Energy Limited (closed p
- Page 86 and 87: 72 not suggest that discharges from
- Page 88 and 89: 74 7. Contact Energy Limited (CCPS)
- Page 90 and 91: 7.3.2 Biomonitoring surveys 76 One
- Page 92 and 93: 78 Condition requirement Means of m
- Page 94 and 95: 8. Fletcher Concrete & Infrastructu
- Page 96 and 97: 8.3.2 Chemical sampling 82 The Tara
- Page 98 and 99: 84 The stream at this site had a cl
- Page 100 and 101: 8.6.5 Alterations to monitoring pro
- Page 102 and 103: 88 what effects the discharge shall
- Page 104 and 105: 90 Incidents may be alleged to be a
42<br />
underneath the galvanising plant site. This underground ‘yellow pipe’ was originally<br />
installed to drain spring water from the site of a tank for treatment/storage of dilute<br />
galvanising wastewaters. The yellow pipe continues to drain that area, and also the<br />
outside of the bunds for the new dilute wastewater treatment/storage area.<br />
Two flows enter the manhole directly below the <strong>Taranaki</strong> Galvanizers site. Entering<br />
the base is the flow equivalent to the ‘above’ samples described in Table 12. The<br />
yellow pipe also feeds into this manhole (IND005014). Samples described as ‘below’<br />
would be equivalent to samples taken either from the sump of the first manhole or at<br />
the second manhole, close to the entrance to the <strong>Taranaki</strong> Steelformers site, where<br />
discharges from the novaflow pipe and flow from upstream of <strong>Taranaki</strong> Galvanizers<br />
(Monmouth Road drainage) are included in the sample.<br />
No sample of the stormwater discharge (‘yellow pipe’) from <strong>Taranaki</strong> Galvanisers<br />
was taken during the monitoring year as the pipe was not discharging. Therefore,<br />
results from monitoring of this pipe are not discussed in this <strong>report</strong>. The tributary<br />
(also referred to as a road side drain) was sampled on two occasions during the <strong>2006</strong>-<br />
<strong>2007</strong> monitoring year and results of this monitoring are discussed in the receiving<br />
water section (3.4.1.3).<br />
3.4.1.3 Results of receiving water monitoring<br />
Water chemistry<br />
The tributary (also previously referred to as a road side drain) was sampled on two<br />
occasions during the <strong>2006</strong>-<strong>2007</strong> monitoring year. One of these samples was<br />
conducted in conjunction with the low flow survey in the Kahouri Stream and<br />
included two additional parameters. The results of these samples are given in Table<br />
12 below.<br />
Table 12 Results of chemical monitoring of unnamed tributary of Kahouri Stream below <strong>Taranaki</strong><br />
Galvanisers<br />
Date<br />
Sampling<br />
location<br />
relative to<br />
yellow pipe<br />
Temp<br />
(°C)<br />
KHI000358 d/s <strong>Taranaki</strong> Galvanizers (site 4)<br />
Cond @<br />
20°C<br />
(mS/m)<br />
pH<br />
Acid Soluble<br />
Zinc<br />
(g/m 3 )<br />
Dissolved<br />
Zinc<br />
(g/m 3 )<br />
Ammoniacal-<br />
N<br />
(g/m 3 N)<br />
Ammonia<br />
NH3<br />
14-Dec-<strong>2006</strong> Below - 11.0 6.4 - 0.272 0.839 - -<br />
18-Apr-<strong>2007</strong> Above 13.6 11.2 6.4 0.420 0.392 1.63 0.0012 150<br />
No of samples 33 59 62 29 12 25 4 10<br />
Maximum 16.8 111 7.2 1.91 1.0 68 0.0009 190<br />
Minimum 11.6 7.3 5.8 0.43 0.078 0.877 0.0018 2.10<br />
Median 13.3 14.8. 6.4 0.89 0.702 1.630 0.0015 14<br />
KHI000369 tributary above Kahouri Confluence (site 6)<br />
18-04-<strong>2007</strong> 11.9 11.9 7.4


