

Gwadar - Government of Balochistan
Gwadar - Government of Balochistan
Gwadar - Government of Balochistan

Create successful ePaper yourself
Turn your PDF publications into a flip-book with our unique Google optimized e-Paper software.
3 DEMOGRAPHY AND HOUSING<br />
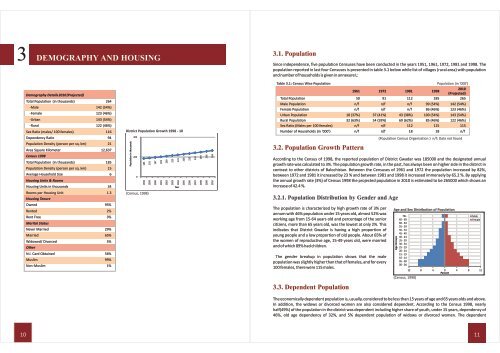
Demography Details 2010 (Projected)<br />
Total Population (in thousands) 264<br />
-Male 142 (54%)<br />
-Female 123 (46%)<br />
-Urban 143 (54%)<br />
-Rural 122 (46%)<br />
Sex Ratio (males/ 100 females) 116<br />
Dependency Ratio 94<br />
Population Density (person per sq. km) 21<br />
Area Square Kilometer 12,637<br />
Census 1998<br />
Total Population (in thousands) 185<br />
Population Density (person per sq. km) 15<br />
Average Household Size 6<br />
Housing Units & Rooms<br />
Housing Units in thousands 34<br />
Rooms per Housing Unit 1.3<br />
Housing Tenure<br />
Owned 95%<br />
Rented 2%<br />
Rent Free 3%<br />
Marital Status<br />
Never Married 29%<br />
Married 65%<br />
Widowed/ Divorced 5%<br />
Other<br />
N.I. Card Obtained 56%<br />
Muslim 99%<br />
Non-Muslim 1%<br />
District Population Growth 1998 - 10<br />
Population in thousands<br />
400<br />
200<br />
0<br />
185<br />
1998<br />
(Census, 1998)<br />
191<br />
1999<br />
197<br />
2000<br />
203<br />
2001<br />
209<br />
2002<br />
215<br />
2003<br />
221<br />
2004<br />
Year<br />
228<br />
2005<br />
235<br />
2006<br />
242<br />
2007<br />
249<br />
2008<br />
256<br />
2009<br />
264<br />
2010<br />
3.1. Population<br />
Since independence, five population Censuses have been conducted in the years 1951, 1961, 1972, 1981 and 1998. The<br />
population reported in last four Censuses is presented in table 3.1 below while list <strong>of</strong> villages (rural area) with population<br />
and number <strong>of</strong> households is given in annexure L:<br />
Table 3.1: Census Wise Population Population (in '000')<br />
1961 1972 1981 1998<br />
2010<br />
(Projected)<br />
Total Population 50 91 112 185 265<br />
Male Population n/f n/f n/f 99 (54%) 142 (54%)<br />
Female Population n/f n/f n/f 86 (46%) 123 (46%)<br />
Urban Population 18 (37%) 37 (41%) 43 (38%) 100 (54%) 143 (54%)<br />
Rural Population 32 (63%) 54 (59%) 69 (62%) 85 (46%) 122 (46%)<br />
Sex Ratio (Males per 100 females) n/f n/f 112 115 115<br />
Number <strong>of</strong> Households (in ‘000’) n/f n/f 18 18 n/f<br />
3.2. Population Growth Pattern<br />
According to the Census <strong>of</strong> 1998, the reported population <strong>of</strong> District <strong>Gwadar</strong> was 185000 and the designated annual<br />
growth rate was calculated to 3%. The population growth rate, in the past, has always been on higher side in the district in<br />
contrast to other districts <strong>of</strong> <strong>Balochistan</strong>. Between the Censuses <strong>of</strong> 1961 and 1972 the population increased by 82%,<br />
between 1972 and 1981 it increased by 23 % and between 1981 and 1998 it increased immensely by 65.2 %. By applying<br />
the annual growth rate (3%) <strong>of</strong> Census 1998 the projected population in 2010 is estimated to be 265000 which shows an<br />
increase <strong>of</strong> 42.4 %.<br />
3.2.1. Population Distribution by Gender and Age<br />
The population is characterized by high growth rate <strong>of</strong> 3% per<br />
annum with 46% population under 15 years old, almost 52% was<br />
working age from 15-64 years old and percentage <strong>of</strong> the senior<br />
citizens, more than 65 years old, was the lowest at only 2%. This<br />
indicates that District <strong>Gwadar</strong> is having a high proportion <strong>of</strong><br />
young people and a low proportion <strong>of</strong> old people. About 65% <strong>of</strong><br />
the women <strong>of</strong> reproductive age, 15-49 years old, were married<br />
and <strong>of</strong> which 89% had children.<br />
The gender breakup in population shows that the male<br />
population was slightly higher than that <strong>of</strong> females, and for every<br />
100 females, there were 115 males.<br />
3.3. Dependent Population<br />
(Population Census Organization ) n/f: Data not found<br />
Age and Sex Distribution <strong>of</strong> Population<br />
10 11<br />
Age Groups<br />
70+<br />
65 - 69<br />
60 - 64<br />
55 - 59<br />
50 - 54<br />
45 - 49<br />
40 - 44<br />
35 - 39<br />
30 - 34<br />
25 - 29<br />
20 - 24<br />
15 - 19<br />
10 - 14<br />
05 - 09<br />
00 - 04<br />
(Census, 1998)<br />
Male<br />
Female<br />
12 8 4 0 4 8 12<br />
Percent<br />
The economically dependent population is, usually, considered to be less than 15 years <strong>of</strong> age and 65 years olds and above.<br />
In addition, the widows or divorced women are also considered dependent. According to the Census 1998, nearly<br />
half(49%) <strong>of</strong> the population in the district was dependent including higher share <strong>of</strong> youth, under 15 years, dependency <strong>of</strong><br />
46%, old age dependency <strong>of</strong> 32%, and 5% dependent population <strong>of</strong> widows or divorced women. The dependent