Untitled - Clpdigital.org
Untitled - Clpdigital.org Untitled - Clpdigital.org
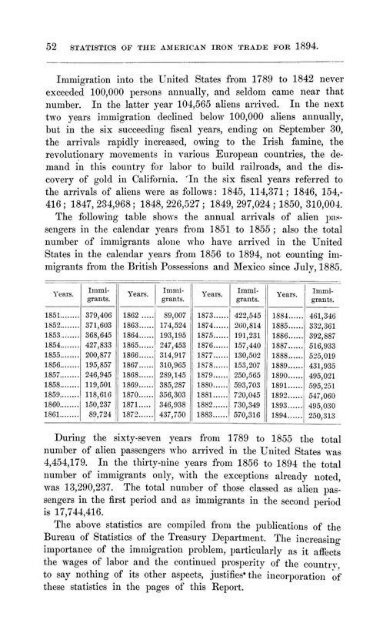
52 STATISTICS OF THE AMERICAN IRON TRADE FOR 1894. Immigration into the United States from 1789 to 1842 never exceeded 100,000 persons annually, and seldom came near that number. In the latter year 104,565 aliens arrived. In the next two years immigration declined below 100,000 aliens annually, but in the six succeeding fiscal years, ending on September 30, the arrivals rapidly increased, owing to the Irish famine, the revolutionary movements in various European countries, the demand in this country for labor to build railroads, and the discovery of gold in California. 'In the six fiscal years referred to the arrivals of aliens were as follows: 1845, 114,371; 1846, 154,- 416; 1847,234,968; 1848,226,527; 1849, 297,024 ; 1850, 310,004. The following table shows the annua! arrivals of alien passengers in the calendar years from 1851 to 1855; also the total number of immigrants alone who have arrived in the United States in the calendar years from 1856 to 1894, not counting immigrants from the British Possessions and Mexico since July, 1885. 1851 1852 1853 1854 1855 1856 1858 1859. 1860. 1861 11..1U i - 379,406 371,603 368,645 427,833 200,877 195,857 1862 1863 1864 1865 1866 1867 246,945 ', 1863 119,501 ' 1869 118,616 1870 150,237 j- 1871 89,724 j 1872 I milligram*. S9.O07 174,524 193,195 247,453 Years. 1873 1874 1875 1876 314,917 1877 310,965 F 1S78 289,145 1879 385,287 356,303 346,938 437,750 1880 1881 1882 1883 Iimni Smuts. 422,545 260,814 191,231 Wat*. 1"! 1885 1 1886 157,440 ! 1887 130,502 | 1888 153,207 | 1889 250,565 593,703 720,045 730,349 570,316 1890 1891 1892 1S93 1S94 Immigrant-. 461,346 332,361 392,887 516,933 525,019 431,935 495,021 595,251 547,060 495,030 250,313 During the sixty-seven years from 1789 to 1855 the total number of alien passengers who arrived in the United States was 4,454,179. In the thirty-nine years from 1856 to 1894 the total number of immigrants only, with the exceptions already noted, was 13,290,237. The total number of those classed as alien passengers in the first period and as immigrants in the second period is 17,744,416. The above statistics arc compiled from the publications of the Bureau of Statistics of the Treasury Department. The increasing importance of the immigration problem, particularly as it affects the wages of labor and the continued prosjierity of the country to say nothing of its other aspects, justifies" the incorporation of these statistics in the pages of this Report.
STATISTICS OF THE AMERICAN IRON TRADE FOR 1894. 58 SUMMARY OF THE FOREGOING STATISTICS FOR 1893 AND 1894. Subject!*. isvi. Production of Pig Iron, gross tons Production of Spiegeleisen and Ferro-manganese, in 7,124,502 6,657,3ns cluded in Pig Iron, gross tons 81,118 Production of Bar, Hoop, Skelp, and Structural Iron 120,180 and Steel, gross tons. Production of Iron aud Steel Structural Ships, in 2,491,497 2,301,471 cluded above, gross tons... 387,307 505,901 Production of Iron and Steel Wire Rods, gross ton*. Production of Plate and Sheet Iron and Steel, except 537,272 673.402 Nail Plate, grosa tons 674,345 6S2,900 Productiou of Cut Nails and Cut Spikes, kegs of 100 pounds 3,048,933 2,425,060 Production of Iron and Steel Wire Nails, kegs of 100 pounds 5,09->,94.-. 5,681,801 Production of all Rolled Iron and Steel, including Nails and excluding Kails, gross tons 3,839,227 3,766,035 Production of all Rolled Iron and Steel, including both Nails aud Rails 4,975,685 4,7S7,S07 Production of Bessemer Steel Rails, gross tons. 1,129,400 1,016,013 Production of Open-hearth Steel Rails, grass tons 968 1,085 Production of Iron Rails, gross tons 6.090 4,674 Total production of Rails, gross tons 1,136,458 1,021,772 Production of Street Rails, included above, gross tons, 133,423 157,457 Production of Bessemer Steel Ingots, gross tons 3,215,686 3,571,313 Production of Open-hearth Steel Ingots, gross tons... ' 737,890 784,936 Production of Crucible Steel Ingots, gross tons 63,613 51,702 Production of Blister and Patented Steel, gross tons 2,806 4,081 Productiou of all kinds of Crude Steel, gross tons.... Production of Ore, Pig, and Scrap Blooms for sale, 4,019.995 4,412,032 gross tons 7,469 3,261 Production of Tinplates for year ended June 30, lbs.. 99,319,202 139,223,467 Value of Imports of Iron and Steel $29,656,539 $20,843,576 Value of Kxports of Iron and Steel $30,159,363 $29,943,729 Production of Iron Ore, gross tons 11,587,629 11,879,679 Imports of Iron Ore, gross tons 526,951 167,307 Total Consumption of Iron Ore. gross tons Shipments of Anthracite Coal from the Mines in 13,480,000 12,235,000 Pennsylvania, gross tons 43,089,537 41,391,200 Imports of Anthracite and Bituminous Coal, gross tons , 1,162,304 1,334,1 sj Exports of Anthracite and Bituminous Coal, gross tons .! 3,658,878 Iron and Steel Shij>s built in the fiscal year ended 3,636,341 June 30 65 39 Miles of new Railroad completed 2,828 L'.HI.J Immigrants iu the year ended December 31 495,030 250,313
- Page 6 and 7: \ k .?.- Entered, according to act
- Page 8 and 9: CONTENTS. Number of Furnaces in Bla
- Page 11 and 12: LETTER TO THE PRESIDENT. HON. B. F.
- Page 13 and 14: IRON AND STEEL NECROLOGY. FROM SEPT
- Page 15 and 16: IRON AND STEEL NECROLOGY. 11 Phoeni
- Page 17: IRON AND STEEL NECROLOGY. 1 U Dudge
- Page 20 and 21: 16 STATISTICS OF THE AMERICAN IKON
- Page 22 and 23: 18 STATISTICS OF THE AMERICAN IRON
- Page 24 and 25: 20 STATISTICS OP THE AMERICAN IRON
- Page 26 and 27: 22 STATISTICS OF THE AMERICAN IRON
- Page 28 and 29: 24 STATISTICS OF THE AMERICAN IRON
- Page 30 and 31: 26 STATISTICS OF THE AMERICAN IRON
- Page 32 and 33: 28 STATISTICS OF THE AMERICAN IRON
- Page 34 and 35: 30 STATISTICS OF THE AMERICAN IRON
- Page 36 and 37: 32 STATISTICS OF THE AMERICAN IKON
- Page 38 and 39: 34 STATISTICS OF THE AMERICAN IRON
- Page 40 and 41: 36 STATISTICS OF THE AMERICAN IRON
- Page 42 and 43: 38 STATISTICS OF THE AMERICAN IRON
- Page 44 and 45: 40 STATISTICS OF THE AMERICAN IRON
- Page 46 and 47: 42 STATISTICS OF THE AMERICAN IKON
- Page 48 and 49: 44 STATISTICS OF THE AMERICAN IRON
- Page 50 and 51: 46 STATISTICS OF THE AMERICAN IRON
- Page 52 and 53: 48 STATISTICS OF THE AMERICAS IRON
- Page 54 and 55: 50 STATISTICS OF THE AMERICAN IKON
- Page 58 and 59: 54 STATISTICS OF THE AMERICAN IRON
- Page 60 and 61: 56 STATISTICS OF THE AMERICAN IRON
- Page 62 and 63: 58 STATISTICS OF THE AMERICAN IRON
- Page 64 and 65: IRON ORE, COAL, PIG IRON, AND be fo
- Page 66 and 67: IRON ORE, COAL, PIG IRON, AND iron
- Page 68 and 69: IRON ORE, COAL, PIG IRON, AND The f
- Page 70 and 71: IRON ORE, COAL, PIG IRON, AND the f
- Page 72 and 73: Ill IRON ORE, COAL, TIG IRON, AND S
- Page 74 and 75: 12 IRON ORE, COAL, PIO IRON, ANI> T
- Page 76 and 77: 11 IRON ORE, COAL, PIO IRON, AND 18
- Page 78 and 79: 16 IRON ORE, COAL. PIG IRON, AND Th
- Page 80 and 81: IS IRON ORE, COAL, PIG IBOS, AM' GR
- Page 82 and 83: 20 IRON ORE, COAL, PIG IRON, AND ti
- Page 84 and 85: 9.9 IRON ORE, COAL, PIG IRON, AND Y
- Page 86 and 87: 24 IRON ORE, COAL, PIG IRON, ANI> Y
- Page 88 and 89: 28 IKON ORE, COAL, PIU lltON, AND F
- Page 90 and 91: 28 IRON ORE. COAL, PIC. IRON, AND B
- Page 92 and 93: SO IKON ORE, COAL, PIO IRON, AND BW
- Page 94 and 95: 32 IRON ORE, COAL, PIG IRON. ANIl Y
- Page 96 and 97: 34 IRON ORE, COAL, PIG IRON, AND St
- Page 98 and 99: ::r, IRON ORE, COAL, PIG IRON, AND
- Page 100: 38 SUMMARY, SUMMARY. The following
52 STATISTICS OF THE AMERICAN IRON TRADE FOR 1894.<br />
Immigration into the United States from 1789 to 1842 never<br />
exceeded 100,000 persons annually, and seldom came near that<br />
number. In the latter year 104,565 aliens arrived. In the next<br />
two years immigration declined below 100,000 aliens annually,<br />
but in the six succeeding fiscal years, ending on September 30,<br />
the arrivals rapidly increased, owing to the Irish famine, the<br />
revolutionary movements in various European countries, the demand<br />
in this country for labor to build railroads, and the discovery<br />
of gold in California. 'In the six fiscal years referred to<br />
the arrivals of aliens were as follows: 1845, 114,371; 1846, 154,-<br />
416; 1847,234,968; 1848,226,527; 1849, 297,024 ; 1850, 310,004.<br />
The following table shows the annua! arrivals of alien passengers<br />
in the calendar years from 1851 to 1855; also the total<br />
number of immigrants alone who have arrived in the United<br />
States in the calendar years from 1856 to 1894, not counting immigrants<br />
from the British Possessions and Mexico since July, 1885.<br />
1851<br />
1852<br />
1853<br />
1854<br />
1855<br />
1856<br />
1858<br />
1859.<br />
1860.<br />
1861<br />
11..1U i -<br />
379,406<br />
371,603<br />
368,645<br />
427,833<br />
200,877<br />
195,857<br />
1862<br />
1863<br />
1864<br />
1865<br />
1866<br />
1867<br />
246,945 ', 1863<br />
119,501 ' 1869<br />
118,616 1870<br />
150,237 j- 1871<br />
89,724 j 1872<br />
I milligram*.<br />
S9.O07<br />
174,524<br />
193,195<br />
247,453<br />
Years.<br />
1873<br />
1874<br />
1875<br />
1876<br />
314,917 1877<br />
310,965 F 1S78<br />
289,145 1879<br />
385,287<br />
356,303<br />
346,938<br />
437,750<br />
1880<br />
1881<br />
1882<br />
1883<br />
Iimni<br />
Smuts.<br />
422,545<br />
260,814<br />
191,231<br />
Wat*.<br />
1"!<br />
1885<br />
1 1886<br />
157,440 ! 1887<br />
130,502 | 1888<br />
153,207 | 1889<br />
250,565<br />
593,703<br />
720,045<br />
730,349<br />
570,316<br />
1890<br />
1891<br />
1892<br />
1S93<br />
1S94<br />
Immigrant-.<br />
461,346<br />
332,361<br />
392,887<br />
516,933<br />
525,019<br />
431,935<br />
495,021<br />
595,251<br />
547,060<br />
495,030<br />
250,313<br />
During the sixty-seven years from 1789 to 1855 the total<br />
number of alien passengers who arrived in the United States was<br />
4,454,179. In the thirty-nine years from 1856 to 1894 the total<br />
number of immigrants only, with the exceptions already noted,<br />
was 13,290,237. The total number of those classed as alien passengers<br />
in the first period and as immigrants in the second period<br />
is 17,744,416.<br />
The above statistics arc compiled from the publications of the<br />
Bureau of Statistics of the Treasury Department. The increasing<br />
importance of the immigration problem, particularly as it affects<br />
the wages of labor and the continued prosjierity of the country<br />
to say nothing of its other aspects, justifies" the incorporation of<br />
these statistics in the pages of this Report.


