Untitled - Clpdigital.org
Untitled - Clpdigital.org
Untitled - Clpdigital.org

You also want an ePaper? Increase the reach of your titles
YUMPU automatically turns print PDFs into web optimized ePapers that Google loves.
STATISTICS OP THE AMERICAN IRON TRADE FOR 1894. 61<br />
STATISTICS OK IMMIGRATION.<br />
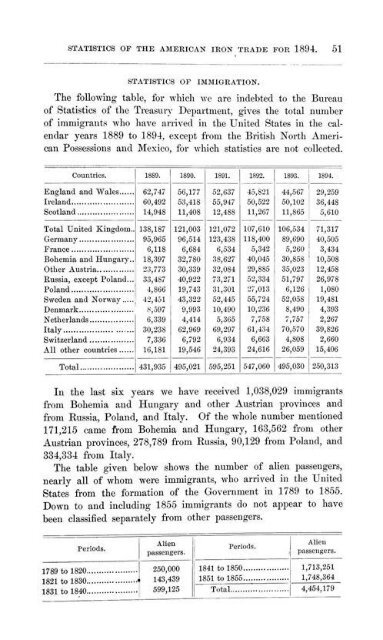
The following table, for which we are indebted to the Bureau<br />
of Statistics of the Treasury Department, gives the total number<br />
of immigrants who have arrived in the United States in the calendar<br />
years 1889 to 1894, except from the British North American<br />
Possessions and Mexico, for which statistics are not collected.<br />
Countries.<br />
England and Wales.<br />
Ireland<br />
Scotland<br />
62,747<br />
60,492<br />
14,943<br />
1690.<br />
56,177 52,637 45,821<br />
53.41S 55,947 50,522<br />
11,408 12,488 11,267<br />
ISiM.<br />
44,567 29,259<br />
50,102 36,448<br />
11,665 5,610<br />
Total United Kingdom. 138,187 121,003 121,072 107,610 106,534 71,317<br />
Germany<br />
95,965 96,514 123,438 11S.4I.I0 89,690 40,505<br />
France<br />
6,118 6,684 6,534 5,342 5,260 3,434<br />
Bohemia and Hungary.. 18,397 32,780 38,627 40,045 30,858 10,508<br />
Other Austria<br />
23,773 30,339 32,084 29.8S5 35,023 12,458<br />
Russia, except Poland... 33,437 40,922 73.271 52,334 51,797 26,978<br />
Poland<br />
4.S66 19,743 31,301 27,013 6,126 1,080<br />
Sweden and Norway 42,451 43,322 52,445 55,724 52.05S 19,481<br />
Denmark<br />
V>97 9,993 10,490 10,236 8,490 4,393<br />
Netherlands<br />
6,339 4,414 5,365 7,758 7,757<br />
Italy<br />
Switzerland<br />
All other countries<br />
Total-<br />
30,238<br />
6,792<br />
69,297 61,434 70,570 2,660<br />
7,336 19,546 6,934 6,663 4,803 15,406<br />
16,181<br />
24,393 24,616 26,059<br />
431,935 495,021 595,251 547,060 495,030 250,313<br />
Iii the last six years we have received 1,038,029 immigrants<br />
from Bohemia and Hungary and other Austrian provinces and<br />
from Russia, Poland, and Italy. Of the whole number mentioned<br />
171,215 came from Bohemia and Hungary, 163,562 from other<br />
Austrian provinces, 278,789 from Russia, 90,129 from Poland, and<br />
334,334 from Italy.<br />
The table given below shows the number of alien ]>assengers,<br />
nearly all of whom were immigrants, who arrived in the United<br />
States from the formation of the Government in 1789 to 1855.<br />
Down to and including 1855 immigrants do not appear to have<br />
been classified separately from other passengers.<br />
Periods-<br />
Allen<br />
passengers.<br />
250,000<br />
143,439<br />
599,125<br />
Period*.<br />
Allen<br />
pax»ciiteers.<br />
1,713,251<br />
1,748,364<br />
4,454,179