Untitled - Clpdigital.org
Untitled - Clpdigital.org Untitled - Clpdigital.org
34 STATISTICS OF THE AMERICAN IRON TRADE FOR 1894. of pig iron and iron-ore blooms produced, the probable consumption of iron ore for fettling in rolling mills, and the probable consumption of iron ore in open-hearth furnaces. PRODUCTION OF PIO IRON. Twenty States made pig iron in 1894, three less than in 1890, 1891, 1892, and 1893. None of the Territories make pig iron. The total production of pig iron in 1894 was 6,657,388 gross tons, against 7,124.502 tons in 1893, 9,157,000 tons in 1892, 8,- 279,870 tons in 1891, and 9,202,703 tons in 1890. The production in 1893 was 2,032,498 tons, or over 22 per cent., less than in 1892, and the production in 1894 was 467,114 tons, or over 6.5 per cent., less than in 1893. The production of pig iron in the first half of 1894 was 2,717,- 983 tons, and in the last half of 1894 it was 3,939,405 tons. The following table gives the production of pig iron by half years during the last five years, in gross tons. 1890 1891 1892 1893 1S91 Years—Gross tons. First half, Second hair. 4,560,513 3,368,107 4,769,683 4,562,918 2,717,983 4,642,190 4,911,763 4,387,317 2,561,584 3,939,405 Total. 9,202,703 8,279,870 9,157,000 7,124,502 6,657,388 The following tabic gives the production of pig iron by States in 1893 and 1894, in the order of their prominence in 1894. StiiU'*-Gros»ton*. Ohio Ahiliuinu Virginia Michigan West Virginia Colorado ims. H...i:..irj2 875,265 405,261 726,888 302,856 207,915 191,115 117,538 131,772 81.591 45,555 74,305 39.675 i-'i. 3,370,152 900,029 604,795 692,392 298,086 212,773 175.185 95,171 91,595 80,781 73,669 63,273 40,268 Stnles-Grov.1011*. Connecticut Missouri Maryland Texas Oregon Massachusetts... Indiana Xorth Caroliua.. 1893. )894. 47,501 12,478 32,360 151,773 6,267 4,739 7,853 10.373 5,567 2,843 -,124,502 33,854 7,416 6,522 5,600 4,671 1,000 156 6,657,388 Pennsylvania made over 50 per cent, of the total production of pig iron iu 1894; Ohio over 13 per cent.; Illinois over 9 per cent.
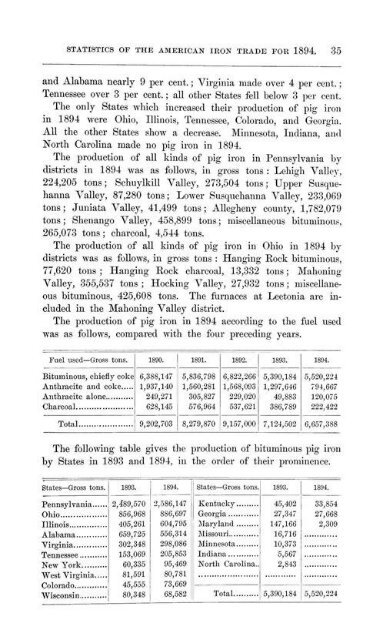
STATISTICS OF THE AMERICAN IRON TRADE FOR 1894. 35 and Alabama nearly 9 per cent.; Virginia made over 4 per cent.; Tennessee over 3 per cent.; all other States fell below 3 per cent. The only States which increased their production of pig iron in 1894 were Ohio, Illinois, Tennessee, Colorado, and Georgia. All the other Stales show a decrease. Minnesota, Indiana, and North Carolina made no pig iron in 1894. The production of all kinds of pig iron in Pennsylvania by districts in 1894 was as follows, in gross tons : Lehigh Valley. 224,205 tons; Schuylkill Valley, 273,504 tons; Upper Susquehanna Valley, 87,280 tons; Lower Susquehanna Valley, 233,069 tons; Juniata Valley, 41.499 tons; Allegheny county, 1,782,079 tons; Shenango Valley, 458,899 tons; miscellaneous bituminous. 265,073 tons; charcoal, 4,544 tons. The production of all kinds of pig iron in Ohio in 1894 by districts was as follows, in gross tons : Hanging Rock bituminous, 77,620 tons; Hanging Rock charcoal, 13,332 tons; Mahoning Valley, 355,537 tons ; Hocking Valley, 27,932 tons; miscellaneous bituminous, 425,608 tons. The furnaces al LeetOnia ore included in the Mahoning Valley district. The production of pig iron in 1894 according to the fuel used was as follows, compared with the four preceding years. Fuel used—Grew tons. Bituminous, chiefly coke 6,388,147 Anthracite and coke 1,937,140 Anthracite alone 249,271 028,145 Total 1SW. 9,202,703 1891. 5,836,798 1,560,281 305,827 576,964 1S92. 6,822,266 1,568,093 229,020 537,621 8,279,870 10,167,000 1893. 5,390,184 1,297,646 49,883 386,789 7.124,502 1894. 5,520,224 791,667 120,075 222,422 0,657,388 The following table gives the production of bituminous pig iron by States in 1893 and 1894, in the order of their prominence. fitntcs-Gross tons. Pennsylvania Ohio Illinois Alabama Virginia Tennessee New York West Virginia Colorado Wisconsin. „ !,4S9,570 856,968 405,261 659,725 302,348 153,069 60,335 81.591 45.5.V. 80,348 i-.i. 2,586,147 S86.697 604,795 556,314 298,086 205,853 95,469 80,781 73,669 68,582 States—Gross tolls, Kentucky 45,402 Georgia ' 27,347 Maryland 147,166 Missouri 16,716 Minnesota 10,373 Indiana 5,567 North Carolina., 2.843 33.S54 27,068 2,309 Total 5,390,134 5,520,224
- Page 4 and 5: SCITECH r HD9514.A5 1894 American I
- Page 6 and 7: \ k .?.- Entered, according to act
- Page 8 and 9: CONTENTS. Number of Furnaces in Bla
- Page 11 and 12: LETTER TO THE PRESIDENT. HON. B. F.
- Page 13 and 14: IRON AND STEEL NECROLOGY. FROM SEPT
- Page 15 and 16: IRON AND STEEL NECROLOGY. 11 Phoeni
- Page 17: IRON AND STEEL NECROLOGY. 1 U Dudge
- Page 20 and 21: 16 STATISTICS OF THE AMERICAN IKON
- Page 22 and 23: 18 STATISTICS OF THE AMERICAN IRON
- Page 24 and 25: 20 STATISTICS OP THE AMERICAN IRON
- Page 26 and 27: 22 STATISTICS OF THE AMERICAN IRON
- Page 28 and 29: 24 STATISTICS OF THE AMERICAN IRON
- Page 30 and 31: 26 STATISTICS OF THE AMERICAN IRON
- Page 32 and 33: 28 STATISTICS OF THE AMERICAN IRON
- Page 34 and 35: 30 STATISTICS OF THE AMERICAN IRON
- Page 36 and 37: 32 STATISTICS OF THE AMERICAN IKON
- Page 40 and 41: 36 STATISTICS OF THE AMERICAN IRON
- Page 42 and 43: 38 STATISTICS OF THE AMERICAN IRON
- Page 44 and 45: 40 STATISTICS OF THE AMERICAN IRON
- Page 46 and 47: 42 STATISTICS OF THE AMERICAN IKON
- Page 48 and 49: 44 STATISTICS OF THE AMERICAN IRON
- Page 50 and 51: 46 STATISTICS OF THE AMERICAN IRON
- Page 52 and 53: 48 STATISTICS OF THE AMERICAS IRON
- Page 54 and 55: 50 STATISTICS OF THE AMERICAN IKON
- Page 56 and 57: 52 STATISTICS OF THE AMERICAN IRON
- Page 58 and 59: 54 STATISTICS OF THE AMERICAN IRON
- Page 60 and 61: 56 STATISTICS OF THE AMERICAN IRON
- Page 62 and 63: 58 STATISTICS OF THE AMERICAN IRON
- Page 64 and 65: IRON ORE, COAL, PIG IRON, AND be fo
- Page 66 and 67: IRON ORE, COAL, PIG IRON, AND iron
- Page 68 and 69: IRON ORE, COAL, PIG IRON, AND The f
- Page 70 and 71: IRON ORE, COAL, PIG IRON, AND the f
- Page 72 and 73: Ill IRON ORE, COAL, TIG IRON, AND S
- Page 74 and 75: 12 IRON ORE, COAL, PIO IRON, ANI> T
- Page 76 and 77: 11 IRON ORE, COAL, PIO IRON, AND 18
- Page 78 and 79: 16 IRON ORE, COAL. PIG IRON, AND Th
- Page 80 and 81: IS IRON ORE, COAL, PIG IBOS, AM' GR
- Page 82 and 83: 20 IRON ORE, COAL, PIG IRON, AND ti
- Page 84 and 85: 9.9 IRON ORE, COAL, PIG IRON, AND Y
- Page 86 and 87: 24 IRON ORE, COAL, PIG IRON, ANI> Y
STATISTICS OF THE AMERICAN IRON TRADE FOR 1894. 35<br />
and Alabama nearly 9 per cent.; Virginia made over 4 per cent.;<br />
Tennessee over 3 per cent.; all other States fell below 3 per cent.<br />
The only States which increased their production of pig iron<br />
in 1894 were Ohio, Illinois, Tennessee, Colorado, and Ge<strong>org</strong>ia.<br />
All the other Stales show a decrease. Minnesota, Indiana, and<br />
North Carolina made no pig iron in 1894.<br />
The production of all kinds of pig iron in Pennsylvania by<br />
districts in 1894 was as follows, in gross tons : Lehigh Valley.<br />
224,205 tons; Schuylkill Valley, 273,504 tons; Upper Susquehanna<br />
Valley, 87,280 tons; Lower Susquehanna Valley, 233,069<br />
tons; Juniata Valley, 41.499 tons; Allegheny county, 1,782,079<br />
tons; Shenango Valley, 458,899 tons; miscellaneous bituminous.<br />
265,073 tons; charcoal, 4,544 tons.<br />
The production of all kinds of pig iron in Ohio in 1894 by<br />
districts was as follows, in gross tons : Hanging Rock bituminous,<br />
77,620 tons; Hanging Rock charcoal, 13,332 tons; Mahoning<br />
Valley, 355,537 tons ; Hocking Valley, 27,932 tons; miscellaneous<br />
bituminous, 425,608 tons. The furnaces al LeetOnia ore included<br />
in the Mahoning Valley district.<br />
The production of pig iron in 1894 according to the fuel used<br />
was as follows, compared with the four preceding years.<br />
Fuel used—Grew tons.<br />
Bituminous, chiefly coke 6,388,147<br />
Anthracite and coke 1,937,140<br />
Anthracite alone 249,271<br />
028,145<br />
Total<br />
1SW.<br />
9,202,703<br />
1891.<br />
5,836,798<br />
1,560,281<br />
305,827<br />
576,964<br />
1S92.<br />
6,822,266<br />
1,568,093<br />
229,020<br />
537,621<br />
8,279,870 10,167,000<br />
1893.<br />
5,390,184<br />
1,297,646<br />
49,883<br />
386,789<br />
7.124,502<br />
1894.<br />
5,520,224<br />
791,667<br />
120,075<br />
222,422<br />
0,657,388<br />
The following table gives the production of bituminous pig iron<br />
by States in 1893 and 1894, in the order of their prominence.<br />
fitntcs-Gross tons.<br />
Pennsylvania<br />
Ohio<br />
Illinois<br />
Alabama<br />
Virginia<br />
Tennessee<br />
New York<br />
West Virginia<br />
Colorado<br />
Wisconsin. „<br />
!,4S9,570<br />
856,968<br />
405,261<br />
659,725<br />
302,348<br />
153,069<br />
60,335<br />
81.591<br />
45.5.V.<br />
80,348<br />
i-.i.<br />
2,586,147<br />
S86.697<br />
604,795<br />
556,314<br />
298,086<br />
205,853<br />
95,469<br />
80,781<br />
73,669<br />
68,582<br />
States—Gross tolls,<br />
Kentucky 45,402<br />
Ge<strong>org</strong>ia ' 27,347<br />
Maryland 147,166<br />
Missouri 16,716<br />
Minnesota 10,373<br />
Indiana 5,567<br />
North Carolina., 2.843<br />
33.S54<br />
27,068<br />
2,309<br />
Total 5,390,134 5,520,224


