Untitled - Clpdigital.org
Untitled - Clpdigital.org
Untitled - Clpdigital.org

You also want an ePaper? Increase the reach of your titles
YUMPU automatically turns print PDFs into web optimized ePapers that Google loves.
38 SUMMARY,<br />
SUMMARY.<br />
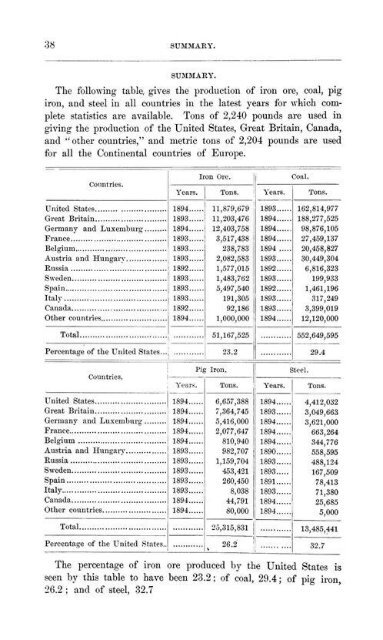
The following table, gives the production of iron ore, coal, pig<br />
iron, and steel in all countries in the latest years for which complete<br />
statistics are available. Tons of 2,240 pounds are used in<br />
giving the productiou of the United States. Great Britain, Canada,<br />
and " other countries," and metric tons of 2,204 pounds are used<br />
for all the Continental countries of Europe.<br />
United Slates<br />
fireat Britain<br />
S|win<br />
Italv<br />
Countries.<br />
Percentage of the United States..<br />
omntrtea.<br />
United States<br />
Great Britain<br />
(ii-niiiiiiy .11 nI Luwiiitnu-'.'<br />
France<br />
Belgium<br />
Austria and Hungary<br />
Russia<br />
Sweden<br />
Spain<br />
Haly<br />
Canada<br />
Other countries.......................<br />
Total.<br />
Percentage of the United States..<br />
Years.<br />
1894<br />
1893<br />
1894<br />
1893<br />
1893<br />
1893<br />
1892<br />
1893<br />
1893<br />
1893<br />
1892<br />
1894<br />
Yearn.<br />
1894.<br />
1893.<br />
1893.<br />
1893.<br />
1893.<br />
1893.<br />
1894.<br />
Iron Ore.<br />
Tons.<br />
11,879,679<br />
11,203,476<br />
12,403,758<br />
3,517,438<br />
238,783<br />
2,082,583<br />
1,577,015<br />
1,483,762<br />
5,497,640<br />
191,305<br />
92,186<br />
1,000,000<br />
Pig Iron.<br />
51,167,625<br />
23.2<br />
Year*.<br />
1893<br />
1894<br />
1894<br />
1894<br />
1894<br />
1893<br />
1892<br />
1893<br />
1892<br />
1893<br />
1893<br />
1894<br />
Coal.<br />
Ton*.<br />
162,814,977<br />
188,277,525<br />
98,876,105<br />
27,459,137<br />
20,458,827<br />
30,449,304<br />
6,816,323<br />
199,933<br />
1,461,196<br />
317,249<br />
3,399,019<br />
552,649,595<br />
seti.<br />
29.4<br />
Ton*. Year*. Tons.<br />
6,657,388<br />
7,364,745<br />
5,416,000<br />
2,077,647<br />
810,940<br />
982,707<br />
1,159,704<br />
453,421<br />
260,450<br />
8,038<br />
44,791<br />
80,000<br />
25,315,831<br />
2C.2<br />
1894 4,412,032<br />
1893 1 3,049,663<br />
1894. 3,621,000<br />
663,264<br />
1890<br />
1893<br />
1893<br />
1891<br />
1893<br />
1894<br />
1894<br />
344,776<br />
558,595<br />
488,124<br />
167,509<br />
78,413<br />
71,380<br />
25,685<br />
5,000<br />
l.;.-!-.Vin<br />
32.7<br />
The percentage of iron ore produced by the United States is<br />
seen by this table to have been 23.2; of coal, 29.4; of pig iron,<br />
26.2; and of steel, 32.7