- Page 1 and 2:
A14 ""..."W~e S~wn ofCh all il NM I
- Page 3 and 4:
WORLD CROPS: PRODUCTION, UTILIZATIO
- Page 5 and 6:
Copyright (c) 1984 by ICARDA All ri
- Page 7 and 8:
VI THIRD SESSION: WINTER SOWING Agr
- Page 9 and 10:
Foreword The advancing of sowing da
- Page 11 and 12:
Editors' Note The idea to hold this
- Page 13 and 14:
Chairman, Ladies and Gentlemen, Ope
- Page 15 and 16:
4 including stunt virus (pea leaf r
- Page 17 and 18:
6 in with Iarmers'plans and proposa
- Page 19 and 20:
8 about 130 to over 200 days, where
- Page 21 and 22:
10 Table I Mean yield and range of
- Page 23 and 24:
12 International Yield Trials A 10-
- Page 25 and 26:
14 small plots on farmers' fields i
- Page 27 and 28:
16 HANOUNIK, S.B. 1979. Diseases of
- Page 29 and 30:
18 diospores (Khune and Kapoor 1980
- Page 31 and 32:
20 2. Reproduction Asexual. The ase
- Page 33 and 34:
22 surface. However, the fungus los
- Page 35 and 36:
24 observed small reddish brown spo
- Page 37 and 38:
26 Reddy and Nene (1979) developed
- Page 39 and 40:
28 suggested the application of pot
- Page 41 and 42:
30 ASKEROV, I.B. 1968. Ascochytosis
- Page 43 and 44:
32 NEMLIENKO, F.E. and LUKASHEVICH,
- Page 45 and 46:
Proceedings ofthe Workshop on Ascoc
- Page 47 and 48:
100/ ILC 1929 90 -80./ 8o0 / ILC
- Page 49 and 50:
30 24 18 12 6 Temperature (°C) t6
- Page 51 and 52:
I I -I - --ii ' Disase Ic I ii I'll
- Page 53 and 54:
infected seed is a much more potent
- Page 55 and 56:
Proceedingsof the Workshop on Ascoc
- Page 57 and 58:
early February were found to give e
- Page 59 and 60:
pot assembly consists of a stem tha
- Page 61 and 62:
Table I A quantitative 9-point rati
- Page 63 and 64:
inoculating the plants by uniformly
- Page 65 and 66:
Proceedings ofthe Workshopon Ascoch
- Page 67 and 68:
Table I Cultural characteristics of
- Page 69 and 70:
Line/ Table 2 Disease grades produc
- Page 71 and 72:
India and Iran were highly sporulat
- Page 73 and 74:
LUTHRA, J.C. and BEDI K.S. 1932. So
- Page 75 and 76:
J.S. Grewal There are more chances
- Page 77 and 78:
68 Table I Summary of results of sc
- Page 79 and 80:
70 Table 3 Summary of results of sc
- Page 81 and 82:
72 ery originated from the USSR, Sp
- Page 83 and 84:
Table 7. Contd. Rating on 1-9 Scale
- Page 85 and 86:
Table 8 Contd. Rating on 1-9 Scale
- Page 87 and 88:
Table 9. Contd. Entry Origin Rating
- Page 89 and 90:
Table 10 Differential reaction of s
- Page 91 and 92: 82 1069, 1467, 1591 were found resi
- Page 93 and 94: 84 ing of the remaining collections
- Page 95 and 96: 86 AUJLA, S.S. 1964. Study of eleve
- Page 97 and 98: Proceedings ofthe Workshop on Ascac
- Page 99 and 100: Parents diallel cross F1 diallel cr
- Page 101 and 102: R.Pieters Malic acid is known to ha
- Page 103 and 104: 96 (Hawtin and Singh 1983). Asv.-,h
- Page 105 and 106: 98 3. Identification of as many sou
- Page 107 and 108: 100 Germ. Evaluation Disease Res. M
- Page 109 and 110: 102 Robinson (1976) has further dev
- Page 111 and 112: 104 and by the time a multilinc cul
- Page 113 and 114: 106 lines will then be made availab
- Page 115 and 116: 108 GILL, K.S., NANDA, G.S., SINGH,
- Page 117 and 118: 110 the program for the development
- Page 119 and 120: 112 where they are not present. See
- Page 121 and 122: 114 cides have been found to be eff
- Page 123 and 124: 116 indicates that this propagate i
- Page 125 and 126: 118 Great care must be exercised in
- Page 127 and 128: 120 nature. Ascochyta propagules on
- Page 129 and 130: 122 ZACHOS, D.G., PANAGOPOULOS, C.G
- Page 131 and 132: 124 0 40 g30 Max 30 20. .,,10 Min ,
- Page 133 and 134: 126 ranged from November 22, 1978 t
- Page 135 and 136: 128 Genotypes Table 2 Grain yield o
- Page 137 and 138: 130 Response to Plant Population Th
- Page 139 and 140: 132 ILC 1929 at Tel Hadya and ILC 4
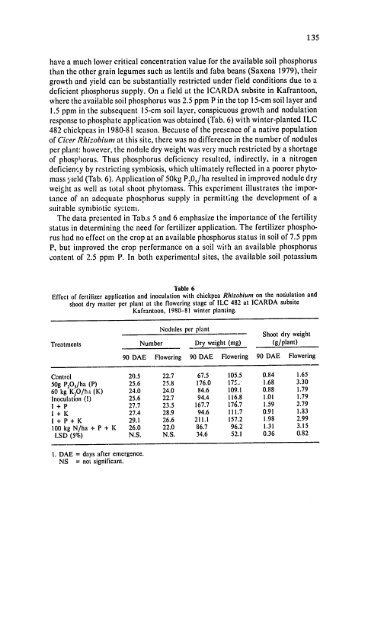
- Page 141: 134 Data in Tab. 5 emphasize the im
- Page 145 and 146: 138 Discussion F. EI-Sayed I am ass
- Page 147 and 148: Proceedings of the Workshop on Asco
- Page 149 and 150: Table I The timing of reproductive
- Page 151 and 152: Table 3 Accumulated water use by sp
- Page 153 and 154: Es x (1 - a) x Eo t where t is the
- Page 155 and 156: BRIDA cm Water /Depth Interva', 3 4
- Page 157 and 158: crops extended deeper than under wi
- Page 159 and 160: (as at Jindiress), the winter-sown
- Page 161 and 162: eduction in the size of the crop's
- Page 163 and 164: Discussion G.C. Hawtin You raised a
- Page 165 and 166: Table I Nodutation and total drymat
- Page 167 and 168: 162 Inoculation with single strain
- Page 169 and 170: 164 These results indicate that pho
- Page 171 and 172: 166 T.S. Sandhu Is there any techni
- Page 173 and 174: 168 April for Tal Abaid (36*42'N, 3
- Page 175 and 176: 170 At the end of the severe cold p
- Page 177 and 178: 172 Table 4 Origin of lines having
- Page 179 and 180: 174 stage (Tab. 6). Of the five cul
- Page 181 and 182: 176 HERZOG, H. 1978. Wachsturnsverh
- Page 183 and 184: Proeedings of the Workshop on Ascoc
- Page 185 and 186: There is little information availab
- Page 187 and 188: of the major and minor pests in thi
- Page 189 and 190: attack any other important crop pla
- Page 191 and 192: KAY, D.E. 1979. Food Legumes - Crop
- Page 193 and 194:
190 On the other hand, two items th
- Page 195 and 196:
192 M.V. Reddy It looks as if the c
- Page 197 and 198:
Country World ICARDA region Algeria
- Page 199 and 200:
196 Table 2a Export of chickpeas by
- Page 201 and 202:
198 India, Saudi Arabia, Venezuela
- Page 203 and 204:
Proceedings ofthe Workshop on Ascoc
- Page 205 and 206:
Chickpea Cultivation 203 In Syria m
- Page 207 and 208:
Table 2 Comparison of the growth, s
- Page 209 and 210:
Proceedings of the Workshop on Asco
- Page 211 and 212:
Excessive postharvest losses. Posth
- Page 213 and 214:
Proceedings of the Workshop on Asco
- Page 215 and 216:
Seedbed preparation is very minimal
- Page 217 and 218:
carried out at the same time with w
- Page 219 and 220:
Table 4 Topographical classificatio
- Page 221 and 222:
Proceedings of the Workshop on Asco
- Page 223 and 224:
were absorbed by the canning indust
- Page 225 and 226:
223 The advantages of winter sowing
- Page 227 and 228:
226 cultivars which could be plante
- Page 229 and 230:
Proceedings of the Workshop on Asco
- Page 231 and 232:
Table 2 Area, production and yicld
- Page 233 and 234:
233 Threshing is mostly done by bul
- Page 235 and 236:
182, 192,'194,1069, 1772,3279,2380,
- Page 237 and 238:
238 4. Mycosphaerella pinodes and A
- Page 239 and 240:
240 Kausar (1960) discussed the rea
- Page 241 and 242:
242 Date Tale 2 Maximum temperature
- Page 243 and 244:
244 Table 4 Maximum temperature and
- Page 245 and 246:
Proceedings of the Workshop on Asco
- Page 247 and 248:
soil moisture and therefore it is a
- Page 249 and 250:
Table 2 Characteristics of chickpea
- Page 251 and 252:
253 Table 5 Results of a trial on w
- Page 253 and 254:
Proceedings of the Workshop on Asco
- Page 255 and 256:
Conclusion Chickpea in Tunisia has
- Page 257 and 258:
260 however, remained almost static
- Page 259 and 260:
262 Agricultural Universities and s
- Page 261 and 262:
264 greatest at flowering and fruit
- Page 263 and 264:
266 Basis of Resistance Kunzru and
- Page 265 and 266:
268 Discussion M. Aslain What is yo
- Page 267 and 268:
270 vars. It was assumed that the d
- Page 269 and 270:
Proceedings of the Workshop an Asco
- Page 271 and 272:
0- 400 ha ® Em 401 -1000 ha 1001 -
- Page 273 and 274:
277 Castille and even (1500 kg/ha)
- Page 275 and 276:
Table 3 'Rabia' attacks - environme
- Page 277 and 278:
would be pure extension. Diffusion
- Page 279 and 280:
284 7. The role of crop debris as a
- Page 281 and 282:
286 involving only a few treatments
- Page 283:
288 MAKKOUK, Khalid, Faculty of Agr