- Seite 1 und 2:
Integrierte Vermeidung und Verminde
- Seite 3:
This document is one of a series of
- Seite 6 und 7:
Zusammenfassung II. Techniken, die
- Seite 8 und 9:
Zusammenfassung Parameter Volumen p
- Seite 10 und 11:
Zusammenfassung VOC in Abgasen Wert
- Seite 12 und 13:
Zusammenfassung Entfernung von Schw
- Seite 14 und 15:
Zusammenfassung x Dezember 2005 OFC
- Seite 16 und 17:
Vorwort Als „verfügbar“ werden
- Seite 18 und 19:
Vorwort vorliegenden Dokument entha
- Seite 20 und 21:
2.5.6 Halogenation.................
- Seite 22 und 23:
4.3.5.3 Scrubbing of HCl from exhau
- Seite 24 und 25:
5.2.3.5 Removal of SOx from exhaust
- Seite 26 und 27:
Abbildung 4.1: : Behandlungsschritt
- Seite 28 und 29:
Verzeichnis der Tables bzw. Tabelle
- Seite 30 und 31:
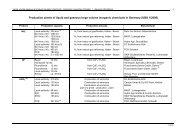
Tabelle 4.71: Weitere Beispiele fü
- Seite 33 und 34:
1 GENERAL INFORMATION 1.1 The secto
- Seite 35 und 36:
Chapter 1 It is a feature of the se
- Seite 37 und 38:
1.3 Some products 1.3.1 Organic dye
- Seite 39 und 40:
1.3.1.3 Economics Chapter 1 The sca
- Seite 41 und 42:
1.3.2.3 Economics Chapter 1 The pha
- Seite 43 und 44:
Pesticide group Pest group Insectic
- Seite 45 und 46:
Real growth in % per year 8 3 -2 -7
- Seite 47 und 48:
1.3.7 Flame-retardants [6, Ullmann,
- Seite 49:
1.3.9 Explosives [46, Ministerio de
- Seite 52 und 53:
Chapter 2 2.1.1 Intermediates [6, U
- Seite 54 und 55:
Chapter 2 2.2 Multipurpose plants M
- Seite 56 und 57: Chapter 2 2.3 Equipment and unit op
- Seite 58 und 59: Chapter 2 2.3.2.2 Liquid-solid sepa
- Seite 60 und 61: Chapter 2 2.3.5 Energy supply [43,
- Seite 62 und 63: Chapter 2 2.3.7 Recovery/abatement
- Seite 64 und 65: Chapter 2 2.3.9 Groundwater protect
- Seite 66 und 67: Chapter 2 2.4 Site management and m
- Seite 68 und 69: Chapter 2 2.4.2.2 Solvents and vola
- Seite 70 und 71: Chapter 2 2.4.2.4 Biodegradability
- Seite 72 und 73: Chapter 2 2.5 Unit processes and co
- Seite 74 und 75: Chapter 2 2.5.3 Condensation [6, Ul
- Seite 76 und 77: Chapter 2 Clarifying may be necessa
- Seite 78 und 79: Chapter 2 Co-solvent Acid, alcohol,
- Seite 80 und 81: Chapter 2 2.5.6 Halogenation [6, Ul
- Seite 82 und 83: Chapter 2 Operations Figure 2.18 sh
- Seite 84 und 85: Chapter 2 Organic feed, H 2 SO 4 ,
- Seite 86 und 87: Chapter 2 2.5.9 Oxidation with inor
- Seite 88 und 89: Chapter 2 2.5.11 Reduction of aroma
- Seite 90 und 91: Chapter 2 2.5.11.3 Alkali sulphide
- Seite 92 und 93: Chapter 2 Aromate, H 2SO 4 or oleum
- Seite 94 und 95: Chapter 2 Organic feed solvent SO 3
- Seite 96 und 97: Chapter 2 The product is isolated b
- Seite 98 und 99: Chapter 2 2.5.16 Processes involvin
- Seite 100 und 101: Chapter 2 2.6 Fermentation [2, Onke
- Seite 102 und 103: Chapter 2 Further steps can also be
- Seite 104 und 105: Chapter 2 2.7 Associated activities
- Seite 108 und 109: Chapter 3 3.1.2 Concentration value
- Seite 110 und 111: Chapter 3 Reference HCl HBr Cl2 Br2
- Seite 112 und 113: Chapter 3 Reference HCl HBr Cl2 Br2
- Seite 114 und 115: Chapter 3 3.2 Waste water The level
- Seite 116 und 117: Chapter 3 Plant Before treatment CO
- Seite 118 und 119: Chapter 3 (2003) Plant Before treat
- Seite 120 und 121: Chapter 3 3.3 Waste [46, Ministerio
- Seite 122 und 123: Kapitel 4 4.1 Vermeidung von Umwelt
- Seite 124 und 125: Kapitel 4 4.1.2 Einbeziehung von UG
- Seite 126 und 127: Kapitel 4 4.1.3 Beispiel einer Anle
- Seite 128 und 129: Kapitel 4 Ether: Stoff Sicherheit G
- Seite 130 und 131: Kapitel 4 4.1.4 Beispiele für alte
- Seite 132 und 133: Kapitel 4 4.1.4.3 Recycling anstell
- Seite 134 und 135: Kapitel 4 Angefalles TTPO C 6 H 5 C
- Seite 136 und 137: Kapitel 4 Wo die Herstellung von Ph
- Seite 138 und 139: Kapitel 4 4.1.4.6 Mikrostrukturiert
- Seite 140 und 141: Kapitel 4 4.1.4.7 Reaktionen in ion
- Seite 142 und 143: Kapitel 4 4.1.4.8 Kryogene Reaktion
- Seite 144 und 145: Kapitel 4 Betriebsdaten Über 73,8
- Seite 146 und 147: Kapitel 4 4.1.5 Extraktion von Natu
- Seite 148 und 149: Kapitel 4 4.1.5.3 Wiederverwendbark
- Seite 150 und 151: Kapitel 4 Betriebsdaten Es liegen k
- Seite 152 und 153: Kapitel 4 Beurteilung der Stoffe un
- Seite 154 und 155: Kapitel 4 4.1.6.2 Über die Vermeid
- Seite 156 und 157:
Kapitel 4 4.2 Minimierung von Umwel
- Seite 158 und 159:
Kapitel 4 4.2.2 Standortvergleich i
- Seite 160 und 161:
Kapitel 4 4.2.3 Vorkehrungen bei de
- Seite 162 und 163:
Kapitel 4 4.2.4 Verbesserung der He
- Seite 164 und 165:
Kapitel 4 4.2.5 Wasserfreie Vakuume
- Seite 166 und 167:
Kapitel 4 4.2.6 Flüssigkeitsringpu
- Seite 168 und 169:
Kapitel 4 4.2.7 Flüssigkeitsringpu
- Seite 170 und 171:
Kapitel 4 Anwendbarkeit Es gib ein
- Seite 172 und 173:
Kapitel 4 4.2.9 Indirekte Kühlung
- Seite 174 und 175:
Kapitel 4 Die Kurven überlappen si
- Seite 176 und 177:
Kapitel 4 4.2.11 Energetisch gekopp
- Seite 178 und 179:
Kapitel 4 4.2.12 Verbesserte Reinig
- Seite 180 und 181:
Kapitel 4 4.2.14 Minimierung von VO
- Seite 182 und 183:
Kapitel 4 Wirtschaftliche Aspekte
- Seite 184 und 185:
Kapitel 4 4.2.17 Stoßinertisierung
- Seite 186 und 187:
Kapitel 4 4.2.18 Befüllen von Proz
- Seite 188 und 189:
Kapitel 4 4.2.20 Minimierung von Ab
- Seite 190 und 191:
Kapitel 4 4.2.21 Getrennte Erfassun
- Seite 192 und 193:
Kapitel 4 4.2.22 Gegenstromproduktw
- Seite 194 und 195:
Kapitel 4 4.2.23 Beispiel für Reak
- Seite 196 und 197:
Kapitel 4 Wirtschaftliche Aspekte A
- Seite 198 und 199:
Kapitel 4 4.2.26 Einsatz von Druckp
- Seite 200 und 201:
Kapitel 4 4.2.27 Bodenschutz Beschr
- Seite 202 und 203:
Kapitel 4 4.2.28 Rückhaltung von L
- Seite 204 und 205:
Kapitel 4 Anwendbarkeit Allgemein a
- Seite 206 und 207:
Kapitel 4 Maßnahme Kommentar [99,
- Seite 208 und 209:
Kapitel 4 4.3.1 Bilanzen und Überw
- Seite 210 und 211:
Kapitel 4 Erzielte Umweltvorteile D
- Seite 212 und 213:
Kapitel 4 Betriebsdaten Es liegen k
- Seite 214 und 215:
Kapitel 4 Betriebsdaten Es liegen k
- Seite 216 und 217:
Kapitel 4 Erzielte Umweltvorteile M
- Seite 218 und 219:
Kapitel 4 Wirtschaftliche Aspekte E
- Seite 220 und 221:
Kapitel 4 Anwendbarkeit Allgemein a
- Seite 222 und 223:
Kapitel 4 4.3.1.8 Überwachung von
- Seite 224 und 225:
Kapitel 4 4.3.2 Abfallströme aus
- Seite 226 und 227:
Kapitel 4 4.3.2.2 Abfallströme aus
- Seite 228 und 229:
Kapitel 4 4.3.2.3 Abfallströme aus
- Seite 230 und 231:
Kapitel 4 4.3.2.4 Abfallströme aus
- Seite 232 und 233:
Kapitel 4 Verdünnung in 2000 m 3 (
- Seite 234 und 235:
Kapitel 4 Betriebsdaten Es liegen k
- Seite 236 und 237:
Kapitel 4 Abfallstrom Kenngrößen
- Seite 238 und 239:
Kapitel 4 4.3.2.6 Abfallströme aus
- Seite 240 und 241:
Kapitel 4 Anwendbarkeit Allgemein a
- Seite 242 und 243:
Kapitel 4 Abfallstrom Kenngrößen
- Seite 244 und 245:
Kapitel 4 4.3.2.8 Abfallströme aus
- Seite 246 und 247:
Kapitel 4 Die Mehrheit der Arylsulf
- Seite 248 und 249:
Kapitel 4 4.3.2.9 Abfallströme aus
- Seite 250 und 251:
Kapitel 4 4.3.2.10 Abfallströme au
- Seite 252 und 253:
Kapitel 4 4.3.2.11 Abwasserströme
- Seite 254 und 255:
Kapitel 4 4.3.3 Rückgewinnung arom
- Seite 256 und 257:
Kapitel 4 Toluol H 2O Produkt Produ
- Seite 258 und 259:
Kapitel 4 4.3.4 Wiederverwendung vo
- Seite 260 und 261:
Kapitel 4 Medienübergreifende Effe
- Seite 262 und 263:
Kapitel 4 Parameter Einheiten [15,
- Seite 264 und 265:
Kapitel 4 4.3.5.3 HCl-Minderung dur
- Seite 266 und 267:
Kapitel 4 4.3.5.4 Rückgewinnung vo
- Seite 268 und 269:
Kapitel 4 4.3.5.5 Absorption von ü
- Seite 270 und 271:
Kapitel 4 4.3.5.6 Kondensation von
- Seite 272 und 273:
Kapitel 4 4.3.5.7 Thermische Nachve
- Seite 274 und 275:
Kapitel 4 Anwendbarkeit Die thermis
- Seite 276 und 277:
Kapitel 4 4.3.5.8 Mitverbrennung ha
- Seite 278 und 279:
Kapitel 4 4.3.5.9 Strippen und ther
- Seite 280 und 281:
Kapitel 4 4.3.5.10 Strategie zur Ve
- Seite 282 und 283:
Kapitel 4 Da ein goßer Teil des Sy
- Seite 284 und 285:
Kapitel 4 4.3.5.12 Katalytische Nac
- Seite 286 und 287:
Kapitel 4 4.3.5.13 Gekoppelte Aufko
- Seite 288 und 289:
Kapitel 4 4.3.5.14 Nicht-thermische
- Seite 290 und 291:
Kapitel 4 4.3.5.15 Induktion eines
- Seite 292 und 293:
Kapitel 4 Wirtschaftliche Aspekte E
- Seite 294 und 295:
Kapitel 4 • intensivierte Nutzung
- Seite 296 und 297:
Kapitel 4 4.3.5.18 Auswahl einer VO
- Seite 298 und 299:
Kapitel 4 Medienübergreifende Effe
- Seite 300 und 301:
Kapitel 4 4.3.5.19 NOX: Rückgewinn
- Seite 302 und 303:
Kapitel 4 2000 Harnstoffdosierung 2
- Seite 304 und 305:
Kapitel 4 4.3.5.20 NH3-Minderung du
- Seite 306 und 307:
Kapitel 4 4.3.5.21 SOX-Minderung du
- Seite 308 und 309:
Kapitel 4 4.3.5.22 Abscheidung von
- Seite 310 und 311:
Kapitel 4 Medienübergreifende Effe
- Seite 312 und 313:
Kapitel 4 Andere Beispiele: Am Stan
- Seite 314 und 315:
Kapitel 4 Medienübergreifende Effe
- Seite 316 und 317:
Kapitel 4 Wirtschaftliche Aspekte A
- Seite 318 und 319:
Kapitel 4 Erzielte Umweltvorteile
- Seite 320 und 321:
Kapitel 4 Die wichtigsten Kriterien
- Seite 322 und 323:
Kapitel 4 Kriterien für den Input
- Seite 324 und 325:
Kapitel 4 Beispiele [67, UBA, 2004]
- Seite 326 und 327:
Kapitel 4 Wirtschaftliche Aspekte L
- Seite 328 und 329:
Kapitel 4 In Tabelle 4.67 sind die
- Seite 330 und 331:
Kapitel 4 4.3.7.9 Abwasserströme m
- Seite 332 und 333:
Kapitel 4 4.3.7.10 Refraktäre orga
- Seite 334 und 335:
Kapitel 4 4.3.7.11 Refraktäre orga
- Seite 336 und 337:
Kapitel 4 4.3.7.13 Refraktäre orga
- Seite 338 und 339:
Kapitel 4 4.3.7.14 Elimination von
- Seite 340 und 341:
Kapitel 4 Wirtschaftliche Aspekte W
- Seite 342 und 343:
Kapitel 4 Medienübergreifende Effe
- Seite 344 und 345:
Kapitel 4 Medienübergreifende Effe
- Seite 346 und 347:
Kapitel 4 4.3.7.18 Entfernung von C
- Seite 348 und 349:
Kapitel 4 4.3.7.19 Entfernung von C
- Seite 350 und 351:
Kapitel 4 4.3.7.20 Entfernung von C
- Seite 352 und 353:
Kapitel 4 Anwendbarkeit Allgemein a
- Seite 354 und 355:
Kapitel 4 Erzielte Umweltvorteile
- Seite 356 und 357:
Kapitel 4 4.3.7.23 Rückgewinnung v
- Seite 358 und 359:
Kapitel 4 4.3.8 Behandlung des Gesa
- Seite 360 und 361:
Kapitel 4 Weitere Beispiele sind in
- Seite 362 und 363:
Kapitel 4 4.3.8.4 Gemeinsame Behand
- Seite 364 und 365:
Kapitel 4 4.3.8.5 Nachweis der Wirk
- Seite 366 und 367:
Kapitel 4 Vorbehandlung gering abba
- Seite 368 und 369:
Kapitel 4 Medienübergreifende Effe
- Seite 370 und 371:
Kapitel 4 mg mg NH NH4-N / l 4-N/Li
- Seite 372 und 373:
Kapitel 4 4.3.8.10 Zum Verständnis
- Seite 374 und 375:
Kapitel 4 CSB-Elimination 100 95 90
- Seite 376 und 377:
Kapitel 4 4.3.8.11 BSB-Eliminations
- Seite 378 und 379:
Kapitel 4 4.3.8.12 AOX-Eliminations
- Seite 380 und 381:
Kapitel 4 4.3.8.13 G-Emissionswerte
- Seite 382 und 383:
Kapitel 4 4.3.8.14 Emissionswerte f
- Seite 384 und 385:
Kapitel 4 4.3.8.15 Elimination von
- Seite 386 und 387:
Kapitel 4 4.3.8.17 Emissionswerte f
- Seite 388 und 389:
Kapitel 4 4.3.8.18 Biotests zur Üb
- Seite 390 und 391:
Kapitel 4 4.3.8.19 WEA als ein Mana
- Seite 392 und 393:
Kapitel 4 Anwendbarkeit Allgemein a
- Seite 394 und 395:
Kapitel 4 Überwachung von Paramete
- Seite 396 und 397:
Kapitel 4 − der Art, der Dimensio
- Seite 398 und 399:
Kapitel 4 − Festlegung und Pflege
- Seite 400 und 401:
Kapitel 4 sicherstellen, dass die E
- Seite 402 und 403:
Kapitel 4 Beispielanlagen Die oben
- Seite 404 und 405:
Kapitel 5 Es ist beabsichtigt, dass
- Seite 406 und 407:
Kapitel 5 5.1.1.2 Prozesssicherheit
- Seite 408 und 409:
Kapitel 5 5.1.2.3 Minimierung der V
- Seite 410 und 411:
Kapitel 5 5.1.2.5 Minimierung des V
- Seite 412 und 413:
Kapitel 5 5.2 Management und Behand
- Seite 414 und 415:
Kapitel 5 5.2.1.1.5 Untersuchung ei
- Seite 416 und 417:
Kapitel 5 VOC in Abgasen Werte aus
- Seite 418 und 419:
Kapitel 5 5.2.3.3 Rückgewinnung/Mi
- Seite 420 und 421:
Kapitel 5 5.2.4.2 Behandlung von Ab
- Seite 422 und 423:
Kapitel 5 5.2.4.4.2 Vorbehandlung v
- Seite 424 und 425:
Kapitel 5 5.2.4.7.2 Eliminationsrat
- Seite 426 und 427:
Kapitel 5 5.3 Umweltmanagement Auch
- Seite 428 und 429:
Chapter 6 Economics Prevention of p
- Seite 430 und 431:
Chapter 6 Applicability PI is ideal
- Seite 432 und 433:
Chapter 6 Economics • reduced rea
- Seite 434 und 435:
Chapter 6 Achieved environmental be
- Seite 437 und 438:
7 CONCLUDING REMARKS 7.1 Quality of
- Seite 439:
Assessment of formulation processes
- Seite 442 und 443:
References 30 ESIS (2003). "Europea
- Seite 444 und 445:
References 78 Boswell, C. (2004).
- Seite 447 und 448:
8 GLOSSAR 8.1 Abkürzungen und Erkl
- Seite 449 und 450:
CEFIC European Chemical Industry Co
- Seite 451 und 452:
IMS Industrial methylated spirits B
- Seite 453 und 454:
R61 May cause harm to the unborn ch
- Seite 455:
8.2 Wörterbuch Glossar English Deu
- Seite 458 und 459:
Annexes Plant Production 022F Flavo
- Seite 460:
Annexes Plant Production 104X Speci