Seminar for PhD students - Max-Planck-Institut für biophysikalische ...
Seminar for PhD students - Max-Planck-Institut für biophysikalische ...
Seminar for PhD students - Max-Planck-Institut für biophysikalische ...

Erfolgreiche ePaper selbst erstellen
Machen Sie aus Ihren PDF Publikationen ein blätterbares Flipbook mit unserer einzigartigen Google optimierten e-Paper Software.
diffraction-limited resolution of fluorescence<br />
microscopy of around 250 nm.<br />
Hence conventional light microscopy<br />
cannot be used to study sub-mitochondrial<br />
protein distributions in wild-type cells.<br />
Nonetheless, recently two studies using<br />
the budding yeast Saccharomyces cerevisiae<br />
as a model organism demonstrated<br />
conclusively that the IBM and the CM<br />
have different protein compositions.<br />
Using live cell fluorescence microscopy<br />
in conjunction with genetically enlarged<br />
mitochondria (a detour to circumvent the<br />
problems associated with the diffraction<br />
barrier), we (Wurm and Jakobs, 2006)<br />
and Andreas Reichert and colleagues<br />
with quantitative immunogold electron<br />
microscopy (Vogel et al., 2006) demonstrated<br />
different protein compositions<br />
of the IBM and the CM. However, these<br />
initial studies primarily concentrated on<br />
proteins involved in protein import and<br />
oxidative phosphorylation. Hence we<br />
next focused on other cellular processes<br />
to analyze differences in the functions of<br />
both domains of the inner membrane.<br />
The m-AAA protease processes the cytochrome<br />
c peroxidase preferentially at<br />
the IBM<br />
Many proteins of the inner membrane<br />
assemble into large protein complexes.<br />
Such assembly processes require extensive<br />
quality control mechanisms to avoid<br />
the accumulation of deleterious malfolded<br />
or misassembled proteins. We determined<br />
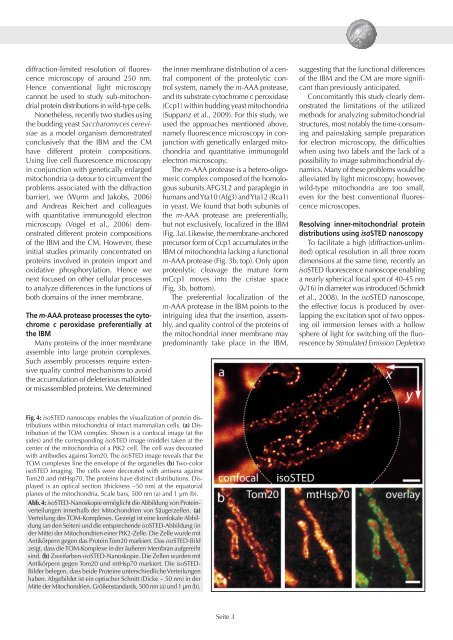
Fig. 4: isoSTED nanoscopy enables the visualization of protein distributions<br />
within mitochondria of intact mammalian cells. (a) Distribution<br />
of the TOM complex. Shown is a confocal image (at the<br />
sides) and the corresponding isoSTED image (middle) taken at the<br />
center of the mitochondria of a PtK2 cell. The cell was decorated<br />
with antibodies against Tom20. The isoSTED image reveals that the<br />
TOM complexes line the envelope of the organelles (b) Two-color<br />
isoSTED imaging. The cells were decorated with antisera against<br />
Tom20 and mtHsp70. The proteins have distinct distributions. Displayed<br />
is an optical section (thickness ~50 nm) at the equatorial<br />
planes of the mitochondria. Scale bars, 500 nm (a) and 1 µm (b).<br />
Abb. 4: isoSTED-Nanoskopie ermöglicht die Abbildung von Proteinverteilungen<br />
innerhalb der Mitochondrien von Säugerzellen. (a)<br />
Verteilung des TOM-Komplexes. Gezeigt ist eine konfokale Abbildung<br />
(an den Seiten) und die entsprechende isoSTED-Abbildung (in<br />
der Mitte) der Mitochondrien einer PtK2-Zelle. Die Zelle wurde mit<br />
Antikörpern gegen das Protein Tom20 markiert. Das isoSTED-Bild<br />
zeigt, dass die TOM-Komplexe in der äußeren Membran aufgereiht<br />
sind. (b) Zweifarben-isoSTED-Nanoskopie. Die Zellen wurden mit<br />
Antikörpern gegen Tom20 und mtHsp70 markiert. Die isoSTED-<br />
Bilder belegen, dass beide Proteine unterschiedliche Verteilungen<br />
haben. Abgebildet ist ein optischer Schnitt (Dicke ~ 50 nm) in der<br />
Mitte der Mitochondrien. Größenstandards, 500 nm (a) und 1 µm (b).<br />
the inner membrane distribution of a central<br />
component of the proteolytic control<br />
system, namely the m-AAA protease,<br />
and its substrate cytochrome c peroxidase<br />
(Ccp1) within budding yeast mitochondria<br />
(Suppanz et al., 2009). For this study, we<br />
used the approaches mentioned above,<br />
namely fluorescence microscopy in conjunction<br />
with genetically enlarged mitochondria<br />
and quantitative immunogold<br />
electron microscopy.<br />
The m-AAA protease is a hetero-oligomeric<br />
complex composed of the homologous<br />
subunits AFG3L2 and paraplegin in<br />
humans and Yta10 (Afg3) and Yta12 (Rca1)<br />
in yeast. We found that both subunits of<br />
the m-AAA protease are preferentially,<br />
but not exclusively, localized in the IBM<br />
(Fig. 3a). Likewise, the membrane-anchored<br />
precursor <strong>for</strong>m of Ccp1 accumulates in the<br />
IBM of mitochondria lacking a functional<br />
m-AAA protease (Fig. 3b, top). Only upon<br />
proteolytic cleavage the mature <strong>for</strong>m<br />
mCcp1 moves into the cristae space<br />
(Fig. 3b, bottom).<br />
The preferential localization of the<br />
m-AAA protease in the IBM points to the<br />
intriguing idea that the insertion, assembly,<br />
and quality control of the proteins of<br />
the mitochondrial inner membrane may<br />
predominantly take place in the IBM,<br />
Seite 3<br />
suggesting that the functional differences<br />
of the IBM and the CM are more significant<br />
than previously anticipated.<br />
Concomitantly this study clearly demonstrated<br />
the limitations of the utilized<br />
methods <strong>for</strong> analyzing submitochondrial<br />
structures, most notably the time-consuming<br />
and painstaking sample preparation<br />
<strong>for</strong> electron microscopy, the difficulties<br />
when using two labels and the lack of a<br />
possibility to image submitochondrial dynamics.<br />
Many of these problems would be<br />
alleviated by light microscopy; however,<br />
wild-type mitochondria are too small,<br />
even <strong>for</strong> the best conventional fluorescence<br />
microscopes.<br />
Resolving inner-mitochondrial protein<br />
distributions using isoSTED nanoscopy<br />
To facilitate a high (diffraction-unlimited)<br />
optical resolution in all three room<br />
dimensions at the same time, recently an<br />
isoSTED fluorescence nanoscope enabling<br />
a nearly spherical focal spot of 40-45 nm<br />
(l/16) in diameter was introduced (Schmidt<br />
et al., 2008). In the isoSTED nanoscope,<br />
the effective focus is produced by overlapping<br />
the excitation spot of two opposing<br />
oil immersion lenses with a hollow<br />
sphere of light <strong>for</strong> switching off the fluorescence<br />
by Stimulated Emission Depletion