

Krankenanstalten in Österreich/Hospitals in Austria
Krankenanstalten in Österreich/Hospitals in Austria
Krankenanstalten in Österreich/Hospitals in Austria

Sie wollen auch ein ePaper? Erhöhen Sie die Reichweite Ihrer Titel.
YUMPU macht aus Druck-PDFs automatisch weboptimierte ePaper, die Google liebt.
<strong>Hospitals</strong> <strong>in</strong> <strong>Austria</strong><br />
Statistical <strong>in</strong>formation on the <strong>Austria</strong>n hospital sector<br />
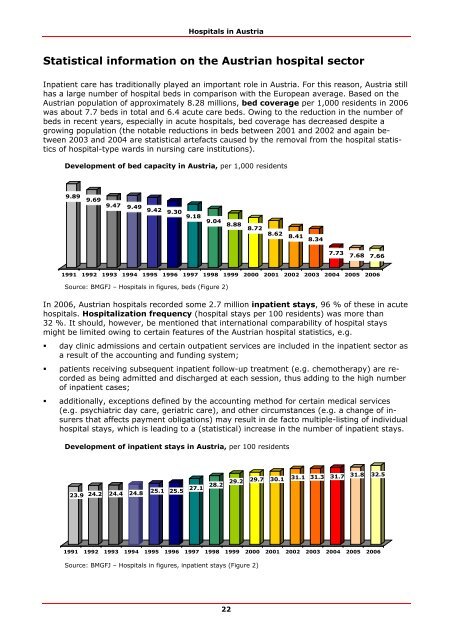
Inpatient care has traditionally played an important role <strong>in</strong> <strong>Austria</strong>. For this reason, <strong>Austria</strong> still<br />
has a large number of hospital beds <strong>in</strong> comparison with the European average. Based on the<br />
<strong>Austria</strong>n population of approximately 8.28 millions, bed coverage per 1,000 residents <strong>in</strong> 2006<br />
was about 7.7 beds <strong>in</strong> total and 6.4 acute care beds. Ow<strong>in</strong>g to the reduction <strong>in</strong> the number of<br />
beds <strong>in</strong> recent years, especially <strong>in</strong> acute hospitals, bed coverage has decreased despite a<br />
grow<strong>in</strong>g population (the notable reductions <strong>in</strong> beds between 2001 and 2002 and aga<strong>in</strong> between<br />
2003 and 2004 are statistical artefacts caused by the removal from the hospital statistics<br />
of hospital-type wards <strong>in</strong> nurs<strong>in</strong>g care <strong>in</strong>stitutions).<br />
Development of bed capacity <strong>in</strong> <strong>Austria</strong>, per 1,000 residents<br />
9.89 9.69<br />
9.47 9.49 9.42 9.30 9.18 9.04 8.88 8.72<br />
22<br />
8.62 8.41 8.34<br />
7.73 7.68 7.66<br />
1991 1992 1993 1994 1995 1996 1997 1998 1999 2000 2001 2002 2003 2004 2005 2006<br />
Source: BMGFJ – <strong>Hospitals</strong> <strong>in</strong> figures, beds (Figure 2)<br />
In 2006, <strong>Austria</strong>n hospitals recorded some 2.7 million <strong>in</strong>patient stays, 96 % of these <strong>in</strong> acute<br />
hospitals. Hospitalization frequency (hospital stays per 100 residents) was more than<br />
32 %. It should, however, be mentioned that <strong>in</strong>ternational comparability of hospital stays<br />
might be limited ow<strong>in</strong>g to certa<strong>in</strong> features of the <strong>Austria</strong>n hospital statistics, e.g.<br />
� day cl<strong>in</strong>ic admissions and certa<strong>in</strong> outpatient services are <strong>in</strong>cluded <strong>in</strong> the <strong>in</strong>patient sector as<br />
a result of the account<strong>in</strong>g and fund<strong>in</strong>g system;<br />
� patients receiv<strong>in</strong>g subsequent <strong>in</strong>patient follow-up treatment (e.g. chemotherapy) are recorded<br />
as be<strong>in</strong>g admitted and discharged at each session, thus add<strong>in</strong>g to the high number<br />
of <strong>in</strong>patient cases;<br />
� additionally, exceptions def<strong>in</strong>ed by the account<strong>in</strong>g method for certa<strong>in</strong> medical services<br />
(e.g. psychiatric day care, geriatric care), and other circumstances (e.g. a change of <strong>in</strong>surers<br />
that affects payment obligations) may result <strong>in</strong> de facto multiple-list<strong>in</strong>g of <strong>in</strong>dividual<br />
hospital stays, which is lead<strong>in</strong>g to a (statistical) <strong>in</strong>crease <strong>in</strong> the number of <strong>in</strong>patient stays.<br />
Development of <strong>in</strong>patient stays <strong>in</strong> <strong>Austria</strong>, per 100 residents<br />
23.9 24.2 24.4 24.8<br />
25.1 25.5 27.1 28.2 29.2 29.7 30.1 31.1 31.3 31.7 31.8 32.5<br />
1991 1992 1993 1994 1995 1996 1997 1998 1999 2000 2001 2002 2003 2004 2005 2006<br />
Source: BMGFJ – <strong>Hospitals</strong> <strong>in</strong> figures, <strong>in</strong>patient stays (Figure 2)

