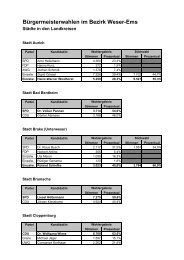
<strong>SPD</strong>-<strong>Bezirk</strong> <strong>Weser</strong>-<strong>Ems</strong> | <strong>Bezirk</strong>sparteitag <strong>2009</strong> ________________________________________________________________________________________________ Entwicklung nach Mitgliedern und Beitragsaufkommen Jahr Mitglieder‐ Jahresver‐ Beitrags‐ Jahresstei‐ Markendurch‐ stand änderung aufkommen gerung bzw. schnittswert (jew.31.12.) DM minderung 1952 14.375 ‐990 133.605,00 3.163,05 0,87 1953 13.476 ‐899 129.975,00 ‐3.630,00 0,90 1954 12.335 ‐1.141 126.483,90 ‐3.491,10 0,92 1955 11.838 ‐497 123.672,00 ‐2.811,90 0,96 1956 11.701 ‐137 120.863,20 ‐2.808,80 0,96 1957 11.563 ‐138 133.630,60 12.767,40 1,03 1958 11.401 ‐162 138.796,80 5.166,20 1,10 1959 11.866 465 146.875,80 8.079,00 1,14 1960 12.253 387 162.206,40 15.330,60 1,21 1961 12.143 ‐110 172.058,40 9.852,00 1,26 1962 12.235 92 183.282,00 11.223,60 1,34 1963*) 12.211 ‐24 239.297,20 56.015,20 1,79 1964 12.802 591 264.902,40 25.605,20 1,85 1965 13.181 379 278.420,00 13.517,60 1,94 1966 13.302 121 291.945,00 13.525,00 1,99 1967 13.634 332 307.825,00 15.880,00 2,02 1968 14.168 534 335.391,50 27.566,50 2,12 1969 15.267 1.099 356.754,50 21.363,00 2,24 1970 18.159 2.892 429.735,50 72.981,00 2,33 1971 19.961 1.802 504.868,50 75.133,00 2,54 1972*) 22.426 2.465 645.855,50 140.987,00 2,88 1973 23.968 1.542 1.022.725,50 376.870,00 3,79 1974 24.117 149 1.037.315,00 14.589,50 3,95 1975 24.452 335 1.125.297,00 87.982,00 4,05 1976*) 25.604 1.152 1.337.176,00 211.879,00 4,86 1977 25.826 222 1.405.241,00 68.065,00 4,99 1978 25.817 ‐9 1.486.195,00 80.954,00 5,11 1979*) 25.727 ‐90 1.687.702,00 201.507,00 6,16 1980 27.485 1.758 1.909.903,00 222.201,00 6,22 1981 27.282 ‐203 1.800.206,00 ‐109.697,00 6,51 1982 26.463 ‐819 1.891.474,00 91.268,00 6,45 1983 26.336 ‐127 1.948.856,00 57.382,00 6,50 1984 25.827 ‐509 1.897.414,00 ‐51.442,00 6,54 1985 25.997 170 2.004.695,63 107.281,63 6,74 1986 27.079 1.082 2.107.056,00 102.360,37 6,86 1987 27.236 157 2.205.014,00 97.958,00 6,96 1988 27.672 436 2.291.265,93 86.251,93 7,16 1989 28.075 403 2.383.355,70 92.089,77 7,29 1990 28.627 552 2.485.785,20 102.429,50 7,46 1991*) 28.931 304 3.159.381,43 673.596,23 9,36 1992 28.274 ‐657 3.173.118,30 13.736,87 9,45 1993 27.842 ‐432 3.125.952,30 ‐47.166,00 9,55 1994*) 27.816 ‐26 3.131.193,09 5.240,79 9,58 1995 26.858 ‐958 3.098.454,56 ‐32.738,53 9,72 1996 26.745 ‐113 3.081.766,58 ‐16.687,98 9,80 1997*) 26.135 ‐610 3.222.031,97 140.265,39 10,45 1998 26.351 216 3.207.273,16 ‐14.758,81 10,54 1999 25.636 ‐715 3.196.217,79 ‐11.055,37 10,56 2000 25.051 ‐585 3.157.499,72 ‐38.718,07 10,71 2001 24.841 ‐210 3.204.603,22 47.103,50 11,01 Ab nächster Zeile in EURO 2001 24.841 ‐210 1.638.487,61 24.083,64 5,63 2002 23.922 ‐919 1.617.566,79 ‐20.920,82 5,77 2003 22.260 ‐1.662 1.576.192,07 ‐41.374,72 5,92 2004 20.733 ‐1.527 1.472.131,40 ‐104.060,67 6,03 2005 20.149 ‐584 1.425.852,29 ‐46.279,11 6,04 2006 19.777 ‐372 1.421.817,91 ‐4.034,38 6,14 <strong>2007</strong> 18.963 ‐814 1.387.225,29 ‐34.592,62 6,24 2008 18.148 ‐815 1.350.898,05 ‐36.327,24 6,35 <strong>2009</strong> ** 17.736 ‐412 704.972,28 *) Veränderungen der Beitragstabelle **) Stand: Juni <strong>2009</strong> Seite 88
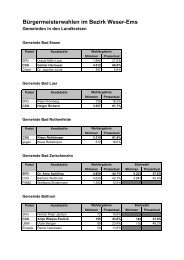
<strong>SPD</strong>-<strong>Bezirk</strong> <strong>Weser</strong>-<strong>Ems</strong> | <strong>Bezirk</strong>sparteitag <strong>2009</strong> ________________________________________________________________________________________________ Beitragsaufkommen <strong>2007</strong> Unterbezirk Bruttoerlös Beitragserlös Kassierungsdurch‐ in € je Marke schnitt in % Ammerland 59.217,60 6,59 99,26 Aurich 217.444,22 5,49 92,87 Grafschaft Bentheim 56.272,94 5,84 92,40 Cloppenburg 28.017,21 6,47 86,47 Delmenhorst 46.209,02 9,14 116,86 Emden 48.150,04 6,61 105,24 <strong>Ems</strong>land 70.407,81 5,92 87,90 Friesland 93.679,29 6,30 95,23 Leer 131.180,38 5,28 88,77 Oldenburg‐Stadt 104.208,30 8,78 117,23 Oldenburg‐Land 62.363,67 6,75 98,71 Osnabrück‐Stadt 93.036,04 7,46 110,53 Osnabrück‐Land 175.546,19 5,98 93,41 Vechta 19.564,27 4,96 92,04 <strong>Weser</strong>marsch 77.430,23 6,21 97,01 Wilhelmshaven 64.988,65 6,75 103,52 Wittmund 39.509,43 5,57 90,17 Beitragsaufkommen 2008 Unterbezirk Bruttoerlös Beitragserlös Kassierungsdurch‐ in € je Marke schnitt in % Ammerland 55.791,69 6,57 100,08 Aurich 210.482,75 5,53 93,27 Grafschaft Bentheim 56.443,65 6,10 92,68 Cloppenburg 27.636,54 6,64 86,41 Delmenhorst 45.083,09 9,31 115,83 Emden 46.019,84 6,71 107,67 <strong>Ems</strong>land 65.932,38 5,82 88,97 Friesland 95.684,90 6,59 97,22 Leer 128.695,33 5,39 89,26 Oldenburg‐Stadt 105.007,09 9,10 119,47 Oldenburg‐Land 59.889,08 6,87 100,39 Osnabrück‐Stadt 91.242,57 7,83 113,43 Osnabrück‐Land 171.239,45 6,03 94,22 Vechta 18.479,79 5,10 92,58 <strong>Weser</strong>marsch 73.362,20 6,38 97,60 Wilhelmshaven 60.939,35 6,72 105,22 Wittmund 38.968,35 5,66 91,39 Seite 89