- Seite 1 und 2:
Integrierte Vermeidung und Verminde
- Seite 3:
This document is one of a series of
- Seite 6 und 7:
Zusammenfassung Trotz der zunehmend
- Seite 8 und 9:
Zusammenfassung Vermeidung bzw. Ver
- Seite 10 und 11:
Zusammenfassung 5.1 Allgemeine BVT
- Seite 12 und 13:
Zusammenfassung wodurch der Energie
- Seite 14 und 15:
Zusammenfassung Es gibt zusätzlich
- Seite 16 und 17:
Zusammenfassung • Anwendung der n
- Seite 18 und 19:
Preface Als „beste“ gelten jene
- Seite 20 und 21:
BVT-Merkblatt zu über die besten v
- Seite 22 und 23:
2.1.3.7.2 Field of application.....
- Seite 24 und 25:
2.1.5.4.3 Description of techniques
- Seite 26 und 27:
2.2.1.3.5 Packing (H.1)............
- Seite 28 und 29:
3.2.2 Sorting/screening, grading, d
- Seite 30 und 31:
3.2.27 3.2.27 Einpökeln/Einsalzen
- Seite 32 und 33:
3.2.54.1 Water.....................
- Seite 34 und 35:
4.1.3.6 4.1.3.6 Positionierung von
- Seite 36 und 37:
4.2.1.1 Switch off the engine and r
- Seite 38 und 39:
4.2.13.5 4.2.13.5 Wärmerückgewinn
- Seite 40 und 41:
4.4.3.2 Collection of air emissions
- Seite 42 und 43:
4.5.6.1 Waste water sludge treatmen
- Seite 44 und 45:
4.7.3.2 Dry cleaning...............
- Seite 46 und 47:
4.7.5.14.3 Minimise the production
- Seite 48 und 49:
4.7.9.8.2 Gradual discharge of clea
- Seite 50 und 51:
List of figures Figure 2.1: Flow di
- Seite 52 und 53:
Abbildung 4.66: Zweistufiges Trockn
- Seite 54 und 55:
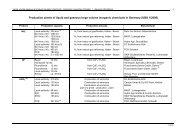
Table 3.39: Energy carrier and orde
- Seite 56 und 57:
Tabelle 4.63: Wirksamkeit verschied
- Seite 59:
GELTUNGSBEREICH RHC/EIPPCB/FDM_BREF
- Seite 62 und 63:
Chapter 1 More detailed figures for
- Seite 64 und 65:
Chapter 1 The top individual export
- Seite 66 und 67:
Chapter 1 Traditionally, in many Eu
- Seite 69 und 70:
2 APPLIED PROCESSES AND TECHNIQUES
- Seite 71 und 72:
2.1.1.1.3 Description of techniques
- Seite 73 und 74:
2.1.1.4.2 Field of application Chap
- Seite 75 und 76:
2.1.2.2 Mixing/blending, homogenisa
- Seite 77 und 78:
2.1.2.4.3 Description of techniques
- Seite 79 und 80:
2.1.3.4 Centrifugation and sediment
- Seite 81 und 82:
Chapter 2 The plate and frame filte
- Seite 83 und 84:
2.1.3.8.2 Field of application Chap
- Seite 85 und 86:
Chapter 2 The process can also be c
- Seite 87 und 88:
2.1.4.2 Dissolving (D.2) 2.1.4.2.1
- Seite 89 und 90:
Chapter 2 To start the process, bac
- Seite 91 und 92:
Chapter 2 Dry brining/curing is app
- Seite 93 und 94:
2.1.4.11.3 Description of technique
- Seite 95 und 96:
2.1.5 Heat processing (E) 2.1.5.1 M
- Seite 97 und 98:
Chapter 2 There are four types of o
- Seite 99 und 100:
2.1.5.7.3 Description of techniques
- Seite 101 und 102:
2.1.6 Concentration by heat (F) 2.1
- Seite 103 und 104:
Chapter 2 Generally, as an integral
- Seite 105 und 106:
2.1.7 Processing by the removal of
- Seite 107 und 108:
Chapter 2 The operating principle o
- Seite 109 und 110:
2.1.8.1.3 Description of techniques
- Seite 111 und 112:
2.1.8.2.2 Field of application Chap
- Seite 113 und 114:
2.1.9.2.2 Field of application Requ
- Seite 115 und 116:
2.1.9.3.3 Process water Chapter 2 I
- Seite 117 und 118:
Chapter 2 The reciprocating pump, w
- Seite 119 und 120:
Meat Fish Meat Potat o Fruit and ve
- Seite 121 und 122:
2.2.1 Meat and poultry Chapter 2 Be
- Seite 123 und 124:
2.2.1.1.2 Cutting (B.1) Chapter 2 F
- Seite 125 und 126:
2.2.1.2.3 Pickling (D.7) Chapter 2
- Seite 127 und 128:
2.2.1.3.2 Ageing (D.14) Chapter 2 H
- Seite 129 und 130:
2.2.2.3 Crustaceans Chapter 2 Once
- Seite 131 und 132:
2.2.3.2 Fruit juice Chapter 2 Fruit
- Seite 133 und 134:
2.2.3.6 Dried fruit Chapter 2 Dried
- Seite 135 und 136:
2.2.3.10 Heat treated and frozen ve
- Seite 137 und 138:
Chapter 2 The neutralised oil is bl
- Seite 139 und 140:
Chapter 2 In traditional production
- Seite 141 und 142:
Chapter 2 UHT or sterilisation is u
- Seite 143 und 144:
Heat Stabilising salt Heat Electric
- Seite 145 und 146:
Heat Heat Refrigeration Starter cul
- Seite 147 und 148:
Chapter 2 A further process involve
- Seite 149 und 150:
Chapter 2 Colours and flavours are
- Seite 151 und 152:
Chapter 2 During final drying, the
- Seite 153 und 154:
FW : PW : RPW : Fresh water Process
- Seite 155 und 156:
FW : Fresh water PW : Process water
- Seite 157 und 158:
Chapter 2 coolers in which the pell
- Seite 159 und 160:
Chapter 2 In the UK, the majority o
- Seite 161 und 162:
2.2.11.5 Boiled sweets Chapter 2 Bo
- Seite 163 und 164:
2.2.13.2 Instant coffee Chapter 2 I
- Seite 165 und 166:
Chapter 2 The indirect method is ca
- Seite 167 und 168:
2.2.16.1 Mashing Chapter 2 Grains a
- Seite 169 und 170:
2.2.18 Wine This section includes r
- Seite 171:
Chapter 2 In citric acid fermentati
- Seite 174 und 175: Chapter 3 The consumption and emiss
- Seite 176 und 177: Chapter 3 Surface water 23% Other w
- Seite 178 und 179: Chapter 3 3.1.2 Air emissions Air e
- Seite 180 und 181: Chapter 3 3.1.3.4 Product defects/r
- Seite 182 und 183: Chapter 3 C.9 Bleaching N N W1,W3 C
- Seite 184 und 185: Chapter 3 3.2.1.3 Solid output Some
- Seite 186 und 187: Chapter 3 3.2.4.3 Energy The electr
- Seite 188 und 189: Chapter 3 3.2.9 Extraction (C.1) 3.
- Seite 190 und 191: Chapter 3 3.2.13.3 Solid output Fil
- Seite 192 und 193: Chapter 3 3.2.18.5 Noise Noise issu
- Seite 194 und 195: Chapter 3 3.2.24 Fermentation (D.4)
- Seite 196 und 197: Chapter 3 3.2.29.4 Energy Energy is
- Seite 198 und 199: Chapter 3 3.2.36.2 Air emissions St
- Seite 200 und 201: Chapter 3 3.2.40.3 Solid output Oil
- Seite 202 und 203: Chapter 3 3.2.45 Dehydration (solid
- Seite 204 und 205: Chapter 3 3.2.48 Freeze-drying/lyop
- Seite 206 und 207: Chapter 3 3.2.52.3 Solid output Ash
- Seite 208 und 209: Chapter 3 Sector Water consumption
- Seite 210 und 211: Chapter 3 3.3.1 Meat and poultry 3.
- Seite 212 und 213: Chapter 3 3.3.1.2.2 Salami and saus
- Seite 214 und 215: Chapter 3 Unit operation Cured ham
- Seite 216 und 217: Chapter 3 3.3.2.1 Water consumption
- Seite 218 und 219: Chapter 3 By-products from the fill
- Seite 220 und 221: Chapter 3 LIQUID WASTE IN VOLUME/WE
- Seite 222 und 223: Chapter 3 Product category Water co
- Seite 226 und 227: Chapter 3 Product Waste water volum
- Seite 228 und 229: Chapter 3 Flume water Raw produce s
- Seite 230 und 231: Chapter 3 LIQUID WASTE IN VOLUME/WE
- Seite 232 und 233: Chapter 3 • production of animal
- Seite 234 und 235: Chapter 3 Both water and steam blan
- Seite 236 und 237: Chapter 3 Energy carrier Approximat
- Seite 238 und 239: Chapter 3 3.3.3.5.4 Juices Energy i
- Seite 240 und 241: Chapter 3 Source Volume m 3 /t 1 BO
- Seite 242 und 243: Chapter 3 Deodoriser distillate, co
- Seite 244 und 245: Chapter 3 In oilseed processing, 0.
- Seite 246 und 247: Chapter 3 Product Water consumption
- Seite 248 und 249: Chapter 3 Component Range SS 24 - 5
- Seite 250 und 251: Chapter 3 For cheese manufacturing,
- Seite 252 und 253: Chapter 3 LIQUID WASTE IN VOLUME/WE
- Seite 254 und 255: Chapter 3 Total energy consumption
- Seite 256 und 257: Chapter 3 Estimated energy consumpt
- Seite 258 und 259: Chapter 3 While the overall water u
- Seite 260 und 261: Chapter 3 Total energy (kWh) consum
- Seite 262 und 263: Chapter 3 The production of the fin
- Seite 264 und 265: Chapter 3 The waste water is very v
- Seite 266 und 267: Chapter 3 3.3.11.5 Energy Breweries
- Seite 269 und 270: 4 BEI DER FESTLEGUNG VON BVT ZU BER
- Seite 271 und 272: 4.1 Allgemeine Techniken für die N
- Seite 273 und 274: Kapitel 4 (vii) Wartungsprogramm -
- Seite 275 und 276:
Kapitel 4 eingeplant werden. Die En
- Seite 277 und 278:
Anlässe für die Umsetzung Umweltm
- Seite 279 und 280:
Kapitel 4 Erreichbare Umweltvorteil
- Seite 281 und 282:
Abbildung 4.1: Einfluss der Anzahl
- Seite 283 und 284:
Kapitel 4 • Verschalung der Kühl
- Seite 285 und 286:
Kapitel 4 Doppelwandige Gebäude be
- Seite 287 und 288:
Kapitel 4 Betriebsdaten Im Allgemei
- Seite 289 und 290:
Kapitel 4 Das Energiemanagement ist
- Seite 291 und 292:
Kapitel 4 der Reihe zum Programm f
- Seite 293 und 294:
Kapitel 4 Es kann eine Stoffbilanz
- Seite 295 und 296:
Kapitel 4 Zuerst müssen die Daten
- Seite 297 und 298:
Milch Rohmilchannahme Wägebrücke
- Seite 299 und 300:
Kapitel 4 (siehe Abschnitt 4.2.13.1
- Seite 301 und 302:
Kapitel 4 Technische Evaluierung Be
- Seite 303 und 304:
Kapitel 4 Verschwendung auftritt, e
- Seite 305 und 306:
4.1.7.3 Minimierung der Lagerzeiten
- Seite 307 und 308:
Anwendbarkeit Anwendbar in den Bran
- Seite 309 und 310:
Kapitel 4 getrennt werden. Dadurch
- Seite 311 und 312:
4.1.7.7 Verwendung von Nebenprodukt
- Seite 313 und 314:
Kapitel 4 Oberflächenwasser. Es ka
- Seite 315 und 316:
4.1.7.10 Optimierung von An- und Ab
- Seite 317 und 318:
Messstelle Teilbeurteilungspegel -
- Seite 319 und 320:
4.1.8.2 Steuerung der Durchflussmen
- Seite 321 und 322:
Kapitel 4 Referenzliteratur [1, CIA
- Seite 323 und 324:
4.1.8.5 Analytische Messungen Kapit
- Seite 325 und 326:
Kapitel 4 Das Ablassventil wird dan
- Seite 327 und 328:
Abbildung 4.9: Molkerückgewinnung
- Seite 329 und 330:
Kapitel 4 Die maximale Durchflussra
- Seite 331 und 332:
Kapitel 4 Anwendbarkeit Überall in
- Seite 333 und 334:
4.2 Techniken, die in einer Reihe v
- Seite 335 und 336:
Medienübergreifende Effekte Zur Er
- Seite 337 und 338:
Abbildung 4.10: Prozessablaufdiagra
- Seite 339 und 340:
Kapitel 4 In einer norwegischen Unt
- Seite 341 und 342:
4.2.5.5 Rauch aus überhitztem Damp
- Seite 343 und 344:
Referenzliteratur [89, Italian cont
- Seite 345 und 346:
4.2.8.2 Automatische Befüllung mit
- Seite 347 und 348:
4.2.9 Verdampfung Kapitel 4 Trockne
- Seite 349 und 350:
Kapitel 4 Der Dampfbedarf für eine
- Seite 351 und 352:
Kapitel 4 einer Überholung alle 2
- Seite 353 und 354:
Wirtschaftlichkeit Geringere Anscha
- Seite 355 und 356:
Kapitel 4 steigt der Energieverbrau
- Seite 357 und 358:
4.2.11.4 Erhöhung der Verdampfungs
- Seite 359 und 360:
Referenzliteratur [31, VITO, et al.
- Seite 361 und 362:
Kapitel 4 Es kann die optimale Meng
- Seite 363 und 364:
4.2.12.4 Optimierung der Effizienz
- Seite 365 und 366:
Kapitel 4 Wirtschaftlichkeit Finanz
- Seite 367 und 368:
Kapitel 4 Fall nur ein dampfturbine
- Seite 369 und 370:
4.2.13.2.1 Verbesserung der Effizie
- Seite 371 und 372:
Kapitel 4 Betriebsdaten Den Angaben
- Seite 373 und 374:
Anlass für die Umsetzung Geringere
- Seite 375 und 376:
Wirtschaftliche Aspekte Geringere E
- Seite 377 und 378:
Erreichbare Umweltvorteile Geringer
- Seite 379 und 380:
Kapitel 4 für ausgezeichnete Wärm
- Seite 381 und 382:
Kapitel 4 des Trocknerraums sollte
- Seite 383 und 384:
4.2.17.3 Abtrennung von selten oder
- Seite 385 und 386:
Kapitel 4 So können beispielsweise
- Seite 387 und 388:
Kapitel 4 Betriebsdaten Ein Beispie
- Seite 389 und 390:
Beispielanlagen Molkereien in Deuts
- Seite 391 und 392:
Kapitel 4 Druck erfordert; für die
- Seite 393 und 394:
Kapitel 4 Anwendbarkeit Anwendbar i
- Seite 395 und 396:
Die am häufigsten verwendeten Chel
- Seite 397 und 398:
Erreichbare Umweltvorteile Optimale
- Seite 399 und 400:
Wasser Produkt Wasser Reinigungslö
- Seite 401 und 402:
Kapitel 4 werden Reinigungsmittel n
- Seite 403 und 404:
Abbildung 4.22: Flussdiagramm für
- Seite 405 und 406:
Kapitel 4 quelle getätigte hinaus
- Seite 407 und 408:
4.4.1.4 Schritt 4: Auswahl von Tech
- Seite 409 und 410:
Technik Teilchengröße μm % Absch
- Seite 411 und 412:
Kapitel 4 ausreichende Umluftrate a
- Seite 413 und 414:
Behandlung Volumenstrom (m 3 /Stund
- Seite 415 und 416:
Anlass für die Umsetzung Verringer
- Seite 417 und 418:
Kapitel 4 Zyklone, die ohne andere
- Seite 419 und 420:
Beschreibung Waschturm Sprühwäsch
- Seite 421 und 422:
Abbildung 4.25: Typischer Aufbau ei
- Seite 423 und 424:
Kapitel 4 Die Reinigung der einzeln
- Seite 425 und 426:
Abbildung 4.28: Foto einer industri
- Seite 427 und 428:
Kapitel 4 im Abluftstrom vorhandene
- Seite 429 und 430:
Kapitel 4 Ozon ist ein starkes Oxid
- Seite 431 und 432:
Tropfenabscheider Flüssigkeitsvert
- Seite 433 und 434:
Kapitel 4 und Ausfallzeiten währen
- Seite 435 und 436:
Kapitel 4 Die zu erwartende Lebensd
- Seite 437 und 438:
Kapitel 4 Das zu behandelnde Abgas
- Seite 439 und 440:
Kapitel 4 Biofilter sind für Venti
- Seite 441 und 442:
Kapitel 4 Wirtschaftliche Aspekte R
- Seite 443 und 444:
Kapitel 4 Das Durchmischen des Gass
- Seite 445 und 446:
Holzschnitzel Löschwasser Rauchgen
- Seite 447 und 448:
Kapitel 4 Wirtschaftliche Aspekte D
- Seite 449 und 450:
Gasaustritt Röhrenkesselwärmetaus
- Seite 451 und 452:
Kapitel 4 Wenn Staub im Gasstrom vo
- Seite 453 und 454:
Branche Anzahl von Proben Geruchs-
- Seite 455 und 456:
Kapitel 4 Explosionsgefahr darstell
- Seite 457 und 458:
4.4.3.13.2 Erhöhung der Austrittsg
- Seite 459 und 460:
Kapitel 4 • Wiederverwendung best
- Seite 461 und 462:
Emissionsart Technik Gelöste organ
- Seite 463 und 464:
4.5.2 Primärbehandlungen (Vorbehan
- Seite 465 und 466:
Kapitel 4 Durch die Installation vo
- Seite 467 und 468:
Kapitel 4 auch als Misch- und Ausgl
- Seite 469 und 470:
Betriebsdaten Tabelle 4.51 zeigt di
- Seite 471 und 472:
Kapitel 4 werden. Mit dieser Techni
- Seite 473 und 474:
Vorteile Nachteile Geringe spezifis
- Seite 475 und 476:
Kapitel 4 Im Zuckersektor verringer
- Seite 477 und 478:
Kapitel 4 etwa sechs Stunden. Die Z
- Seite 479 und 480:
Kapitel 4 für diese Technik eine E
- Seite 481 und 482:
4.5.3.1.9 Aerobe Schnell- und Ultra
- Seite 483 und 484:
Verfahren CSB des Zulaufs Hydraulis
- Seite 485 und 486:
Erreichbare Umweltvorteile Geringer
- Seite 487 und 488:
Beispielanlagen Wird bei der Zucker
- Seite 489 und 490:
Kapitel 4 flächengewässer eingele
- Seite 491 und 492:
Kapitel 4 getrennten anoxischen Zon
- Seite 493 und 494:
Kapitel 4 Anlass für die Umsetzung
- Seite 495 und 496:
Kapitel 4 Beispielanlagen Die Aktiv
- Seite 497 und 498:
Kapitel 4 Behandlung zu unterziehen
- Seite 499 und 500:
Kapitel 4 Betriebsdaten Im Vergleic
- Seite 501 und 502:
Referenzliteratur [204, Ireland, 20
- Seite 503 und 504:
Kapitel 4 Betriebsdaten Schlämme,
- Seite 505 und 506:
Kapitel 4 Betriebsdaten Der Feuchti
- Seite 507 und 508:
Kapitel 4 In Tabelle 4.65 sind die
- Seite 509 und 510:
Herkömmlicher Belebtschlamm Stärk
- Seite 511 und 512:
Kapitel 4 Wasser frei von Salzen un
- Seite 513 und 514:
Kapitel 4 4.5.7.3.5 Wiederverwendun
- Seite 515 und 516:
Kapitel 4 Der hohe Polyphenolgehalt
- Seite 517 und 518:
Stufe 1: Abkühlung, Neutralisation
- Seite 519 und 520:
Herkömmlicher Belebtschlamm Rückg
- Seite 521 und 522:
Kartoffeln Flüssiges Kartoffeleiwe
- Seite 523 und 524:
Kapitel 4 Anlässe für die Umsetzu
- Seite 525 und 526:
Als Schwemmrinnenwasser wiederverwe
- Seite 527 und 528:
Kapitel 4 vermischt werden. Welche
- Seite 529 und 530:
Kapitel 4 darauf geachtet werden, d
- Seite 531 und 532:
NaOH Spurenelemente Druckluft Von d
- Seite 533 und 534:
Kapitel 4 • Entwicklung und Umset
- Seite 535 und 536:
Kapitel 4 (Hazard and Operability S
- Seite 537 und 538:
Solche Maßnahmen können z. B. sei
- Seite 539 und 540:
Weitere Gründe für die Ausarbeitu
- Seite 541 und 542:
4.7.1.3 Minimierung der Produktion
- Seite 543 und 544:
Referenzliteratur [Nordic Council o
- Seite 545 und 546:
Kapitel 4 Beispielanlagen Wird in d
- Seite 547 und 548:
Kapitel 4 Das Unternehmen führte 1
- Seite 549 und 550:
4.7.3.4.1 Dampfschälung - kontinui
- Seite 551 und 552:
Betriebsdaten In Tabelle 4.85 sind
- Seite 553 und 554:
ZUFUHR 110000 t Kartoffeln oder 700
- Seite 555 und 556:
Kapitel 4 zum Schälen von Äpfeln
- Seite 557 und 558:
Kapitel 4 Abschließend wird das Na
- Seite 559 und 560:
Kapitel 4 energieeffizient, da bei
- Seite 561 und 562:
Kühlzone (vom Blanchieren) Wasserk
- Seite 563 und 564:
B E I S P I E L E Wasser- verwendun
- Seite 565 und 566:
Kapitel 4 Phase, getrennt werden. D
- Seite 567 und 568:
Kapitel 4 Anlässe für die Umsetzu
- Seite 569 und 570:
Kapitel 4 wird wiederverwendet und
- Seite 571 und 572:
Kapitel 4 Der Mineralölwäscher be
- Seite 573 und 574:
Kapitel 4 Anlass für die Umsetzung
- Seite 575 und 576:
Kapitel 4 Anwendbarkeit Geeignet f
- Seite 577 und 578:
Kapitel 4 Nebenprodukts. Verringeru
- Seite 579 und 580:
4.7.4.10 Einsatz von Zyklonen zur V
- Seite 581 und 582:
Kapitel 4 substanz-Tröpfchen oder
- Seite 583 und 584:
Energieverbrauch Spezifische Werte
- Seite 585 und 586:
Kapitel 4 Anwendbarkeit Anwendbar,
- Seite 587 und 588:
Kapitel 4 • Verhindern, dass fest
- Seite 589 und 590:
UHT-Milch 1. Warenannahme 2. Qualit
- Seite 591 und 592:
Erreichbare Umweltvorteile Geringer
- Seite 593 und 594:
Kapitel 4 Betriebsdaten Eine große
- Seite 595 und 596:
4.7.5.10 Automatische Erkennung des
- Seite 597 und 598:
Kapitel 4 Anwendbarkeit In neuen un
- Seite 599 und 600:
Anlass für die Umsetzung Geringere
- Seite 601 und 602:
Kapitel 4 4.7.5.14.7 Nutzung der in
- Seite 603 und 604:
Referenzliteratur [42, Nordic Counc
- Seite 605 und 606:
Kapitel 4 Erreichbare Umweltvorteil
- Seite 607 und 608:
Referenzliteratur [182, Germany, 20
- Seite 609 und 610:
Kapitel 4 Die Wärmemenge, die für
- Seite 611 und 612:
Kapitel 4 auf Grundlage einer läng
- Seite 613 und 614:
Abbildung 4.69: Schematische Darste
- Seite 615 und 616:
Berechnungen für eine Verarbeitung
- Seite 617 und 618:
Kapitel 4 • Gasturbine zur Reduzi
- Seite 619 und 620:
Kapitel 4 Außerdem kann die Stromb
- Seite 621 und 622:
Beispielanlagen Zuckerhersteller in
- Seite 623 und 624:
Kapitel 4 Beschreibung In einer Bei
- Seite 625 und 626:
Abbildung 4.75: Kontinuierliche Kaf
- Seite 627 und 628:
4.7.8.4.3 Kaffeeröstung mit nachfo
- Seite 629 und 630:
4.7.8.4.4 Nutzung von Biofiltern in
- Seite 631 und 632:
Kapitel 4 Abbildung 4.22 zeigt die
- Seite 633 und 634:
Kapitel 4 Die Filtration durch nat
- Seite 635 und 636:
Kapitel 4 Nicht ausreichend gefüll
- Seite 637 und 638:
Angewandte Technik Veraltete Techni
- Seite 639 und 640:
Kapitel 4 Im Laugenbad werden die G
- Seite 641 und 642:
Wirtschaftlichkeit Kosteneinsparung
- Seite 643 und 644:
Kapitel 4 Maßnahme Verfahren Besch
- Seite 645 und 646:
Wassersparmaßnahme Typische Verrin
- Seite 647 und 648:
Kapitel 4 Kaltwasser für Aufgaben
- Seite 649 und 650:
Kapitel 4 gesteuerte Auffüllventil
- Seite 651 und 652:
Parameter Einheit Menge Wasserverbr
- Seite 653 und 654:
5 BESTE VERFÜGBARE TECHNIKEN Kapit
- Seite 655 und 656:
5.1 Allgemeine BVT für den gesamte
- Seite 657 und 658:
Kapitel 5 7 Führen einer genauen I
- Seite 659 und 660:
Kapitel 5 • Überlegungen zur Ent
- Seite 661 und 662:
Kapitel 5 2 Verwendung von Reinigun
- Seite 663 und 664:
Kapitel 5 Zur Vermeidung von Luftem
- Seite 665 und 666:
Kapitel 5 18 Trocknung (siehe Absch
- Seite 667 und 668:
Kapitel 5 4 Schälen von Obst und G
- Seite 669 und 670:
Energieverbrauch Wasserverbrauch Ab
- Seite 671:
Kapitel 5 Vermeidung der Produktion
- Seite 675 und 676:
7 CONCLUDING REMARKS 7.1 Timing of
- Seite 677 und 678:
Chapter 7 CIAA and its member organ
- Seite 679 und 680:
Chapter 7 The legislative requireme
- Seite 681:
Chapter 7 • the application of no
- Seite 684 und 685:
References 39 Verband der Deutschen
- Seite 686 und 687:
References 91 Italian contribution
- Seite 688 und 689:
References 183 CIAA-UNAFPA (2003).
- Seite 690 und 691:
References 229 EC (1990). "Council
- Seite 693 und 694:
GLOSSARY HINWEIS: Die deutschsprach
- Seite 695 und 696:
Glossary great deal of silica is al
- Seite 697 und 698:
Glossary Vinasses A by-product that
- Seite 699 und 700:
Glossary ISCST Industrial source co
- Seite 701 und 702:
Currency abbreviations Abbreviation
- Seite 703 und 704:
GLOSSAR Glossar Dieses Glossar dien
- Seite 705 und 706:
Glossar Eutrophierung Verschmutzung
- Seite 707 und 708:
Glossar Schale Die äußere, eine F
- Seite 709 und 710:
Glossar DDGS Feste und gelöste Sto
- Seite 711 und 712:
Glossar PET Polyethylenterephtalat
- Seite 713 und 714:
Einheitenzeichen Einheiten zeichen