und Standortentwicklung des wiedervernässten Grünlandes im ...
und Standortentwicklung des wiedervernässten Grünlandes im ...
und Standortentwicklung des wiedervernässten Grünlandes im ...

Erfolgreiche ePaper selbst erstellen
Machen Sie aus Ihren PDF Publikationen ein blätterbares Flipbook mit unserer einzigartigen Google optimierten e-Paper Software.
50 4. Untersuchungsergebnisse<br />
Phosphor [g/kg]<br />
3,4<br />
3,2<br />
3,0<br />
2,8<br />
2,6<br />
2,4<br />
2,2<br />
2,0<br />
1,8<br />
N =<br />
8<br />
CBa (5+/4)<br />
8<br />
CBb (6+/5)<br />
8<br />
CZc (5+/4)<br />
8<br />
CZd (5+/+)<br />
8<br />
GBa (5+/+)<br />
8<br />
GBb (6+/5)<br />
Probeentnahmestelle<br />
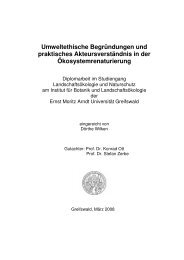
Abbildung 29: Phosphatgehalt von Carex riparia, Glyceria max<strong>im</strong>a <strong>und</strong> Typha latifolia an<br />
ausgewählten Standorten<br />
(CBa = Carex riparia-Probefläche Bugewitz a, CBb = Carex riparia-Probefläche Bugewitz b, CZc = Carex riparia-Probefläche<br />
Zartenstrom c, CZd = Carex riparia-Probefläche Zartenstrom d, GBa = Glyceria max<strong>im</strong>a-Probefläche Bugewitz a, GBb =<br />
Glyceria max<strong>im</strong>a-Probefläche Bugewitz b, GZc = Glyceria max<strong>im</strong>a-Probefläche Zartenstrom c, GZd = Glyceria max<strong>im</strong>a-<br />
Probefläche Zartenstrom d, TBa = Typha latifolia-Probefläche Bugewitz a, TBb = Typha latifolia-Probefläche Bugewitz b, TZc =<br />
Typha latifolia-Probefläche Zartenstrom c, TZd = Typha latifolia-Probefläche Zartenstrom d)<br />
Tabelle 18: Signifikanztest der N/P-Verhältnisse der oberirdischen Biomasse an den<br />
verschiedenen Standorten<br />
Carex riparia Glyceria max<strong>im</strong>a Typha latifolia<br />
CBa CBb CZc CZd GBa GBb GZc GZd TBa TBb TZc TZd<br />
- n s s CBa - s s s GBa - n n n TBa<br />
n - s n CBb s - s s GBb n - n s TBb<br />
n s - s CZc s n - n GZc n n - s TZc<br />
s s s - CZd s s n - GZd n s s - TZd<br />
(CBa = Carex riparia-Probefläche Bugewitz a, CBb = Carex riparia-Probefläche Bugewitz b, CZc = Carex riparia-Probefläche<br />
Zartenstrom c, CZd = Carex riparia-Probefläche Zartenstrom d, GBa = Glyceria max<strong>im</strong>a-Probefläche Bugewitz a, GBb =<br />
Glyceria max<strong>im</strong>a-Probefläche Bugewitz b, GZc = Glyceria max<strong>im</strong>a-Probefläche Zartenstrom c, GZd = Glyceria max<strong>im</strong>a-<br />
Probefläche Zartenstrom d, TBa = Typha latifolia-Probefläche Bugewitz a, TBb = Typha latifolia-Probefläche Bugewitz b, TZc =<br />
Typha latifolia-Probefläche Zartenstrom c, TZd = Typha latifolia-Probefläche Zartenstrom d, n = Unterschied ist nicht signifikant,<br />
s = Unterschied ist signifikant, α = 0,5, t = 2,31)<br />
Die N/P-Verhältnisse der Biomasse waren an allen untersuchten Standorten gering. Das<br />
N/P-Verhältnis von Typha latifolia unterschied sich nicht signifikant von Carex riaparia.<br />
Ansonsten ergaben sich zwischen den Arten signifikante Unterschiede (Tabelle 21). Für<br />
Carex riparia wurden mittlere N/P-Werte von 6,48 bis 7,4 festgestellt. Etwas geringere N/P-<br />
Verhältnisse wies Typha latifolia mit mittleren Werten zwischen 6,43 <strong>und</strong> 6,9 auf. Die<br />
kleinsten N/P-Werte erreichte Glyceria max<strong>im</strong>a, die <strong>im</strong> Mittel zwischen 4,72 <strong>und</strong> 5,52 lagen.<br />
Tabelle 18 verdeutlicht die Ausbildung signifikanter Unterschiede der N/P-Verhältnisse von<br />
8<br />
GZc (5+/+)<br />
8<br />
GZd (6+/5)<br />
8<br />
TBa (5+/+)<br />
8<br />
TBb (6+/5)<br />
8<br />
TZc (5+/+)<br />
8<br />
TZd (6+/+)