grossprojekte als instrument der stadtentwicklungspolitik und -planung
grossprojekte als instrument der stadtentwicklungspolitik und -planung
grossprojekte als instrument der stadtentwicklungspolitik und -planung

Erfolgreiche ePaper selbst erstellen
Machen Sie aus Ihren PDF Publikationen ein blätterbares Flipbook mit unserer einzigartigen Google optimierten e-Paper Software.
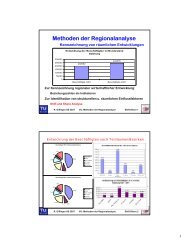
Großprojekte <strong>als</strong> Instrument <strong>der</strong> Stadtentwicklungspolitik<br />
Projekt 3 2001/02<br />
Aufgr<strong>und</strong> des hohen Investitionsvolumens ist die berechnete induzierte<br />
Auswirkung <strong>der</strong> Spiele außergewöhnlich groß ausgefallen. Der beträchtliche<br />
Einkommensanstieg durch Konsum <strong>und</strong> Investitionen hat durch<br />
Multiplikatoreffekte erhebliche wirtschaftliche Zuwächse erzeugt. Insgesamt<br />
betrug die induzierte Auswirkung für die Jahre 1987 bis 1992 16,6 Milliarden<br />
USD. Addiert man zu diesem Betrag noch den direkten Effekt, kommt man<br />
auf eine Summe von 26 Milliarden USD. Die Entstehung <strong>und</strong> zeitliche<br />
Verteilung dieser Wirtschaftsgröße wird anhand <strong>der</strong> nächsten Tabelle bzw.<br />
<strong>der</strong> Abbildung veranschaulicht:<br />
Tokyo 1964 Montreal 1976 Los Angeles 1984 Seoul 1988 Barcelona 1992<br />
In millions of $US M of $ % M of $ % M of $ % M od $ % M of $ %<br />
Direct expenditures 452,116 2.7% 2,824,863 89.0% 522,436 100.0% 1,467,853 46.5% 2,460,855 26.2%<br />
Indirect expenditures<br />
Operational expenditures 169,510 1.0% 411,857 13.0% 450,394 86.2% 478,204 15.2% 1,361,156 14.5%<br />
Direct investments 282,605 1.7% 2,413,006 76.0% 72,042 13.8% 989,649 31.4% 1,099,699 11.7%<br />
Indirect investments 6,373,372 97.3% 350,012 11.1% - - 1,687,423 53.5% 6,915,274 73.8%<br />
Total Olympic investments 6,825,488 100.0% 3.174,875 100.0% 522,486 100.0% 3,155,276 100.0% 9,376,129 100.0%<br />
Table 6. Economic impact of the 1992 Barcelona Olympic Games<br />
Tabelle 3–10: Investitionen für Olympische Spiele<br />
Quelle: Brunet, 1995<br />
Period 1986-1993 In millions of current pesetas Distribution<br />
Direct accumulated impact 1,165,600 37,5%<br />
Investment 956,630 30.8%<br />
Public Investment 643,613 20.7%<br />
City of Barcelona 22,789 0.7%<br />
Central Administration 246,540 7.9%<br />
HOLSA: investment 154,896 5.0%<br />
Generalitat de Catalunya 142,726 4.6%<br />
COOB'92: investment 32,714 1.1%<br />
Other public administrations 43,948 1.4%<br />
Private investment 313,017 10,1%<br />
Consumption 208,970 6.7%<br />
COOB'92: current expenditures 162,880 5.2%<br />
Consumption of visitors 46,090 1.5%<br />
Induced accumulated impact 1,942,188 62.5%<br />
Total accumulated impact 3,107,788 100.0%<br />
Tabelle 3–11: Gesamte wirtschaftliche Auswirkung <strong>der</strong> Olympischen Spiele in Barcelona<br />
Quelle: Brunet, 1995<br />
84

![[ 1 ] Systemtheorie und Systemanalyse](https://img.yumpu.com/26547382/1/190x135/-1-systemtheorie-und-systemanalyse.jpg?quality=85)