Verkehr in Österreich Heft 32
Verkehr in Österreich Heft 32
Verkehr in Österreich Heft 32

Sie wollen auch ein ePaper? Erhöhen Sie die Reichweite Ihrer Titel.
YUMPU macht aus Druck-PDFs automatisch weboptimierte ePaper, die Google liebt.
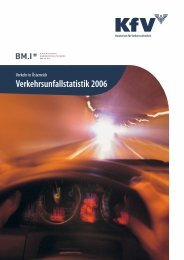
Unfallstatistik 2001<br />
Unfälle je 10.000 E<strong>in</strong>wohner<br />
80<br />
70<br />
60<br />
50<br />
40<br />
30<br />
20<br />
10<br />
0<br />
53,4<br />
34,2<br />
57,8<br />
Institut für <strong>Verkehr</strong>stechnik und Unfallstatistik<br />
49,9<br />
68,2<br />
Ö Bgld Ktn NÖ OÖ Sbg Stmk Tirol Vbg Wien<br />
Tabelle: Unfälle, Verletzte und Getötete nach Bundesländern<br />
E<strong>in</strong>wohner Unfälle Verletzte Getötete Unfälle [%] Verletzte [%] Getötete [%]<br />
BGLD 278.600 952 1.264 52 2,2 2,2 5,4<br />
KNT 561.126 3.242 4.122 62 7,5 7,3 6,5<br />
NÖ 1.549.658 7.728 10.262 261 17,9 18,2 27,2<br />
OÖ 1.381.993 9.423 12.562 167 21,9 22,3 17,4<br />
SBG 518.587 3.028 3.937 66 7,0 7,0 6,9<br />
STMK 1.186.379 7.428 9.583 161 17,2 17,0 16,8<br />
TIROL 675.070 4.572 6.021 115 10,6 10,7 12,0<br />
VBG 351.570 1.683 2.1<strong>32</strong> 33 3,9 3,8 3,4<br />
WIEN 1.562.482 5.017 6.382 41 11,6 11,3 4,3<br />
Ö 8.065.465 43.073 56.265 958 100,0 100,0 100,0<br />
Quelle: Statistik Austria, Statistisches Jahrbuch <strong>Österreich</strong>s 2002;<br />
Verlag <strong>Österreich</strong> GmbH, Wien 2001, Seite 40<br />
58,4<br />
62,6<br />
67,7<br />
47,9<br />
VERWALTUNGSEINHEITEN<br />
unfallort<br />
<strong>32</strong>,1<br />
EIN VERGLEICH der Bundesländer zeigt,<br />
dass Oberösterreich und Niederösterreich<br />
bei den Unfällen und Verletzten<br />
die Negativliste anführen.<br />
Demgegenüber ist die Anzahl der<br />
Unfälle und Verletzten im Burgenland<br />
sehr niedrig. Auffällig ist der hohe<br />
Getötetenanteil <strong>in</strong> Niederösterreich.<br />
Den ger<strong>in</strong>gsten Getötetenanteil hat<br />
Vorarlberg.<br />
19<br />
ENTWICKLUNG<br />
UNFALLORT<br />
VERKEHRSBETEILIGUNG<br />
ALTERSGRUPPEN<br />
UNFALLTYPEN UND -URSACHEN