Das Haus der Arbeitsfähigkeit gestalten: - bei der ...
Das Haus der Arbeitsfähigkeit gestalten: - bei der ... Das Haus der Arbeitsfähigkeit gestalten: - bei der ...
Prevalence (%) of factors fulfilling the criteria for a good worklife and the mean rating of workplaces according to European region. Factor Nordic Middle Southern countries Europe Europe (n = 4 526) (n = 10 796) (n = 6 130) Physical environment 42,9 49,7 50,6 Physical work load 23,8 29,8 25,4 Tight work schedules 18,6 27,1 34,9 Ability to regulate 42,4 37,9 40,0 Work skills 88,6 82,2 82,7 Social environment 81,8 71,7 49,9 Discussions lead to improvements 75,2 66,8 54,0 Age discrimination 96,7 96,6 98,3 Health, safety 80,3 72,1 60,7 Work promotes health 1,3 1,1 0,6 Working in the same job at 60 years of age 54,2 52,7 46,8 Job satisfaction 90,6 87,3 76,0 Mean (min 0, max 12) 6,96 (SD 1,85 1 ) 6,75 (SD 2,09 1 ) 6,20 (SD 2,16 1 ) 1 SD = standard deviation. Finnish Institute of Occupational Health / Prof. Dr. Juhani Ilmarinen 60 Taulukko 89
Lücken zwischen Information - Wissen - Handeln INFORMATION Wissen Lücke/C Lücke/B Lücke/A Handeln Finnish Institute of Occupational Health / Prof. Dr. Juhani Ilmarinen 61
- Seite 9 und 10: WAI in Mittleren und Kleinbetrieben
- Seite 11 und 12: 44 42 40 38 36 34 Arbeitsfähigkeit
- Seite 13 und 14: Arbeitsfähigkeitsindex nach Alter
- Seite 15 und 16: WAI als Hilfsmittel im Betrieb •
- Seite 17 und 18: Finnish Institute of Occupational H
- Seite 19 und 20: Verbesserung der Teamarbeit und der
- Seite 21 und 22: Gesundheitsförderung und Verbesser
- Seite 23 und 24: WAI Good retirement ability in 1997
- Seite 25 und 26: Beschäftigungsfähigkeit
- Seite 27 und 28: Age Management
- Seite 29 und 30: Ansatz: Integrationsmodell des Age
- Seite 31 und 32: Age Management Training 40 20 0 % 1
- Seite 33 und 34: Ziele des Age Management Trainings
- Seite 35 und 36: Inhalt des Trainingsprogramm Verän
- Seite 37 und 38: Strukturen im Lebensverlauf - hinte
- Seite 39 und 40: Life course and Tacit Knowledge 20
- Seite 41 und 42: Älter werden - Zuwachs an mentalen
- Seite 43 und 44: Altern und funktionelle Kapazität
- Seite 45 und 46: Dimensionen des Alterns • Chronol
- Seite 47 und 48: Jahre 60 50 40 30 < 50 Jahre ≥ 50
- Seite 49 und 50: Beschäftigungsgrad Eine grosse Her
- Seite 51 und 52: % 40 35 30 25 20 15 10 5 0 Share of
- Seite 53 und 54: Iceland Norway Switzerland Japan US
- Seite 55 und 56: Iceland Norway Switzerland USA Japa
- Seite 57 und 58: Beschäftigungsrate im Alter von 60
- Seite 59: Was sollte im nationalen Rahmen und
- Seite 63: Finnish Institute of Occupational H
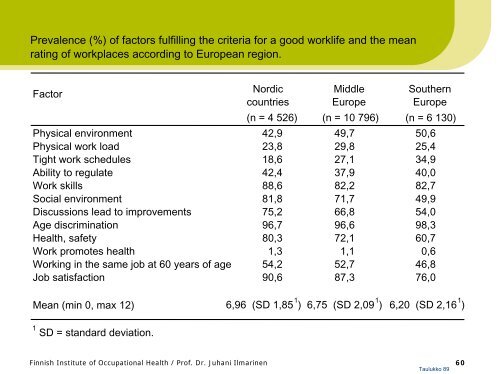
Prevalence (%) of factors fulfilling the criteria for a good worklife and the mean<br />
rating of workplaces according to European region.<br />
Factor<br />
Nordic Middle Southern<br />
countries Europe Europe<br />
(n = 4 526) (n = 10 796) (n = 6 130)<br />
Physical environment 42,9 49,7 50,6<br />
Physical work load 23,8 29,8 25,4<br />
Tight work schedules 18,6 27,1 34,9<br />
Ability to regulate 42,4 37,9 40,0<br />
Work skills 88,6 82,2 82,7<br />
Social environment 81,8 71,7 49,9<br />
Discussions lead to improvements 75,2 66,8 54,0<br />
Age discrimination 96,7 96,6 98,3<br />
Health, safety 80,3 72,1 60,7<br />
Work promotes health 1,3 1,1 0,6<br />
Working in the same job at 60 years of age 54,2 52,7 46,8<br />
Job satisfaction 90,6 87,3 76,0<br />
Mean (min 0, max 12) 6,96 (SD 1,85 1 ) 6,75 (SD 2,09 1 ) 6,20 (SD 2,16 1 )<br />
1 SD = standard deviation.<br />
Finnish Institute of Occupational Health / Prof. Dr. Juhani Ilmarinen 60<br />
Taulukko 89


