Annual Report 2009/2010 Geschäftsbericht 2009/2010 ... - biolitec AG
Annual Report 2009/2010 Geschäftsbericht 2009/2010 ... - biolitec AG
Annual Report 2009/2010 Geschäftsbericht 2009/2010 ... - biolitec AG

Erfolgreiche ePaper selbst erstellen
Machen Sie aus Ihren PDF Publikationen ein blätterbares Flipbook mit unserer einzigartigen Google optimierten e-Paper Software.
36 Management <strong>Report</strong> Konzernlagebericht<br />
<strong>2009</strong>/<strong>2010</strong><br />
K Euro<br />
Change/<br />
Veränderung<br />
2008/<strong>2009</strong><br />
K Euro<br />
Europe Europa 14,252 (6.4)% 15,449<br />
North America Nordamerika 11,692 5.8% 11,052<br />
Asia and Rest of<br />
World<br />
Asien und der Rest<br />
der Welt<br />
4,240 5.5% 4,018<br />
Total Summe 30,384 (0.4) % 30,519<br />
Profit and Profitability<br />
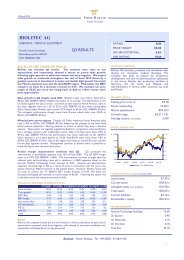
In <strong>2009</strong>/<strong>2010</strong> <strong>biolitec</strong> achieved a result of KEUR -45 (previous year: KEUR -2.581) before taxes and interests<br />
(EBIT). The EBIT was positively influenced by the cost-cutting measures (restructuring, adjustment<br />
of remuneration agreements), especially costs of distribution. The turnover during the past financial<br />
year is similar to the turnover in the previous year. The EBIT margin increased by 8.35 points up to -0.15%<br />
(previous year: -8.5%).<br />
Gross profit was EUR 19.6 million, amounting to 64% of the overall revenues (previous year: 61%). Compared<br />
to the previous year production costs amounted to 36% (previous year: 39%) of the turnover.<br />
Despite the unchanged sales and the continuously high R&D expenditures which guarantee the group’s<br />
long-term growth and profitability no positive profit could yet be achieved. Net income from continued<br />
operations improved by EUR 1.11 million up to EUR -0.25 million (previous year: EUR -1.36 million).<br />
Selected key figures provide an overview of the profit situation:<br />
Key Figures Mio. Euro<br />
Total sales 30.4<br />
Costs of goods manufactured (10.8)<br />
Gross balance 19.6<br />
Operating result (0.1)<br />
EBIT 0.0<br />
EBIT w/o R&D costs 3.45<br />
Loss from continued operations (0.2)<br />
Loss from discontinued operations (1.1)<br />
Surplus w/o R&F costs 3.3