K u rzfassu n g sb an d - Graz University of Technology
K u rzfassu n g sb an d - Graz University of Technology
K u rzfassu n g sb an d - Graz University of Technology
- Keine Tags gefunden...

Erfolgreiche ePaper selbst erstellen
Machen Sie aus Ihren PDF Publikationen ein blätterbares Flipbook mit unserer einzigartigen Google optimierten e-Paper Software.
Energieinnovation 2006 77<br />
renewable electricity generation <strong>an</strong>d the stock <strong>of</strong> power pl<strong>an</strong>ts in Germ<strong>an</strong>y. In order to provide <strong>an</strong><br />
adequate dataset the PowerACE simulation platform is linked to models generating realistic hourly<br />
load pr<strong>of</strong>iles for electricity dem<strong>an</strong>d <strong>an</strong>d renewable electricity generation.<br />
In a case study the model is applied to simulate spot market prices in the year 2001 which has been<br />
selected due to the availability <strong>of</strong> detailed load data on renewable electricity generation <strong>an</strong>d electricity<br />
dem<strong>an</strong>d. The basic simulation is structured as follows. The entire Germ<strong>an</strong> electricity generation <strong>an</strong>d<br />
dem<strong>an</strong>d is traded on the spot market on hourly basis. Electricity generation comp<strong>an</strong>ies bid their merit<br />
order curves based on the variable electricity generation cost <strong>of</strong> their power pl<strong>an</strong>ts. Unit commitment<br />
constraints like cost concerning the warm up times <strong>of</strong> power pl<strong>an</strong>ts are integrated in a second<br />
simulation run. A r<strong>an</strong>dom generator is used to integrate scheduled <strong>an</strong>d unscheduled pl<strong>an</strong>t outages.<br />
Electricity dem<strong>an</strong>d is represented by suppliers which purchase electricity <strong>an</strong>d sell it to consumers. In<br />
the given simulation the suppliers are modelled as price takers with inelastic electricity dem<strong>an</strong>d.<br />
A first comparison between the time series <strong>of</strong> hourly prices <strong>of</strong> the Germ<strong>an</strong> spot market in 2001 <strong>an</strong>d the<br />
average simulated prices <strong>of</strong> 20 simulation runs with the PowerACE model <strong>an</strong>d the developed<br />
algorithm for the integration <strong>of</strong> start-up cost shows a low correlation <strong>an</strong>d a considerable<br />
underestimation <strong>of</strong> the <strong>an</strong>nual average price. However, a closer look the actual spot market prices in<br />
2001 shows that market prices <strong>of</strong> up to 998 Euro/MWh are reached which indicate extensive gaming<br />
on the market during few hours throughout the year. In order to reduce these effects 53 hours with<br />
market prices above 90 Euro are excluded from further <strong>an</strong>alysis. The correlation between both timeseries<br />
rises to ca. 0.713 <strong>an</strong>d the average underestimation <strong>of</strong> the market prices reaches 2.3 Euro/MWh.<br />
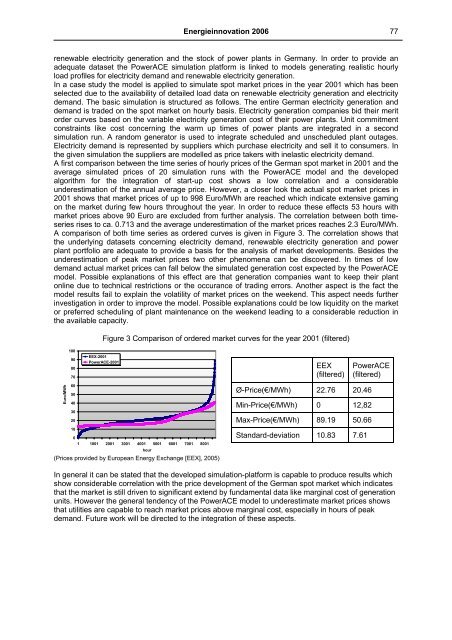
A comparison <strong>of</strong> both time series as ordered curves is given in Figure 3. The correlation shows that<br />
the underlying datasets concerning electricity dem<strong>an</strong>d, renewable electricity generation <strong>an</strong>d power<br />
pl<strong>an</strong>t portfolio are adequate to provide a basis for the <strong>an</strong>alysis <strong>of</strong> market developments. Besides the<br />
underestimation <strong>of</strong> peak market prices two other phenomena c<strong>an</strong> be discovered. In times <strong>of</strong> low<br />
dem<strong>an</strong>d actual market prices c<strong>an</strong> fall below the simulated generation cost expected by the PowerACE<br />
model. Possible expl<strong>an</strong>ations <strong>of</strong> this effect are that generation comp<strong>an</strong>ies w<strong>an</strong>t to keep their pl<strong>an</strong>t<br />
online due to technical restrictions or the occur<strong>an</strong>ce <strong>of</strong> trading errors. Another aspect is the fact the<br />
model results fail to explain the volatility <strong>of</strong> market prices on the weekend. This aspect needs further<br />
investigation in order to improve the model. Possible expl<strong>an</strong>ations could be low liquidity on the market<br />
or preferred scheduling <strong>of</strong> pl<strong>an</strong>t mainten<strong>an</strong>ce on the weekend leading to a considerable reduction in<br />
the available capacity.<br />
Figure 3 Comparison <strong>of</strong> ordered market curves for the year 2001 (filtered)<br />
100<br />
90<br />
80<br />
70<br />
EEX-2001<br />
PowerACE-2001<br />
EEX<br />
(filtered)<br />
PowerACE<br />
(filtered)<br />
Euro/MWh<br />
60<br />
50<br />
40<br />
30<br />
20<br />
10<br />
0<br />
1 1001 2001 3001 4001 5001 6001 7001 8001<br />
hour<br />
(Prices provided by Europe<strong>an</strong> Energy Exch<strong>an</strong>ge [EEX], 2005)<br />
Ø-Price(€/MWh) 22.76 20.46<br />
Min-Price(€/MWh) 0 12,82<br />
Max-Price(€/MWh) 89.19 50.66<br />
St<strong>an</strong>dard-deviation 10.83 7.61<br />
In general it c<strong>an</strong> be stated that the developed simulation-platform is capable to produce results which<br />
show considerable correlation with the price development <strong>of</strong> the Germ<strong>an</strong> spot market which indicates<br />
that the market is still driven to signific<strong>an</strong>t extend by fundamental data like marginal cost <strong>of</strong> generation<br />
units. However the general tendency <strong>of</strong> the PowerACE model to underestimate market prices shows<br />
that utilities are capable to reach market prices above marginal cost, especially in hours <strong>of</strong> peak<br />
dem<strong>an</strong>d. Future work will be directed to the integration <strong>of</strong> these aspects.