- Seite 1 und 2:
STATISTISCHES LANDESAMT 2013 STATIS
- Seite 3:
Vorwort In Rheinland-Pfalz … 5
- Seite 6 und 7:
Tabellenverzeichnis 1. Allgemeine A
- Seite 8 und 9:
Tabellenverzeichnis 5.3 Hochschulen
- Seite 10 und 11:
Tabellenverzeichnis 10.2 Pflanzlich
- Seite 12 und 13:
Tabellenverzeichnis 15.1.4 Güterve
- Seite 14 und 15:
Tabellenverzeichnis 20.6 Durchschni
- Seite 16 und 17:
Grafikverzeichnis 1. Allgemeine Ang
- Seite 18 und 19:
Kartenverzeichnis 1. Allgemeine Ang
- Seite 20 und 21:
Vorbemerkungen Aufgliederung von Su
- Seite 22 und 23:
1. Allgemeine Angaben Übersichten
- Seite 24 und 25:
1. Allgemeine Angaben 1. Gemeinsame
- Seite 26 und 27:
1. Allgemeine Angaben 7. Naturparke
- Seite 28 und 29:
1. Allgemeine Angaben Jahresmittelt
- Seite 30 und 31:
2. Gebiet und Bevölkerung Übersic
- Seite 32 und 33:
2. Gebiet und Bevölkerung 5 Die Ge
- Seite 34 und 35:
2. Gebiet und Bevölkerung 2. Nutzu
- Seite 36 und 37:
2. Gebiet und Bevölkerung 4. Gemei
- Seite 38 und 39:
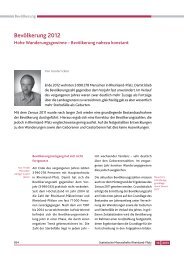
2. Gebiet und Bevölkerung Bevölke
- Seite 40 und 41:
2. Gebiet und Bevölkerung 9. Bevö
- Seite 42 und 43:
2. Gebiet und Bevölkerung 10. Frau
- Seite 44 und 45:
2. Gebiet und Bevölkerung 12. Eing
- Seite 46 und 47:
2. Gebiet und Bevölkerung 16. Fami
- Seite 48 und 49:
2. Gebiet und Bevölkerung 18. Priv
- Seite 50 und 51:
3. Bevölkerungsbewegung 3.1 Natür
- Seite 52 und 53:
3. Bevölkerungsbewegung 3.1 Natür
- Seite 54 und 55:
3. Bevölkerungsbewegung 3.1 Natür
- Seite 56 und 57:
3. Bevölkerungsbewegung 3.1 Natür
- Seite 58 und 59:
3. Bevölkerungsbewegung 3.1 Natür
- Seite 60 und 61:
3. Bevölkerungsbewegung 3.1 Natür
- Seite 62 und 63:
3. Bevölkerungsbewegung 3.2 Räuml
- Seite 64 und 65:
3. Bevölkerungsbewegung 3.2 Räuml
- Seite 66 und 67:
4. Gesundheitswesen Übersichten 4
- Seite 68 und 69:
4. Gesundheitswesen 4 ICD 10: Inter
- Seite 70 und 71:
4. Gesundheitswesen 3. Krankenhäus
- Seite 72 und 73:
4. Gesundheitswesen Behandlungsfäl
- Seite 74 und 75:
4. Gesundheitswesen 6. Freipraktizi
- Seite 76 und 77:
4. Gesundheitswesen Gestorbene 2012
- Seite 78 und 79:
4. Gesundheitswesen 9. Sterbefälle
- Seite 80 und 81:
4. Gesundheitswesen 12. Körpergrö
- Seite 82 und 83:
4. Gesundheitswesen Rauchgewohnheit
- Seite 84 und 85:
5. Bildung 5.1 Allgemeinbildende un
- Seite 86 und 87:
5. Bildung 5.1 Allgemeinbildende un
- Seite 88 und 89:
5. Bildung 5.1 Allgemeinbildende un
- Seite 90 und 91:
5. Bildung 5.1 Allgemeinbildende un
- Seite 92 und 93:
5. Bildung 5.1 Allgemeinbildende un
- Seite 94 und 95:
5. Bildung 5.1 Allgemeinbildende un
- Seite 96 und 97:
5. Bildung 5.1 Allgemeinbildende un
- Seite 98 und 99:
5. Bildung 5.1 Allgemeinbildende un
- Seite 100 und 101:
5. Bildung 5.1 Allgemeinbildende un
- Seite 102 und 103:
5. Bildung 5.2 Berufsbildung 1. Neu
- Seite 104 und 105:
5. Bildung 5.2 Berufsbildung 3. Aus
- Seite 106 und 107:
5. Bildung 5.2 Berufsbildung 5. Aus
- Seite 108 und 109:
5. Bildung 5.3 Hochschulen Übersic
- Seite 110 und 111:
5. Bildung 5.3 Hochschulen 1. Studi
- Seite 112 und 113:
5. Bildung 5.3 Hochschulen 3. Studi
- Seite 114 und 115:
5. Bildung 5.3 Hochschulen 5. Neuha
- Seite 116 und 117:
5. Bildung 5.4 Ausbildungsförderun
- Seite 118 und 119:
5. Bildung 5.4 Ausbildungsförderun
- Seite 120 und 121:
6. Kultur und gesellschaftliche Ein
- Seite 122 und 123:
6. Kultur und gesellschaftliche Ein
- Seite 124 und 125:
6. Kultur und gesellschaftliche Ein
- Seite 126 und 127:
6. Kultur und gesellschaftliche Ein
- Seite 128 und 129:
6. Kultur und gesellschaftliche Ein
- Seite 130 und 131:
6. Kultur und gesellschaftliche Ein
- Seite 132 und 133:
7. Rechtspflege und öffentliche Si
- Seite 134 und 135:
7. Rechtspflege und öffentliche Si
- Seite 136 und 137:
7. Rechtspflege und öffentliche Si
- Seite 138 und 139:
7. Rechtspflege und öffentliche Si
- Seite 140 und 141:
7. Rechtspflege und öffentliche Si
- Seite 142 und 143:
7. Rechtspflege und öffentliche Si
- Seite 144 und 145:
7. Rechtspflege und öffentliche Si
- Seite 146 und 147:
8. Wahlen Übersichten 8 Tabelle Ti
- Seite 148 und 149:
8. Wahlen Sitzverteilung der deutsc
- Seite 150 und 151:
8. Wahlen 5. Bundestagswahlen in Rh
- Seite 152 und 153:
8. Wahlen 8. Landtagswahlen 1947-20
- Seite 154 und 155:
8. Wahlen 10. Landtagswahl vom 27.
- Seite 156 und 157:
8. Wahlen 13. Stadtrats-/Kreistagsw
- Seite 158 und 159:
8. Wahlen 14. Verbandsgemeinderatsw
- Seite 160 und 161:
8. Wahlen 18. Wahlen zum Bezirkstag
- Seite 162 und 163:
9. Erwerbstätigkeit Übersichten 9
- Seite 164 und 165:
9. Erwerbstätigkeit 9 Arbeitslose:
- Seite 166 und 167:
9. Erwerbstätigkeit 3. Erwerbstät
- Seite 168 und 169:
9. Erwerbstätigkeit Erwerbstätige
- Seite 170 und 171:
9. Erwerbstätigkeit 5. Geleistete
- Seite 172 und 173:
9. Erwerbstätigkeit Erwerbstätige
- Seite 174 und 175:
9. Erwerbstätigkeit Pendlersaldo a
- Seite 176 und 177:
9. Erwerbstätigkeit 10. Jahr Arbei
- Seite 178 und 179:
9. Erwerbstätigkeit Arbeitslosenqu
- Seite 180 und 181:
9. Erwerbstätigkeit 13. Mitglieder
- Seite 182 und 183:
10. Land- und Forstwirtschaft 10.1
- Seite 184 und 185:
10. Land- und Forstwirtschaft 10.1
- Seite 186 und 187:
10. Land- und Forstwirtschaft 10.1
- Seite 188 und 189:
10. Land- und Forstwirtschaft 10.1
- Seite 190 und 191:
10. Land- und Forstwirtschaft 10.1
- Seite 192 und 193:
10. Land- und Forstwirtschaft 10.1
- Seite 194 und 195:
10. Land- und Forstwirtschaft 10.2
- Seite 196 und 197:
10. Land- und Forstwirtschaft 10.2
- Seite 198 und 199:
10. Land- und Forstwirtschaft 10.2
- Seite 200 und 201:
10. Land- und Forstwirtschaft 10.2
- Seite 202 und 203:
10. Land- und Forstwirtschaft 10.2
- Seite 204 und 205:
10. Land- und Forstwirtschaft 10.2
- Seite 206 und 207:
10. Land- und Forstwirtschaft 10.2
- Seite 208 und 209:
11. Unternehmen, Gewerbeanzeigen, I
- Seite 210 und 211:
11. Unternehmen, Gewerbeanzeigen, I
- Seite 212 und 213:
11. Unternehmen, Gewerbeanzeigen, I
- Seite 214 und 215:
11. Unternehmen, Gewerbeanzeigen, I
- Seite 216 und 217:
11. Unternehmen, Gewerbeanzeigen, I
- Seite 218 und 219:
11. Unternehmen, Gewerbeanzeigen, I
- Seite 220 und 221:
12. Produzierendes Gewerbe, Handwer
- Seite 222 und 223:
12. Produzierendes Gewerbe, Handwer
- Seite 224 und 225:
12. Produzierendes Gewerbe, Handwer
- Seite 226 und 227:
12. Produzierendes Gewerbe, Handwer
- Seite 228 und 229:
12. Produzierendes Gewerbe, Handwer
- Seite 230 und 231:
12. Produzierendes Gewerbe, Handwer
- Seite 232 und 233:
12. Produzierendes Gewerbe, Handwer
- Seite 234 und 235:
12. Produzierendes Gewerbe, Handwer
- Seite 236 und 237:
12. Produzierendes Gewerbe, Handwer
- Seite 238 und 239:
12. Produzierendes Gewerbe, Handwer
- Seite 240 und 241:
12. Produzierendes Gewerbe, Handwer
- Seite 242 und 243:
12. Produzierendes Gewerbe, Handwer
- Seite 244 und 245:
12. Produzierendes Gewerbe, Handwer
- Seite 246 und 247:
12. Produzierendes Gewerbe, Handwer
- Seite 248 und 249:
13. Bautätigkeit und Wohnungswesen
- Seite 250 und 251:
13. Bautätigkeit und Wohnungswesen
- Seite 252 und 253:
13. Bautätigkeit und Wohnungswesen
- Seite 254 und 255:
13. Bautätigkeit und Wohnungswesen
- Seite 256 und 257:
13. Bautätigkeit und Wohnungswesen
- Seite 258 und 259:
13. Bautätigkeit und Wohnungswesen
- Seite 260 und 261:
14. Handel, Gastgewerbe und Tourism
- Seite 262 und 263:
14. Handel, Gastgewerbe und Tourism
- Seite 264 und 265:
14. Handel, Gastgewerbe und Tourism
- Seite 266 und 267:
14. Handel, Gastgewerbe und Tourism
- Seite 268 und 269:
14. Handel, Gastgewerbe und Tourism
- Seite 270 und 271:
14. Handel, Gastgewerbe und Tourism
- Seite 272 und 273:
14. Handel, Gastgewerbe und Tourism
- Seite 274 und 275:
14. Handel, Gastgewerbe und Tourism
- Seite 276 und 277:
14. Handel, Gastgewerbe und Tourism
- Seite 278 und 279:
14. Handel, Gastgewerbe und Tourism
- Seite 280 und 281:
14. Handel, Gastgewerbe und Tourism
- Seite 282 und 283:
15. Verkehr 15.1 Binnenschifffahrt,
- Seite 284 und 285: 15. Verkehr 15.1 Binnenschifffahrt,
- Seite 286 und 287: 15. Verkehr 15.1 Binnenschifffahrt,
- Seite 288 und 289: 15. Verkehr 15.1 Binnenschifffahrt,
- Seite 290 und 291: 15. Verkehr 15.2 Straßen- und Pers
- Seite 292 und 293: 15. Verkehr 15.2 Straßen- und Pers
- Seite 294 und 295: 15. Verkehr 15.2 Straßen- und Pers
- Seite 296 und 297: 15. Verkehr 15.2 Straßen- und Pers
- Seite 298 und 299: 15. Verkehr 15.2 Straßen- und Pers
- Seite 300 und 301: 15. Verkehr 15.2 Straßen- und Pers
- Seite 302 und 303: 15. Verkehr 15.2 Straßen- und Pers
- Seite 304 und 305: 16. Geld und Kredit, Dienstleistung
- Seite 306 und 307: 16. Geld und Kredit, Dienstleistung
- Seite 308 und 309: 16. Geld und Kredit, Dienstleistung
- Seite 310 und 311: 16. Geld und Kredit, Dienstleistung
- Seite 312 und 313: 17. Soziales Übersichten 17 Tabell
- Seite 314 und 315: 17. Soziales Kinder- und Jugendhilf
- Seite 316 und 317: 17. Soziales 1. Grundsicherung für
- Seite 318 und 319: 17. Soziales Erwerbsfähige Hilfeem
- Seite 320 und 321: 17. Soziales 3. Bruttoausgaben der
- Seite 322 und 323: 17. Soziales 5. Sozialhilfe (Hilfea
- Seite 324 und 325: 17. Soziales 7. Bruttoausgaben nach
- Seite 326 und 327: 17. Soziales 10. Jugendhilfe am 31.
- Seite 328 und 329: 17. Soziales Besuchsquote der unter
- Seite 330 und 331: 17. Soziales 13. Schwerbehinderte M
- Seite 332 und 333: 17. Soziales 14. Ausgewählte Daten
- Seite 336 und 337: 17. Soziales 17. Ausgaben der Krieg
- Seite 338 und 339: 18. Öffentliche Finanzen 18.1 Fina
- Seite 340 und 341: 18. Öffentliche Finanzen 18.1 Fina
- Seite 342 und 343: 18. Öffentliche Finanzen 18.1 Fina
- Seite 344 und 345: 18. Öffentliche Finanzen 18.1 Fina
- Seite 346 und 347: 18. Öffentliche Finanzen 18.1 Fina
- Seite 348 und 349: 18. Öffentliche Finanzen 18.1 Fina
- Seite 350 und 351: 18. Öffentliche Finanzen 18.1 Fina
- Seite 352 und 353: 18. Öffentliche Finanzen 18.1 Fina
- Seite 354 und 355: 18. Öffentliche Finanzen 18.1 Fina
- Seite 356 und 357: 18. Öffentliche Finanzen 18.1 Fina
- Seite 358 und 359: 18. Öffentliche Finanzen 18.1 Fina
- Seite 360 und 361: 18. Öffentliche Finanzen 18.1 Fina
- Seite 362 und 363: 18. Öffentliche Finanzen 18.2 Steu
- Seite 364 und 365: 18. Öffentliche Finanzen 18.2 Steu
- Seite 366 und 367: 18. Öffentliche Finanzen 18.2 Steu
- Seite 368 und 369: 18. Öffentliche Finanzen 18.2 Steu
- Seite 370 und 371: 18. Öffentliche Finanzen 18.2 Steu
- Seite 372 und 373: 19. Preise Übersichten Tabelle Tit
- Seite 374 und 375: 19. Preise 1. Verbraucherpreisindiz
- Seite 376 und 377: 19. Preise 2. Ausgewählte Preisind
- Seite 378 und 379: 19. Preise 4. Kaufwerte für landwi
- Seite 380 und 381: 20. Verdienste, Arbeitskosten und -
- Seite 382 und 383: 20. Verdienste, Arbeitskosten und -
- Seite 384 und 385:
20. Verdienste, Arbeitskosten und -
- Seite 386 und 387:
20. Verdienste, Arbeitskosten und -
- Seite 388 und 389:
20. Verdienste, Arbeitskosten und -
- Seite 390 und 391:
20. Verdienste, Arbeitskosten und -
- Seite 392 und 393:
21. Versorgung und Verbrauch privat
- Seite 394 und 395:
21. Versorgung und Verbrauch privat
- Seite 396 und 397:
21. Versorgung und Verbrauch privat
- Seite 398 und 399:
21. Versorgung und Verbrauch privat
- Seite 400 und 401:
22. Volkswirtschaftliche Gesamtrech
- Seite 402 und 403:
22. Volkswirtschaftliche Gesamtrech
- Seite 404 und 405:
22. Volkswirtschaftliche Gesamtrech
- Seite 406 und 407:
22. Volkswirtschaftliche Gesamtrech
- Seite 408 und 409:
22. Volkswirtschaftliche Gesamtrech
- Seite 410 und 411:
22. Volkswirtschaftliche Gesamtrech
- Seite 412 und 413:
22. Volkswirtschaftliche Gesamtrech
- Seite 414 und 415:
22. Volkswirtschaftliche Gesamtrech
- Seite 416 und 417:
23. Umwelt 23.1 Abfallentsorgung Ü
- Seite 418 und 419:
23. Umwelt 23.1 Abfallentsorgung 1.
- Seite 420 und 421:
23. Umwelt 23.1 Abfallentsorgung Au
- Seite 422 und 423:
23. Umwelt 23.1 Abfallentsorgung An
- Seite 424 und 425:
23. Umwelt 23.1 Abfallentsorgung 5.
- Seite 426 und 427:
23. Umwelt 23.2 Wasserversorgung un
- Seite 428 und 429:
23. Umwelt 23.2 Wasserversorgung un
- Seite 430 und 431:
23. Umwelt 23.2 Wasserversorgung un
- Seite 432 und 433:
23. Umwelt 23.2 Wasserversorgung un
- Seite 434 und 435:
23. Umwelt 23.2 Wasserversorgung un
- Seite 436 und 437:
23. Umwelt 23.2 Wasserversorgung un
- Seite 438 und 439:
23. Umwelt 23.3 Umweltschutz Übers
- Seite 440 und 441:
23. Umwelt 23.3 Umweltschutz Klimaw
- Seite 442 und 443:
23. Umwelt 23.3 Umweltschutz 2. Umw
- Seite 444 und 445:
23. Umwelt 23.3 Umweltschutz 3. Bet
- Seite 446 und 447:
23. Umwelt 23.3 Umweltschutz 7. Ver
- Seite 448 und 449:
24. Energie Übersichten Tabelle Ti
- Seite 450 und 451:
24. Energie 6 Bei der Quellenbilanz
- Seite 452 und 453:
24. Energie 1. Energie- und Wasserv
- Seite 454 und 455:
24. Energie 4. Stromeinspeisung in
- Seite 456 und 457:
24. Energie 6. Energieverbrauch im
- Seite 458 und 459:
24. Energie 8. Energiebilanz 2010 G
- Seite 460 und 461:
24. Energie 9. Primärenergieverbra
- Seite 462 und 463:
24. Energie 13. CO 2 -Emissionen au
- Seite 464 und 465:
24. Energie 15. CO 2 -Emissionen au
- Seite 466 und 467:
Stichwortverzeichnis 466 © Statist
- Seite 468 und 469:
Stichwortverzeichnis 468 © Statist
- Seite 470 und 471:
Stichwortverzeichnis 470 © Statist
- Seite 472 und 473:
Stichwortverzeichnis 472 © Statist
- Seite 474 und 475:
Stichwortverzeichnis 474 © Statist
- Seite 476 und 477:
Stichwortverzeichnis 476 © Statist
- Seite 478 und 479:
Stichwortverzeichnis 478 © Statist
- Seite 480 und 481:
Stichwortverzeichnis 480 © Statist
- Seite 482 und 483:
Adressverzeichnis 1. Allgemeine Ang
- Seite 484 und 485:
Fotonachweis Seite 21 Allgemeine An