Thesis - Tumb1.biblio.tu-muenchen.de
Thesis - Tumb1.biblio.tu-muenchen.de
Thesis - Tumb1.biblio.tu-muenchen.de

Erfolgreiche ePaper selbst erstellen
Machen Sie aus Ihren PDF Publikationen ein blätterbares Flipbook mit unserer einzigartigen Google optimierten e-Paper Software.
32<br />
3. Ergebnisse<br />
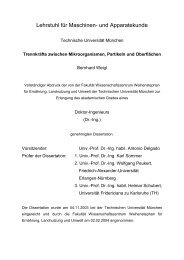
Graphik 3-3: Scatterplot mit linearer Regressionsgera<strong>de</strong> für S. aureus<br />
12<br />
10<br />
y = 0,0022x + 0,648<br />
8<br />
B<br />
6<br />
4<br />
2<br />
0<br />
0 500 1000 1500 2000 2500<br />
C<br />
Graphik 3-4: Scatterplot mit linearer Regressionsgera<strong>de</strong> für E. coli (1)<br />
80<br />
y = 0,0178x - 4,7053<br />
70<br />
60<br />
50<br />
B<br />
40<br />
30<br />
20<br />
10<br />
0<br />
0 200 400 600 800 1000 1200 1400 1600 1800<br />
C<br />
Graphik 3-5: Scatterplot mit linearer Regressionsgera<strong>de</strong> für A. baumannii<br />
14<br />
12<br />
y = 0,003x + 2,3451<br />
10<br />
B<br />
8<br />
6<br />
4<br />
2<br />
0<br />
0 500 1000 1500 2000 2500<br />
C