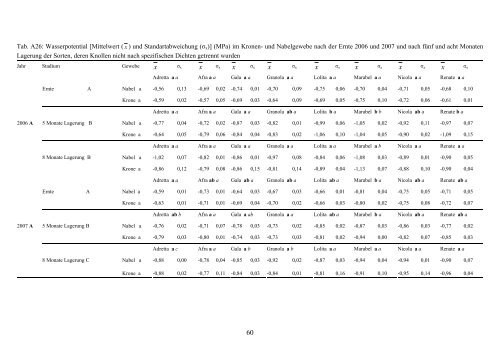
Tab. A26: Wasserpotential [Mittelwert ( x ) und Standartabweichung (σ x )] (MPa) im Kronen- und Nabelgewebe nach <strong>der</strong> Ernte 2006 und 2007 und nach fünf und acht Monaten Lagerung <strong>der</strong> Sorten, <strong>der</strong>en Knollen nicht nach spezifischen Dichten getrennt wurden Jahr Stadium Gewebe x σ x x σ x x σ x x σ x x σ x x σ x x σ x x σ x Adretta a a Afra a a Gala a a Granola a a Lolita a a Marabel a a Nicola a a Renate a a Ernte A Nabel a -0,56 0,13 -0,69 0,02 -0,74 0,01 -0,70 0,09 -0,75 0,06 -0,70 0,04 -0,71 0,05 -0,68 0,10 2006 A 2007 A 5 Monate Lagerung B 8 Monate Lagerung B Ernte A 5 Monate Lagerung B 8 Monate Lagerung C Krone a -0,59 0,02 -0,57 0,05 -0,69 0,03 -0,64 0,09 -0,69 0,05 -0,75 0,10 -0,72 0,06 -0,61 0,01 Adretta a a Afra a a Gala a a Granola ab a Lolita b a Marabel b b Nicola ab a Renate b a Nabel a -0,77 0,04 -0,72 0,02 -0,87 0,03 -0,82 0,01 -0,99 0,06 -1,05 0,02 -0,92 0,11 -0,97 0,07 Krone a -0,64 0,05 -0,79 0,06 -0,84 0,04 -0,83 0,02 -1,06 0,10 -1,04 0,05 -0,90 0,02 -1,09 0,15 Adretta a a Afra a a Gala a a Granola a a Lolita a a Marabel a b Nicola a a Renate a a Nabel a -1,02 0,07 -0,82 0,01 -0,86 0,01 -0,97 0,08 -0,84 0,06 -1,08 0,03 -0,89 0,01 -0,90 0,05 Krone a -0,86 0,12 -0,79 0,08 -0,86 0,15 -0,81 0,14 -0,89 0,04 -1,13 0,07 -0,88 0,10 -0,90 0,04 Adretta a a Afra ab a Gala ab a Granola ab a Lolita ab a Marabel b a Nicola ab a Renate ab a Nabel a -0,59 0,01 -0,73 0,01 -0,64 0,03 -0,67 0,03 -0,66 0,01 -0,81 0,04 -0,75 0,05 -0,71 0,05 Krone a -0,63 0,01 -0,71 0,01 -0,69 0,04 -0,70 0,02 -0,66 0,03 -0,80 0,02 -0,75 0,08 -0,72 0,07 Adretta ab b Afra a a Gala a ab Granola a a Lolita ab a Marabel b a Nicola ab a Renate ab a Nabel a -0,76 0,02 -0,71 0,07 -0,78 0,03 -0,73 0,02 -0,85 0,02 -0,87 0,03 -0,86 0,03 -0,77 0,02 Krone a -0,79 0,03 -0,80 0,01 -0,74 0,03 -0,73 0,03 -0,81 0,02 -0,94 0,00 -0,82 0,07 -0,85 0,03 Adretta a c Afra a a Gala a b Granola a b Lolita a a Marabel a a Nicola a a Renate a a Nabel a -0,88 0,00 -0,78 0,04 -0,85 0,03 -0,92 0,02 -0,87 0,03 -0,94 0,04 -0,94 0,01 -0,90 0,07 Krone a -0,88 0,02 -0,77 0,11 -0,84 0,03 -0,84 0,01 -0,81 0,16 -0,91 0,10 -0,95 0,14 -0,96 0,04 60
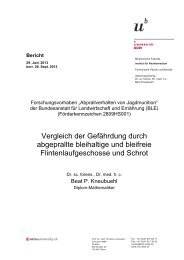
Tab. A27: Zellgröße [Mittelwert ( x ) und Standartabweichung (σ x )] (µm) bei Sorten und Knollen verschiedner spezifischer Dichten (kg L -1 ) nach <strong>der</strong> Ernte 2006 und nach fünf und acht Monaten Lagerung Jahr Stadium spezifische Dichte x σ x x σ x x σ x x σ x x σ x x σ x x σ x x σ x 2006 Ernte A 5 Monate Lagerung B 8 Monate Lagerung A Adretta a a Afra a a Gala a ab Granola a a Lolita a a Marabel a a Nicola a a Renate a a < 1,055 1,056-1,065 a 116,00 15,36 144,00 10,27 133,33 9,92 137,33 4,22 133,67 2,28 115,33 12,63 1,066-1,075 a 148,00 5,86 126,67 5,55 129,00 23,79 139,00 10,74 136,00 18,28 130,00 14,17 107,33 13,66 1,076-1,085 a 136,67 9,58 131,50 6,43 143,33 13,88 123,33 15,94 1,086-1,095 a 135,00 14,25 121,00 6,66 > 1,095 a Adretta b b Afra c b Gala a b Granola b b Lolita a a Marabel ab a Nicola ab b Renate b b < 1,055 a 113,75 8,86 1,056-1,065 a 92,50 6,91 93,13 8,12 103,13 11,95 100,83 9,15 91,88 6,14 123,54 17,70 92,98 6,53 1,066-1,075 a 96,67 12,58 94,38 5,58 112,08 6,96 103,13 20,75 129,58 16,98 140,63 13,44 119,17 10,30 100,21 8,12 1,076-1,085 a 106,46 17,02 94,17 5,14 112,08 14,28 90,00 10,69 139,38 5,75 125,00 10,69 110,42 10,51 97,92 11,07 1,086-1,095 a 101,88 13,09 95,83 9,15 127,29 13,15 102,92 17,34 102,92 7,02 > 1,095 a 119,79 17,70 91,04 8,43 Adretta a a Afra c b Gala a a Granola bc ab Lolita a a Marabel ab a Nicola c b Renate c a < 1,055 a 146,88 5,06 107,50 4,46 110,63 5,20 1,056-1,065 a 115,83 19,80 138,96 9,89 115,83 7,76 132,50 7,23 136,88 9,46 109,58 2,76 113,33 4,56 1,066-1,075 a 133,54 15,79 100,63 5,20 138,13 3,43 110,21 7,50 136,04 9,09 131,25 8,46 113,33 5,57 124,17 7,30 1,076-1,085 a 128,54 11,63 107,08 19,39 114,79 10,10 135,00 12,04 128,96 5,99 115,42 8,73 1,086-1,095 a 120,63 9,21 118,54 15,73 123,96 3,43 131,04 5,99 106,04 8,20 > 1,095 a 100,83 9,60 61
- Seite 1 und 2:
Department für Nutzpflanzenwissens
- Seite 3 und 4:
Inhaltsverzeichnis Inhaltsverzeichn
- Seite 5 und 6:
Abbildungsverzeichnis Abb. 1 Knolle
- Seite 7:
Mg magnesium Magnesium Mn manganese
- Seite 10 und 11:
1.2 Wissenschaftlicher Stand, an de
- Seite 12 und 13:
für fünf und acht Monate gelagert
- Seite 14 und 15:
Tab. 2 Standorteigenschaften und In
- Seite 16 und 17:
2.3 Ermittlung des Wasserzustandes
- Seite 18 und 19: 2.8 Ermittlung der Zellgröße Die
- Seite 20 und 21: µkat kg −1 FM ⎛⎛ * / min ⎞
- Seite 22 und 23: 2003, Turakainen et al. 2004, 2006,
- Seite 24 und 25: et al. 1986, Terry et al. 2000, sie
- Seite 26 und 27: Wechselwirkungen zwischen den Aktiv
- Seite 28 und 29: 4 Zusammenfassung Melanin ist ein P
- Seite 30 und 31: peratur und zu einer geringeren Sch
- Seite 32 und 33: Tab. 4 Gegenüberstellung geplanter
- Seite 34 und 35: Tab. 6 Gegenüberstellung geplanter
- Seite 36 und 37: disorders of potato. American Journ
- Seite 38 und 39: McNeal J.M. and Balistrieri L.S. 19
- Seite 40 und 41: wall and their extracts on the acti
- Seite 42 und 43: 7 Anhang Nachfolgend sind Einzel- o
- Seite 44 und 45: Tab. A2: Schwarzfleckigkeit [Mittel
- Seite 46 und 47: Tab. A4: Schwarzfleckigkeit [Mittel
- Seite 48 und 49: Tab. A6: Oxidatives Potential [Mitt
- Seite 50 und 51: Tab. A8: Oxidatives Potential [Mitt
- Seite 52 und 53: Tab. A10: Volumetrischer Modulus de
- Seite 54 und 55: Tab. A12: Osmolalität [Mittelwert
- Seite 56 und 57: Tab. A14: Osmolalität [Mittelwert
- Seite 58 und 59: Tab. A16: Osmotisches Potential [Mi
- Seite 60 und 61: Tab. A18: Binnendruck (Turgor) [Mit
- Seite 62 und 63: Tab. A20: Binnendruck (Turgor) [Mit
- Seite 64 und 65: Tab. A22: Wasserkonzentration [Mitt
- Seite 66 und 67: Tab. A24: Wasserpotential [Mittelwe
- Seite 70 und 71: Tab. A28: Zellgröße [Mittelwert (
- Seite 72 und 73: Tab. A30: Stärkekonzentration [Mit
- Seite 74 und 75: Tab. A32: Stärkekonzentration [Mit
- Seite 76 und 77: Tab. A34: Trockenmassekonzentration
- Seite 78 und 79: Tab. A36: Trockenmassekonzentration
- Seite 80 und 81: Tab. A38: Konzentration des trocken
- Seite 82 und 83: Tab. A40: Konzentration des trocken
- Seite 84 und 85: Tab. A42: Konzentration des trocken
- Seite 86 und 87: Tab. A44: Pektinkonzentration [Einz
- Seite 88 und 89: Tab. A46: Pektinkonzentration [Einz
- Seite 90 und 91: Tab. A48: Grad der Pektinveresterun
- Seite 92 und 93: Tab. A50: Grad der Pektinveresterun
- Seite 94 und 95: Tab. A52: Grad der Pektinveresterun
- Seite 96 und 97: Tab. A54: Die antioxidative Kapazit
- Seite 98 und 99: Tab. A56: Die antioxidative Kapazit
- Seite 100 und 101: Tab. A58: Die Aktivität der Ascorb
- Seite 102 und 103: Tab. A60: Die Aktivität der Supero
- Seite 104 und 105: Tab. A62: Die Aktivität der Supero
- Seite 106 und 107: Tab. A64: Die Aktivität der Polyph
- Seite 108 und 109: Tab. A67: Die Aktivität der Polyph
- Seite 110 und 111: Tab. A70: Proteinkonzentration [Mit
- Seite 112 und 113: Tab. A72: Polyphenolkonzentration [
- Seite 114 und 115: Tab. A74: Konzentration an L-Ascorb
- Seite 116 und 117: Tab. A76: Konzentration an L-Ascorb
- Seite 118 und 119:
Tab. A78: Chlorogensäurekonzentrat
- Seite 120 und 121:
Tab. A80: Chlorogensäurekonzentrat
- Seite 122 und 123:
Tab. A82: Chlorogensäurekonzentrat
- Seite 124 und 125:
Tab. A84: Der Einfluss der Konzentr
- Seite 126 und 127:
Tab. A86: Der Einfluss der Konzentr
- Seite 128 und 129:
Tab. A88: Der Einfluss der Konzentr
- Seite 130 und 131:
Tab. A90: Borkonzentration [Einzelw
- Seite 132 und 133:
Tab. A92: Borkonzentration [Einzelw
- Seite 134 und 135:
Tab. A94: Eisenkonzentration [Einze
- Seite 136 und 137:
Tab. A96: Eisenkonzentration [Einze
- Seite 138 und 139:
Tab. A98: Selenkonzentration [Einze
- Seite 140 und 141:
Tab. A100: Selenkonzentration [Einz
- Seite 142 und 143:
Tab. A102: Kalziumkonzentration [Mi
- Seite 144 und 145:
Tab. A104: Kalziumkonzentration [Ei
- Seite 146 und 147:
Tab. A106: Kalziumkonzentration [Ei
- Seite 148 und 149:
Tab. A108: Magnesiumkonzentration [
- Seite 150 und 151:
Tab. A110: Magnesiumkonzentration [
- Seite 152 und 153:
Tab. A112: Kaliumkonzentration [Mit
- Seite 154 und 155:
Tab. A114: Kaliumkonzentration [Mit
- Seite 156 und 157:
Tab. A116: Kaliumkonzentration [Mit
- Seite 158 und 159:
Tab. A118: Phosphorkonzentration [M
- Seite 160 und 161:
Tab. A120: Phosphorkonzentration [M
- Seite 162 und 163:
Tab. A122: Wetterdaten während der
- Seite 164 und 165:
Tab. A124: Anteil Knollen (g kg -1
- Seite 166 und 167:
Nachfolgend sind dargestellt: • E
- Seite 168 und 169:
Antioxidative Kapazität in Kartoff
- Seite 170 und 171:
Die Konzentration ausgewählter Nä
- Seite 172 und 173:
Nutrient concentrations in potato (
- Seite 174 und 175:
tubers to some extent (Heinecke 200
- Seite 176 und 177:
of potato tubers (Wulkow et al. in
- Seite 178 und 179:
Table 1 The ratio of macro:micro nu
- Seite 180 und 181:
Table 2 Concentration of selected n
- Seite 182 und 183:
uptake directly through tuber perid
- Seite 184 und 185:
Griffiths D W, Bain H (1997) Photo-
- Seite 186 und 187:
Peterson R L, Barker W G, Howarth M
- Seite 188 und 189:
Water relations in potato (Solanum
- Seite 190 und 191:
of any blackspot development and th
- Seite 192 und 193:
ferent in tubers differing in their
- Seite 194 und 195:
Table 1 Water concentration (g kg -
- Seite 196 und 197:
Discussion No significant tuber pos
- Seite 198 und 199:
Kelling, 2007; Neumann, 1995) and r
- Seite 200 und 201:
Kolbe, H., Stephan-Beckmann, S., 19
- Seite 202 und 203:
Blackspot bruise formation in potat
- Seite 204 und 205:
were performed in tubers after harv
- Seite 206 und 207:
Results Distribution of tubers with
- Seite 208 und 209:
measurable (P>0.05). Pectin is one
- Seite 210 und 211:
Distribution of tubers (%) 100 90 8
- Seite 212 und 213:
Discussion Distribution of tubers w
- Seite 214 und 215:
Barkhausen, R. 1978. Ultrastructura
- Seite 216 und 217:
is independent of that in gravitrop
- Seite 218 und 219:
Abb. 1 Erscheinungsbild der Schwarz
- Seite 220 und 221:
Zelle. Sie ist auf Ascorbat als spe
- Seite 222 und 223:
Einfluss der Sorte und Lagerungszei
- Seite 224 und 225:
Abb. 8 Polyphenoloxidase (PPO)- Akt
- Seite 226 und 227:
Danksagung Die Untersuchungen wurde
- Seite 228 und 229:
Blackspot susceptibility in compari
- Seite 230 und 231:
gravity from 1.095 kg L -1 , with 0
- Seite 232 und 233:
DP (AU 475nm ), FRAP (mmol kg -1 )
- Seite 234 und 235:
after harvest. The DP increased sig
- Seite 236 und 237:
Compared to whole tubers several re
- Seite 238 und 239:
centrations may be a result of high
- Seite 240 und 241:
sequence of impact physical and che
- Seite 242 und 243:
(24) Boxin, O.; Hampsch-Woodill, M.