Statistikplan V2.6_d - Statistik der Unfallversicherung UVG
Statistikplan V2.6_d - Statistik der Unfallversicherung UVG
Statistikplan V2.6_d - Statistik der Unfallversicherung UVG

Erfolgreiche ePaper selbst erstellen
Machen Sie aus Ihren PDF Publikationen ein blätterbares Flipbook mit unserer einzigartigen Google optimierten e-Paper Software.
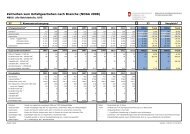
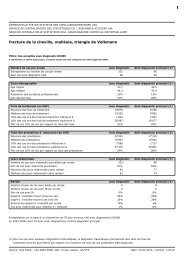
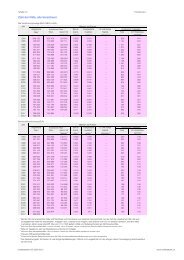
9.6 Risikotafeln<br />
<strong><strong>Statistik</strong>plan</strong> 2009<br />
für die einheitlichen <strong>Statistik</strong>en <strong>der</strong> <strong>UVG</strong>-Versicherer<br />
Risikotafeln zeigen die Verteilung <strong>der</strong> Lohnsummen (auf Lohnsummenlayer).<br />
Tabelle R01: obligatorische Versicherung BU,<br />
Tabelle R02 obligatorische Versicherung NBU,<br />
Tabelle R03: freiwillige Versicherung FV<br />
Variablen: Anzahl Policen, Verteilung in ‰<br />
Unterteilung: <strong>Statistik</strong>jahr, Lohnsummenlayer<br />
Es werden jeweils 10 <strong>Statistik</strong>jahre gezeigt.<br />
Risikostatistik <strong>UVG</strong> Gemeinschaftsstatistik Gemeinschaft<br />
Risikotafel R - 01.00<br />
Obligatorische Versicherung BU Stand Ende 2008<br />
01.11.2009<br />
Gesamtgeschäft Seite 1<br />
<strong>Statistik</strong>jahr<br />
Lohnsummenlayer<br />
Anzahl Policen Verteilung Anzahl Policen Verteilung Mittlere<br />
in Promillen kumuliert in Promillen Lohnsumme<br />
1999 Minimalprämie 18,443 70 18,443 70<br />
0 - 4,000 43,032 164 61,475 234 3,827<br />
4,001 - 6,000 42,381 161 103,856 395 5,238<br />
6,001 - 8,000 31,981 122 135,837 517 7,203<br />
8,001 - 15,000 32,919 125 168,756 642 11,200<br />
15,001 - 25,000 27,546 105 196,302 747 22,945<br />
25,001 - 50,000 29,544 112 225,846 859 39,422<br />
50,001 - 100,000 22,456 85 248,302 944 76,212<br />
100,001 - 250,000 7,845 30 256,147 974 185,342<br />
250,001 - 1,000,000 4,512 17 260,659 991 789,955<br />
1,000,001 - 4,000,000 1,364 5 262,023 997 2,056,789<br />
4,000,001 - 10,000,000 820 3 262 843 1,000 6,459,834<br />
10,000,001 - 94 0 262 937 1,000 12,045,788<br />
1999 Total 262,937 1,000 262,937 1,000 71,298<br />
2000 Minimalprämie 12,049 49 12,049 49<br />
0 - 4,000 30,983 127 43,032 177 3,956<br />
4,001 - 6,000 43,032 177 86,064 353 5,524<br />
6,001 - 8,000 31,999 131 118,063 485 7,106<br />
8,001 - 15,000 33,636 138 151,699 623 10,945<br />
15,001 - 25,000 27,412 113 179,111 736 23,459<br />
25,001 - 50,000 28,534 117 207,645 853 40,020<br />
50,001 - 100,000 20,546 84 228,191 937 77,111<br />
100,001 - 250,000 8,034 33 236,225 970 184,356<br />
250,001 - 1,000,000 5,001 21 241,226 991 793,055<br />
1,000,001 - 4,000,000 1,366 6 242,592 996 1,999,848<br />
4,000,001 - 10,000,000 813 3 243 405 1,000 6,265,674<br />
10,000,001 - 94 0 243 499 1,000 12,257,788<br />
2000 Total 243,499 1,000 243,499 1,000 77,004<br />
2001 Minimalprämie 17 619 67 17 619 67<br />
0 - 4,000 45,305 172 62,924 239 3,962<br />
4,001 - 6,000 43,032 163 105,956 402 5,552<br />
6,001 - 8,000 32,075 122 138,031 523 7,145<br />
8,001 - 15,000 33,636 128 171,667 651 10,950<br />
15,001 - 25,000 27,411 104 199,078 755 23,617<br />
25,001 - 50,000 28,645 109 227,723 863 40,338<br />
50,001 - 100,000 20,517 78 248,240 941 77,110<br />
100,001 - 250,000 8,110 31 256,350 972 185,742<br />
250,001 - 1,000,000 5,116 19 261,466 991 794,560<br />
1,000,001 - 4,000,000 1,380 5 262,846 996 2,011,173<br />
4,000,001 - 10,000,000 828 3 263 674 1,000 6,305,773<br />
10,000,001 - 97 0 263 771 1,000 12,312,033<br />
2001 Total 263,771 1,000 263,771 1,000 72,650<br />
<strong><strong>Statistik</strong>plan</strong> <strong>V2.6</strong>_d 22.11.2012/16:22:02 Seite 34 - 120<br />
Risiko