Hannover · Braunschweig · Wolfsburg - Engel & Voelkers
Hannover · Braunschweig · Wolfsburg - Engel & Voelkers
Hannover · Braunschweig · Wolfsburg - Engel & Voelkers

Erfolgreiche ePaper selbst erstellen
Machen Sie aus Ihren PDF Publikationen ein blätterbares Flipbook mit unserer einzigartigen Google optimierten e-Paper Software.
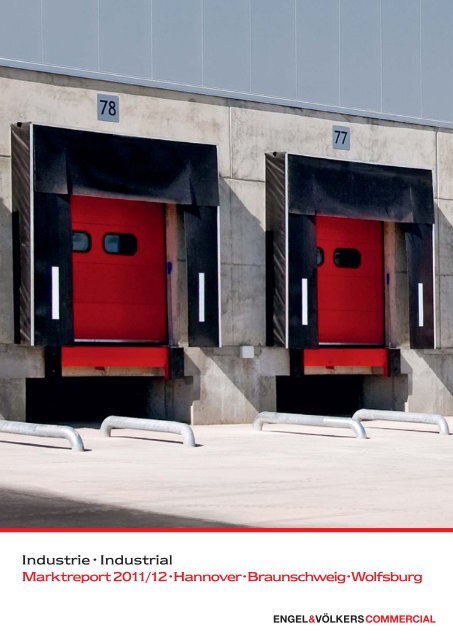
Industrie <strong>·</strong> Industrial<br />
Marktreport 2011/12 <strong>·</strong> <strong>Hannover</strong> <strong>·</strong> <strong>Braunschweig</strong> <strong>·</strong> <strong>Wolfsburg</strong>
Industrie- & Logistikfl ächen<br />
Industrial- & Warehouse space<br />
Der Markt für Gewerbe- und Industriefl ächen in den<br />
Regionen <strong>Hannover</strong>/<strong>Braunschweig</strong> und <strong>Wolfsburg</strong> hat<br />
sich 2011 dynamisch entwickelt. Im Vergleich zum Vorjahr<br />
wurde dort ein um 39 % höherer Flächenumsatz von insgesamt<br />
rd. 490.000 m² registriert (2010: ca. 353.000 m²).<br />
Im näheren Umland der beiden Regionen wurden<br />
zusätzlich noch ca. 64.000 m² vermittelt, sodass der<br />
Flächenumsatz von rd. 554.000 m² mit anderen großen<br />
A-Standorten vergleichbar ist.<br />
Große Flächenumsätze dominieren<br />
Dazu beigetragen haben mehrere außergewöhnlich<br />
große Flächenumsätze. In Barsinghausen erfolgte der<br />
Baubeginn für den ersten Bauabschnitt von Kaufl and<br />
(74.000 m²). Dieser Flächenumsatz ist zwar bereits seit<br />
2009 bekannt, statistikwirksam wurde er tatsächlich<br />
aber erst 2011 mit dem ersten Spatenstich. In Lauenau,<br />
wenige Kilometer östlich von der kommunalen Grenze<br />
der Region <strong>Hannover</strong>, baut Edeka ebenfalls ein großes<br />
Güterzentrum (70.000 m²). In der Landeshauptstadt im<br />
Gewerbegebiet Schwarze Heide/Stöcken entwickelt<br />
Goodman für VW-Nutzfahrzeuge eine 45.000 m² große<br />
Halle für die Lagerung und Versorgung von Amarok-<br />
Autoteilen. Insgesamt wurden in der Größenklasse über<br />
10.000 m² 53 % des gesamten Flächenumsatzes abgeschlossen.<br />
20 % fanden im Segment zwischen 5.000 m²<br />
und 10.000 m² statt. Die Nachfrage wird durch die<br />
Logistiksparte großer Handelsunternehmen (44 %) sowie<br />
von automobilnahen Produktionsbetrieben dominiert<br />
(31%), die insbesondere in <strong>Braunschweig</strong> und <strong>Wolfsburg</strong><br />
den maßgeblichen Anteil an der Flächennachfrage stellen.<br />
Die klassischen Lager- und Speditionsunternehmen<br />
kommen auf einen Anteil von 17 %.<br />
Knappes Angebot an Flächen<br />
Regional liegt der Schwerpunkt des Flächenumsatzes<br />
mit 74 % in der eigentlichen Region <strong>Hannover</strong>. Die Stadt<br />
<strong>Hannover</strong> kommt auf einen Anteil von 34 %. Auch wenn<br />
einige Großabschlüsse darunter waren, sind es doch eher<br />
die kleinteiligen Flächen, die hier neue Nutzer fi nden.<br />
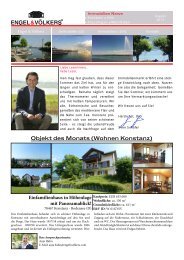
Im Blickpunkt steht nach wie vor auch der Bereich um<br />
Bedeutende Flächenumsätze – <strong>Hannover</strong> • <strong>Braunschweig</strong> • <strong>Wolfsburg</strong><br />
Signifi cant take ups – Hanover • Brunswick • <strong>Wolfsburg</strong><br />
Nutzer User Fläche Space Lage Area<br />
Kaufl and 74.000 m² <strong>Hannover</strong> Region West<br />
Edeka 70.000 m² Verfl echtungsraum<br />
Volkswagen 45.000 m² <strong>Hannover</strong> Stadt<br />
Volkswagen 25.000 m² <strong>Wolfsburg</strong><br />
Syncreon Deutschland GmbH 19.000 m² <strong>Hannover</strong> Region West<br />
Quelle:/Source: <strong>Engel</strong> & Völkers Commercial, Jahr 2011/year 2011<br />
Industrie- & Logistikfl ächen Marktreport 2011/2012 • <strong>Hannover</strong> • <strong>Braunschweig</strong> • <strong>Wolfsburg</strong><br />
The market for commercial and industrial space in the<br />
regions Hanover/Brunswick and <strong>Wolfsburg</strong> developed<br />
dynamically in 2011. Take-up there was 39 %<br />
higher in comparison to the previous year, amounting<br />
to around 490,000 m² (2010: approx. 353,000 m²).<br />
In addition, 64,000 m² was handled in the nearby<br />
surrounding area of the two regions, causing the<br />
554,000 m² of take-up to be comparable with other large<br />
A locations.<br />
Large take-ups dominating<br />
Several exceptionally large take-ups have contributed to<br />
this. In Barsinghausen, construction began on the fi rst<br />
section of Kaufl and (74,000 m²). Although this take-up<br />
has been known about since 2009, it only actually<br />
became eff ective in terms of statistics in 2011 when the<br />
ground-breaking ceremony took place. In Lauenau, just<br />
a few kilometres to the east of the communal border<br />
with the Hanover region, Edeka is also building a large<br />
goods centre (70,000 m²). On the Schwarze Heide/<br />
Stöcken business park in the state capital, Goodman<br />
is developing a 45,000 m²-large hall for the storage<br />
and supply of Amarok automobile parts for VW<br />
commercial vehicles. Overall, 53 % of the total take-up<br />
was achieved in the size category above 10,000 m².<br />
20 % occurred in the segment between 5,000 m² and<br />
10,000 m². Demand is being dominated by the logistics<br />
segment of large distribution businesses (44 %) as well as<br />
by manufacturers relating to the automobile industry<br />
(31 %), which represent the leading proportion of demand<br />
for space, particularly in Brunswick and <strong>Wolfsburg</strong>.<br />
Classic warehouse and forwarding companies account<br />
for 17 %.<br />
Limited supply of spaces<br />
In terms of regions, 74 % of take-up is focussed on the<br />
actual Hanover region. The city of Hanover accounts for<br />
34 %. Even though certain large deals were included, it<br />
tends to be the smaller spaces that fi nd new users. The<br />
focus continues to lie on the area around the airport<br />
in Hanover north. However, the high demand occurs
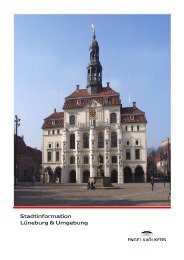
Flächenumsatz*<br />
Take-up*<br />
Volumen in Tsd. m²/Volume in '000s m²<br />
600<br />
500<br />
400<br />
300<br />
200<br />
100<br />
0<br />
333<br />
2007<br />
217<br />
2008<br />
272<br />
2009<br />
* Ganzjahresprognose/Full-year forecast<br />
Quelle:/Source: <strong>Engel</strong> & Völkers Commercial<br />
40<br />
313<br />
2010<br />
410<br />
2011<br />
340<br />
2012*<br />
<strong>Hannover</strong> <strong>Braunschweig</strong>, <strong>Wolfsburg</strong> Verflechtungsraum<br />
Flächenumsatz – Branche<br />
Take-up – segment<br />
Sonstiges 8 %<br />
Transport, Logistik 17 %<br />
Jahr 2011/year 2011<br />
Quelle:/Source: <strong>Engel</strong> & Völkers Commercial<br />
Flächenumsatz – Größenklassen<br />
Take-up m² – size categories<br />
< 500 m²<br />
501–1.000 m²<br />
1.001–2.500 m²<br />
2.501–5.000 m²<br />
5.001–10.000 m²<br />
> 10.000 m²<br />
Jahr 2011/year 2011<br />
3 %<br />
5 %<br />
7 %<br />
11 %<br />
19 %<br />
0 % 10 % 20 % 30 %<br />
Quelle:/Source: <strong>Engel</strong> & Völkers Commercial<br />
82<br />
64<br />
40 %<br />
Handel 44 %<br />
Industrie, Gewerbe 31 %<br />
50 %<br />
54 %<br />
60 %<br />
Flächenumsatz – Lage<br />
Take-up – location<br />
<strong>Hannover</strong> Region<br />
davon<br />
<strong>Hannover</strong> West<br />
<strong>Hannover</strong> Nord<br />
<strong>Hannover</strong> Süd<br />
<strong>Hannover</strong> Ost<br />
<strong>Hannover</strong> Stadt<br />
Verflechtungsraum<br />
<strong>Braunschweig</strong>,<br />
<strong>Wolfsburg</strong><br />
Jahr 2011/year 2011<br />
2 %<br />
2 %<br />
13 %<br />
15 %<br />
11 %<br />
0 % 10 % 20 % 30 % 40 % 50 %<br />
Quelle:/Source: <strong>Engel</strong> & Völkers Commercial<br />
Eigennutzer - Kauf 13 %<br />
Jahr 2011/year 2011<br />
Quelle:/Source: <strong>Engel</strong> & Völkers Commercial<br />
23 %<br />
34 %<br />
40 %<br />
Flächenumsatzanteile – Miete/Eigennutzer<br />
Take-up – segment<br />
Anzahl Umsätze – Größenklassen<br />
Number of take-ups – size categories<br />
< 500 m²<br />
501–1.000 m²<br />
1.001–2.500 m²<br />
2.501–5.000 m²<br />
5.001–10.000 m²<br />
> 10.000 m²<br />
Jahr 2011/year 2011<br />
6 %<br />
11 %<br />
10 %<br />
13 %<br />
Eigennutzer - Neubau 48 %<br />
25 %<br />
0 % 10 % 20 % 30 %<br />
Quelle:/Source: <strong>Engel</strong> & Völkers Commercial<br />
Miete 39 %<br />
35 %<br />
40 %
den Flughafen in <strong>Hannover</strong> Nord. Der starken Nachfrage<br />
stehen allerdings begrenzte Flächenreserven gegenüber.<br />
Da im Stadtgebiet Grundstücke für eigengenutzte<br />
Neubauentwicklungen fehlen, weichen Unternehmen in<br />
verkehrsgünstige, autobahnnahe Lagen in der Region<br />
aus. Die große Nachfrage stößt zunehmend an Grenzen.<br />
Insbesondere zeitgemäße Flächen ab 2.500 m², aber<br />
auch große Flächen über 5.000 m² sind äußerst knapp.<br />
Da kaum spekulativ neue Flächen auf den Markt kommen<br />
und für diese dann ohnehin Mietvertragslaufzeiten<br />
von zumeist zehn Jahren gefordert werden, versuchen<br />
langfristig planende Unternehmen der Situation auszuweichen<br />
und Bestandsobjekte günstig zu kaufen. 13 % des<br />
Flächenumsatzes resultieren aus eigengenutzten Immobilienkäufen.<br />
Viele ältere Bestandsobjekte sind allerdings<br />
nur mit hohem Sanierungsaufwand anzupassen,<br />
da diese sukzessive immer kleinteilig erweitert wurden,<br />
was zeitgemäßen Anforderungen an Produktions- und<br />
Lagerhaltungsabläufen entgegensteht. Die Diskrepanz<br />
zwischen der Qualität des Angebots und den Ansprüchen<br />
der Nachfrage ist oftmals nicht überbrückbar. Dieses hat<br />
bereits zu einem Preisverfall bei älteren Bestandsgebäuden<br />
geführt.<br />
Mieten zwischen 2,00 und 5,00 EUR/m²<br />
Bislang hat sich der hohe Nachfragedruck nur sehr<br />
leicht spürbar in steigenden Mieten niedergeschlagen.<br />
Die Spitzenmiete liegt aktuell um ca. 5,00 EUR/m²<br />
im Flughafenbereich, in der Regel jedoch bei ca.<br />
4,50 EUR/m² in besten Lagen. Die Durchschnittsmiete<br />
für gute Logistikobjekte ist mit ca. 3,20 EUR/m² stabil.<br />
Gegenwärtig ist allenfalls die Tendenz für weiter steigende<br />
Preise bei hochwertigen Flächen spürbar. Ein genereller<br />
Preisanstieg ist aber nicht zu beobachten, zumal die<br />
Preise für die reichlich angebotenen qualitativ einfachen<br />
Flächen bei Mieten von 2,50 EUR/m² bis 3,00 EUR/m²<br />
eher weiter nachgeben. Da insbesondere Logistiker<br />
manchmal quasi bis zum nächsten Monatsbeginn<br />
betriebsbereit sein müssen wird auch auf Seiten der Vermieter<br />
eine größere Flexibilität immer wichtiger.<br />
Weiter lebhafte Nachfrage<br />
Aufgrund der weiter anhaltenden lebhaften Nachfrage<br />
wird der Markt für Gewerbe- und Logistikfl ächen auch<br />
2012 weiter interessante Perspektiven bieten, aber durch<br />
die sich weiter verstärkende Flächenknappheit begrenzt<br />
werden. Neue Großprojekte wie beispielsweise von Netrada<br />
in <strong>Hannover</strong> oder durch VW in <strong>Wolfsburg</strong> und <strong>Braunschweig</strong><br />
sind in der Diskussion. Diese werden jedoch<br />
teilweise wohl erst 2013 umgesetzt werden. Gegenwärtig<br />
gehen wir von einem Flächenumsatz in Höhe von<br />
alongside a limited reserve of space. As there is a<br />
lack of land for own-use construction projects in<br />
the urban area, companies are turning to locations in<br />
the local region which are close to the autobahn and<br />
off er easy access. The high demand is increasingly<br />
hitting its limits. Modern spaces over 2,500 m² are<br />
in particularly short supply, as are large spaces over<br />
5,000 m². As there are hardly any new spaces coming<br />
onto the market speculatively, and as letting contracts<br />
of ten years are already mostly being requested for those<br />
that do, companies that are planning ahead are trying<br />
to avoid the situation and buy existing properties at low<br />
prices. 13 % of the take-up results from owner-occupied<br />
real estate purchases. However, many older existing<br />
properties can only be adapted with a great deal of<br />
refurbishment work, as these have been successively<br />
expanded on a small scale, confl icting with modern<br />
requirements for production and warehousing processes.<br />
It is often impossible to bridge the gap between<br />
the quality of properties supplied and the demand.<br />
This has already led to a downward price trend for<br />
older existing buildings.<br />
Rents between 2.00 and 5.00 euros/m²<br />
So far, the high demand pressure has only been refl ected<br />
in rising rents in a very slight way. The top rents<br />
are currently around 5.00 euros/m² near the airport,<br />
although generally around 4.50 euros/m² in the<br />
best locations. The average rent for good logistics<br />
properties is stable at approx. 3.20 euros/m². The trend<br />
towards further rising prices can currently be felt at best<br />
for high-quality spaces. However, there is no general<br />
price increase to be seen, especially as the prices for<br />
rich supply of lower quality spaces are tending to ease<br />
off with rents between 2.50 euros/m² to 3.00 euros/m².<br />
As logistics companies in particular sometimes need<br />
to be ready for operation by the start of the next month,<br />
a larger level of fl exibility among landlords is becoming<br />
more and more important.<br />
Strong demand continues<br />
Due to the continuing strong demand, the market<br />
for commercial and industrial space will continue to<br />
off er interesting prospects in 2012, although it will<br />
be limited by the increasing shortage of space. New<br />
large-scale projects, such as the project by Netrada in<br />
Hanover or the one by VW in <strong>Wolfsburg</strong> and Brunswick,<br />
are under discussion. However, in some cases these<br />
will only be implemented in 2013. We currently expect<br />
take-up of 340,000 m², which will be made up of<br />
250,000 m² in the Hanover region, 60,000 m² in<br />
Industrie- & Logistikfl ächen Marktreport 2011/2012 • <strong>Hannover</strong> • <strong>Braunschweig</strong> • <strong>Wolfsburg</strong>
340.000 m² aus, der sich mit 250.000 m² in der Region<br />
<strong>Hannover</strong>, 60.000 m² in <strong>Braunschweig</strong> und <strong>Wolfsburg</strong><br />
sowie 30.000 m² in den Randgebieten wie Gifhorn oder<br />
Salzgitter verteilen wird.<br />
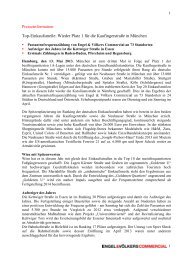
Gewerbegebiete Region <strong>Hannover</strong> • <strong>Braunschweig</strong> • <strong>Wolfsburg</strong><br />
Industrial areas in the region Hanover • Brunswick • <strong>Wolfsburg</strong><br />
Name des Gewerbegebiets<br />
Name of area<br />
1<br />
2<br />
3<br />
4<br />
5<br />
6<br />
7<br />
8<br />
9<br />
10<br />
11<br />
12<br />
13<br />
14<br />
15<br />
16<br />
17<br />
18<br />
19<br />
20<br />
21<br />
22<br />
23<br />
24<br />
25<br />
26<br />
27<br />
28<br />
29<br />
30<br />
31<br />
32<br />
33<br />
34<br />
35<br />
36<br />
37<br />
38<br />
Quelle:/Source: <strong>Engel</strong> & Völkers Commercial<br />
Brunswick and <strong>Wolfsburg</strong> and 30,000 m² in outlying<br />
areas such as Gifhorn and Salzgitter.<br />
Kaufpreis (Industriegrundstück) in EUR/m²<br />
Purchase price (industrial property) in EUR/m²<br />
Miete (Industriefl äche) in EUR/m²<br />
Rent (industrial space) in EUR/m²<br />
2010 2011 2010 2011<br />
Barsinghausen/Bantorf 44 - 96 44 - 96 3,50 - 4,00 3,50 - 4,00<br />
Wunstorf 29 - 40/50 - 55 29-40/50 - 55 2,50 - 4,00 2,50 - 4,00<br />
Garbsen (West/Ost/Nord) 60 - 80/60 - 100 60 - 80/60 - 100 2,70 - 4,50 2,70 - 4,50<br />
Ronnenberg – Empelde 36 - 70 36 - 70 3,00 - 4,00 3,00 - 4,00<br />
<strong>Hannover</strong> – Schwarze Heide 60 60 3,50 - 4,00 3,50 - 4,20<br />
<strong>Hannover</strong> – Nordhafen/Stöcken 80/130 - 150 80/130 - 150 3,00 - 3,50 3,00 - 3,50<br />
<strong>Hannover</strong> – Lindener Hafen (Erbbau) (Erbbau) 2,00 - 3,20 2,50 - 3,50<br />
Langenhagen – Bayernstraße 120 120 3,00 - 3,80 3,00 - 4,20<br />
Langenhagen – Münchner Straße/Airport Business Park 120 120 4,00 - 5,50 4,00 - 5,50<br />
Langenhagen – Rehkamp 120 120 3,00 - 4,00 3,00 - 4,00<br />
<strong>Hannover</strong> – Businesspark Nord/Alter Flughafen 130 - 300/150 130 - 300/150 2,80 - 4,50 3,00 - 4,50<br />
Mellendorf/Wedemark/Bissendorf 43 - 50 43 - 50 2,00 - 4,00 2,00 - 4,00<br />
Isernhagen HB 70 - 100 70 - 100 2,50 - 3,50 2,50 - 3,50<br />
<strong>Hannover</strong> – Anderten (Lohweg/Hägenstraße) 65 - 90 65 - 90 3,00 - 4,00 3,00 - 4,00<br />
<strong>Hannover</strong>/Laatzen – Messe/EXPO 138 - 169 120 - 170 3,00 - 4,00 3,00 - 4,00<br />
Laatzen – Rethen 40 - 90 40 - 90 3,00 - 4,00 3,00 - 4,00<br />
Sarstedt 43,5 - 45,0 35 - 45 2,00 - 3,50 2,00 - 3,50<br />
Großburgwedel 75 - 100 75 - 100 3,00 - 4,00 3,00 - 4,00<br />
Isernhagen – Kirchhorst 74 - 80 74 - 80 3,00 - 4,00 3,00 - 4,00<br />
Sehnde/Höver 40 - 60 40 - 60 3,00 - 4,50 3,00 - 4,50<br />
Lehrte/Ahlten 48 48 2,50 - 3,50 3,00 - 4,50<br />
Lehrte/GVZ 65 65 3,80 - 4,00 3,80 - 4,50<br />
Lehrte Ost (Everner Straße, Mielestraße) 40 - 50 40 - 50 3,50 - 3,75 3,50 - 3,75<br />
Lehrte – Sievershausen 44 35 - 48 3,00 - 3,50 3,00 - 3,50<br />
Hildesheim 34, 5 - 65 34,5 - 65 2,00 - 4,00 2,00 - 4,00<br />
Celle k. A. 18 - 28 k. A. 2,00 - 3,50<br />
Peine – Nord 48 48 3,00 - 3,50 3,00 - 3,50<br />
Peine – Ost 30 - 55 30 - 55 2,50 - 4,50 2,50 - 4,50<br />
Salzgitter 15 - 20 15 - 20 k. A. 2,50 - 3,50<br />
<strong>Braunschweig</strong> – Hansestraße/Hafen/Waller See 29 38/35 3,00 - 4,50 3,00 - 4,50<br />
<strong>Braunschweig</strong> – Ölper Kreuz 29 - 70 29 - 70 2,70 - 3,50 3,00 - 3,50<br />
<strong>Braunschweig</strong> – Friedrich-Seele-Straße 29 - 70 29 - 70 3,00 - 3,50 3,00 - 3,50<br />
<strong>Braunschweig</strong> – Rüningen 29 - 70 29 - 70 3,00 - 3,50 3,00 - 3,50<br />
Gifhorn k. A. 25 - 30 k. A. 2,50 - 3,75<br />
<strong>Wolfsburg</strong> – GE Hafenstraße/Westrampe 40 - 100 40 - 100 3,00 - 4,50 3,00 - 4,50<br />
<strong>Wolfsburg</strong> – GE Heinenkamp 40 - 100 40 - 100 3,00 - 5,50 3,00 - 5,50<br />
<strong>Wolfsburg</strong> – GE Warmenau 40 - 100 40 - 100 3,00 - 4,50 3,00 - 4,50<br />
<strong>Wolfsburg</strong> – GE Vogelsang/Sudammsbreite 40 - 100 40 - 100 3,00 - 4,50 3,00 - 5,00<br />
Industrie- & Logistikfl ächen Marktreport 2011/2012 • <strong>Hannover</strong> • <strong>Braunschweig</strong> • <strong>Wolfsburg</strong>
Gewerbegebiete Region <strong>Hannover</strong> • <strong>Braunschweig</strong> • <strong>Wolfsburg</strong><br />
Industrial areas in the region Hanover • Brunswick • <strong>Wolfsburg</strong><br />
Mellendorf<br />
12<br />
B3<br />
Wunstorf<br />
2<br />
A2<br />
B6<br />
3<br />
5<br />
Garbsen<br />
Seelze<br />
6<br />
Großburgwedel<br />
13 18<br />
9 10 Isernhagen<br />
Burgdorf<br />
Langenhagen 19<br />
8<br />
11<br />
Lehrte<br />
<strong>Hannover</strong> 22<br />
7<br />
14 21 23<br />
1 B65 4<br />
20<br />
Ronnenberg 15<br />
Barsinghausen<br />
Laatzen<br />
16<br />
B217<br />
© <strong>Engel</strong> & Völkers Commercial<br />
A7<br />
B3<br />
17<br />
Sarstedt<br />
Alfeld (Leine)<br />
25<br />
Hildesheim<br />
26<br />
Celle<br />
<strong>Engel</strong> & Völkers <strong>Hannover</strong> Immobilien GmbH<br />
Lizenzpartner der <strong>Engel</strong> & Völkers Commercial GmbH<br />
Schiffgraben 11 <strong>·</strong> 30159 <strong>Hannover</strong><br />
Tel. +49-(0)511-36 80 20 <strong>·</strong> <strong>Hannover</strong>Commercial@engelvoelkers.com<br />
B1<br />
B6<br />
A7<br />
B188<br />
24<br />
27<br />
Peine<br />
28<br />
B214<br />
A2<br />
Salzgitter 29<br />
A39<br />
B1<br />
30<br />
Gifhorn<br />
34<br />
31<br />
B4<br />
<strong>Braunschweig</strong><br />
32<br />
33<br />
Wolfenbüttel<br />
A395<br />
Wittingen<br />
35<br />
37<br />
36<br />
A39<br />
38<br />
<strong>Wolfsburg</strong><br />
Alle Informationen wurden mit größtmöglicher Sorgfalt recherchiert. Für etwaige Fehler kann jedoch keine Verantwortung übernommen werden. Vervielfältigung nur mit Quellenangabe.<br />
Stand der Informations- und Datenlage: 31. Dezember 2011, Quelle: <strong>Engel</strong> & Völkers. Whilst every eff ort has been made by those concerned to ensure the accuracy of the information in<br />
this document, no responsibility can be taken for errors made. Any copies made must cite the source. Date of information and data: 31 December 2011, Source: <strong>Engel</strong> & Völkers