Utbildning och forskning (pdf) - Statistiska centralbyrån
Utbildning och forskning (pdf) - Statistiska centralbyrån
Utbildning och forskning (pdf) - Statistiska centralbyrån

Create successful ePaper yourself
Turn your PDF publications into a flip-book with our unique Google optimized e-Paper software.
Statistisk årsbok 2011<br />
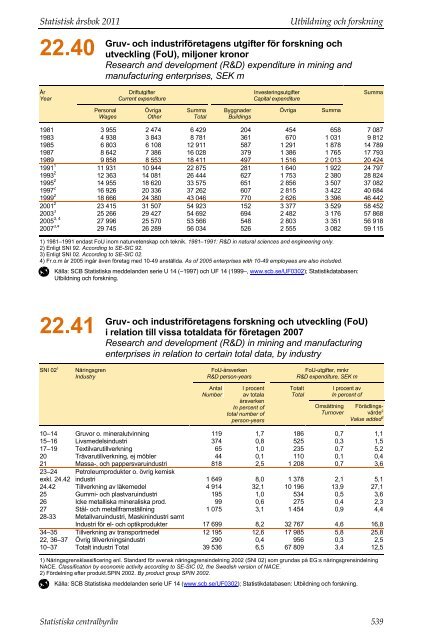
22.40<br />
<strong>Utbildning</strong> <strong>och</strong> <strong>forskning</strong><br />
Gruv- <strong>och</strong> industriföretagens utgifter för <strong>forskning</strong> <strong>och</strong><br />
utveckling (FoU), miljoner kronor<br />
Research and development (R&D) expenditure in mining and<br />
manufacturing enterprises, SEK m<br />
År<br />
Year<br />
Driftutgifter<br />
Current expenditure<br />
Investeringsutgifter<br />
Capital expenditure<br />
Summa<br />
Personal<br />
Wages<br />
Övriga<br />
Other<br />
Summa<br />
Total<br />
Byggnader<br />
Buildings<br />
Övriga<br />
Summa<br />
1981 3 955 2 474 6 429 204 454 658 7 087<br />
1983 4 938 3 843 8 781 361 670 1 031 9 812<br />
1985 6 803 6 108 12 911 587 1 291 1 878 14 789<br />
1987 8 642 7 386 16 028 379 1 386 1 765 17 793<br />
1989 9 858 8 553 18 411 497 1 516 2 013 20 424<br />
1991 1 11 931 10 944 22 875 281 1 640 1 922 24 797<br />
1993 2 12 363 14 081 26 444 627 1 753 2 380 28 824<br />
1995 2 14 955 18 620 33 575 651 2 856 3 507 37 082<br />
1997 2 16 926 20 336 37 262 607 2 815 3 422 40 684<br />
1999 2 18 666 24 380 43 046 770 2 626 3 396 46 442<br />
2001 2 23 415 31 507 54 923 152 3 377 3 529 58 452<br />
2003 3 25 266 29 427 54 692 694 2 482 3 176 57 868<br />
2005 3, 4 27 996 25 570 53 566 548 2 803 3 351 56 918<br />
2007 3,4 29 745 26 289 56 034 526 2 555 3 082 59 115<br />
1) 1981–1991 endast FoU inom naturvetenskap <strong>och</strong> teknik. 1981–1991: R&D in natural sciences and engineering only.<br />
2) Enligt SNI 92. According to SE-SIC 92.<br />
3) Enligt SNI 02. According to SE-SIC 02.<br />
4) Fr.o.m år 2005 ingår även företag med 10-49 anställda. As of 2005 enterprises with 10-49 employees are also included.<br />
Källa: SCB <strong>Statistiska</strong> meddelanden serie U 14 (–1997) <strong>och</strong> UF 14 (1999–, www.scb.se/UF0302); Statistikdatabasen:<br />
<strong>Utbildning</strong> <strong>och</strong> <strong>forskning</strong>.<br />
22.41<br />
Gruv- <strong>och</strong> industriföretagens <strong>forskning</strong> <strong>och</strong> utveckling (FoU)<br />
i relation till vissa totaldata för företagen 2007<br />
Research and development (R&D) in mining and manufacturing<br />
enterprises in relation to certain total data, by industry<br />
SNI 02 1<br />
Näringsgren<br />
Industry<br />
FoU-årsverken<br />
R&D person-years<br />
FoU-utgifter, mnkr<br />
R&D expenditure, SEK m<br />
Antal<br />
Number<br />
I procent<br />
av totala<br />
årsverken<br />
In percent of<br />
total number of<br />
person-years<br />
Totalt<br />
Total<br />
I procent av<br />
In percent of<br />
Omsättning<br />
Turnover<br />
Förädlingsvärde<br />
2<br />
Value added 2<br />
10–14 Gruvor o. mineralutvinning 119 1,7 186 0,7 1,1<br />
15–16 Livsmedelsindustri 374 0,8 525 0,3 1,5<br />
17–19 Textilvarutillverkning 65 1,0 235 0,7 5,2<br />
20 Trävarutillverkning, ej möbler 44 0,1 110 0,1 0,4<br />
21 Massa-, <strong>och</strong> pappersvaruindustri 818 2,5 1 208 0,7 3,6<br />
23–24 Petroleumprodukter o. övrig kemisk<br />
exkl. 24.42 industri 1 649 8,0 1 378 2,1 5,1<br />
24.42 Tillverkning av läkemedel 4 914 32,1 10 196 13,9 27,1<br />
25 Gummi- <strong>och</strong> plastvaruindustri 195 1,0 534 0,5 3,6<br />
26 Icke metalliska mineraliska prod. 99 0,6 275 0,4 2,3<br />
27 Stål- <strong>och</strong> metallframställning 1 075 3,1 1 454 0,9 4,4<br />
28-33 Metallvaruindustri, Maskinindustri samt<br />
Industri för el- <strong>och</strong> optikprodukter 17 699 8,2 32 767 4,6 16,8<br />
34–35 Tillverkning av transportmedel 12 195 12,6 17 985 5,8 25,8<br />
22, 36–37 Övrig tillverkningsindustri 290 0,4 956 0,3 2,5<br />
10–37 Totalt industri Total 39 536 6,5 67 809 3,4 12,5<br />
1) Näringsgrensklassificering enl. Standard för svensk näringsgrensindelning 2002 (SNI 02) som grundas på EG:s näringsgrensindelning<br />
NACE. Classification by economic activity according to SE-SIC 02, the Swedish version of NACE.<br />
2) Fördelning efter produkt.SPIN 2002. By product group SPIN 2002.<br />
Källa: SCB <strong>Statistiska</strong> meddelanden serie UF 14 (www.scb.se/UF0302); Statistikdatabasen: <strong>Utbildning</strong> <strong>och</strong> <strong>forskning</strong>.<br />
<strong>Statistiska</strong> centralbyrån 539