SRI-Teknisk rapport-sen.v13 - DPU
SRI-Teknisk rapport-sen.v13 - DPU
SRI-Teknisk rapport-sen.v13 - DPU

You also want an ePaper? Increase the reach of your titles
YUMPU automatically turns print PDFs into web optimized ePapers that Google loves.
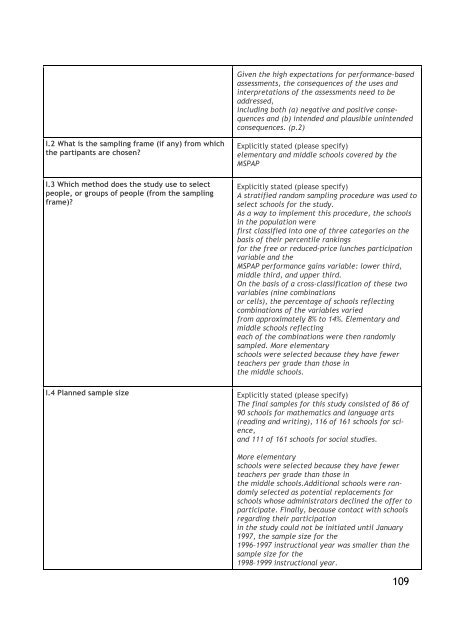
I.2 What is the sampling frame (if any) from which<br />
the partipants are cho<strong>sen</strong>?<br />
I.3 Which method does the study use to select<br />
people, or groups of people (from the sampling<br />
frame)?<br />
Given the high expectations for performance-based<br />
assessments, the consequences of the uses and<br />
interpretations of the assessments need to be<br />
addressed,<br />
including both (a) negative and positive consequences<br />
and (b) intended and plausible unintended<br />
consequences. (p.2)<br />
Explicitly stated (please specify)<br />
elementary and middle schools covered by the<br />
MSPAP<br />
Explicitly stated (please specify)<br />
A stratified random sampling procedure was used to<br />
select schools for the study.<br />
As a way to implement this procedure, the schools<br />
in the population were<br />
first classified into one of three categories on the<br />
basis of their percentile rankings<br />
for the free or reduced-price lunches participation<br />
variable and the<br />
MSPAP performance gains variable: lower third,<br />
middle third, and upper third.<br />
On the basis of a cross-classification of these two<br />
variables (nine combinations<br />
or cells), the percentage of schools reflecting<br />
combinations of the variables varied<br />
from approximately 8% to 14%. Elementary and<br />
middle schools reflecting<br />
each of the combinations were then randomly<br />
sampled. More elementary<br />
schools were selected because they have fewer<br />
teachers per grade than those in<br />
the middle schools.<br />
I.4 Planned sample size Explicitly stated (please specify)<br />
The final samples for this study consisted of 86 of<br />
90 schools for mathematics and language arts<br />
(reading and writing), 116 of 161 schools for science,<br />
and 111 of 161 schools for social studies.<br />
More elementary<br />
schools were selected because they have fewer<br />
teachers per grade than those in<br />
the middle schools.Additional schools were randomly<br />
selected as potential replacements for<br />
schools whose administrators declined the offer to<br />
participate. Finally, because contact with schools<br />
regarding their participation<br />
in the study could not be initiated until January<br />
1997, the sample size for the<br />
1996–1997 instructional year was smaller than the<br />
sample size for the<br />
1998–1999 instructional year.<br />
109